1.3 Data Collection and Observational Studies

Does aspirin reduce the risk of heart attacks? Is one brand of fertilizer more effective at growing roses than another? Is fatigue as dangerous to a driver as the influence of alcohol? When we are interested in the effect one variable may have on another, we call the first variable the explanatory variable and the second the response variable. Questions like these are answered using studies and experiments. Proper study design ensures the production of reliable, accurate data.
Data Collection Methods
There are many ways data is commonly collected, each with their own pros and cons. Some ways data may be collected are:
The latter two options are more commonly accepted, but we will briefly describe the former first.
Anecdotal Evidence
Consider the following possible responses to the these research questions:
- I met two students who took more than 7 years to graduate from Duke, so it must take longer to graduate at Duke than at many other colleges.
- A man on the news had an adverse reaction to a vaccine, so it must be dangerous.
- My friend’s dad had a heart attack and died after they gave him a new heart disease drug, so the drug must not work.
Each conclusion is technically based on data, however, there are two problems. First, the data only represent one or two cases. Second, and more importantly, it is unclear whether these cases are actually representative of the population. Data collected in this haphazard fashion are called anecdotal evidence. While such evidence may be true and verifiable, be careful of data collected in this way since it may only represent extraordinary or unusual cases. Often we are more likely to recall cases relying on anecdotal evidence based on their striking characteristics. For instance, in case #2 above, we are more likely to remember the two people we met who took 7 years to graduate than the six others who graduated in four years. Instead of looking at the most unusual cases, we should examine a sample of many cases that represent the population.
Observational Studies
Researchers perform an observational study when they collect data in a way that does not directly interfere with how the data arise. For instance, researchers may collect information via a questionnaire or survey, review medical or company records, or follow a group of many similar individuals to form hypotheses about why certain diseases might develop. In each of these situations, researchers merely observe the data that arise. In general, observational studies can provide evidence of naturally occurring associations between variables, but they cannot by themselves show a causal connection. Why not? Consider the following example:
Suppose an observational study tracked sunscreen use and skin cancer, and it was found that the more sunscreen someone used, the more likely the person was to have skin cancer. Does this mean sunscreen causes skin cancer? Some previous research tells us that using sunscreen actually reduces skin cancer risk, so maybe there is another variable that can explain this hypothetical association between sunscreen usage and skin cancer? One important piece of information that is absent may be sun exposure.
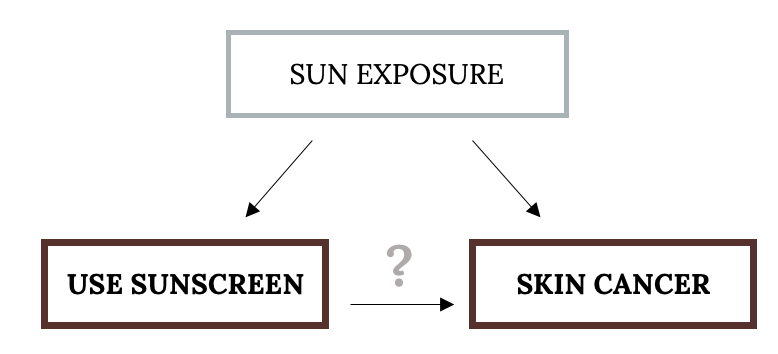
Exposure to the sun is unaccounted for in this simple investigation since it stands to reason if someone is out in the sun all day, she is more likely to use sunscreen but also more likely to get skin cancer. Sun exposure here is an example of what we might call a confounding (lurking, conditional) variable, a variable that was not accounted for and may actually be important. Confounding variables can cause many misleading, counterintuitive or even humorous (spurious) correlations.
Observational studies come in two forms: prospective and retrospective studies. A prospective study identifies individuals and collects information as events unfold. For instance, medical researchers may identify and follow a group of patients over many years to assess the possible influences of behavior on cancer risk. One example of such a study is The Nurses’ Health Study, started in 1976 and expanded in 1989. This prospective study recruits registered nurses and then collects data from them using questionnaires. Retrospective studies collect data after events have taken place, e.g. researchers may review past events in medical records. Some data sets may contain both prospectively- and retrospectively-collected variables.
There are other classifications of observational studies you may encounter, especially in life science and medical contexts: A cohort study is when we follow a group of many similar individuals over time often producing longitudinal data. A cross-sectional study indicates data collection on a population at one point in time (often prospective). A case-control study compares a group that has a certain characteristic to a group that does not, often a retrospective study for rare conditions.
Example
A researcher is studying the relationship between time spent studying in med school and depression rates among students. The researcher looks at graduated students’ medical records to determine if they have ever seen a psychologist. He also sends out a questionnaire to the same students to ask how much time they spent studying in college. Identify which type of study this is.
Your turn!
Image References
The independent variable in an experiment; the value controlled by researchers
The dependent variable in an experiment; the value that is measured for change at the end of an experiment
Actual values (numbers or words) that are collected from the variables of interest
Evidence that is based on personal testimony and collected informally
Data collection where no variables are manipulated
Data collection where variables are manipulated in a controlled setting
A relationship between variables
A variable that has an effect on a study even though it is neither an explanatory variable nor a response variable
Collecting information as events unfold
Collecting or using data after events have taken place
Longitudinal study where a group of people (typically having a common factor) are studied and data is collected for a purpose
Collecting data multiple times on the same individuals, usually at fixed increments, over a period of time
Data collection on a population at one point in time (often prospective)
A study that compares a group that has a certain characteristic to a group that does not, often a retrospective study for rare conditions
