3.2 Visualizing Probabilities
Sometimes, when the probability problems are complex, it can be helpful to visualize the situation. Contingency tables, tree diagrams and Venn diagrams are some tools that can help us visualize and solve conditional probabilities.
Contingency Tables
A contingency table provides a way of portraying data that can facilitate calculating probabilities. The table helps in determining conditional probabilities quite easily. The table displays sample values in relation to two different variables that may be dependent or contingent on one another. Later on, we will use contingency tables again, but in another manner.
Example
Suppose a study of speeding violations and drivers who use cell phones produced the following fictional data:
| Speeding violation in the last year | No speeding violation in the last year | Total | |
|---|---|---|---|
| Uses cell phone while driving | 25 | 280 | 305 |
| Does not use cell phone while driving | 45 | 405 | 450 |
| Total | 70 | 685 | 755 |
The total number of people in the sample is 755. The row totals are 305 and 450. The column totals are 70 and 685. Notice that 305 + 450 = 755 and 70 + 685 = 755.
Calculate the following probabilities using the table.
a. Find P (Driver is a cell phone user).
b. Find P (driver had no violation in the last year).
c. Find P (Driver had no violation in the last year AND was a cell phone user).
d. Find P (Driver is a cell phone user OR driver had no violation in the last year).
e. Find P (Driver is a cell phone user GIVEN driver had a violation in the last year).
f. Find P (Driver had no violation last year GIVEN driver was not a cell phone user)
Example
The figure below contains the number of crimes per 100,000 inhabitants from 2008 to 2011 in the U.S.
| Year | Robbery | Burglary | Rape | Vehicle | Total |
|---|---|---|---|---|---|
| 2008 | 145.7 | 732.1 | 29.7 | 314.7 | |
| 2009 | 133.1 | 717.7 | 29.1 | 259.2 | |
| 2010 | 119.3 | 701 | 27.7 | 239.1 | |
| 2011 | 113.7 | 702.2 | 26.8 | 229.6 | |
| Total |
TOTAL each column and each row. Total data = 4,520.7
- Find P (2009 AND Robbery).
- Find P (2010 AND Burglary).
- Find P (2010 OR Burglary).
- Find P (2011|Rape).
- Find P (Vehicle|2008).
Your turn!
The following figure shows the number of athletes who stretch before exercising and how many had injuries within the past year.
| Injury in last year | No injury in last year | Total | |
|---|---|---|---|
| Stretches | 55 | 295 | 350 |
| Does not stretch | 231 | 219 | 450 |
| Total | 286 | 514 | 800 |
- What is P (athlete stretches before exercising)?
- What is P (athlete stretches before exercising|no injury in the last year)?
Tree Diagrams
A tree diagram is a special type of graph used to determine the outcomes of an experiment. It consists of “branches” that are labeled with either frequencies or probabilities. Tree diagrams can make some sample spaces easier to visualize. The following example illustrates how to use a tree diagram.
Example
In an urn, there are 11 balls. Three balls are red (R) and eight balls are blue (B). Draw two balls, one at a time, with replacement. “With replacement” means that you put the first ball back in the urn before you select the second ball. The tree diagram using frequencies that show all the possible outcomes follows.
![A tree diagram broken into 4 parts reading left to right: First Draw (Red 3/11, Blue 8/11), Second Draw (Blue 8/11, Red 3/11, Blue 8/11, Red 3/11), Outcomes ([Blue, Blue], [Blue, Red], [Red, Blue], [Red, Red]), and Probabilities (64/121, 24/121, 24/121, 9/121).](https://pressbooks.lib.vt.edu/app/uploads/sites/12/2020/12/3.6-idea.png)
The first set of branches represents the first draw. The second set of branches represents the second draw. Each of the outcomes is distinct. In fact, we can list each red ball as R1, R2, and R3 and each blue ball as B1, B2, B3, B4, B5, B6, B7, and B8. Then the nine RR outcomes can be written as:
R1R1, R1R2, R1R3, R2R1, R2R2, R2R3, R3R1, R3R2, R3R3
The other outcomes are similar.
There are a total of 11 balls in the urn. Draw two balls, one at a time, with replacement. There are 11(11) = 121 outcomes, the size of the sample space.
a. List the 24 BR outcomes: B1R1, B1R2, B1R3, …
b. Using the tree diagram, calculate P(RR).
c. Using the tree diagram, calculate P(RB OR BR).
d. Using the tree diagram, calculate P(R on 1st draw AND B on 2nd draw).
e. Using the tree diagram, calculate P(R on 2nd draw GIVEN B on 1st draw).
f. Using the tree diagram, calculate P(BB).
g. Using the tree diagram, calculate P(B on the 2nd draw given R on the first draw).
Your turn!
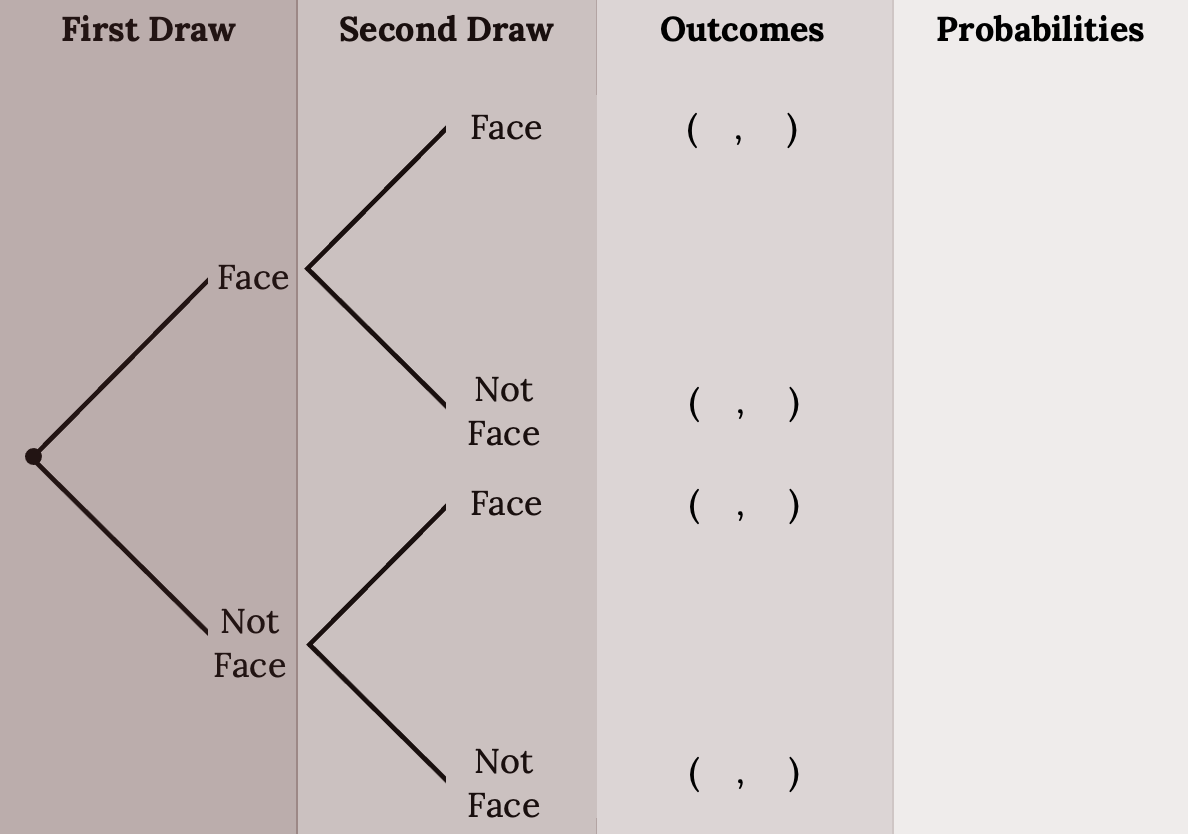
In a standard deck, there are 52 cards. 12 cards are face cards (event F) and 40 cards are not face cards (event N). Draw two cards, one at a time, with replacement. All possible outcomes are shown in the tree diagram as frequencies. Using the tree diagram, calculate P(FF).
Venn Diagram
A Venn diagram is a picture that represents the outcomes of an experiment. It generally consists of a box that represents the sample space (S) together with circles or ovals. The circles or ovals represent events. It can often help us visualize relationships between events and compound events. We can visualize the entire rectangle as the Sample Space and areas in the circles as corresponding to probabilities.
Example
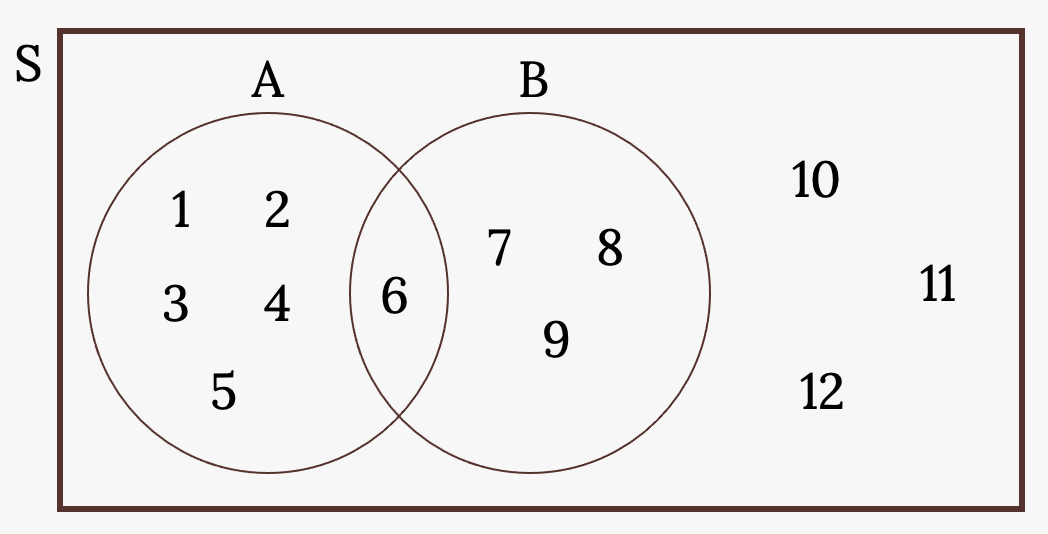
Suppose an experiment has the outcomes 1, 2, 3, … , 12 where each outcome has an equal chance of occurring. Let event A = {1, 2, 3, 4, 5, 6} and event B = {6, 7, 8, 9}. Then A AND B = {6} and A OR B = {1, 2, 3, 4, 5, 6, 7, 8, 9}. The Venn diagram is as follows:
Example
Forty percent of the students at a local college belong to a club and 50% work part time. Five percent of the students work part time and belong to a club. Draw a Venn diagram showing the relationships. Let C = student belongs to a club and PT = student works part time.
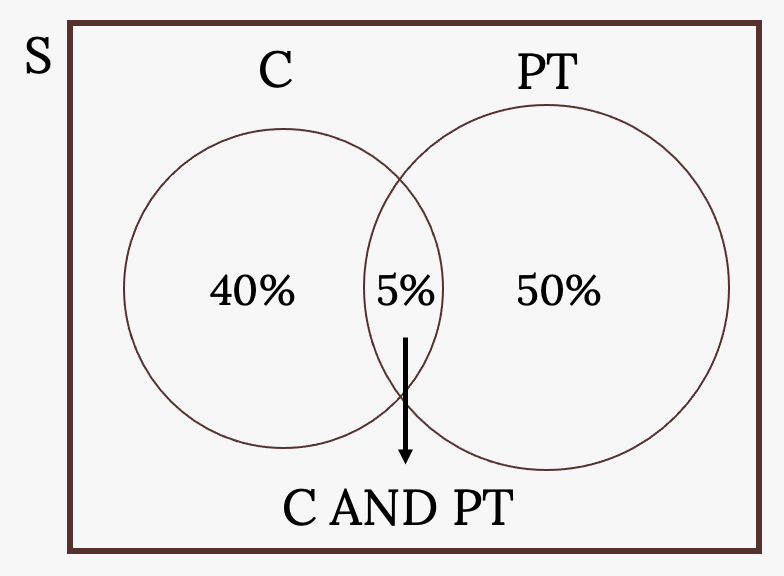
If a student is selected at random, find
- the probability that the student belongs to a club. P(C) = 0.40
- the probability that the student works part time. P(PT) = 0.50
- the probability that the student belongs to a club AND works part time. P(C AND PT) = 0.05
- the probability that the student belongs to a club given that the student works part time. P(C|PT) =
 =
=  = 0.1
= 0.1 - the probability that the student belongs to a club OR works part time. P(C OR PT) = P(C) + P(PT) – P(C AND PT) = 0.40 + 0.50 – 0.05 = 0.85
Your turn!
Suppose an experiment has outcomes black, white, red, orange, yellow, green, blue, and purple, where each outcome has an equal chance of occurring. Let event C = {green, blue, purple} and event P = {red, yellow, blue}. Then C AND P = {blue} and C OR P = {green, blue, purple, red, yellow}. Draw a Venn diagram representing this situation.
Image References
Figure 3.6: Kindred Grey (2020). “Figure 3.6 idea.” CC BY-SA 4.0. Retrieved from https://commons.wikimedia.org/wiki/File:Figure_3.6_idea.png
Figure 3.7: Kindred Grey (2020). “Figure 3.7 idea.” CC BY-SA 4.0. Retrieved from https://commons.wikimedia.org/wiki/File:Figure_3.7_idea.png
Figure 3.8: Kindred Grey (2020). “Figure 3.8.” CC BY-SA 4.0. Retrieved from https://commons.wikimedia.org/wiki/File:Figure_3.8.png
Figure 3.9: Kindred Grey (2020). “Figure 3.9.” CC BY-SA 4.0. Retrieved from https://commons.wikimedia.org/wiki/File:Figure_3.9.png
A table in a matrix format that displays the frequency distribution of different variables
Diagram that helps calculate and organize the number of possible outcomes of an event or problem
A diagram that shows all possible relations between a collection of different sets
