Chapter 3 Wrap Up
Concept Check
Section Reviews
3.1 Introduction
Two events A and B are independent if the knowledge that one occurred does not affect the chance the other occurs. If two events are not independent, then we say that they are dependent.
In sampling with replacement, each member of a population is replaced after it is picked, so that member has the possibility of being chosen more than once, and the events are considered to be independent. In sampling without replacement, each member of a population may be chosen only once, and the events are considered not to be independent. When events do not share outcomes, they are mutually exclusive of each other.
If A and B are independent, P(A AND B) = P(A)P(B), P(A|B) = P(A) and P(B|A) = P(B).
If A and B are mutually exclusive, P(A OR B) = P(A) + P(B) and P(A AND B) = 0.
In this module we learned the basic terminology of probability. The set of all possible outcomes of an experiment is called the sample space. Events are subsets of the sample space, and they are assigned a probability that is a number between zero and one, inclusive.
A and B are events
P(S) = 1 where S is the sample space
0 ≤ P(A) ≤ 1
P(A|B) = 
3.2 Visualizing Probabilities
There are several tools you can use to help organize and sort data when calculating probabilities. Contingency tables help display data and are particularly useful when calculating probabilities that have multiple dependent variables.
A tree diagram use branches to show the different outcomes of experiments and makes complex probability questions easy to visualize.
A Venn diagram is a picture that represents the outcomes of an experiment. It generally consists of a box that represents the sample space S together with circles or ovals. The circles or ovals represent events. A Venn diagram is especially helpful for visualizing the OR event, the AND event, and the complement of an event and for understanding conditional probabilities.
3.3 Compound Events
The multiplication rule and the addition rule are used for computing the probability of A and B, as well as the probability of A or B for two given events A, B defined on the sample space. In sampling with replacement each member of a population is replaced after it is picked, so that member has the possibility of being chosen more than once, and the events are considered to be independent. In sampling without replacement, each member of a population may be chosen only once, and the events are considered to be not independent. The events A and B are mutually exclusive events when they do not have any outcomes in common.
The multiplication rule: P(A AND B) = P(A|B)P(B)
The addition rule: P(A OR B) = P(A) + P(B) – P(A AND B)
Key Terms
Try to define the terms below on your own. Scroll over any term to check your response!
3.1 Introduction
- Probability
- Probability experiment
- Outcome
- Sample space
- Event
- Probability model
- Law of large numbers
- Mutually exclusive
- Independent
- Complement
- Intersection
- Conditional probability
3.2 Visualizing Probabilities
3.3 Compound Events
Extra Practice
3.1 Introduction
1. You have a fair, well-shuffled deck of 52 cards. It consists of four suits. The suits are clubs, diamonds, hearts and spades. There are 13 cards in each suit consisting of 1, 2, 3, 4, 5, 6, 7, 8, 9, 10, J (jack), Q (queen), K (king) of that suit. Three cards are picked at random.
- Suppose you know that the picked cards are Q of spades, K of hearts and Q of spades. Can you decide if the sampling was with or without replacement?
- Suppose you know that the picked cards are Q of spades, K of hearts, and J of spades. Can you decide if the sampling was with or without replacement?
2. You have a fair, well-shuffled deck of 52 cards. It consists of four suits. The suits are clubs, diamonds, hearts, and spades. There are 13 cards in each suit consisting of 1, 2, 3, 4, 5, 6, 7, 8, 9, 10, J (jack), Q (queen), and K (king) of that suit. S = spades, H = Hearts, D = Diamonds, C = Clubs.
- Suppose you pick four cards, but do not put any cards back into the deck. Your cards are QS, 1D, 1C, QD.
- Suppose you pick four cards and put each card back before you pick the next card. Your cards are KH, 7D, 6D, KH.
Which of a. or b. did you sample with replacement and which did you sample without replacement?
3. You have a fair, well-shuffled deck of 52 cards. It consists of four suits. The suits are clubs, diamonds, hearts, and spades. There are 13 cards in each suit consisting of 1, 2, 3, 4, 5, 6, 7, 8, 9, 10, J (jack), Q (queen), and K (king) of that suit. S = spades, H = Hearts, D = Diamonds, C = Clubs. Suppose that you sample four cards without replacement. Which of the following outcomes are possible? Answer the same question for sampling with replacement.
4. Flip two fair coins. The sample space is {HH, HT, TH, TT} where T = tails and H = heads. The outcomes are HH, HT, TH, and TT. The outcomes HT and TH are different. The HT means that the first coin showed heads and the second coin showed tails. The TH means that the first coin showed tails and the second coin showed heads.
- Let A = the event of getting at most one tail. (At most one tail means zero or one tail.) Then A can be written as {HH, HT, TH}. The outcome HH shows zero tails. HT and TH each show one tail.
- Let B = the event of getting all tails. B can be written as {TT}. B is the complement of A, so B = A′. Also, P(A) + P(B) = P(A) + P(A′) = 1.
- The probabilities for A and for B are P(A) =
 and P(B) =
  .
. - Let C = the event of getting all heads. C = {HH}. Since B = {TT}, P(B AND C) = 0. B and C are mutually exclusive. (B and C have no members in common because you cannot have all tails and all heads at the same time.)
- Let D = event of getting more than one tail. D = {TT}. P(D) =
- Let E = event of getting a head on the first roll. (This implies you can get either a head or tail on the second roll.) E = {HT, HH}. P(E) =

- Find the probability of getting at least one (one or two) tail in two flips. Let F = event of getting at least one tail in two flips. F = {HT, TH, TT}. P(F) =
5. Draw two cards from a standard 52-card deck with replacement. Find the probability of getting at least one black card.
6. Roll one fair, six-sided die. The sample space is {1, 2, 3, 4, 5, 6}. Let event A = a face is odd. Then A = {1, 3, 5}. Let event B = a face is even. Then B = {2, 4, 6}.
- Find the complement of A, A′. The complement of A, A′, is B because A and B together make up the sample space. P(A) + P(B) = P(A) + P(A′) = 1. Also, P(A) =
 and P(B) = .
 - Let event C = odd faces larger than two. Then C = {3, 5}. Let event D = all even faces smaller than five. Then D = {2, 4}. P(C AND D) = 0 because you cannot have an odd and even face at the same time. Therefore, C and D are mutually exclusive events.
- Let event E = all faces less than five. E = {1, 2, 3, 4}.
Are C and E mutually exclusive events? (Answer yes or no.) Why or why not?
No. C = {3, 5} and E = {1, 2, 3, 4}. P(C AND E) = . To be mutually exclusive, P(C AND E) must be zero.
- Find P(C|A). This is a conditional probability. Recall that the event C is {3, 5} and event A is {1, 3, 5}. To find P(C|A), find the probability of C using the sample space A. You have reduced the sample space from the original sample space {1, 2, 3, 4, 5, 6} to {1, 3, 5}. So, P(C|A) =

7. Let event A = learning Spanish. Let event B = learning German. Then A AND B = learning Spanish and German. Suppose P(A) = 0.4 and P(B) = 0.2. P(A AND B) = 0.08. Are events A and B independent? Hint: You must show ONE of the following:
- P(A|B) = P(A)
- P(B|A) = P(B)
- P(A AND B) = P(A)P(B)
P(A|B) = 
The events are independent because P(A|B) = P(A).
8. Let event G = taking a math class. Let event H = taking a science class. Then, G AND H = taking a math class and a science class. Suppose P(G) = 0.6, P(H) = 0.5, and P(G AND H) = 0.3. Are G and H independent?
If G and H are independent, then you must show ONE of the following:
- P(G|H) = P(G)
- P(H|G) = P(H)
- P(G AND H) = P(G)P(H)
a. Show that P(G|H) = P(G).
P(G|H) =  = 0.6 = P(G)
b. Show P(G AND H) = P(G)P(H).
P(G)P(H) = (0.6)(0.5) = 0.3 = P(G AND H)
Since G and H are independent, knowing that a person is taking a science class does not change the chance that he or she is taking a math class. If the two events had not been independent (that is, they are dependent) then knowing that a person is taking a science class would change the chance he or she is taking math. For practice, show that P(H|G) = P(H) to show that G and H are independent events.
9. In a bag, there are six red marbles and four green marbles. The red marbles are marked with the numbers 1, 2, 3, 4, 5, and 6. The green marbles are marked with the numbers 1, 2, 3, and 4.
- R = a red marble
- G = a green marble
- O = an odd-numbered marble
- The sample space is S = {R1, R2, R3, R4, R5, R6, G1, G2, G3, G4}.
S has ten outcomes. What is P(G AND O)?
10. A student goes to the library. Let events B = the student checks out a book and D = the student checks out a DVD. Suppose that P(B) = 0.40, P(D) = 0.30 and P(B AND D) = 0.20.
- Find P(B|D).
- Find P(D|B).
- Are B and D independent?
- Are B and D mutually exclusive?
11. In a box there are three red cards and five blue cards. The red cards are marked with the numbers 1, 2, and 3, and the blue cards are marked with the numbers 1, 2, 3, 4, and 5. The cards are well-shuffled. You reach into the box (you cannot see into it) and draw one card.
Let R = red card is drawn, B = blue card is drawn, E = even-numbered card is drawn.
The sample space S = R1, R2, R3, B1, B2, B3, B4, B5. S has eight outcomes.
- P(R) =
 . P(B) =
  . P(R AND B) = 0. (You cannot draw one card that is both red and blue.)
 - P(E) = . (There are three even-numbered cards, R2, B2, and B4.)
- P(E|B) =
 . (There are five blue cards: B1, B2, B3, B4, and B5. Out of the blue cards, there are two even cards; B2 and B4.)
 - P(B|E) = . (There are three even-numbered cards: R2, B2, and B4. Out of the even-numbered cards, to are blue; B2 and B4.)
- The events R and B are mutually exclusive because P(R AND B) = 0.
- Let G = card with a number greater than 3. G = {B4, B5}. P(G) =
 . Let H = blue card numbered between one and four, inclusive. H = {B1, B2, B3, B4}. P(G|H) = . (The only card in H that has a number greater than three is B4.) Since = , P(G) = P(G|H), which means that G and H are independent.
12. In a basketball arena,
- 70% of the fans are rooting for the home team.
- 25% of the fans are wearing blue.
- 20% of the fans are wearing blue and are rooting for the away team.
- Of the fans rooting for the away team, 67% are wearing blue.
Let A be the event that a fan is rooting for the away team.
Let B be the event that a fan is wearing blue.
Are the events of rooting for the away team and wearing blue independent? Are they mutually exclusive?
13. In a particular college class, 60% of the students are female. Fifty percent of all students in the class have long hair. Forty-five percent of the students are female and have long hair. Of the female students, 75% have long hair. Let F be the event that a student is female. Let L be the event that a student has long hair. One student is picked randomly. Are the events of being female and having long hair independent?
- The following probabilities are given in this example:
- P(F) = 0.60; P(L) = 0.50
- P(F AND L) = 0.45
- P(L|F) = 0.75
NOTE: The choice you make depends on the information you have. You could use the first or last condition on the list for this example. You do not know P(F|L) yet, so you cannot use the second condition.
Solution 1 Check whether P(F AND L) = P(F)P(L). We are given that P(F AND L) = 0.45, but P(F)P(L) = (0.60)(0.50) = 0.30. The events of being female and having long hair are not independent because P(F AND L) does not equal P(F)P(L).
Solution 2 Check whether P(L|F) equals P(L). We are given that P(L|F) = 0.75, but P(L) = 0.50; they are not equal. The events of being female and having long hair are not independent.
Interpretation of ResultsThe events of being female and having long hair are not independent; knowing that a student is female changes the probability that a student has long hair.
14. Mark is deciding which route to take to work. His choices are I = the Interstate and F = Fifth Street.
- P(I) = 0.44 and P(F) = 0.56
- P(I AND F) = 0 because Mark will take only one route to work.
What is the probability of P(I OR F)?
15. Fill in the blanks to the following questions.
- Toss one fair coin (the coin has two sides, H and T). The outcomes are ________. Count the outcomes. There are ____ outcomes.
- Toss one fair, six-sided die (the die has 1, 2, 3, 4, 5 or 6 dots on a side). The outcomes are ________________. Count the outcomes. There are ___ outcomes.
- Multiply the two numbers of outcomes. The answer is _______.
- If you flip one fair coin and follow it with the toss of one fair, six-sided die, the answer in part c. is the number of outcomes (size of the sample space). What are the outcomes? (Hint: Two of the outcomes are H1 and T6.)
- Event A = heads (H) on the coin followed by an even number (2, 4, 6) on the die.
A = {_________________}. Find P(A). - Event B = heads on the coin followed by a three on the die. B = {________}. Find P(B).
- Are A and B mutually exclusive? (Hint: What is P(A AND B)? If P(A AND B) = 0, then A and B are mutually exclusive.)
- Are A and B independent? (Hint: Is P(A AND B) = P(A)P(B)? If P(A AND B) = P(A)P(B), then A and B are independent. If not, then they are dependent).
- H and T; 2
- 1, 2, 3, 4, 5, 6; 6
- 2(6) = 12
- T1, T2, T3, T4, T5, T6, H1, H2, H3, H4, H5, H6
- A = {H2, H4, H6}; P(A) =

- B = {H3}; P(B) =

- Yes, because P(A AND B) = 0
- P(A AND B) = 0.P(A)P(B) =
 . P(A AND B) does not equal P(A)P(B), so A and B are dependent.
16. A box has two balls, one white and one red. We select one ball, put it back in the box, and select a second ball (sampling with replacement). Let T be the event of getting the white ball twice, F the event of picking the white ball first, S the event of picking the white ball in the second drawing.
- Compute P(T).
- Compute P(T|F).
- Are T and F independent?.
- Are F and S mutually exclusive?
- Are F and S independent?
17. E and F are mutually exclusive events. P(E) = 0.4; P(F) = 0.5. Find P(E∣F).
18. J and K are independent events. P(J|K) = 0.3. Find P(J).
- P(J) = 0.3
19. U and V are mutually exclusive events. P(U) = 0.26; P(V) = 0.37. Find:
- P(U AND V) =
- P(U|V) =
- P(U OR V) =
20. Q and R are independent events. P(Q) = 0.4 and P(Q AND R) = 0.1. Find P(R).
- P(Q AND R) = P(Q)P(R)
- 0.1 = (0.4)P(R)
- P(R) = 0.25
21. The graph shown is based on more than 170,000 interviews done by Gallup that took place from January through December 2012. The sample consists of employed Americans 18 years of age or older. The Emotional Health Index Scores are the sample space. We randomly sample one Emotional Health Index Score.
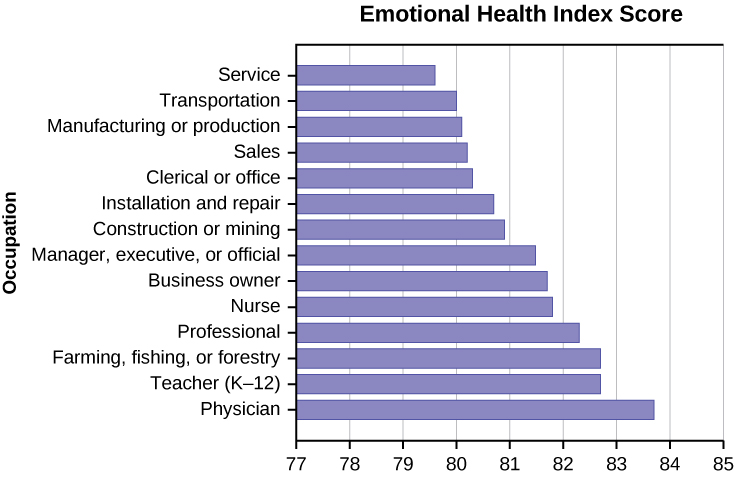
a. Find the probability that an Emotional Health Index Score is 82.7.
b. Find the probability that an Emotional Health Index Score is 81.0.
- 0
c. Find the probability that an Emotional Health Index Score is more than 81?
d. Find the probability that an Emotional Health Index Score is between 80.5 and 82?
- 0.3571
e. If we know an Emotional Health Index Score is 81.5 or more, what is the probability that it is 82.7?
f. What is the probability that an Emotional Health Index Score is 80.7 or 82.7?
- 0.2142
g. What is the probability that an Emotional Health Index Score is less than 80.2 given that it is already less than 81?
h. What occupation has the highest emotional index score?
- Physician (83.7)
i. What occupation has the lowest emotional index score?
j. What is the range of the data?
- 83.7 − 79.6 = 4.1
k. Compute the average EHIS.
l. If all occupations are equally likely for a certain individual, what is the probability that he or she will have an occupation with lower than average EHIS?
- P(Occupation < 81.3) = 0.5
22. A previous year, the weights of the members of the San Francisco 49ers and the Dallas Cowboys were published in the San Jose Mercury News. The factual data are compiled into the figure below. [1]
| Shirt# | ≤ 210 | 211–250 | 251–290 | 290≤ |
|---|---|---|---|---|
| 1–33 | 21 | 5 | 0 | 0 |
| 34–66 | 6 | 18 | 7 | 4 |
| 66–99 | 6 | 12 | 22 | 5 |
For the following, suppose that you randomly select one player from the 49ers or Cowboys.
If having a shirt number from one to 33 and weighing at most 210 pounds were independent events, then what should be true about P(Shirt# 1–33|≤ 210 pounds)?
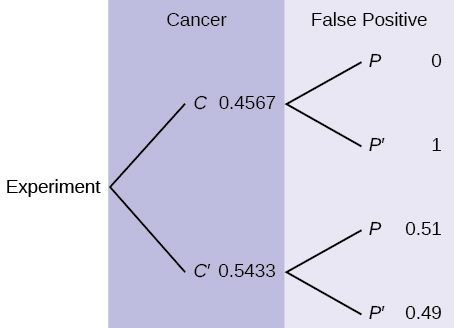
23. The probability that a male develops some form of cancer in his lifetime is 0.4567. The probability that a male has at least one false positive test result (meaning the test comes back for cancer when the man does not have it) is 0.51. Some of the following questions do not have enough information for you to answer them. Write “not enough information” for those answers. Let C = a man develops cancer in his lifetime and P = man has at least one false positive.
- P(C) = ______
- P(P|C) = ______
- P(P|C’) = ______
- If a test comes up positive, based upon numerical values, can you assume that man has cancer? Justify numerically and explain why or why not.
- P(C) = 0.4567
- not enough information
- not enough information
- No, because over half (0.51) of men have at least one false positive text
24. Given events G and H: P(G) = 0.43; P(H) = 0.26; P(H AND G) = 0.14
- Find P(H OR G).
- Find the probability of the complement of event (H AND G).
- Find the probability of the complement of event (H OR G).
25. Given events J and K: P(J) = 0.18; P(K) = 0.37; P(J OR K) = 0.45
- Find P(J AND K).
- Find the probability of the complement of event (J AND K).
- Find the probability of the complement of event (J OR K).
- P(J OR K) = P(J) + P(K) − P(J AND K); 0.45 = 0.18 + 0.37 – P(J AND K); solve to find P(J AND K) = 0.10
- P(NOT (J AND K)) = 1 – P(J AND K) = 1 – 0.10 = 0.90
- P(NOT (J OR K)) = 1 – P(J OR K) = 1 – 0.45 = 0.55
26. The sample space S is the whole numbers starting at one and less than 20.
- S = _____________________________
Let event A = the even numbers and event B = numbers greater than 13.
- A = _____________________, B = _____________________
- P(A) = _____________, P(B) = ________________
- A AND B = ____________________, A OR B = ________________
- P(A AND B) = _________, P(A OR B) = _____________
- A′ = _____________, P(A′) = _____________
- P(A) + P(A′) = ____________
- P(A|B) = ___________, P(B|A) = _____________; are the probabilities equal?
- S = {1, 2, 3, 4, 5, 6, 7, 8, 9, 10, 11, 12, 13, 14, 15, 16, 17, 18, 19}
- A = {2, 4, 6, 8, 10, 12, 14, 16, 18}, B = {14, 15, 16, 17, 18, 19}
- P(A) =
 , P(B) =
- A AND B = {14,16,18}, A OR B = {2, 4, 6, 8, 10, 12, 14, 15, 16, 17, 18, 19}
- P(A AND B) =
 , P(A OR B) =
- A′ = 1, 3, 5, 7, 9, 11, 13, 15, 17, 19; P(A′) =

- P(A) + P(A′) = 1 ( + = 1)
- P(A|B) =
 = , P(B|A) =
  =
=  No
No
27. The sample space S is all the ordered pairs of two whole numbers, the first from one to three and the second from one to four (Example: (1, 4)).
- S = _____________________________Let event A = the sum is even and event B = the first number is prime.
- A = _____________________, B = _____________________
- P(A) = _____________, P(B) = ________________
- A AND B = ____________________, A OR B = ________________
- P(A AND B) = _________, P(A OR B) = _____________
- B′ = _____________, P(B′) = _____________
- P(A) + P(A′) = ____________
- P(A|B) = ___________, P(B|A) = _____________; are the probabilities equal?
28. A fair, six-sided die is rolled. Describe the sample space S, identify each of the following events with a subset of S and compute its probability (an outcome is the number of dots that show up).
- Event T = the outcome is two.
- Event A = the outcome is an even number.
- Event B = the outcome is less than four.
- The complement of A.
- A GIVEN B
- B GIVEN A
- A AND B
- A OR B
- A OR B′
- Event N = the outcome is a prime number.
- Event I = the outcome is seven.
- T = {2}, P(T) =
- A = {2, 4, 6}, P(A) =

- B = {1, 2, 3}, P(B) =
- A′ = {1, 3, 5}, P(A′) =
- A|B = {2}, P(A|B) =

- B|A = {2}, P(B|A) =
- A AND B = {2}, P(A AND B) =
- A OR B = {1, 2, 3, 4, 6}, P(A OR B) =

- A OR B′ = {2, 4, 5, 6}, P(A OR B′) =
- N = {2, 3, 5}, P(N) =
- A six-sided die does not have seven dots. P(7) = 0.
29. The figure below describes the distribution of a random sample S of 100 individuals, organized by gender and whether they are right- or left-handed.
| Right-handed | Left-handed | |
|---|---|---|
| Males | 43 | 9 |
| Females | 44 | 4 |
Let’s denote the events M = the subject is male, F = the subject is female, R = the subject is right-handed, L = the subject is left-handed. Compute the following probabilities:
- P(M)
- P(F)
- P(R)
- P(L)
- P(M AND R)
- P(F AND L)
- P(M OR F)
- P(M OR R)
- P(F OR L)
- P(M’)
- P(R|M)
- P(F|L)
- P(L|F)
- P(M) = 0.52
- P(F) = 0.48
- P(R) = 0.87
- P(L) = 0.13
- P(M AND R) = 0.43
- P(F AND L) = 0.04
- P(M OR F) = 1
- P(M OR R) = 0.96
- P(F OR L) = 0.57
- P(M’) = 0.48
- P(R|M) = 0.8269 (rounded to four decimal places)
- P(F|L) = 0.3077 (rounded to four decimal places)
- P(L|F) = 0.0833
30. In a particular college class, there are male and female students. Some students have long hair and some students have short hair. Write the symbols for the probabilities of the events for parts a through j. (Note that you cannot find numerical answers here. You were not given enough information to find any probability values yet; concentrate on understanding the symbols.)
- Let F be the event that a student is female.
- Let M be the event that a student is male.
- Let S be the event that a student has short hair.
- Let L be the event that a student has long hair.
- The probability that a student does not have long hair.
- The probability that a student is male or has short hair.
- The probability that a student is a female and has long hair.
- The probability that a student is male, given that the student has long hair.
- The probability that a student has long hair, given that the student is male.
- Of all the female students, the probability that a student has short hair.
- Of all students with long hair, the probability that a student is female.
- The probability that a student is female or has long hair.
- The probability that a randomly selected student is a male student with short hair.
- The probability that a student is female.
- P(L′) = P(S)
- P(M OR S)
- P(F AND L)
- P(M|L)
- P(L|M)
- P(S|F)
- P(F|L)
- P(F OR L)
- P(M AND S)
- P(F)
31. A box is filled with several party favors. It contains 12 hats, 15 noisemakers, ten finger traps, and five bags of confetti.
Let H = the event of getting a hat.
Let N = the event of getting a noisemaker.
Let F = the event of getting a finger trap.
Let C = the event of getting a bag of confetti.
a. Find P(H).
b. Find P(N).
- P(N) =
 = 0.36
c. Find P(F).
d. Find P(C).
- P(C) =
 = 0.12
32. A jar of 150 jelly beans contains 22 red jelly beans, 38 yellow, 20 green, 28 purple, 26 blue, and the rest are orange.
Let B = the event of getting a blue jelly bean
Let G = the event of getting a green jelly bean.
Let O = the event of getting an orange jelly bean.
Let P = the event of getting a purple jelly bean.
Let R = the event of getting a red jelly bean.
Let Y = the event of getting a yellow jelly bean.
a. Find P(B).
b. Find P(G).
- P(G) =
 =
=  = 0.13
c. Find P(P).
d. Find P(R).
- P(R) =
 =
=  = 0.15
e. Find P(Y).
f. Find P(O).
- P(O) =
 =
=  =
=  = 0.11
33. There are 23 countries in North America, 12 countries in South America, 47 countries in Europe, 44 countries in Asia, 54 countries in Africa, and 14 in Oceania (Pacific Ocean region).
Let A = the event that a country is in Asia.
Let E = the event that a country is in Europe.
Let F = the event that a country is in Africa.
Let N = the event that a country is in North America.
Let O = the event that a country is in Oceania.
Let S = the event that a country is in South America.
a. Find P(A).
b. Find P(E).
- P(E) =
 = 0.24
c. Find P(F).
d. Find P(N).
- P(N) =
 = 0.12
e. Find P(O).
f. Find P(S).
- P(S) =
 =
=  = 0.06
g. What is the probability of drawing a red card in a standard deck of 52 cards?
h. What is the probability of drawing a club in a standard deck of 52 cards?
 = = 0.25
i. What is the probability of rolling an even number of dots with a fair, six-sided die numbered one through six?
j. What is the probability of rolling a prime number of dots with a fair, six-sided die numbered one through six?
- = = 0.5
34. You see a game at a local fair. You have to throw a dart at a color wheel. Each section on the color wheel is equal in area.
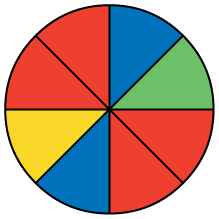
Let B = the event of landing on blue.
Let R = the event of landing on red.
Let G = the event of landing on green.
Let Y = the event of landing on yellow.
a. If you land on Y, you get the biggest prize. Find P(Y).
b. If you land on red, you don’t get a prize. What is P(R)?
 =
=  =0.5
=0.5
35. On a baseball team, there are infielders and outfielders. Some players are great hitters, and some players are not great hitters.
Let I = the event that a player in an infielder.
Let O = the event that a player is an outfielder.
Let H = the event that a player is a great hitter.
Let N = the event that a player is not a great hitter.
a. Write the symbols for the probability that a player is not an outfielder.
b. Write the symbols for the probability that a player is an outfielder or is a great hitter.
- P(O OR H)
c. Write the symbols for the probability that a player is an infielder and is not a great hitter.
d. Write the symbols for the probability that a player is a great hitter, given that the player is an infielder.
- P(H|I)
e. Write the symbols for the probability that a player is an infielder, given that the player is a great hitter.
f. Write the symbols for the probability that of all the outfielders, a player is not a great hitter.
- P(N|O)
g. Write the symbols for the probability that of all the great hitters, a player is an outfielder.
h. Write the symbols for the probability that a player is an infielder or is not a great hitter.
- P(I OR N)
i. Write the symbols for the probability that a player is an outfielder and is a great hitter.
j. Write the symbols for the probability that a player is an infielder.
- P(I)
k. What is the word for the set of all possible outcomes?
l. What is conditional probability?
m. The likelihood that an event will occur given that another event has already occurred.
36. A shelf holds 12 books. Eight are fiction and the rest are nonfiction. Each is a different book with a unique title. The fiction books are numbered one to eight. The nonfiction books are numbered one to four. Randomly select one book
Let F = event that book is fiction
Let N = event that book is nonfiction
What is the sample space?
What is the sum of the probabilities of an event and its complement?
- 1
37. You are rolling a fair, six-sided number cube. Let E = the event that it lands on an even number. Let M = the event that it lands on a multiple of three.
a. What does P(E|M) mean in words?
b. What does P(E OR M) mean in words?
c. the probability of landing on an even number or a multiple of three
38. The graph below displays the sample sizes and percentages of people in different age and gender groups who were polled concerning their approval of Mayor Ford’s actions in office. The total number in the sample of all the age groups is 1,045.
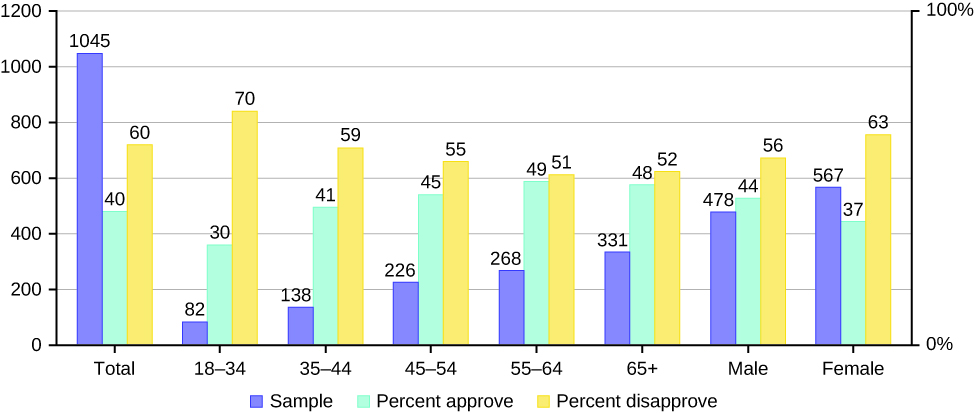
- Define three events in the graph.
- Describe in words what the entry 40 means.
- Describe in words the complement of the entry in question 2.
- Describe in words what the entry 30 means.
- Out of the males and females, what percent are males?
- Out of the females, what percent disapprove of Mayor Ford?
- Out of all the age groups, what percent approve of Mayor Ford?
- Find P(Approve|Male).
- Out of the age groups, what percent are more than 44 years old?
- Find P(Approve|Age < 35).
39. Explain what is wrong with the following statements. Use complete sentences.
- If there is a 60% chance of rain on Saturday and a 70% chance of rain on Sunday, then there is a 130% chance of rain over the weekend.
- The probability that a baseball player hits a home run is greater than the probability that he gets a successful hit.
- You can’t calculate the joint probability knowing the probability of both events occurring, which is not in the information given; the probabilities should be multiplied, not added; and probability is never greater than 100%
- A home run by definition is a successful hit, so he has to have at least as many successful hits as home runs.
3.2 Visualizing Probabilities
1. The following figure shows a random sample of 100 hikers and the areas of hiking they prefer.
| Sex | The Coastline | Near Lakes and Streams | On Mountain Peaks | Total |
|---|---|---|---|---|
| Female | 18 | 16 | ___ | 45 |
| Male | ___ | ___ | 14 | 55 |
| Total | ___ | 41 | ___ | ___ |
a. Complete the table.
a.
| Sex | The Coastline | Near Lakes and Streams | On Mountain Peaks | Total |
|---|---|---|---|---|
| Female | 18 | 16 | 11 | 45 |
| Male | 16 | 25 | 14 | 55 |
| Total | 34 | 41 | 25 | 100 |
b. Are the events “being female” and “preferring the coastline” independent events?
Let F = being female and let C = preferring the coastline.
- Find P(F AND C).
- Find P(F)P(C)
Are these two numbers the same? If they are, then F and C are independent. If they are not, then F and C are not independent.
b.
- P(F AND C) =
 = 0.18
 - P(F)P(C) =
 = (0.45)(0.34) = 0.153
P(F AND C) ≠ P(F)P(C), so the events F and C are not independent.
c. Find the probability that a person is male given that the person prefers hiking near lakes and streams. Let M = being male, and let L = prefers hiking near lakes and streams.
- What word tells you this is a conditional?
- Fill in the blanks and calculate the probability: P(___|___) = ___.
- Is the sample space for this problem all 100 hikers? If not, what is it?
c.The word ‘given’ tells you that this is a conditional.
- P(M|L) =

- No, the sample space for this problem is the 41 hikers who prefer lakes and streams.
d. Find the probability that a person is female or prefers hiking on mountain peaks. Let F = being female, and let P = prefers mountain peaks.
- Find P(F).
- Find P(P).
- Find P(F AND P).
- Find P(F OR P).
d.
- P(F) =

- P(P) =

- P(F AND P) =

- P(F OR P) = + – =

2. The figure below shows a random sample of 200 cyclists and the routes they prefer. Let M = males and H = hilly path.
| Gender | Lake Path | Hilly Path | Wooded Path | Total |
|---|---|---|---|---|
| Female | 45 | 38 | 27 | 110 |
| Male | 26 | 52 | 12 | 90 |
| Total | 71 | 90 | 39 | 200 |
- Out of the males, what is the probability that the cyclist prefers a hilly path?
- Are the events “being male” and “preferring the hilly path” independent events?
3. Muddy Mouse lives in a cage with three doors. If Muddy goes out the first door, the probability that he gets caught by Alissa the cat is  and the probability he is not caught is
  . If he goes out the second door, the probability he gets caught by Alissa is and the probability he is not caught is . The probability that Alissa catches Muddy coming out of the third door is and the probability she does not catch Muddy is . It is equally likely that Muddy will choose any of the three doors so the probability of choosing each door is .
| Caught or Not | Door One | Door Two | Door Three | Total |
|---|---|---|---|---|
| Caught |  |
 |
 |
____ |
| Not Caught |  |
 |
|
____ |
| Total | ____ | ____ | ____ | 1 |
- The first entry
 is P(Door One AND Caught)
 - The entry
 is P(Door One AND Not Caught)
Verify the remaining entries.
a. Complete the probability contingency table. Calculate the entries for the totals. Verify that the lower-right corner entry is 1.
a.
| Caught or Not | Door One | Door Two | Door Three | Total |
|---|---|---|---|---|
| Caught | |
|
|
 |
| Not Caught | |
|
|
 |
| Total |  |
 |
 |
1 |
b. What is the probability that Alissa does not catch Muddy?
b.
c. What is the probability that Muddy chooses Door One OR Door Two given that Muddy is caught by Alissa?
c.
4. The figure below relates the weights and heights of a group of individuals participating in an observational study.
| Weight/Height | Tall | Medium | Short | Totals |
|---|---|---|---|---|
| Obese | 18 | 28 | 14 | |
| Normal | 20 | 51 | 28 | |
| Underweight | 12 | 25 | 9 | |
| Totals |
- Find the total for each row and column
- Find the probability that a randomly chosen individual from this group is Tall.
- Find the probability that a randomly chosen individual from this group is Obese and Tall.
- Find the probability that a randomly chosen individual from this group is Tall given that the individual is Obese.
- Find the probability that a randomly chosen individual from this group is Obese given that the individual is Tall.
- Find the probability a randomly chosen individual from this group is Tall and Underweight.
- Are the events Obese and Tall independent?
5. There are several tools you can use to help organize and sort data when calculating probabilities. Contingency tables help display data and are particularly useful when calculating probabilities that have multiple dependent variables.
Use the following information to answer the next four exercises. The figure below shows a random sample of musicians and how they learned to play their instruments.
| Gender | Self-taught | Studied in School | Private Instruction | Total |
|---|---|---|---|---|
| Female | 12 | 38 | 22 | 72 |
| Male | 19 | 24 | 15 | 58 |
| Total | 31 | 62 | 37 | 130 |
a. Find P(musician is a female).
b. Find P(musician is a male AND had private instruction).
- P(musician is a male AND had private instruction) =
 =
=  = 0.12
c. Find P(musician is a female OR is self taught).
d. Are the events “being a female musician” and “learning music in school” mutually exclusive events?
- P(being a female musician AND learning music in school) =
 =
=  = 0.29
 - No, they are not independent because P(being a female musician AND learning music in school) is not equal to P(being a female musician)P(learning music in school).
6. An article in the New England Journal of Medicine, reported about a study of smokers in California and Hawaii. In one part of the report, the self-reported ethnicity and smoking levels per day were given. Of the people smoking at most ten cigarettes per day, there were 9,886 African Americans, 2,745 Native Hawaiians, 12,831 Latinos, 8,378 Japanese Americans, and 7,650 Whites. Of the people smoking 11 to 20 cigarettes per day, there were 6,514 African Americans, 3,062 Native Hawaiians, 4,932 Latinos, 10,680 Japanese Americans, and 9,877 Whites. Of the people smoking 21 to 30 cigarettes per day, there were 1,671 African Americans, 1,419 Native Hawaiians, 1,406 Latinos, 4,715 Japanese Americans, and 6,062 Whites. Of the people smoking at least 31 cigarettes per day, there were 759 African Americans, 788 Native Hawaiians, 800 Latinos, 2,305 Japanese Americans, and 3,970 Whites.[2]
Complete the table using the data provided. Suppose that one person from the study is randomly selected. Find the probability that person smoked 11 to 20 cigarettes per day.
| Smoking Level | African American | Native Hawaiian | Latino | Japanese Americans | White | TOTALS |
|---|---|---|---|---|---|---|
| 1–10 | ||||||
| 11–20 | ||||||
| 21–30 | ||||||
| 31+ | ||||||
| TOTALS |
a. Suppose that one person from the study is randomly selected. Find the probability that person smoked 11 to 20 cigarettes per day.
b. Find the probability that the person was Latino.
c. In words, explain what it means to pick one person from the study who is “Japanese American AND smokes 21 to 30 cigarettes per day.” Also, find the probability.
- To pick one person from the study who is Japanese American AND smokes 21 to 30 cigarettes per day means that the person has to meet both criteria: both Japanese American and smokes 21 to 30 cigarettes. The sample space should include everyone in the study. The probability is
 .
.
d. In words, explain what it means to pick one person from the study who is “Japanese American OR smokes 21 to 30 cigarettes per day.” Also, find the probability.
e. In words, explain what it means to pick one person from the study who is “Japanese American GIVEN that person smokes 21 to 30 cigarettes per day.” Also, find the probability.
- To pick one person from the study who is Japanese American given that person smokes 21-30 cigarettes per day, means that the person must fulfill both criteria and the sample space is reduced to those who smoke 21-30 cigarettes per day. The probability is
 .
.
f. Prove that smoking level/day and ethnicity are dependent events.
7. The figure below contains the number of crimes per 100,000 inhabitants from 2008 to 2011 in the U.S. [3]
| Year | Robbery | Burglary | Rape | Vehicle | Total |
|---|---|---|---|---|---|
| 2008 | 145.7 | 732.1 | 29.7 | 314.7 | |
| 2009 | 133.1 | 717.7 | 29.1 | 259.2 | |
| 2010 | 119.3 | 701 | 27.7 | 239.1 | |
| 2011 | 113.7 | 702.2 | 26.8 | 229.6 | |
| Total |
TOTAL each column and each row. Total data = 4,520.7
- Find P (2009 AND Robbery).
- Find P (2010 AND Burglary).
- Find P (2010 OR Burglary).
- Find P (2011|Rape).
- Find P (Vehicle|2008).
8. The following figure shows a random sample of 100 hikers and the areas of hiking they prefer.
| Sex | The Coastline | Near Lakes and Streams | On Mountain Peaks | Total |
|---|---|---|---|---|
| Female | 18 | 16 | ___ | 45 |
| Male | ___ | ___ | 14 | 55 |
| Total | ___ | 41 | ___ | ___ |
a. Complete the table.
b. Are the events “being female” and “preferring the coastline” independent events? Let F = being female and let C = preferring the coastline.
- Find P(F AND C).
- Find P(F)P(C)
- Are these two numbers the same? If they are, then F and C are independent. If they are not, then F and C are not independent.
c. Find the probability that a person is male given that the person prefers hiking near lakes and streams. Let M = being male, and let L = prefers hiking near lakes and streams.
- What word tells you this is a conditional?
- Fill in the blanks and calculate the probability: P(___|___) = ___.
- Is the sample space for this problem all 100 hikers? If not, what is it?
d. Find the probability that a person is female or prefers hiking on mountain peaks. Let F = being female, and let P = prefers mountain peaks.
- Find P(F).
- Find P(P).
- Find P(F AND P).
- Find P(F OR P).
Solutions:
a.
| Sex | The Coastline | Near Lakes and Streams | On Mountain Peaks | Total |
|---|---|---|---|---|
| Female | 18 | 16 | 11 | 45 |
| Male | 16 | 25 | 14 | 55 |
| Total | 34 | 41 | 25 | 100 |
b.
- P(F AND C) = = 0.18
- P(F)P(C) = = (0.45)(0.34) = 0.153
- P(F AND C) ≠ P(F)P(C), so the events F and C are not independent.
c.
- The word ‘given’ tells you that this is a conditional.
- P(M|L) =
- No, the sample space for this problem is the 41 hikers who prefer lakes and streams.
d.
- P(F) =
- P(P) =
- P(F AND P) =
- P(F OR P) = + – =
9. The figure below shows a random sample of 200 cyclists and the routes they prefer. Let M = males and H = hilly path.
| Gender | Lake Path | Hilly Path | Wooded Path | Total |
|---|---|---|---|---|
| Female | 45 | 38 | 27 | 110 |
| Male | 26 | 52 | 12 | 90 |
| Total | 71 | 90 | 39 | 200 |
- Out of the males, what is the probability that the cyclist prefers a hilly path?
- Are the events “being male” and “preferring the hilly path” independent events?
10. Muddy Mouse lives in a cage with three doors. If Muddy goes out the first door, the probability that he gets caught by Alissa the cat is and the probability he is not caught is . If he goes out the second door, the probability he gets caught by Alissa is and the probability he is not caught is . The probability that Alissa catches Muddy coming out of the third door is and the probability she does not catch Muddy is . It is equally likely that Muddy will choose any of the three doors so the probability of choosing each door is .
| Caught or Not | Door One | Door Two | Door Three | Total |
|---|---|---|---|---|
| Caught | |
|
|
____ |
| Not Caught | |
|
|
____ |
| Total | ____ | ____ | ____ | 1 |
- The first entry is P(Door One AND Caught)
- The entry is P(Door One AND Not Caught)
Verify the remaining entries.
a. Complete the probability contingency table. Calculate the entries for the totals. Verify that the lower-right corner entry is 1.
a.
| Caught or Not | Door One | Door Two | Door Three | Total |
|---|---|---|---|---|
| Caught | |
|
|
|
| Not Caught | |
|
|
|
| Total | |
|
|
1 |
b. What is the probability that Alissa does not catch Muddy?
b.
c. What is the probability that Muddy chooses Door One OR Door Two given that Muddy is caught by Alissa?
c.
11. The figure below relates the weights and heights of a group of individuals participating in an observational study.
| Weight/Height | Tall | Medium | Short | Totals |
|---|---|---|---|---|
| Obese | 18 | 28 | 14 | |
| Normal | 20 | 51 | 28 | |
| Underweight | 12 | 25 | 9 | |
| Totals |
- Find the total for each row and column
- Find the probability that a randomly chosen individual from this group is Tall.
- Find the probability that a randomly chosen individual from this group is Obese and Tall.
- Find the probability that a randomly chosen individual from this group is Tall given that the individual is Obese.
- Find the probability that a randomly chosen individual from this group is Obese given that the individual is Tall.
- Find the probability a randomly chosen individual from this group is Tall and Underweight.
- Are the events Obese and Tall independent?
12. Use the following information to answer the next four exercises. The figure below shows a random sample of musicians and how they learned to play their instruments.
| Gender | Self-taught | Studied in School | Private Instruction | Total |
|---|---|---|---|---|
| Female | 12 | 38 | 22 | 72 |
| Male | 19 | 24 | 15 | 58 |
| Total | 31 | 62 | 37 | 130 |
Find P(musician is a female).
Find P(musician is a male AND had private instruction).
P(musician is a male AND had private instruction) = = = 0.12
Find P(musician is a female OR is self taught).
Are the events “being a female musician” and “learning music in school” mutually exclusive events?
P(being a female musician AND learning music in school) = = = 0.29
No, they are not independent because P(being a female musician AND learning music in school) is not equal to P(being a female musician)P(learning music in school).
13. Use the following information to answer the next seven exercises. An article in the New England Journal of Medicine, reported about a study of smokers in California and Hawaii. In one part of the report, the self-reported ethnicity and smoking levels per day were given. Of the people smoking at most ten cigarettes per day, there were 9,886 African Americans, 2,745 Native Hawaiians, 12,831 Latinos, 8,378 Japanese Americans, and 7,650 Whites. Of the people smoking 11 to 20 cigarettes per day, there were 6,514 African Americans, 3,062 Native Hawaiians, 4,932 Latinos, 10,680 Japanese Americans, and 9,877 Whites. Of the people smoking 21 to 30 cigarettes per day, there were 1,671 African Americans, 1,419 Native Hawaiians, 1,406 Latinos, 4,715 Japanese Americans, and 6,062 Whites. Of the people smoking at least 31 cigarettes per day, there were 759 African Americans, 788 Native Hawaiians, 800 Latinos, 2,305 Japanese Americans, and 3,970 Whites. [4]
Complete the table using the data provided. Suppose that one person from the study is randomly selected. Find the probability that person smoked 11 to 20 cigarettes per day.
| Smoking Level | African American | Native Hawaiian | Latino | Japanese Americans | White | TOTALS |
|---|---|---|---|---|---|---|
| 1–10 | ||||||
| 11–20 | ||||||
| 21–30 | ||||||
| 31+ | ||||||
| TOTALS |
Suppose that one person from the study is randomly selected. Find the probability that person smoked 11 to 20 cigarettes per day.

Find the probability that the person was Latino.
In words, explain what it means to pick one person from the study who is “Japanese American AND smokes 21 to 30 cigarettes per day.” Also, find the probability.
To pick one person from the study who is Japanese American AND smokes 21 to 30 cigarettes per day means that the person has to meet both criteria: both Japanese American and smokes 21 to 30 cigarettes. The sample space should include everyone in the study. The probability is .
In words, explain what it means to pick one person from the study who is “Japanese American OR smokes 21 to 30 cigarettes per day.” Also, find the probability.
In words, explain what it means to pick one person from the study who is “Japanese American GIVEN that person smokes 21 to 30 cigarettes per day.” Also, find the probability.
To pick one person from the study who is Japanese American given that person smokes 21-30 cigarettes per day, means that the person must fulfill both criteria and the sample space is reduced to those who smoke 21-30 cigarettes per day. The probability is .
Prove that smoking level/day and ethnicity are dependent events.
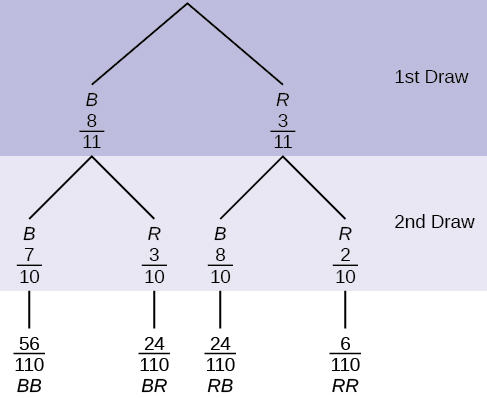
14. In an urn, there are 11 balls. Three balls are red (R) and eight balls are blue (B). Draw two balls, one at a time, with replacement. “With replacement” means that you put the first ball back in the urn before you select the second ball. The tree diagram using frequencies that show all the possible outcomes follows.
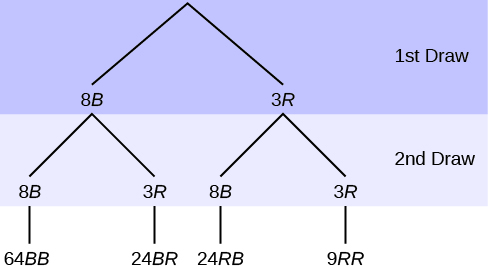
The first set of branches represents the first draw. The second set of branches represents the second draw. Each of the outcomes is distinct. In fact, we can list each red ball as R1, R2, and R3 and each blue ball as B1, B2, B3, B4, B5, B6, B7, and B8. Then the nine RR outcomes can be written as:
R1R1R1R2R1R3R2R1R2R2R2R3R3R1R3R2R3R3
The other outcomes are similar.
There are a total of 11 balls in the urn. Draw two balls, one at a time, with replacement. There are 11(11) = 121 outcomes, the size of the sample space.
a. List the 24 BR outcomes: B1R1, B1R2, B1R3, …
- B1R1B1R2B1R3B2R1B2R2B2R3B3R1B3R2B3R3B4R1B4R2B4R3B5R1B5R2B5R3B6R1B6R2B6R3B7R1B7R2B7R3B8R1B8R2B8R3
b. Using the tree diagram, calculate P(RR).
- P(RR) =

c. Using the tree diagram, calculate P(RB OR BR).
- P(RB OR BR) =

d. Using the tree diagram, calculate P(R on 1st draw AND B on 2nd draw).
- P(R on 1st draw AND B on 2nd draw) = P(RB) =

e. Using the tree diagram, calculate P(R on 2nd draw GIVEN B on 1st draw).
- P(R on 2nd draw GIVEN B on 1st draw) = P(R on 2nd|B on 1st) =

This problem is a conditional one. The sample space has been reduced to those outcomes that already have a blue on the first draw. There are 24 + 64 = 88 possible outcomes (24 BR and 64 BB). Twenty-four of the 88 possible outcomes are BR. .
f. Using the tree diagram, calculate P(BB).
- P(BB) =

g. Using the tree diagram, calculate P(B on the 2nd draw given R on the first draw).
- P(B on 2nd draw|R on 1st draw) =

There are 9 + 24 outcomes that have R on the first draw (9 RR and 24 RB). The sample space is then 9 + 24 = 33. 24 of the 33 outcomes have B on the second draw. The probability is then  .
.
15. An urn has three red marbles and eight blue marbles in it. Draw two marbles, one at a time, this time without replacement, from the urn. “Without replacement” means that you do not put the first ball back before you select the second marble. Following is a tree diagram for this situation. The branches are labeled with probabilities instead of frequencies. The numbers at the ends of the branches are calculated by multiplying the numbers on the two corresponding branches, for example:
 .
.

Calculate the following probabilities using the tree diagram.
a. P(RR) = ________
- P(RR) =

b. Fill in the blanks: P(RB OR BR) =  + (___)(___)=
- P(RB OR BR) =

c. P(R on 2nd|B on 1st) =

d. Fill in the blanks. P(R on 1st AND B on 2nd) = P(RB) = (___)(___) = 
- P(R on 1st AND B on 2nd) = P(RB) =

e. Find P(BB).
- P(BB) =

f. Find P(B on 2nd|R on 1st).
- Using the tree diagram, P(B on 2nd|R on 1st) = P(R|B) =

If we are using probabilities, we can label the tree in the following general way.
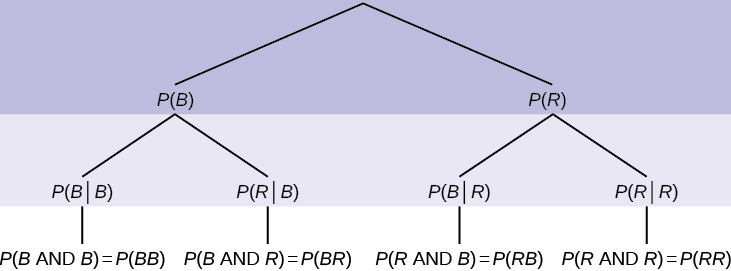
- P(R|R) here means P(R on 2nd|R on 1st)
- P(B|R) here means P(B on 2nd|R on 1st)
- P(R|B) here means P(R on 2nd|B on 1st)
- P(B|B) here means P(B on 2nd|B on 1st)
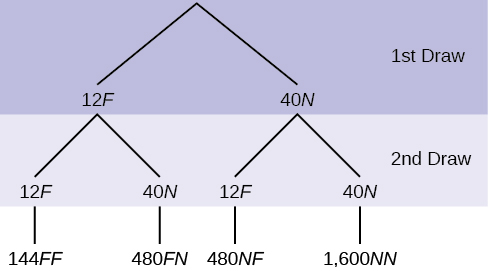
16. In a standard deck, there are 52 cards. 12 cards are face cards (event F) and 40 cards are not face cards (event N). Draw two cards, one at a time, with replacement. All possible outcomes are shown in the tree diagram as frequencies. Using the tree diagram, calculate P(FF).
17. In a standard deck, there are 52 cards. Twelve cards are face cards (F) and 40 cards are not face cards (N). Draw two cards, one at a time, without replacement. The tree diagram is labeled with all possible probabilities.
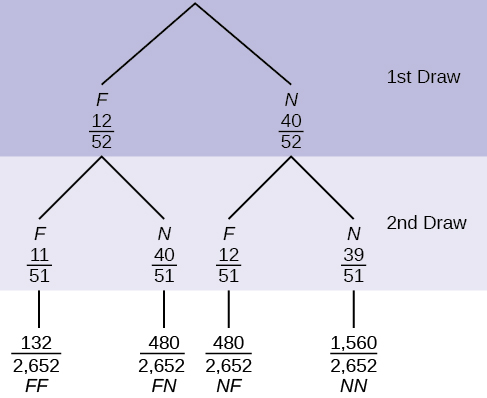
- Find P(FN OR NF).
- Find P(N|F).
- Find P(at most one face card).
Hint: “At most one face card” means zero or one face card. - Find P(at least on face card).
Hint: “At least one face card” means one or two face cards.
18. A litter of kittens available for adoption at the Humane Society has four tabby kittens and five black kittens. A family comes in and randomly selects two kittens (without replacement) for adoption.
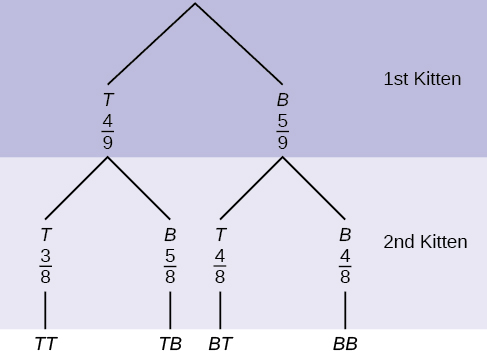
- What is the probability that both kittens are tabby?
a.
b.
c.
d.
2. What is the probability that one kitten of each coloring is selected?
a.
b.
c.
d.
3. What is the probability that a tabby is chosen as the second kitten when a black kitten was chosen as the first?
4. What is the probability of choosing two kittens of the same color?
Solutions: 1. c, 2. d, 3. , 4. 
19. Suppose there are four red balls and three yellow balls in a box. Two balls are drawn from the box without replacement. What is the probability that one ball of each coloring is selected?
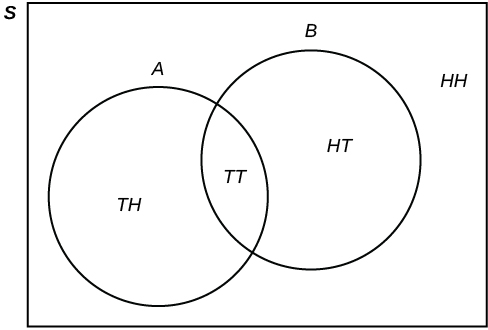
20. Flip two fair coins. Let A = tails on the first coin. Let B = tails on the second coin. Then A = {TT, TH} and B = {TT, HT}. Therefore, A AND B = {TT}. A OR B = {TH, TT, HT}.
The sample space when you flip two fair coins is X = {HH, HT, TH, TT}. The outcome HH is in NEITHER A NOR B. Draw a Venn Diagram.
Solution:
21. Roll a fair, six-sided die. Let A = a prime number of dots is rolled. Let B = an odd number of dots is rolled. Then A = {2, 3, 5} and B = {1, 3, 5}. Therefore, A AND B = {3, 5}. A OR B = {1, 2, 3, 5}. The sample space for rolling a fair die is S = {1, 2, 3, 4, 5, 6}. Draw a Venn diagram representing this situation.
22. Suppose an experiment has outcomes black, white, red, orange, yellow, green, blue, and purple, where each outcome has an equal chance of occurring. Let event C = {green, blue, purple} and event P = {red, yellow, blue}. Then C AND P = {blue} and C OR P = {green, blue, purple, red, yellow}. Draw a Venn diagram representing this situation.
23. Fifty percent of the workers at a factory work a second job, 25% have a spouse who also works, 5% work a second job and have a spouse who also works. Draw a Venn diagram showing the relationships. Let W = works a second job and S = spouse also works.
24. A person with type O blood and a negative Rh factor (Rh-) can donate blood to any person with any blood type. Four percent of African Americans have type O blood and a negative RH factor, 5−10% of African Americans have the Rh- factor, and 51% have type O blood. [5] [6]
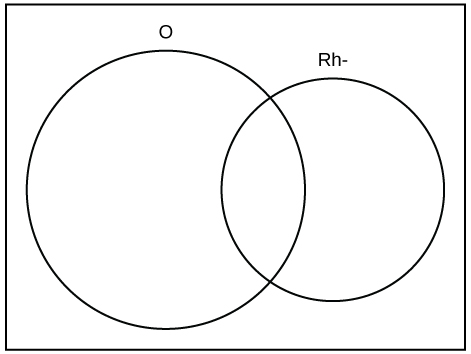
The “O” circle represents the African Americans with type O blood. The “Rh-“ oval represents the African Americans with the Rh- factor.
We will take the average of 5% and 10% and use 7.5% as the percent of African Americans who have the Rh- factor. Let O = African American with Type O blood and R = African American with Rh- factor.
- P(O) = ___________
- P(R) = ___________
- P(O AND R) = ___________
- P(O OR R) = ____________
- In the Venn Diagram, describe the overlapping area using a complete sentence.
- In the Venn Diagram, describe the area in the rectangle but outside both the circle and the oval using a complete sentence.
a. 0.51; b. 0.075; c. 0.04; d. 0.545; e. The area represents the African Americans that have type O blood and the Rh- factor. f. The area represents the African Americans that have neither type O blood nor the Rh- factor.
25. In a bookstore, the probability that the customer buys a novel is 0.6, and the probability that the customer buys a non-fiction book is 0.4. Suppose that the probability that the customer buys both is 0.2.
- Draw a Venn diagram representing the situation.
- Find the probability that the customer buys either a novel or anon-fiction book.
- In the Venn diagram, describe the overlapping area using a complete sentence.
- Suppose that some customers buy only compact disks. Draw an oval in your Venn diagram representing this event.
26. The probability that a man develops some form of cancer in his lifetime is 0.4567. The probability that a man has at least one false positive test result (meaning the test comes back for cancer when the man does not have it) is 0.51. Let: C = a man develops cancer in his lifetime; P = man has at least one false positive. Construct a tree diagram of the situation.
27. This tree diagram shows the tossing of an unfair coin followed by drawing one bead from a cup containing three red (R), four yellow (Y) and five blue (B) beads. For the coin, P(H) = and P(T) = where H is heads and T is tails.
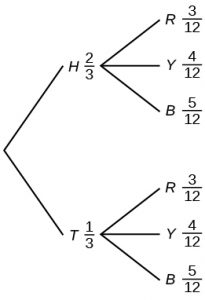
Find P(tossing a Head on the coin AND a Red bead)


Find P(Blue bead).


28. A box of cookies contains three chocolate and seven butter cookies. Miguel randomly selects a cookie and eats it. Then he randomly selects another cookie and eats it. (How many cookies did he take?)
- Draw the tree that represents the possibilities for the cookie selections. Write the probabilities along each branch of the tree.
- Are the probabilities for the flavor of the SECOND cookie that Miguel selects independent of his first selection? Explain.
- For each complete path through the tree, write the event it represents and find the probabilities.
- Let S be the event that both cookies selected were the same flavor. Find P(S).
- Let T be the event that the cookies selected were different flavors. Find P(T) by two different methods: by using the complement rule and by using the branches of the tree. Your answers should be the same with both methods.
- Let U be the event that the second cookie selected is a butter cookie. Find P(U).
29. Suppose that you have eight cards. Five are green and three are yellow. The cards are well shuffled.
Suppose that you randomly draw two cards, one at a time, with replacement.
Let G1 = first card is green
Let G2 = second card is green
- Draw a tree diagram of the situation.
- Find P(G1 AND G2).
- Find P(at least one green).
- Find P(G2|G1).
- Are G2 and G1 independent events? Explain why or why not.
-
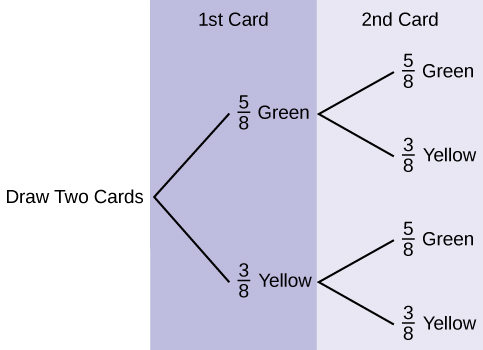
Figure 3.46 - P(GG) =
 =
= 
- P(at least one green) = P(GG) + P(GY) + P(YG) = +
 + =
+ = 
- P(G|G) =
- Yes, they are independent because the first card is placed back in the bag before the second card is drawn; the composition of cards in the bag remains the same from draw one to draw two.
Suppose that you randomly draw two cards, one at a time, without replacement.
G1 = first card is green
G2 = second card is green
- Draw a tree diagram of the situation.
- Find P(G1 AND G2).
- Find P(at least one green).
- Find P(G2|G1).
- Are G2 and G1 independent events? Explain why or why not.
30. The percent of licensed U.S. drivers (from a recent year) that are female is 48.60. Of the females, 5.03% are age 19 and under; 81.36% are age 20–64; 13.61% are age 65 or over. Of the licensed U.S. male drivers, 5.04% are age 19 and under; 81.43% are age 20–64; 13.53% are age 65 or over. [8]
Complete the following.
- Construct a table or a tree diagram of the situation.
- Find P(driver is female).
- Find P(driver is age 65 or over|driver is female).
- Find P(driver is age 65 or over AND female).
- In words, explain the difference between the probabilities in part c and part d.
- Find P(driver is age 65 or over).
- Are being age 65 or over and being female mutually exclusive events? How do you know?
-
Figure 3.47 <20 20–64 >64 Totals Female 0.0244 0.3954 0.0661 0.486 Male 0.0259 0.4186 0.0695 0.514 Totals 0.0503 0.8140 0.1356 1 - P(F) = 0.486
- P(>64|F) = 0.1361
- P(>64 and F) = P(F) P(>64|F) = (0.486)(0.1361) = 0.0661
- P(>64|F) is the percentage of female drivers who are 65 or older and P(>64 and F) is the percentage of drivers who are female and 65 or older.
- P(>64) = P(>64 and F) + P(>64 and M) = 0.1356
- No, being female and 65 or older are not mutually exclusive because they can occur at the same time P(>64 and F) = 0.0661.
Suppose that 10,000 U.S. licensed drivers are randomly selected.
- How many would you expect to be male?
- Using the table or tree diagram, construct a contingency table of gender versus age group.
- Using the contingency table, find the probability that out of the age 20–64 group, a randomly selected driver is female.
31. Approximately 86.5% of Americans commute to work by car, truck, or van. Out of that group, 84.6% drive alone and 15.4% drive in a carpool. Approximately 3.9% walk to work and approximately 5.3% take public transportation. [9]
- Construct a table or a tree diagram of the situation. Include a branch for all other modes of transportation to work.
- Assuming that the walkers walk alone, what percent of all commuters travel alone to work?
- Suppose that 1,000 workers are randomly selected. How many would you expect to travel alone to work?
- Suppose that 1,000 workers are randomly selected. How many would you expect to drive in a carpool?
-
Figure 3.48 Car, Truck or Van Walk Public Transportation Other Totals Alone 0.7318 Not Alone 0.1332 Totals 0.8650 0.0390 0.0530 0.0430 1 - If we assume that all walkers are alone and that none from the other two groups travel alone (which is a big assumption) we have: P(Alone) = 0.7318 + 0.0390 = 0.7708.
- Make the same assumptions as in (b) we have: (0.7708)(1,000) = 771
- (0.1332)(1,000) = 133
32. When the Euro coin was introduced in 2002, two math professors had their statistics students test whether the Belgian one Euro coin was a fair coin. They spun the coin rather than tossing it and found that out of 250 spins, 140 showed a head (event H) while 110 showed a tail (event T). On that basis, they claimed that it is not a fair coin.
- Based on the given data, find P(H) and P(T).
- Use a tree to find the probabilities of each possible outcome for the experiment of tossing the coin twice.
- Use the tree to find the probability of obtaining exactly one head in two tosses of the coin.
- Use the tree to find the probability of obtaining at least one head.
33. The following are real data from Santa Clara County, CA. As of a certain time, there had been a total of 3,059 documented cases of AIDS in the county. They were grouped into the following categories: [10]
| Homosexual/Bisexual | IV Drug User* | Heterosexual Contact | Other | Totals | |
|---|---|---|---|---|---|
| Female | 0 | 70 | 136 | 49 | ____ |
| Male | 2,146 | 463 | 60 | 135 | ____ |
| Totals | ____ | ____ | ____ | ____ | ____ |
Suppose a person with AIDS in Santa Clara County is randomly selected.
- Find P(Person is female).
- Find P(Person has a risk factor heterosexual contact).
- Find P(Person is female OR has a risk factor of IV drug user).
- Find P(Person is female AND has a risk factor of homosexual/bisexual).
- Find P(Person is male AND has a risk factor of IV drug user).
- Find P(Person is female GIVEN person got the disease from heterosexual contact).
- Construct a Venn diagram. Make one group females and the other group heterosexual contact.
The completed contingency table is as follows:
| Homosexual/Bisexual | IV Drug User* | Heterosexual Contact | Other | Totals | |
|---|---|---|---|---|---|
| Female | 0 | 70 | 136 | 49 | 255 |
| Male | 2,146 | 463 | 60 | 135 | 2,804 |
| Totals | 2,146 | 533 | 196 | 184 | 3,059 |


- 0


-
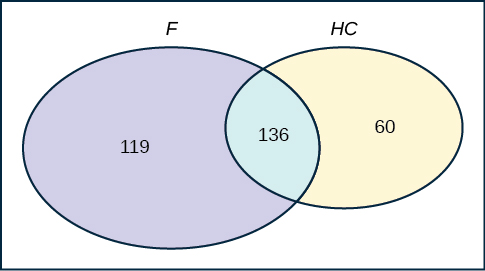
Figure 3.51
Answer these questions using probability rules. Do NOT use the contingency table. Three thousand fifty-nine cases of AIDS had been reported in Santa Clara County, CA, through a certain date. Those cases will be our population. Of those cases, 6.4% obtained the disease through heterosexual contact and 7.4% are female. Out of the females with the disease, 53.3% got the disease from heterosexual contact.
- Find P(Person is female).
- Find P(Person obtained the disease through heterosexual contact).
- Find P(Person is female GIVEN person got the disease from heterosexual contact)
- Construct a Venn diagram representing this situation. Make one group females and the other group heterosexual contact. Fill in all values as probabilities.
34. The table shows the political party affiliation of each of 67 members of the US Senate in June 2012, and when they are up for reelection. [11]
| Up for reelection: | Democratic Party | Republican Party | Other | Total |
|---|---|---|---|---|
| November 2014 | 20 | 13 | 0 | |
| November 2016 | 10 | 24 | 0 | |
| Total |
a. What is the probability that a randomly selected senator has an “Other” affiliation?
- 0
b. What is the probability that a randomly selected senator is up for reelection in November 2016?
c. What is the probability that a randomly selected senator is a Democrat and up for reelection in November 2016?

d. What is the probability that a randomly selected senator is a Republican or is up for reelection in November 2014?
e. Suppose that a member of the US Senate is randomly selected. Given that the randomly selected senator is up for reelection in November 2016, what is the probability that this senator is a Democrat?

f. Suppose that a member of the US Senate is randomly selected. What is the probability that the senator is up for reelection in November 2014, knowing that this senator is a Republican?
g. The events “Republican” and “Up for reelection in 2016” are ________
- mutually exclusive.
- independent.
- both mutually exclusive and independent.
- neither mutually exclusive nor independent.
h. The events “Other” and “Up for reelection in November 2016” are ________
- mutually exclusive.
- independent.
- both mutually exclusive and independent.
- neither mutually exclusive nor independent.
35. The figure below gives the number of suicides estimated in the U.S. for a recent year by age, race (black or white), and sex. We are interested in possible relationships between age, race, and sex. We will let suicide victims be our population.
| Race and Sex | 1–14 | 15–24 | 25–64 | over 64 | TOTALS |
|---|---|---|---|---|---|
| white, male | 210 | 3,360 | 13,610 | 22,050 | |
| white, female | 80 | 580 | 3,380 | 4,930 | |
| black, male | 10 | 460 | 1,060 | 1,670 | |
| black, female | 0 | 40 | 270 | 330 | |
| all others | |||||
| TOTALS | 310 | 4,650 | 18,780 | 29,760 |
Do not include “all others” for parts f and g.
- Fill in the column for the suicides for individuals over age 64.
- Fill in the row for all other races.
- Find the probability that a randomly selected individual was a white male.
- Find the probability that a randomly selected individual was a black female.
- Find the probability that a randomly selected individual was black
- Find the probability that a randomly selected individual was a black or white male.
- Out of the individuals over age 64, find the probability that a randomly selected individual was a black or white male.
-
Figure 3.54 Race and Sex 1–14 15–24 25–64 over 64 TOTALS white, male 210 3,360 13,610 4,870 22,050 white, female 80 580 3,380 890 4,930 black, male 10 460 1,060 140 1,670 black, female 0 40 270 20 330 all others 100 TOTALS 310 4,650 18,780 6,020 29,760 -
Figure 3.55 Race and Sex 1–14 15–24 25–64 over 64 TOTALS white, male 210 3,360 13,610 4,870 22,050 white, female 80 580 3,380 890 4,930 black, male 10 460 1,060 140 1,670 black, female 0 40 270 20 330 all others 10 210 460 100 780 TOTALS 310 4,650 18,780 6,020 29,760 


36. The table of data obtained from www.baseball-almanac.com shows hit information for four well known baseball players. Suppose that one hit from the table is randomly selected. [12]
| NAME | Single | Double | Triple | Home Run | TOTAL HITS |
|---|---|---|---|---|---|
| Babe Ruth | 1,517 | 506 | 136 | 714 | 2,873 |
| Jackie Robinson | 1,054 | 273 | 54 | 137 | 1,518 |
| Ty Cobb | 3,603 | 174 | 295 | 114 | 4,189 |
| Hank Aaron | 2,294 | 624 | 98 | 755 | 3,771 |
| TOTAL | 8,471 | 1,577 | 583 | 1,720 | 12,351 |
Find P(hit was made by Babe Ruth).


Find P(hit was made by Ty Cobb|The hit was a Home Run).


37. The figure below identifies a group of children by one of four hair colors, and by type of hair.
| Hair Type | Brown | Blond | Black | Red | Totals |
|---|---|---|---|---|---|
| Wavy | 20 | 15 | 3 | 43 | |
| Straight | 80 | 15 | 12 | ||
| Totals | 20 | 215 |
- Complete the table.
- What is the probability that a randomly selected child will have wavy hair?
- What is the probability that a randomly selected child will have either brown or blond hair?
- What is the probability that a randomly selected child will have wavy brown hair?
- What is the probability that a randomly selected child will have red hair, given that he or she has straight hair?
- If B is the event of a child having brown hair, find the probability of the complement of B.
- In words, what does the complement of B represent?
38. In a previous year, the weights of the members of the San Francisco 49ers and the Dallas Cowboys were published in the San Jose Mercury News. The factual data were compiled into the following table.[13]
| Shirt# | ≤ 210 | 211–250 | 251–290 | > 290 |
|---|---|---|---|---|
| 1–33 | 21 | 5 | 0 | 0 |
| 34–66 | 6 | 18 | 7 | 4 |
| 66–99 | 6 | 12 | 22 | 5 |
For the following, suppose that you randomly select one player from the 49ers or Cowboys.
- Find the probability that his shirt number is from 1 to 33.
- Find the probability that he weighs at most 210 pounds.
- Find the probability that his shirt number is from 1 to 33 AND he weighs at most 210 pounds.
- Find the probability that his shirt number is from 1 to 33 OR he weighs at most 210 pounds.
- Find the probability that his shirt number is from 1 to 33 GIVEN that he weighs at most 210 pounds.


3.3 Compound Events
a. What is the probability that the member is a novice swimmer?

b. What is the probability that the member practices four times a week?

c. What is the probability that the member is an advanced swimmer and practices four times a week?

d. What is the probability that a member is an advanced swimmer and an intermediate swimmer? Are being an advanced swimmer and an intermediate swimmer mutually exclusive? Why or why not?
- P(advanced AND intermediate) = 0, so these are mutually exclusive events. A swimmer cannot be an advanced swimmer and an intermediate swimmer at the same time.
e. Are being a novice swimmer and practicing four times a week independent events? Why or why not?
- No, these are not independent events.
- P(novice AND practices four times per week) = 0.0667
- P(novice)P(practices four times per week) = 0.0996
- 0.0667 ≠ 0.0996
3. A school has 200 seniors of whom 140 will be going to college next year. Forty will be going directly to work. The remainder are taking a gap year. Fifty of the seniors going to college play sports. Thirty of the seniors going directly to work play sports. Five of the seniors taking a gap year play sports. What is the probability that a senior is taking a gap year?
4. A student goes to the library. Let events B = the student checks out a book and D = the student check out a DVD. Suppose that P(B) = 0.40, P(D) = 0.30 and P(D|B) = 0.5.
- Find P(B AND D).
- Find P(B OR D).
5. Studies show that about one woman in seven (approximately 14.3%) who live to be 90 will develop breast cancer. Suppose that of those women who develop breast cancer, a test is negative 2% of the time. Also suppose that in the general population of women, the test for breast cancer is negative about 85% of the time. Let B = woman develops breast cancer and let N = tests negative. Suppose one woman is selected at random.
a. What is the probability that the woman develops breast cancer? What is the probability that woman tests negative?
- P(B) = 0.143; P(N) = 0.85
b. Given that the woman has breast cancer, what is the probability that she tests negative?
- P(N|B) = 0.02
c. What is the probability that the woman has breast cancer AND tests negative?
- P(B AND N) = P(B)P(N|B) = (0.143)(0.02) = 0.0029
d. What is the probability that the woman has breast cancer or tests negative?
- P(B OR N) = P(B) + P(N) – P(B AND N) = 0.143 + 0.85 – 0.0029 = 0.9901
e. Are having breast cancer and testing negative independent events?
- No. P(N) = 0.85; P(N|B) = 0.02. So, P(N|B) does not equal P(N).
f. Are having breast cancer and testing negative mutually exclusive?
- No. P(B AND N) = 0.0029. For B and N to be mutually exclusive, P(B AND N) must be zero.
6. A school has 200 seniors of whom 140 will be going to college next year. Forty will be going directly to work. The remainder are taking a gap year. Fifty of the seniors going to college play sports. Thirty of the seniors going directly to work play sports. Five of the seniors taking a gap year play sports. What is the probability that a senior is going to college and plays sports?
7. Refer to the information in Question 6. P = tests positive.
- Given that a woman develops breast cancer, what is the probability that she tests positive. Find P(P|B) = 1 – P(N|B).
- What is the probability that a woman develops breast cancer and tests positive. Find P(B AND P) = P(P|B)P(B).
- What is the probability that a woman does not develop breast cancer. Find P(B′) = 1 – P(B).
- What is the probability that a woman tests positive for breast cancer. Find P(P) = 1 – P(N).
a. 0.98; b. 0.1401; c. 0.857; d. 0.15
8. A student goes to the library. Let events B = the student checks out a book and D = the student checks out a DVD. Suppose that P(B) = 0.40, P(D) = 0.30 and P(D|B) = 0.5.
- Find P(B′).
- Find P(D AND B).
- Find P(B|D).
- Find P(D AND B′).
- Find P(D|B′).
9. Forty-eight percent of all Californians registered voters prefer life in prison without parole over the death penalty for a person convicted of first degree murder. Among Latino California registered voters, 55% prefer life in prison without parole over the death penalty for a person convicted of first degree murder. 37.6% of all Californians are Latino.
In this problem, let:
- C = Californians (registered voters) preferring life in prison without parole over the death penalty for a person convicted of first degree murder.
- L = Latino Californians
Suppose that one Californian is randomly selected.
a. Find P(C).
b. Find P(L).
- 0.376
c. Find P(C|L).
d. In words, what is C|L?
- C|L means, given the person chosen is a Latino Californian, the person is a registered voter who prefers life in prison without parole for a person convicted of first degree murder.
e. Find P(L AND C).
f. In words, what is L AND C?
- L AND C is the event that the person chosen is a Latino California registered voter who prefers life without parole over the death penalty for a person convicted of first degree murder.
g. Are L and C independent events? Show why or why not.
h. Find P(L OR C).
- 0.6492
i. In words, what is L OR C?
j. Are L and C mutually exclusive events? Show why or why not.
- No, because P(L AND C) does not equal 0.
10. On February 28, 2013, a Field Poll Survey reported that 61% of California registered voters approved of allowing two people of the same gender to marry and have regular marriage laws apply to them. Among 18 to 39 year olds (California registered voters), the approval rating was 78%. Six in ten California registered voters said that the upcoming Supreme Court’s ruling about the constitutionality of California’s Proposition 8 was either very or somewhat important to them. Out of those CA registered voters who support same-sex marriage, 75% say the ruling is important to them.[14]
In this problem, let:
- C = California registered voters who support same-sex marriage.
- B = California registered voters who say the Supreme Court’s ruling about the constitutionality of California’s Proposition 8 is very or somewhat important to them
- A = California registered voters who are 18 to 39 years old.
- Find P(C).
- Find P(B).
- Find P(C|A).
- Find P(B|C).
- In words, what is C|A?
- In words, what is B|C?
- Find P(C AND B).
- In words, what is C AND B?
- Find P(C OR B).
- Are C and B mutually exclusive events? Show why or why not.
11. After Rob Ford, the mayor of Toronto, announced his plans to cut budget costs in late 2011, the Forum Research polled 1,046 people to measure the mayor’s popularity. Everyone polled expressed either approval or disapproval. [15]
These are the results their poll produced:
- In early 2011, 60 percent of the population approved of Mayor Ford’s actions in office.
- In mid-2011, 57 percent of the population approved of his actions.
- In late 2011, the percentage of popular approval was measured at 42 percent.
- What is the sample size for this study?
- What proportion in the poll disapproved of Mayor Ford, according to the results from late 2011?
- How many people polled responded that they approved of Mayor Ford in late 2011?
- What is the probability that a person supported Mayor Ford, based on the data collected in mid-2011?
- What is the probability that a person supported Mayor Ford, based on the data collected in early 2011?
- The Forum Research surveyed 1,046 Torontonians.
- 58%
- 42% of 1,046 = 439 (rounding to the nearest integer)
- 0.57
- 0.60.
12. The casino game, roulette, allows the gambler to bet on the probability of a ball, which spins in the roulette wheel, landing on a particular color, number, or range of numbers. The table used to place bets contains of 38 numbers, and each number is assigned to a color and a range. [16]
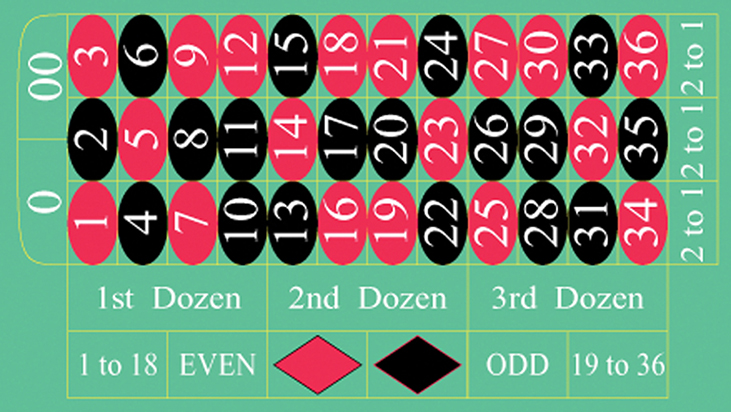
- List the sample space of the 38 possible outcomes in roulette.
- You bet on red. Find P(red).
- You bet on -1st 12- (1st Dozen). Find P(-1st 12-).
- You bet on an even number. Find P(even number).
- Is getting an odd number the complement of getting an even number? Why?
- Find two mutually exclusive events.
- Are the events Even and 1st Dozen independent?
Compute the probability of winning the following types of bets:
- Betting on two lines that touch each other on the table as in 1-2-3-4-5-6
- Betting on three numbers in a line, as in 1-2-3
- Betting on one number
- Betting on four numbers that touch each other to form a square, as in 10-11-13-14
- Betting on two numbers that touch each other on the table, as in 10-11 or 10-13
- Betting on 0-00-1-2-3
- Betting on 0-1-2; or 0-00-2; or 00-2-3
- P(Betting on two line that touch each other on the table) =

- P(Betting on three numbers in a line) =

- P(Bettting on one number) =

- P(Betting on four number that touch each other to form a square) =

- P(Betting on two number that touch each other on the table ) =

- P(Betting on 0-00-1-2-3) =

- P(Betting on 0-1-2; or 0-00-2; or 00-2-3) =
Compute the probability of winning the following types of bets:
- Betting on a color
- Betting on one of the dozen groups
- Betting on the range of numbers from 1 to 18
- Betting on the range of numbers 19–36
- Betting on one of the columns
- Betting on an even or odd number (excluding zero)
13. Suppose that you have eight cards. Five are green and three are yellow. The five green cards are numbered 1, 2, 3, 4, and 5. The three yellow cards are numbered 1, 2, and 3. The cards are well shuffled. You randomly draw one card.
- G = card drawn is green
- E = card drawn is even-numbered
- List the sample space.
- P(G) = _____
- P(G|E) = _____
- P(G AND E) = _____
- P(G OR E) = _____
- Are G and E mutually exclusive? Justify your answer numerically.
- {G1, G2, G3, G4, G5, Y1, Y2, Y3}


- No, because P(G AND E) does not equal 0.
14. Roll two fair dice separately. Each die has six faces.
- List the sample space.
- Let A be the event that either a three or four is rolled first, followed by an even number. Find P(A).
- Let B be the event that the sum of the two rolls is at most seven. Find P(B).
- In words, explain what “P(A|B)” represents. Find P(A|B).
- Are A and B mutually exclusive events? Explain your answer in one to three complete sentences, including numerical justification.
- Are A and B independent events? Explain your answer in one to three complete sentences, including numerical justification.
15. A special deck of cards has ten cards. Four are green, three are blue, and three are red. When a card is picked, its color of it is recorded. An experiment consists of first picking a card and then tossing a coin.
- List the sample space.
- Let A be the event that a blue card is picked first, followed by landing a head on the coin toss. Find P(A).
- Let B be the event that a red or green is picked, followed by landing a head on the coin toss. Are the events A and B mutually exclusive? Explain your answer in one to three complete sentences, including numerical justification.
- Let C be the event that a red or blue is picked, followed by landing a head on the coin toss. Are the events A and C mutually exclusive? Explain your answer in one to three complete sentences, including numerical justification.
- {(G,H) (G,T) (B,H) (B,T) (R,H) (R,T)}
- P(A) = P(blue)P(head) =

- Yes, A and B are mutually exclusive because they cannot happen at the same time; you cannot pick a card that is both blue and also (red or green). P(A AND B) = 0
- No, A and C are not mutually exclusive because they can occur at the same time. In fact, C includes all of the outcomes of A; if the card chosen is blue it is also (red or blue). P(A AND C) = P(A) =

16. An experiment consists of first rolling a die and then tossing a coin.
- List the sample space.
- Let A be the event that either a three or a four is rolled first, followed by landing a head on the coin toss. Find P(A).
- Let B be the event that the first and second tosses land on heads. Are the events A and B mutually exclusive? Explain your answer in one to three complete sentences, including numerical justification.
17. An experiment consists of tossing a nickel, a dime, and a quarter. Of interest is the side the coin lands on.
- List the sample space.
- Let A be the event that there are at least two tails. Find P(A).
- Let B be the event that the first and second tosses land on heads. Are the events A and B mutually exclusive? Explain your answer in one to three complete sentences, including justification.
- S = {(HHH), (HHT), (HTH), (HTT), (THH), (THT), (TTH), (TTT)}
- Yes, because if A has occurred, it is impossible to obtain two tails. In other words, P(A AND B) = 0.
18. Consider the following scenario:
Let P(C) = 0.4.
Let P(D) = 0.5.
Let P(C|D) = 0.6.
- Find P(C AND D).
- Are C and D mutually exclusive? Why or why not?
- Are C and D independent events? Why or why not?
- Find P(C OR D).
- Find P(D|C).
19. Y and Z are independent events.
- Rewrite the basic Addition Rule P(Y OR Z) = P(Y) + P(Z) – P(Y AND Z) using the information that Y and Z are independent events.
- Use the rewritten rule to find P(Z) if P(Y OR Z) = 0.71 and P(Y) = 0.42.
- If Y and Z are independent, then P(Y AND Z) = P(Y)P(Z), so P(Y OR Z) = P(Y) + P(Z) – P(Y)P(Z).
- 0.5
20. G and H are mutually exclusive events. P(G) = 0.5 P(H) = 0.3
- Explain why the following statement MUST be false: P(H|G) = 0.4.
- Find P(H OR G).
- Are G and H independent or dependent events? Explain in a complete sentence.
21. Approximately 281,000,000 people over age five live in the United States. Of these people, 55,000,000 speak a language other than English at home. Of those who speak another language at home, 62.3% speak Spanish. [17]
Let: E = speaks English at home
E′ = speaks another language at home
S = speaks Spanish;
Finish each probability statement by matching the correct answer.
| Probability Statements | Answers |
|---|---|
| a. P(E′) = | i. 0.8043 |
| b. P(E) = | ii. 0.623 |
| c. P(S and E′) = | iii. 0.1957 |
| d. P(S|E′) = | iv. 0.1219 |
22. 1994, the U.S. government held a lottery to issue 55,000 Green Cards (permits for non-citizens to work legally in the U.S.). Renate Deutsch, from Germany, was one of approximately 6.5 million people who entered this lottery. Let G = won green card.
- What was Renate’s chance of winning a Green Card? Write your answer as a probability statement.
- In the summer of 1994, Renate received a letter stating she was one of 110,000 finalists chosen. Once the finalists were chosen, assuming that each finalist had an equal chance to win, what was Renate’s chance of winning a Green Card? Write your answer as a conditional probability statement. Let F = was a finalist.
- Are G and F independent or dependent events? Justify your answer numerically and also explain why.
- Are G and F mutually exclusive events? Justify your answer numerically and explain why.
23. Three professors at George Washington University did an experiment to determine if economists are more selfish than other people. They dropped 64 stamped, addressed envelopes with $10 cash in different classrooms on the George Washington campus. 44% were returned overall. From the economics classes 56% of the envelopes were returned. From the business, psychology, and history classes 31% were returned.
Let: R = money returned; E = economics classes; O = other classes
- Write a probability statement for the overall percent of money returned.
- Write a probability statement for the percent of money returned out of the economics classes.
- Write a probability statement for the percent of money returned out of the other classes.
- Is money being returned independent of the class? Justify your answer numerically and explain it.
- Based upon this study, do you think that economists are more selfish than other people? Explain why or why not. Include numbers to justify your answer.
- P(R) = 0.44
- P(R|E) = 0.56
- P(R|O) = 0.31
- No, whether the money is returned is not independent of which class the money was placed in. There are several ways to justify this mathematically, but one is that the money placed in economics classes is not returned at the same overall rate; P(R|E) ≠ P(R).
- No, this study definitely does not support that notion; in fact, it suggests the opposite. The money placed in the economics classrooms was returned at a higher rate than the money place in all classes collectively; P(R|E) > P(R).
24. The following table of data obtained from www.baseball-almanac.com shows hit information for four players. Suppose that one hit from the table is randomly selected. [18]
| Name | Single | Double | Triple | Home Run | Total Hits |
|---|---|---|---|---|---|
| Babe Ruth | 1,517 | 506 | 136 | 714 | 2,873 |
| Jackie Robinson | 1,054 | 273 | 54 | 137 | 1,518 |
| Ty Cobb | 3,603 | 174 | 295 | 114 | 4,189 |
| Hank Aaron | 2,294 | 624 | 98 | 755 | 3,771 |
| Total | 8,471 | 1,577 | 583 | 1,720 | 12,351 |
Are “the hit being made by Hank Aaron” and “the hit being a double” independent events?
- Yes, because P(hit by Hank Aaron|hit is a double) = P(hit by Hank Aaron)
- No, because P(hit by Hank Aaron|hit is a double) ≠ P(hit is a double)
- No, because P(hit is by Hank Aaron|hit is a double) ≠ P(hit by Hank Aaron)
- Yes, because P(hit is by Hank Aaron|hit is a double) = P(hit is a double)
25. United Blood Services[19] is a blood bank that serves more than 500 hospitals in 18 states. According to their website, a person with type O blood and a negative Rh factor (Rh-) can donate blood to any person with any blood type. Their data show that 43% of people have type O blood and 15% of people have Rh- factor; 52% of people have type O or Rh- factor.
- Find the probability that a person has both type O blood and the Rh- factor.
- Find the probability that a person does NOT have both type O blood and the Rh- factor.
-
P(type O OR Rh-) = P(type O) + P(Rh-) – P(type O AND Rh-)
0.52 = 0.43 + 0.15 – P(type O AND Rh-); solve to find P(type O AND Rh-) = 0.06
6% of people have type O, Rh- blood
-
P(NOT(type O AND Rh-)) = 1 – P(type O AND Rh-) = 1 – 0.06 = 0.94
94% of people do not have type O, Rh- blood
26. At a college, 72% of courses have final exams and 46% of courses require research papers. Suppose that 32% of courses have a research paper and a final exam. Let F be the event that a course has a final exam. Let R be the event that a course requires a research paper.
- Find the probability that a course has a final exam or a research project.
- Find the probability that a course has NEITHER of these two requirements.
27. In a box of assorted cookies, 36% contain chocolate and 12% contain nuts. Of those, 8% contain both chocolate and nuts. Sean is allergic to both chocolate and nuts.
- Find the probability that a cookie contains chocolate or nuts (he can’t eat it).
- Find the probability that a cookie does not contain chocolate or nuts (he can eat it).
- Let C = be the event that the cookie contains chocolate. Let N = the event that the cookie contains nuts.
- P(C OR N) = P(C) + P(N) – P(C AND N) = 0.36 + 0.12 – 0.08 = 0.40
- P(NEITHER chocolate NOR nuts) = 1 – P(C OR N) = 1 – 0.40 = 0.60
28. A college finds that 10% of students have taken a distance learning class and that 40% of students are part time students. Of the part time students, 20% have taken a distance learning class. Let D = event that a student takes a distance learning class and E = event that a student is a part time student
- Find P(D AND E).
- Find P(E|D).
- Find P(D OR E).
- Using an appropriate test, show whether D and E are independent.
- Using an appropriate test, show whether D and E are mutually exclusive.
References
Image References
Figure 3.14: Figure 3.12 from OpenStax Introductory Statistics (2013) (CC BY 4.0). Retrieved from https://openstax.org/books/introductory-statistics/pages/3-homework
Figure 3.17: Figure 3.10 from OpenStax Introductory Statistics (2013) (CC BY 4.0). Retrieved from https://openstax.org/books/introductory-statistics/pages/3-practice
Figure 3.18: Figure 3.11 from OpenStax Introductory Statistics (2013) (CC BY 4.0). Retrieved from https://openstax.org/books/introductory-statistics/pages/3-homework
Figure 3.36: Figure 3.10 from OpenStax Introductory Statistics (2013) (CC BY 4.0). Retrieved from https://openstax.org/books/statistics/pages/3-5-tree-and-venn-diagrams
Figure 3.37: Figure 3.13 from OpenStax Introductory Statistics (2013) (CC BY 4.0). Retrieved from https://openstax.org/books/statistics/pages/3-5-tree-and-venn-diagrams
Figure 3.38: Figure from OpenStax Introductory Statistics (2013) (CC BY 4.0). Retrieved from https://openstax.org/books/statistics/pages/3-5-tree-and-venn-diagrams
Figure 3.39: Figure 3.12 from OpenStax Introductory Statistics (2013) (CC BY 4.0). Retrieved from https://openstax.org/books/statistics/pages/3-5-tree-and-venn-diagrams
Figure 3.40: Figure 3.14 from OpenStax Introductory Statistics (2013) (CC BY 4.0). Retrieved from https://openstax.org/books/statistics/pages/3-5-tree-and-venn-diagrams
Figure 3.41: Figure from OpenStax Introductory Statistics (2013) (CC BY 4.0). Retrieved from https://openstax.org/books/statistics/pages/3-5-tree-and-venn-diagrams
Figure 3.42: Figure 3.16 from OpenStax Introductory Statistics (2013) (CC BY 4.0). Retrieved from https://openstax.org/books/statistics/pages/3-5-tree-and-venn-diagrams
Figure 3.43: Figure 3.18 from OpenStax Introductory Statistics (2013) (CC BY 4.0). Retrieved from https://openstax.org/books/statistics/pages/3-5-tree-and-venn-diagrams
Figure 3.44: Figure 3.15 from OpenStax Introductory Statistics (2013) (CC BY 4.0). Retrieved from https://openstax.org/books/introductory-statistics/pages/3-solutions#element-750-solution
Figure 3.45: Figure 3.6.1 from LibreTexts Math 40: Statistics and Probability (2020) (CC BY 4.0). Retrieved from https://stats.libretexts.org/Courses/Las_Positas_College/Math_40%3A_Statistics_and_Probability/04%3A_Probability_and_Counting/4.E%3A_Probability_Topics_(Optional_Exercises)
Figure 3.46: Figure 3.24 from OpenStax Introductory Statistics (2013) (CC BY 4.0). Retrieved from https://openstax.org/books/statistics/pages/3-solutions
Figure 3.51: Figure 3.17 from OpenStax Introductory Statistics (2013) (CC BY 4.0). Retrieved from https://openstax.org/books/introductory-statistics/pages/3-solutions#element-456-solution
Figure 3.59: Figure 3.4.1 from LibreTexts Introductory Statistics (2020) (CC BY 4.0). Retrieved from https://stats.libretexts.org/Bookshelves/Introductory_Statistics/Exercises_(Introductory_Statistics)/Exercises%3A_OpenStax/03.E%3A_Probability_Topics_(Exercises)
Text
“Countries List by Continent.” Worldatlas, 2013. Available online at http://www.worldatlas.com/cntycont.htm (accessed May 2, 2013).
Lopez, Shane, Preety Sidhu. “U.S. Teachers Love Their Lives, but Struggle in the Workplace.” Gallup Wellbeing, 2013. http://www.gallup.com/poll/161516/teachers-love-lives-struggle-workplace.aspx (accessed May 2, 2013).
Data from Gallup. Available online at www.gallup.com/ (accessed May 2, 2013).
“Blood Types.” American Red Cross, 2013. Available online at http://www.redcrossblood.org/learn-about-blood/blood-types (accessed May 3, 2013).
Data from the National Center for Health Statistics, part of the United States Department of Health and Human Services.
Data from United States Senate. Available online at www.senate.gov (accessed May 2, 2013).
Haiman, Christopher A., Daniel O. Stram, Lynn R. Wilkens, Malcom C. Pike, Laurence N. Kolonel, Brien E. Henderson, and Loīc Le Marchand. “Ethnic and Racial Differences in the Smoking-Related Risk of Lung Cancer.” The New England Journal of Medicine, 2013. Available online at http://www.nejm.org/doi/full/10.1056/NEJMoa033250 (accessed May 2, 2013).
“United States: Uniform Crime Report – State Statistics from 1960–2011.” The Disaster Center. Available online at http://www.disastercenter.com/crime/ (accessed May 2, 2013).
Data from Clara County Public H.D.
Data from the American Cancer Society.
Data from The Data and Story Library, 1996. Available online at http://lib.stat.cmu.edu/DASL (accessed May 2, 2013).
Data from the Federal Highway Administration, part of the United States Department of Transportation.
Data from the United States Census Bureau, part of the United States Department of Commerce.
Data from USA Today.
“Environment.” The World Bank, 2013. Available online at http://data.worldbank.org/topic/environment (accessed May 2, 2013).
“Search for Datasets.” Roper Center: Public Opinion Archives, University of Connecticut., 2013. Available online at http://www.ropercenter.uconn.edu/data_access/data/search_for_datasets.html (accessed May 12, 2013).
Rider, David, “Ford support plummeting, poll suggests,” The Star, September 14, 2011. Available online at http://www.thestar.com/news/gta/2011/09/14/ford_support_plummeting_poll_suggests.html (accessed May 2, 2013).
“Mayor’s Approval Down.” News Release by Forum Research Inc. Available online at http://www.forumresearch.com/forms/News Archives/News Releases/74209_TO_Issues_-_Mayoral_Approval_%28Forum_Research%29%2820130320%29.pdf (accessed May 2, 2013).
“Roulette.” Wikipedia. Available online at http://en.wikipedia.org/wiki/Roulette (accessed May 2, 2013).
Shin, Hyon B., Robert A. Kominski. “Language Use in the United States: 2007.” United States Census Bureau. Available online at http://www.census.gov/hhes/socdemo/language/data/acs/ACS-12.pdf (accessed May 2, 2013).
Data from the Baseball-Almanac, 2013. Available online at www.baseball-almanac.com (accessed May 2, 2013).
Data from U.S. Census Bureau.
Data from the Wall Street Journal.
Data from The Roper Center: Public Opinion Archives at the University of Connecticut. Available online at http://www.ropercenter.uconn.edu/ (accessed May 2, 2013).
Data from Field Research Corporation. Available online at https://web.archive.org/web/20130512064934/http://www.field.com/fieldpollonline (accessed May 12, 2013).
Roulette Image: film8ker/wikibooks
- Data from San Jose Mercury News ↵
- Haiman, Christopher A., Daniel O. Stram, Lynn R. Wilkens, Malcom C. Pike, Laurence N. Kolonel, Brien E. Henderson, and Loīc Le Marchand. “Ethnic and Racial Differences in the Smoking-Related Risk of Lung Cancer.” The New England Journal of Medicine, 2013. Available online at http://www.nejm.org/doi/full/10.1056/NEJMoa033250 (accessed May 2, 2013). ↵
- United States: Uniform Crime Report – State Statistics from 1960–2011.” The Disaster Center. Available online at http://www.disastercenter.com/crime/ (accessed May 2, 2013). ↵
- Haiman, Christopher A., Daniel O. Stram, Lynn R. Wilkens, Malcom C. Pike, Laurence N. Kolonel, Brien E. Henderson, and Loīc Le Marchand. “Ethnic and Racial Differences in the Smoking-Related Risk of Lung Cancer.” The New England Journal of Medicine, 2013. Available online at http://www.nejm.org/doi/full/10.1056/NEJMoa033250 (accessed May 2, 2013). ↵
- “Blood Types.” American Red Cross, 2013. Available online at http://www.redcrossblood.org/learn-about-blood/bloodtypes (accessed May 3, 2013). ↵
- Samuel, T. M. “Strange Facts about RH Negative Blood.” Healthfully, 2017. Available online at https://healthfully.com/strange-rh-negative-blood-5552003.html (accessed January 26, 2021). ↵
- Data from the American Cancer Society ↵
- Data from the Federal Highway Administration, part of the United States Department of Transportation. ↵
- Data from the Federal Highway Administration, part of the United States Department of Transportation. ↵
- Data from Clara County Public H.D ↵
- Data from United States Senate. Available online at www.senate.gov (accessed May 2, 2013). ↵
- Data from the Baseball-Almanac, 2013. Available online at www.baseball-almanac.com (accessed May 2, 2013). ↵
- Data from the San Jose Mercury News. ↵
- DiCamillo, Mark, Mervin Field. “The File Poll.” Field Research Corporation. Available online at https://web.archive.org/web/20130512064934/http://www.field.com/fieldpollonline/subscribers/Rls2443.pdf (accessed May 12, 2013). ↵
- Rider, David, “Ford support plummeting, poll suggests,” The Star, September 14, 2011. Available online at http://www.thestar.com/news/gta/2011/09/14/ford_support_plummeting_poll_suggests.html (accessed May 2, 2013). ↵
- “Roulette.” Wikipedia. Available online at http://en.wikipedia.org/wiki/Roulette (accessed May 2, 2013). ↵
- Shin, Hyon B., Robert A. Kominski. “Language Use in the United States: 2007.” United States Census Bureau. Available online at http://www.census.gov/hhes/socdemo/language/data/acs/ACS-12.pdf (accessed May 2, 2013). ↵
- Data from the Baseball-Almanac, 2013. Available online at www.baseball-almanac.com (accessed May 2, 2013). ↵
- “Human Blood Types.” United Blood Services, 2011. Available online at https://web.archive.org/web/20130807103902/http://www.unitedbloodservices.org/learnMore.aspx (accessed August 22, 2013). ↵
The study of randomness; a number between zero and one, inclusive, that gives the likelihood that a specific event will occur
A random experiment where the result is not predetermined
A particular result of an experiment
The set of all possible outcomes of an experiment
A single outcome, or subset of outcomes, of an experiment that you are interested in
A mathematical representation of a random process that lists all possible outcomes and assigns probabilities to each of them
As the number of trials in a probability experiment increases, the relative frequency of an event approaches the theoretical probability
Two events that cannot happen at the same; they share no common outcomes
The occurrence of one event has no effect on the probability of the occurrence of another event
The complement of an event consists of all outcomes in a sample space that are NOT in the event
The shared or common outcomes of two events
The likelihood that an event will occur given knowledge of another event
A table in a matrix format that displays the frequency distribution of different variables
Diagram that helps calculate and organize the number of possible outcomes of an event or problem
A diagram that shows all possible relations between a collection of different sets
The set of all outcomes in two (or more) events
