1.4 Designed Experiments
Observational Studies vs. Experiments
Ignoring anecdotal evidence, there are two primary types of data collection: observational studies and controlled (designed) experiments. Remember, we typically cannot make claims of causality from observation studies because of the potential presence of confounding factors. However, making causal conclusions based on experiments is often reasonable by controlling for those factors. Consider the following example:
Suppose you want to investigate the effectiveness of vitamin D in preventing disease. You recruit a group of subjects and ask them if they regularly take vitamin D. You notice that the subjects who take vitamin D exhibit better health on average than those who do not. Does this prove that vitamin D is effective in disease prevention? It does not. There are many differences between the two groups compared in addition to vitamin D consumption. People who take vitamin D regularly often take other steps to improve their health: exercise, diet, other vitamin supplements, choosing not to smoke. Any one of these factors could be influencing health. As described, this study does not necessarily prove that vitamin D is the key to disease prevention.
Experiments ultimately provide evidence to make decisions, so how could we narrow our focus and make claims of causality? In this section, you will learn important aspects of experimental design.
Designed Experiments
The purpose of an experiment is to investigate the relationship between two variables. When one variable causes change in another, we call the first variable the explanatory variable. The affected variable is called the response variable. In a randomized experiment, the researcher manipulates values of the explanatory variable and measures the resulting changes in the response variable. The different values of the explanatory variable may be called treatments. An experimental unit is a single object or individual to be measured.
The main principles we want to follow in experimental design are:
- Randomization
- Replication
- Control
Randomization
In order to provide evidence that the explanatory variable is indeed causing the changes in the response variable, it is necessary to isolate the explanatory variable. The researcher must design their experiment in such a way that there is only one difference between groups being compared: the planned treatments. This is accomplished by randomization of experimental units to treatment groups. When subjects are assigned treatments randomly, all of the potential lurking variables are spread equally among the groups. At this point the only difference between groups is the one imposed by the researcher. Different outcomes measured in the response variable, therefore, must be a direct result of the different treatments. In this way, an experiment can show an apparent cause-and-effect connection between the explanatory and response variables.
Recall our previous example of investigating the effectiveness of vitamin D in preventing disease. Individuals in our trial could be randomly assigned, perhaps by flipping a coin, into one of two groups: The control group (no treatment) and the second group receives extra doses of Vitamin D.
Replication
The more cases researchers observe, the more accurately they can estimate the effect of the explanatory variable on the response. In a single study, we replicate by collecting a sufficiently large sample. Additionally, a group of scientists may replicate an entire study to verify an earlier finding. Having individuals experience a treatment more than once, called repeated measures is often helpful as well.
Control
The power of suggestion can have an important influence on the outcome of an experiment. Studies have shown that the expectation of the study participant can be as important as the actual medication. In one study of performance-enhancing drugs, researchers noted:
Results showed that believing one had taken the substance resulted in [performance] times almost as fast as those associated with consuming the drug itself. In contrast, taking the drug without knowledge yielded no significant performance increment. [1]
It is often difficult to isolate the effects of the explanatory variable. To counter the power of suggestion, researchers set aside one treatment group as a control group. This group is given a placebo treatment–a treatment that cannot influence the response variable. The control group helps researchers balance the effects of being in an experiment with the effects of the active treatments. Of course, if you are participating in a study and you know that you are receiving a pill which contains no actual medication, then the power of suggestion is no longer a factor. Blinding in a randomized experiment preserves the power of suggestion. When a person involved in a research study is blinded, he does not know who is receiving the active treatment(s) and who is receiving the placebo treatment. A double-blind experiment is one in which both the subjects and the researchers involved with the subjects are blinded.
Randomized experiments are an essential tool in research. The US Food and Drug Administration typically requires that a new drug can only be marketed after two independently conducted randomized trials confirm its safety and efficacy; the European Medicines Agency has a similar policy. Large randomized experiments in medicine have provided the basis for major public health initiatives. In 1954 approximately 750,000 children participated in a randomized study comparing the polio vaccine with a placebo. In the United States, the results of the study quickly led to the widespread and successful use of the vaccine for polio prevention.
Example
How does sleep deprivation affect your ability to drive? A recent study measured the effects on 19 professional drivers. Each driver participated in two experimental sessions: one after normal sleep and one after 27 hours of total sleep deprivation. The treatments were assigned in random order. In each session, performance was measured on a variety of tasks including a driving simulation.
Your turn!
The Smell & Taste Treatment and Research Foundation conducted a study to investigate whether smell can affect learning. Subjects completed mazes multiple times while wearing masks. They completed the pencil and paper mazes three times wearing floral-scented masks, and three times with unscented masks. Participants were assigned at random to wear the floral mask during the first three trials or during the last three trials. For each trial, researchers recorded the time it took to complete the maze and the subject’s impression of the mask’s scent: positive, negative, or neutral.
More Experimental Design
There are many different experimental designs from the most basic, a single treatment and control group, to some very complicated designs. In an experimental design setting, when working with more than one variable, or treatment, they are often called factors, especially if it is categorical. The values of factors are are often called levels . When there are multiple factors, the combinations of each of the levels are called treatment combinations, or interactions. Some basic ones you may see are:
Completely Randomized
While very important and an essential research tool, not much explanation is needed for this design. It involves figuring out how many treatments will be administered and randomly assigning participants to their respective groups.
Block Design
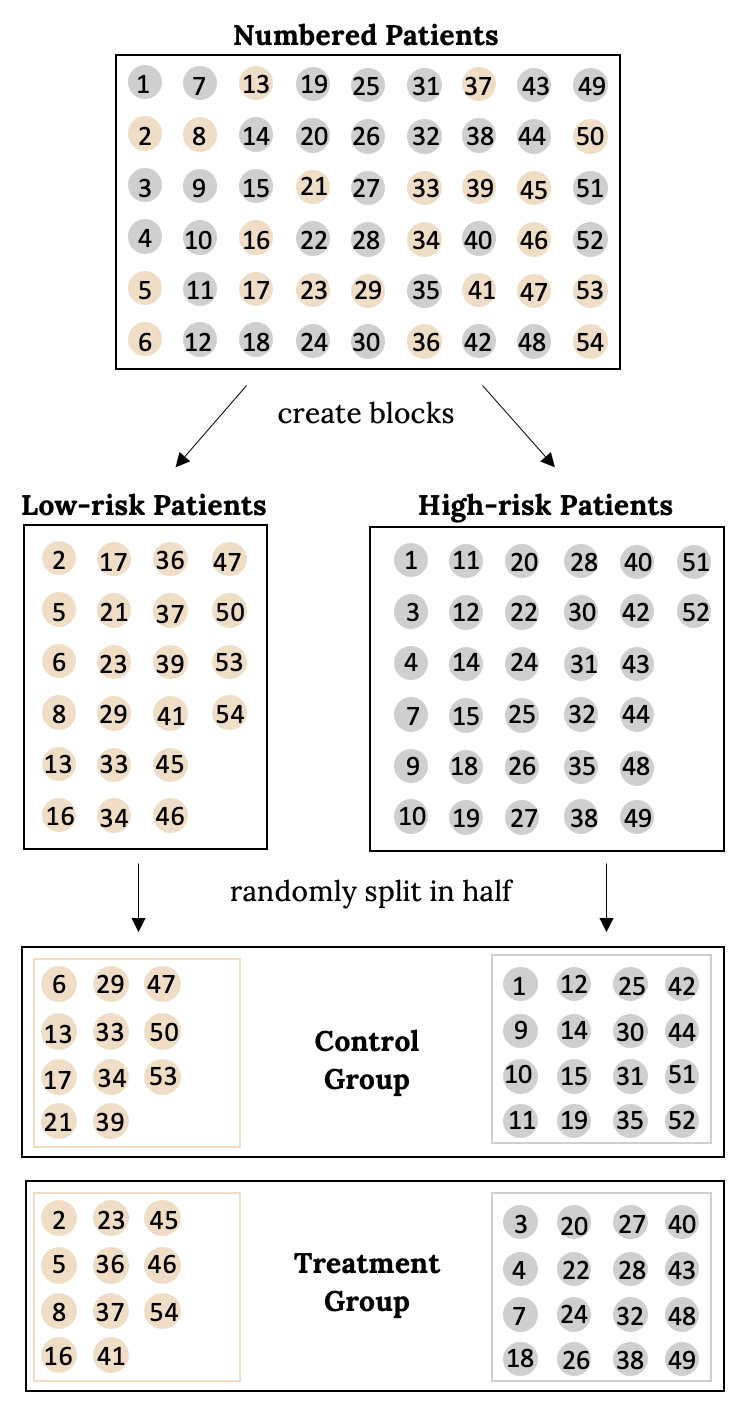
Researchers sometimes know or suspect that variables, other than the treatment, influence the response. Under these circumstances, they may first group individuals based on this variable into blocks and then randomize cases within each block to the treatment groups. This strategy is often referred to as blocking. For instance, if we are looking at the effect of a drug on heart attacks, we might first split patients in the study into low-risk and high-risk blocks, then randomly assign half the patients from each block to the control group and the other half to the treatment group, as shown in the figure below. This strategy ensures each treatment group has an equal number of low-risk and high-risk patients.
Matched Pairs
A matched pairs design is one where we have very similar individuals (or even the same individual) receiving different two treatments (or treatment vs. control), then comparing their results. This design is very powerful, however, it can be hard to find many like individuals to match up. Some common ways of creating a matched pairs design are twin studies, before and after measurements, pre and post test situations, or crossover studies. Consider the following example:
In the 2000 Olympics, was the use of a new wetsuit design responsible for an observed increase in swim velocities? In a matched pairs study designed to investigate this question, twelve competitive swimmers swam 1500 meters at maximal speed, once wearing a wetsuit and once wearing a regular swimsuit. The order of wetsuit versus swimsuit was randomized for each of the 12 swimmers. Figure 1.6 shows the average velocity recorded for each swimmer, measured in meters per second (m/s).
| swimmer.number | wet.suit.velocity | swim.suit.velocity | velocity.diff | |
| 1 | 1 | 1.57 | 1.49 | 0.08 |
| 2 | 2 | 1.47 | 1.37 | 0.10 |
| 3 | 3 | 1.42 | 1.35 | 0.07 |
| 4 | 4 | 1.35 | 1.27 | 0.08 |
| 5 | 5 | 1.22 | 1.12 | 0.10 |
| 6 | 6 | 1.75 | 1.64 | 0.11 |
| 7 | 7 | 1.64 | 1.59 | 0.05 |
| 8 | 8 | 1.57 | 1.52 | 0.05 |
| 9 | 9 | 1.56 | 1.50 | 0.06 |
| 10 | 10 | 1.53 | 1.45 | 0.08 |
| 11 | 11 | 1.49 | 1.44 | 0.05 |
| 12 | 12 | 1.51 | 1.41 | 0.10 |
Notice in this data, two sets of observations are uniquely paired so that an observation in one set matches an observation in the other; in this case, each swimmer has two measured velocities, one with a wetsuit and one with a swimsuit. A natural measure of the effect of the wetsuit on swim velocity is the difference between the measured maximum velocities (velocity.diff = wet.suit.velocity- swim.suit.velocity). Even though there are two measurements per individual, using the difference in observations as the variable of interest allows for the problem to be analyzed.
Example
A new windshield treatment claims to repel water more effectively. Ten windshields are tested by simulating rain without the new treatment. The same windshields are then treated, and the experiment is run again. What experiment design is being implemented here?
Your turn!
A new medicine is said to help improve sleep. Eight subjects are picked at random and given the medicine. The means hours slept for each person were recorded before starting the medication and after. What experiment design is being implemented here?
Image References
Figure 1.5: Kindred Grey (2020). “Block Design.” CC BY-SA 4.0. Retrieved from https://commons.wikimedia.org/wiki/File:Block_Design.png
- McClung, M. Collins, D. “Because I know it will!”: placebo effects of an ergogenic aid on athletic performance. Journal of Sport & Exercise Psychology. 2007 Jun. 29(3):382-94. Web. April 30, 2013. ↵
Data collection where no variables are manipulated
Type of experiment where variables are manipulated; data is collected in a controlled setting
The independent variable in an experiment; the value controlled by researchers
The dependent variable in an experiment; the value that is measured for change at the end of an experiment
Different values or components of the explanatory variable applied in an experiment
Any individual or object to be measured
When an individual goes through a single treatment more than once
A group in a randomized experiment that receives no (or an inactive) treatment but is otherwise managed exactly as the other groups
An inactive treatment that has no real effect on the explanatory variable
Not telling participants which treatment they are receiving
The act of blinding both the subjects of an experiment and the researchers who work with the subjects
Variables in an experiment
Certain values of variables in an experiment
Combinations of levels of variables in an experiment
Dividing participants into treatment groups randomly
Grouping individuals based on a variable into "blocks" and then randomizing cases within each block to the treatment groups
Very similar individuals (or even the same individual) receive two different two treatments (or treatment vs. control) then the difference in results are compared
