2.7 Measures of Spread
We’re now to the final key aspect of our acronym, SOCS:
- Shape
- Outliers
- Center
- Spread
A complement to the center of a distribution is the variation, variability, or spread of the data. In some data sets, the values are concentrated closely, while in others the are more spread out. Some rough measures of spread we have already seen are the range and IQR. The most common measure of spread is the standard deviation.
Similar to measures of center, the shape of the distribution and presence of extreme values can dictate what the most appropriate measure of spread is to describe the distribution.
The Interquartile Range
Recall the Interquartile Range (IQR):
IQR = Q3 – Q1.
In addition to helping us establish our fences and identify outliers, the IQR indicates the spread of the middle half or the middle 50% of the data. The IQR can be used as a somewhat rough but very robust measure of spread when outliers may be present. It is often used alongside the median to describe the center and spread of skewed distributions.
Simply showing the five number summary or a Box Plot can be a good way to get all of the information for a skewed dataset in one place
The Standard Deviation
The standard deviation is a measure of spread that measures how spread out values are from their mean. It is essentially the “average” deviation, or distance of each observation from the mean.
Not only does it provide a numerical measure of the overall amount of variation in a data set, it can also be used for other purposes
The lower case letter s represents the sample standard deviation and the lower case greek letter σ (sigma) represents the population standard deviation.
By extension, s² represents the sample variance and the lower case greek letter σ² represents the population variance. The variance is useful
The standard deviation is small when the data are all concentrated close to the mean, exhibiting little variation or spread. The standard deviation is larger when the data values are more spread out from the mean, exhibiting more variation. It must always greater than or equal to zero.
Suppose that we are studying the amount of time customers wait in line at the checkout at supermarket A and supermarket B. the average wait time at both supermarkets is five minutes. At supermarket A, the standard deviation for the wait time is two minutes; at supermarket B the standard deviation for the wait time is four minutes.
Because supermarket B has a higher standard deviation, we know that there is more variation in the wait times at supermarket B. Overall, wait times at supermarket B are more spread out from the average; wait times at supermarket A are more concentrated near the average.
Calculating the Standard Deviation
The procedure to calculate the standard deviation can be tedious and depends on whether the data are from the entire population or a sample. The calculations are similar, but not identical.
If x is a number, then the difference “x – mean” is called its deviation. In a data set, there are as many deviations as there are items in the data set. The deviations can show how spread out the data are about the mean. A positive deviation occurs when the data value is greater than the mean, whereas a negative deviation occurs when the data value is less than the mean. If the numbers belong to a population, in symbols a deviation is x – μ. For sample data, in symbols a deviation is x –  . If you add the deviations, the sum is always zero, so you cannot simply add the deviations to get the spread of the data. You can fix this by squaring the deviations, making them positive numbers, therefore sum will also be positive.
The variance is the average of the squares of the deviations (the x – values for a sample, or the x – μ values for a population). The variance, then, is the average squared deviation, which we the to get the standard deviation. The symbol σ2 represents the population variance; the population standard deviation σ is the square root of the population variance. The symbol s2 represents the sample variance; the sample standard deviation s is the square root of the sample variance. You can think of the standard deviation as a special average of the deviations.
If the numbers come from a census of the entire population and not a sample, when we calculate the average of the squared deviations to find the variance, we divide by N, the number of items in the population. If the data are from a sample rather than a population, when we calculate the average of the squared deviations, we divide by n – 1, one less than the number of items in the sample. Why not divide by n for a sample? The answer has to do with the population variance. The sample variance is an estimate of the population variance. Based on the theoretical mathematics that lies behind these calculations, dividing by (n – 1) gives a better estimate of the population variance.
Formulas
The sample standard deviation

The population standard deviation

- The variance, population (σ²) or sample (s²), can be obtained if you do not apply the square root in their respective formulas
- In practice, we typically rely on technology to calculate the standard deviation. However please notice:
- In the sample standard deviation formula, the denominator is n – 1
- In the population standard deviation formula, the denominator is N
- You may need to indicate on your technology of choice which form of the formula you want to use.
- We will often use the sample standard deviation or variance to estimate the population standard deviation or variance.
Example
In a fifth grade class, the teacher was interested in the average age and the sample standard deviation of the ages of her students. The following data are the ages for a SAMPLE of n = 20 fifth grade students. The ages are rounded to the nearest half year: 9, 9.5, 9.5, 10, 10, 10, 10, 10.5, 10.5, 10.5, 10.5, 11, 11, 11, 11, 11, 11, 11.5, 11.5, 11.5.
First, try to find the mean and standard deviation by hand. Here is a table with the intermediate steps:
| X | Deviations | Deviations2 |
|---|---|---|
| 9 | 9 – 10.525 = –1.525 | (–1.525)2 = 2.325625 |
| 9.5 | 9.5 – 10.525 = –1.025 | (–1.025)2 = 1.050625 |
| 9.5 | 9.5 – 10.525 = –1.025 | (–1.025)2 = 1.050625 |
| 10 | 10 – 10.525 = –0.525 | (–0.525)2 = 0.275625 |
| 10 | 10 – 10.525 = –0.525 | (–0.525)2 = 0.275625 |
| 10 | 10 – 10.525 = –0.525 | (–0.525)2 = 0.275625 |
| 10 | 10 – 10.525 = –0.525 | (–0.525)2 = 0.275625 |
| 10.5 | 10.5 – 10.525 = –0.025 | (–0.025)2 = 0.000625 |
| 10.5 | 10.5 – 10.525 = –0.025 | (–0.025)2 = 0.000625 |
| 10.5 | 10.5 – 10.525 = –0.025 | (–0.025)2 = 0.000625 |
| 10.5 | 10.5 – 10.525 = –0.025 | (–0.025)2 = 0.000625 |
| 11 | 11 – 10.525 = 0.475 | (0.475)2 = 0.225625 |
| 11 | 11 – 10.525 = 0.475 | (0.475)2 = 0.225625 |
| 11 | 11 – 10.525 = 0.475 | (0.475)2 = 0.225625 |
| 11 | 11 – 10.525 = 0.475 | (0.475)2 = 0.225625 |
| 11 | 11 – 10.525 = 0.475 | (0.475)2 = 0.225625 |
| 11 | 11 – 10.525 = 0.475 | (0.475)2 = 0.225625 |
| 11.5 | 11.5 – 10.525 = 0.975 | (0.975)2 = 0.950625 |
| 11.5 | 11.5 – 10.525 = 0.975 | (0.975)2 = 0.950625 |
| 11.5 | 11.5 – 10.525 = 0.975 | (0.975)2 = 0.950625 |
| – | – | The total is 9.7375 |
Verify your answers with your choice of technology.
Your turn!
On a baseball team, the ages of each of the players are as follows:
21, 21, 22, 23, 24, 24, 25, 25, 28, 29, 29, 31, 32, 33, 33, 34, 35, 36, 36, 36, 36, 38, 38, 38, 40
First, try to find the mean and standard deviation by hand. If you get stuck or want to check your work, plug it into your calculator or use your computer software.
The standard deviation, s or σ, is either zero or larger than zero. Describing the data with reference to the spread is called “variability”. The variability in data depends upon the method by which the outcomes are obtained; for example, by measuring or by random sampling. When the standard deviation is zero, there is no spread; that is, the all the data values are equal to each other. The standard deviation is small when the data are all concentrated close to the mean, and is larger when the data values show more variation from the mean. When the standard deviation is a lot larger than zero, the data values are very spread out about the mean; outliers can make s or σ very large.
The Standard Deviation in Context
The standard deviation, when first presented, can seem unclear. By graphing your data, you can get a better “feel” for the deviations and the standard deviation. You will find that in symmetrical distributions, the standard deviation can be very helpful but in skewed distributions, the standard deviation may not be much help. The reason is that the two sides of a skewed distribution have different spreads. In a skewed distribution, it is better to look at the first quartile, the median, the third quartile, the smallest value, and the largest value. Because numbers can be confusing, always graph your data. Display your data in a histogram or a box plot.
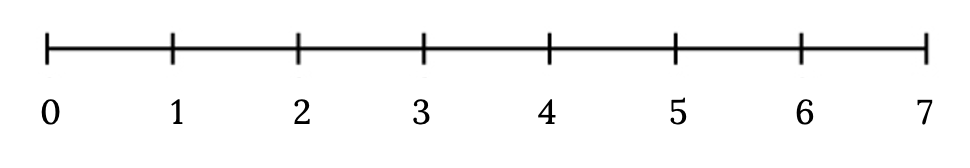
A number line may also help you understand standard deviation. If we were to put five and seven on a number line, seven is to the right of five. We say, then, that seven is one standard deviation to the right of five because 5 + (1)(2) = 7.
If one were also part of the data set, then one is two standard deviations to the left of five because 5 + (–2)(2) = 1.
- In general, a value = mean + (#ofSTDEV)(standard deviation)
- where #ofSTDEVs = the number of standard deviations
- #ofSTDEV does not need to be an integer
- One is two standard deviations less than the mean of five because: 1 = 5 + (–2)(2).
The equation value = mean + (#ofSTDEVs)(standard deviation) can be expressed for a sample and for a population.
- Sample: x = + (#ofSTDEVs)(s)
- Population: x = μ + (#ofSTDEVs)(σ)
Example
Suppose that Rosa and Binh both shop at supermarket A. Rosa waits at the checkout counter for seven minutes and Binh waits for one minute. At supermarket A, the mean waiting time is five minutes and the standard deviation is two minutes. The standard deviation can be used to determine whether a data value is close to or far from the mean.
Rosa waits for seven minutes:
- Seven is two minutes longer than the average of five; two minutes is equal to one standard deviation.
- Rosa’s wait time of seven minutes is two minutes longer than the average of five minutes.
- Rosa’s wait time of seven minutes is one standard deviation above the average of five minutes.
Binh waits for one minute.
- One is four minutes less than the average of five; four minutes is equal to two standard deviations.
- Binh’s wait time of one minute is four minutes less than the average of five minutes.
- Binh’s wait time of one minute is two standard deviations below the average of five minutes.
Your turn!
Recall the previous example about the age of fifth grade students where = 10.525 and s² = 0.7159
b. Find the value that is one standard deviation above the mean. Find ( + 1s).
c. Find the value that is two standard deviations below the mean. Find ( – 2s).
d. Find the values that are 1.5 standard deviations from (below and above) the mean.
Z-scores
The standard deviation can also be used to calculate a measure of location called a z-score. It represents the number of Standard deviations a given observation is away from it’s mean (#ofSTDEVs above) is often denoted with just the letter z. In symbols, the formulas become:
| Sample | x = + zs |
 |
| Population | x =  + zσ + zσ |
 |
Not only are Z scores a useful measure of location for specific observations, they can also be used for other purposes. Suppose two data sets have different means and standard deviations, then comparing the data values directly can be misleading. However using Z scores, it is possible to put things on a level playing field to compare them.
- For each data value, calculate how many standard deviations away from its mean the value is.
- Use the formula: value = mean + (#ofSTDEVs)(standard deviation); solve for #ofSTDEVs.
- #ofSTDEVs =

- Compare the results of this calculation.
Example
Two students, John and Ali, from different high schools, wanted to find out who had the highest GPA when compared to his school. Which student had the highest GPA when compared to his school?
| Student | GPA | School Mean GPA | School Standard Deviation |
|---|---|---|---|
| John | 2.85 | 3.0 | 0.7 |
| Ali | 77 | 80 | 10 |
For each student, determine how many standard deviations (#ofSTDEVs) his GPA is away from the average, for his school. Pay careful attention to signs when comparing and interpreting the answer.
z = #ofSTDEVs = = 
Your turn!
Two swimmers, Angie and Beth, from different teams, wanted to find out who had the fastest time for the 50 meter freestyle when compared to her team. Which swimmer had the fastest time when compared to her team?
| Swimmer | Time (seconds) | Team Mean Time | Team Standard Deviation |
|---|---|---|---|
| Angie | 26.2 | 27.2 | 0.8 |
| Beth | 27.3 | 30.1 | 1.4 |
Identifying Unusual Values with the Standard Deviation
The following rules give more insight into how we can use the standard deviation to tell us about the distribution of the data.
Chebyshev’s Rule
- At least 75% of the data is within two standard deviations of the mean.
- At least 89% of the data is within three standard deviations of the mean.
- At least 95% of the data is within 4.5 standard deviations of the mean.
“Unusual” Observations with Z scores
Recall we have already established our Fence Rules for identifying outliers. However for many distributions, anything outside of 2 standard deviations (a Z-score below -2 or greater than 2) is considered “unusual”. Considering data to be far from the mean if it is more than two standard deviations away is more of an approximate “rule of thumb” than a rigid rule. In general, the shape of the distribution of the data affects how much of the data is further away than two standard deviations. (You will learn more about this in later chapters.)
Image References
Figure 2.50: Kindred Grey via Virginia Tech (2020). “Figure 2.50” CC BY-SA 4.0. Retrieved from https://commons.wikimedia.org/wiki/File:Figure_2.50.png . Adaptation of Figure 2.26 from OpenStax Introductory Statistics (2013) (CC BY 4.0). Retrieved from https://openstax.org/books/statistics/pages/2-7-measures-of-the-spread-of-the-data
The level of variability or dispersion of a dataset; also commonly known as variation/variability
The average distance (deviation) of each observation from the mean
A subset of the population studied
The whole group of individuals who can be studied to answer a research question
The square of the standard deviation; a computational step along the way to calculating the standard deviation
A measure of location that tells us how many standard deviations a value is above or below the mean
