6 Chapter 6: Adding Data to a Project in ArcGIS
Introduction
This chapter covers how to add data to a map project and briefly discusses the differences between vector and raster data.
Types of Data
A GIS supports two basic spatial data types—vector and raster data. All vector data and some raster data can be used in analyses. JPEG and BMP (rasters), spreadsheets, word processing documents, PDFs, and other file types can be added to the map layout view—but only for display —GIS analyses cannot be performed with these file types.
Vector Data
Vectors represent discrete data and display in a GIS as points, lines, or polygons.
- A point represents a location with a set of coordinates (for example, latitude and longitude or UTM). Points have neither length nor area. In a GIS, points can be displayed with many types of symbols other than the default dot symbol and at any size, but, in actuality, they are just dimensionless points.
- Lines have length but no width or area and represent features such as transects, streams, or roads.
- Polygons are any closed shape with area, for example, a square, circle, decagon, or an irregular shape. Water bodies such as lakes and oceans or country boundaries can be represented as polygons. Depending on the map scale, some features with area might only be represented as points, such as cities on a world map. As an example of an irregular shape, see the shapes for the different counties in Figure 6.1. But when listed in the Contents pane, the polygon layer shapes under the layer name are always displayed as a square.
Point, line, and polygon layers are listed in the Contents pane and displayed in the map viewer window. In most instances, when adding data, a GIS will automatically layer polygons on the bottom, lines above polygons, and above lines are points. This is because polygons will cover (and hide from view) points and lines in the same location. Placing polygons at the bottom of the drawing order ensures that lines and points are drawn ‘over’ the polygon layers. The order of display can be manually changed.
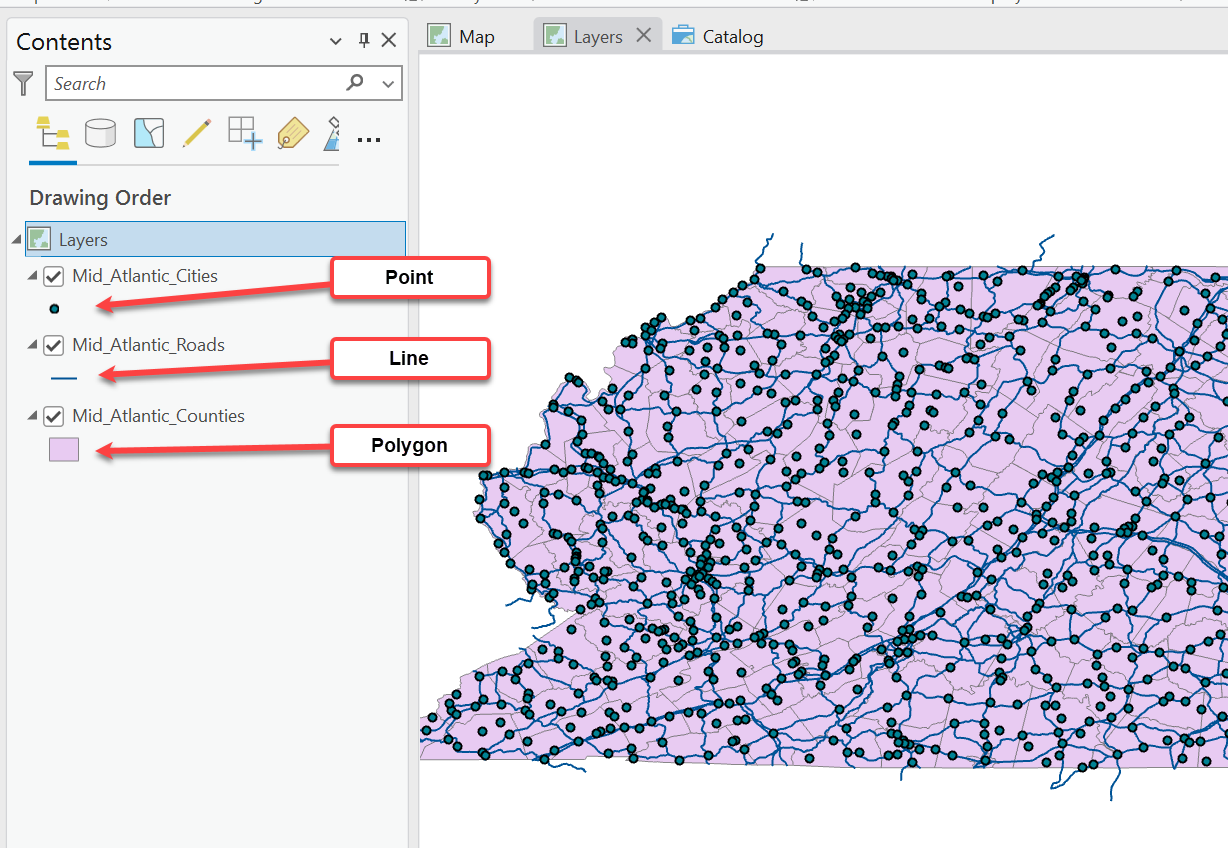
Figure 6.1. Data types
Raster Data
Rasters represent continuous data, such as elevation or weather data, across the surface of the Earth. Raster data can also include imagery, such as aerial imagery—photographs or imagery captured from a drone, plane, balloon, or satellite. Raster data is displayed as grids—columns and rows of square pixels (Figure 6.2). The size of the pixel or the ground area each pixel represents varies according to the sensor and a decision made by the data’s owner. For instance, a majority of Landsat 9 imagery, with the exception of the panchromatic and thermal channels, represents a 30-meter by 30-meter area on the ground and therefore has a resolution of 30 meters. Imagery captured by the United States Department of Agriculture National Agriculture Imagery Program (NAIP) supports pixel sizes that are typically 1-meter by 1-meter, but their actual dimensions can vary depending on the federal imagery contract and the sensor used to capture the data. Small uncrewed aircraft systems (sUAS or drones) can typically capture image resolution of 2 inches x 2 inches (or better).
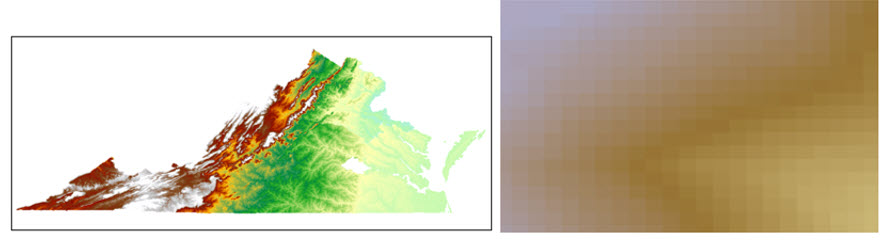
Figure 6.2. Raster data
Figure 6.2 represents Virginia’s 2002 Digital Elevation Model (DEM), with a pixel size of 30 meters by 30 meters. The entire state is illustrated on the left, while the right image shows a zoomed-in area depicting individual pixels in the Virginia DEM.
Figure 6.3 is Band 4 of a Landsat 8 image (in grayscale) projected over a portion of Virginia and West Virginia. On the left is the entire scene, and on the right, the image is zoomed in to depict individual pixels. Each pixel represents a 900 meter2 (30-meter resolution) area on the surface of the Earth.
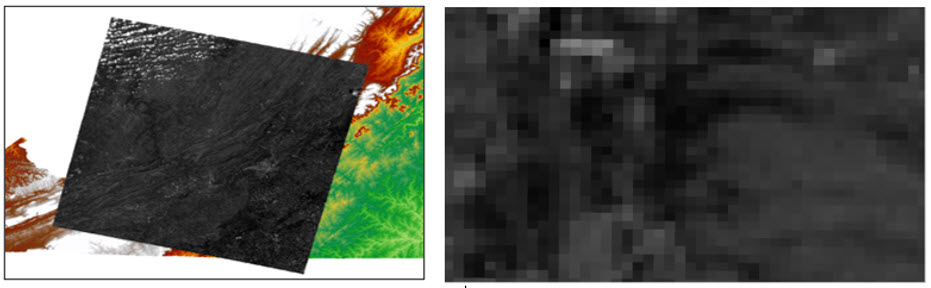
Figure 6.3. Digital elevation model
Figure 6.4 shows a NAIP Aerial Photo obtained via a GIS Server connection (see Chapter 4: Connecting to a Folder or an Online GIS Server for a review). The image is zoomed in on the right to show individual pixels (0.8-meter resolution).
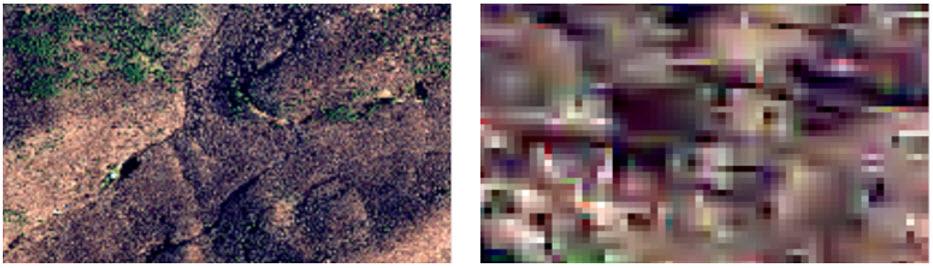 Figure 6.4. NAIP Image
Because raster data represents continuous phenomena across the surface of the Earth, a GIS automatically adds raster data to the bottom of the Contents pane—displayed underneath all vector layers (Figure 6.5). This display can be changed by dragging to reorder the layers.
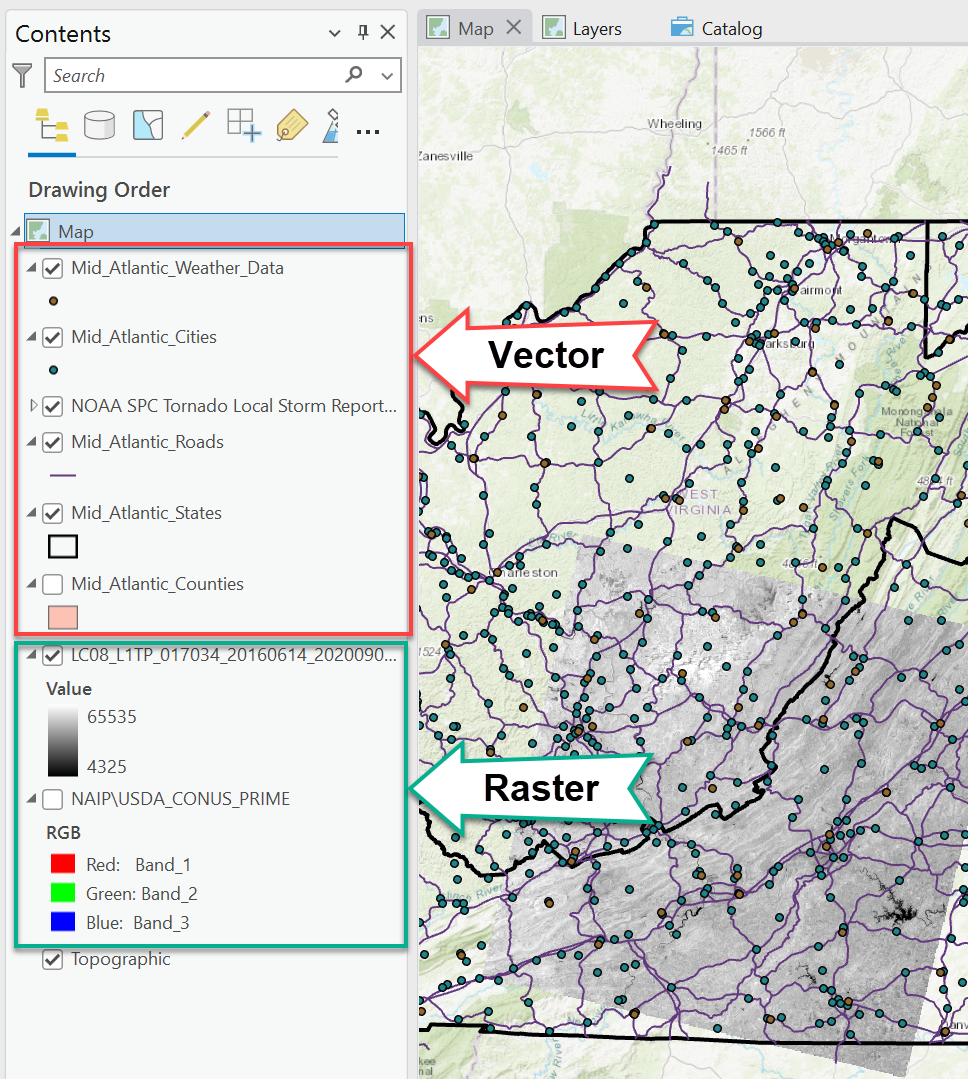
Figure 6.5. Raster and vector data shown in Contents
Again, in addition to raster and vector spatial data, GIS software supports various ‘nontraditional’ GIS data formats, including JPEG, BMP, spreadsheets, word processing documents, PDFs, and other file types. These other formats can be added to the map layout view —but are only available for display. These formats do not support GIS analyses.
Adding Data to a Map Project
Open an ArcGIS® Pro project as directed by your instructor—either the project saved from the previous chapter, or you may be directed to start a new project. We begin with the project from the last chapter.
On the toolbar, click on the Map tab, click on Add Data, and the Add Data dialogue box opens. Navigate to the folder where you stored your data, or if you completed Chapter 5 Adding Data to a Project Geodatabase, navigate to that geodatabase for your data.
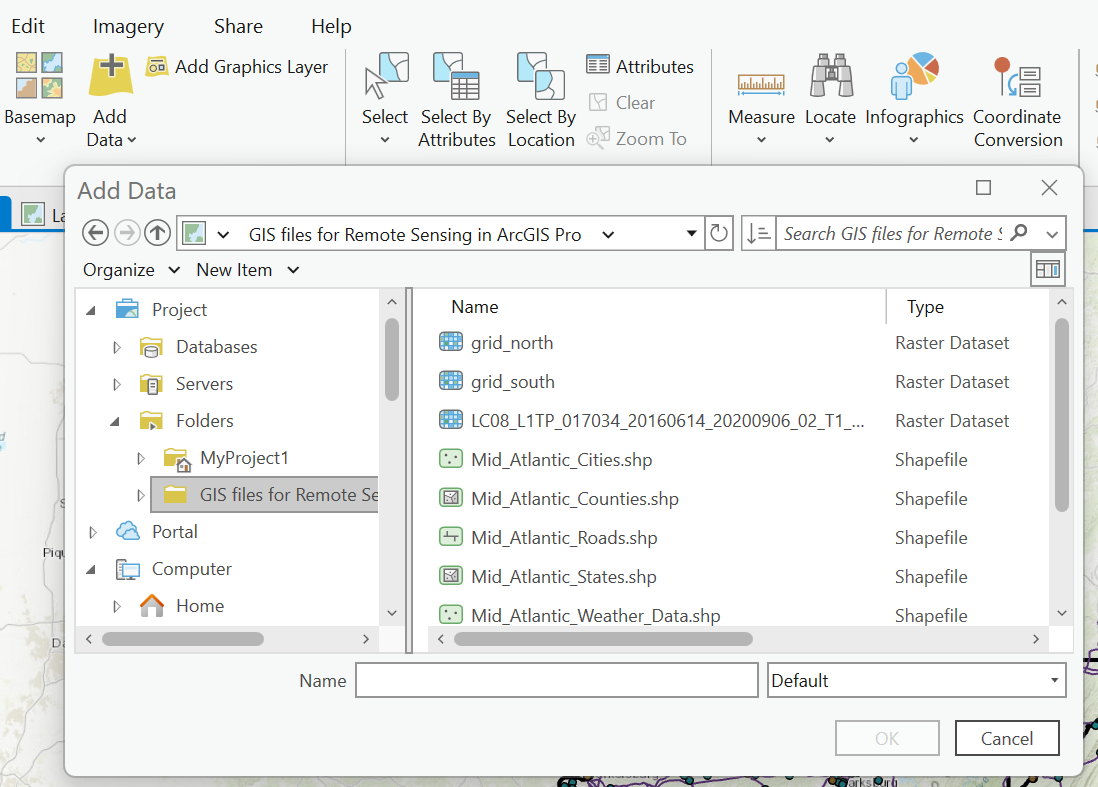
Figure 6.6. Adding data to the map
Select all data that begins with “Mid_Atlantic” (Figure 6.7). If adding multiple files, press the control button and click each file until they are all highlighted.
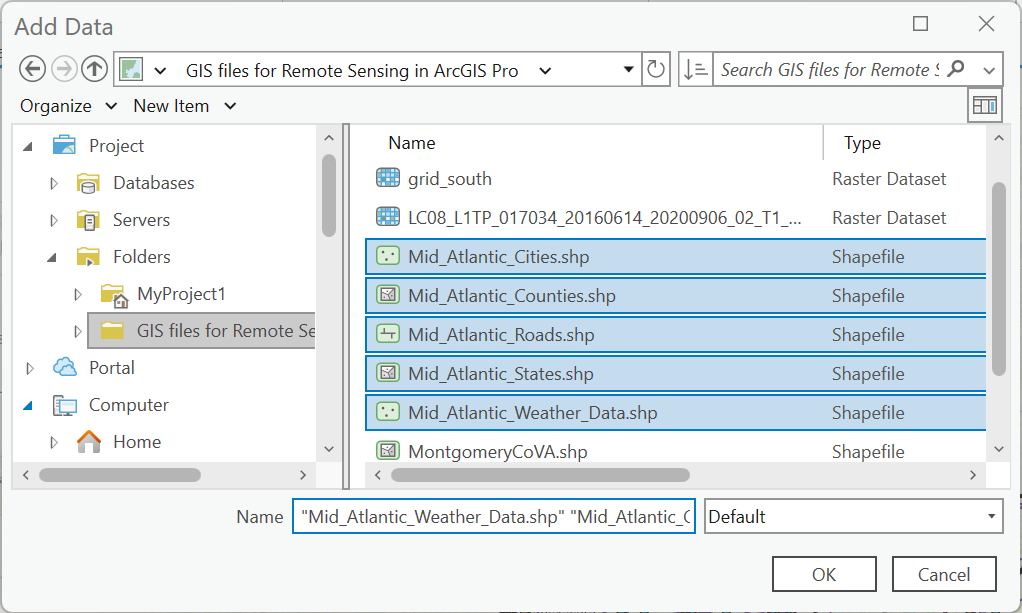
Figure 6.7. Selecting files
Once the files are selected, click OK. The data is added to the Contents so that point layers are displayed on top of line layers, which are displayed on top of polygon layers (Figure 6.8).
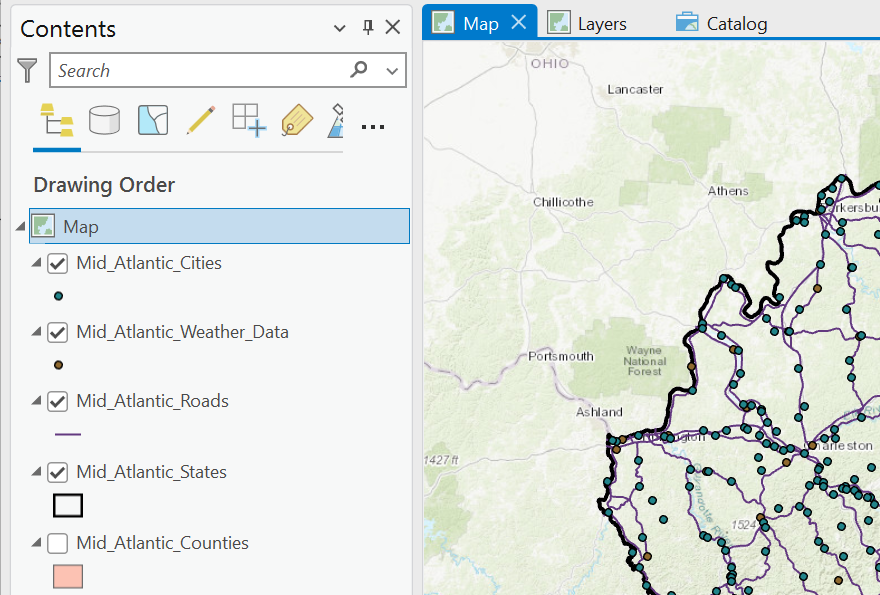
Figure 6.8. Displaying files in Contents
A raster file is added in the same manner. Remember that data can be added from different file folders on the computer. They are added separately, navigating to the individual file folder housing the data file. In Figure 6.9, we are adding a single band (Band 5) from a Landsat 9 image. Don’t worry now about what Landsat 9, or Band 5, is—we will discuss these in future chapters. For now, just understand that this satellite image is a raster, and these have different properties and are displayed differently from vector data, as discussed above. Locate this raster and add it to your map.
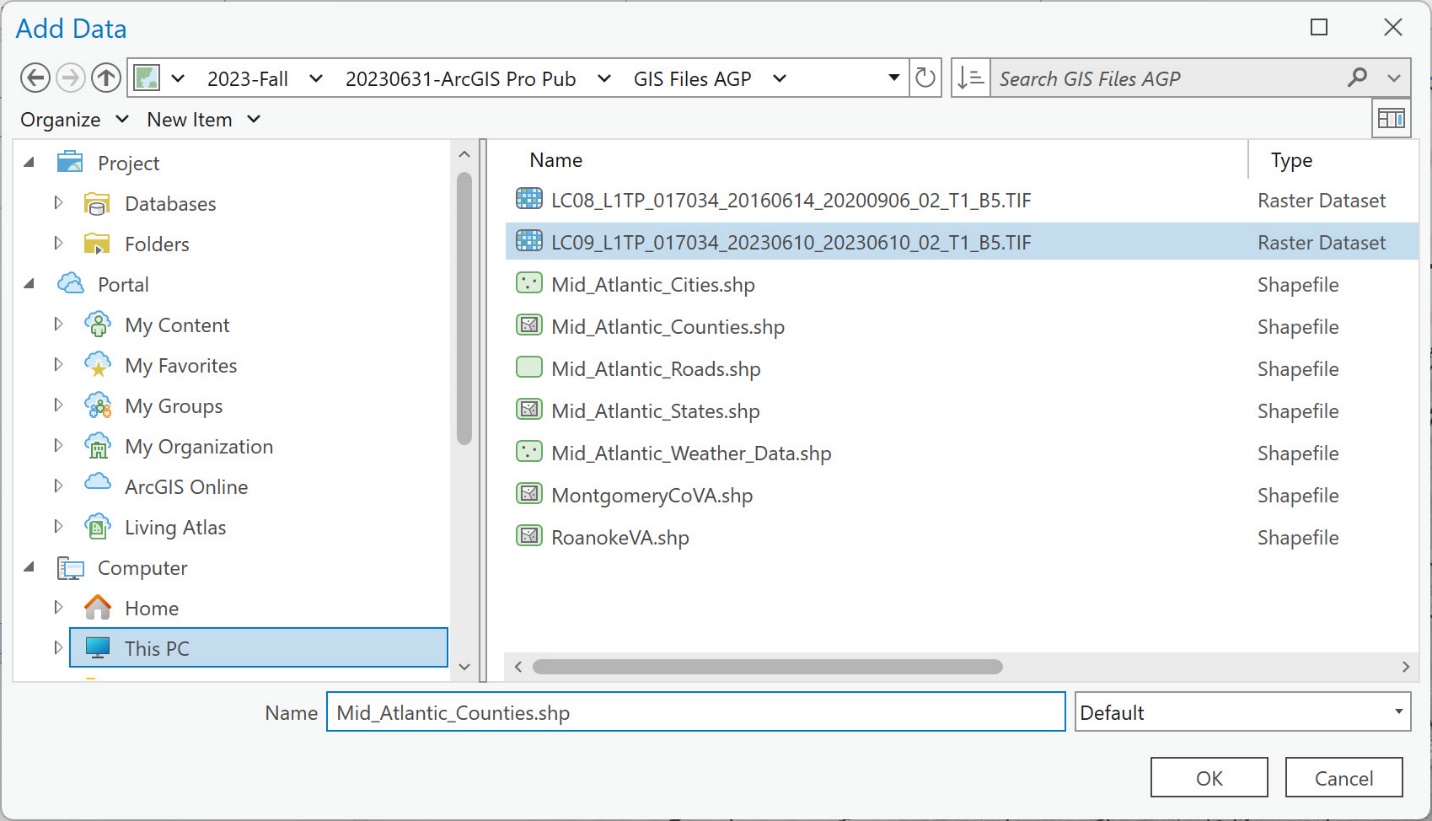 Figure 6.9. Adding raster data to the map
Figure 6.10 shows the addition of the Landsat 8 image below the Mid-Atlantic Counties shapefile and in the map viewer as a grayscale box. If you are prompted to calculate statistics, select Yes. Note that for Figure 6.10, the Counties layer was turned off, and the States layer has been made transparent (hollow) so that the raster can be seen below these layers.
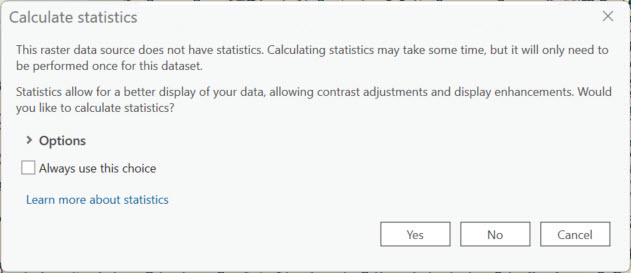
Figure 6.10. Calculating statistics
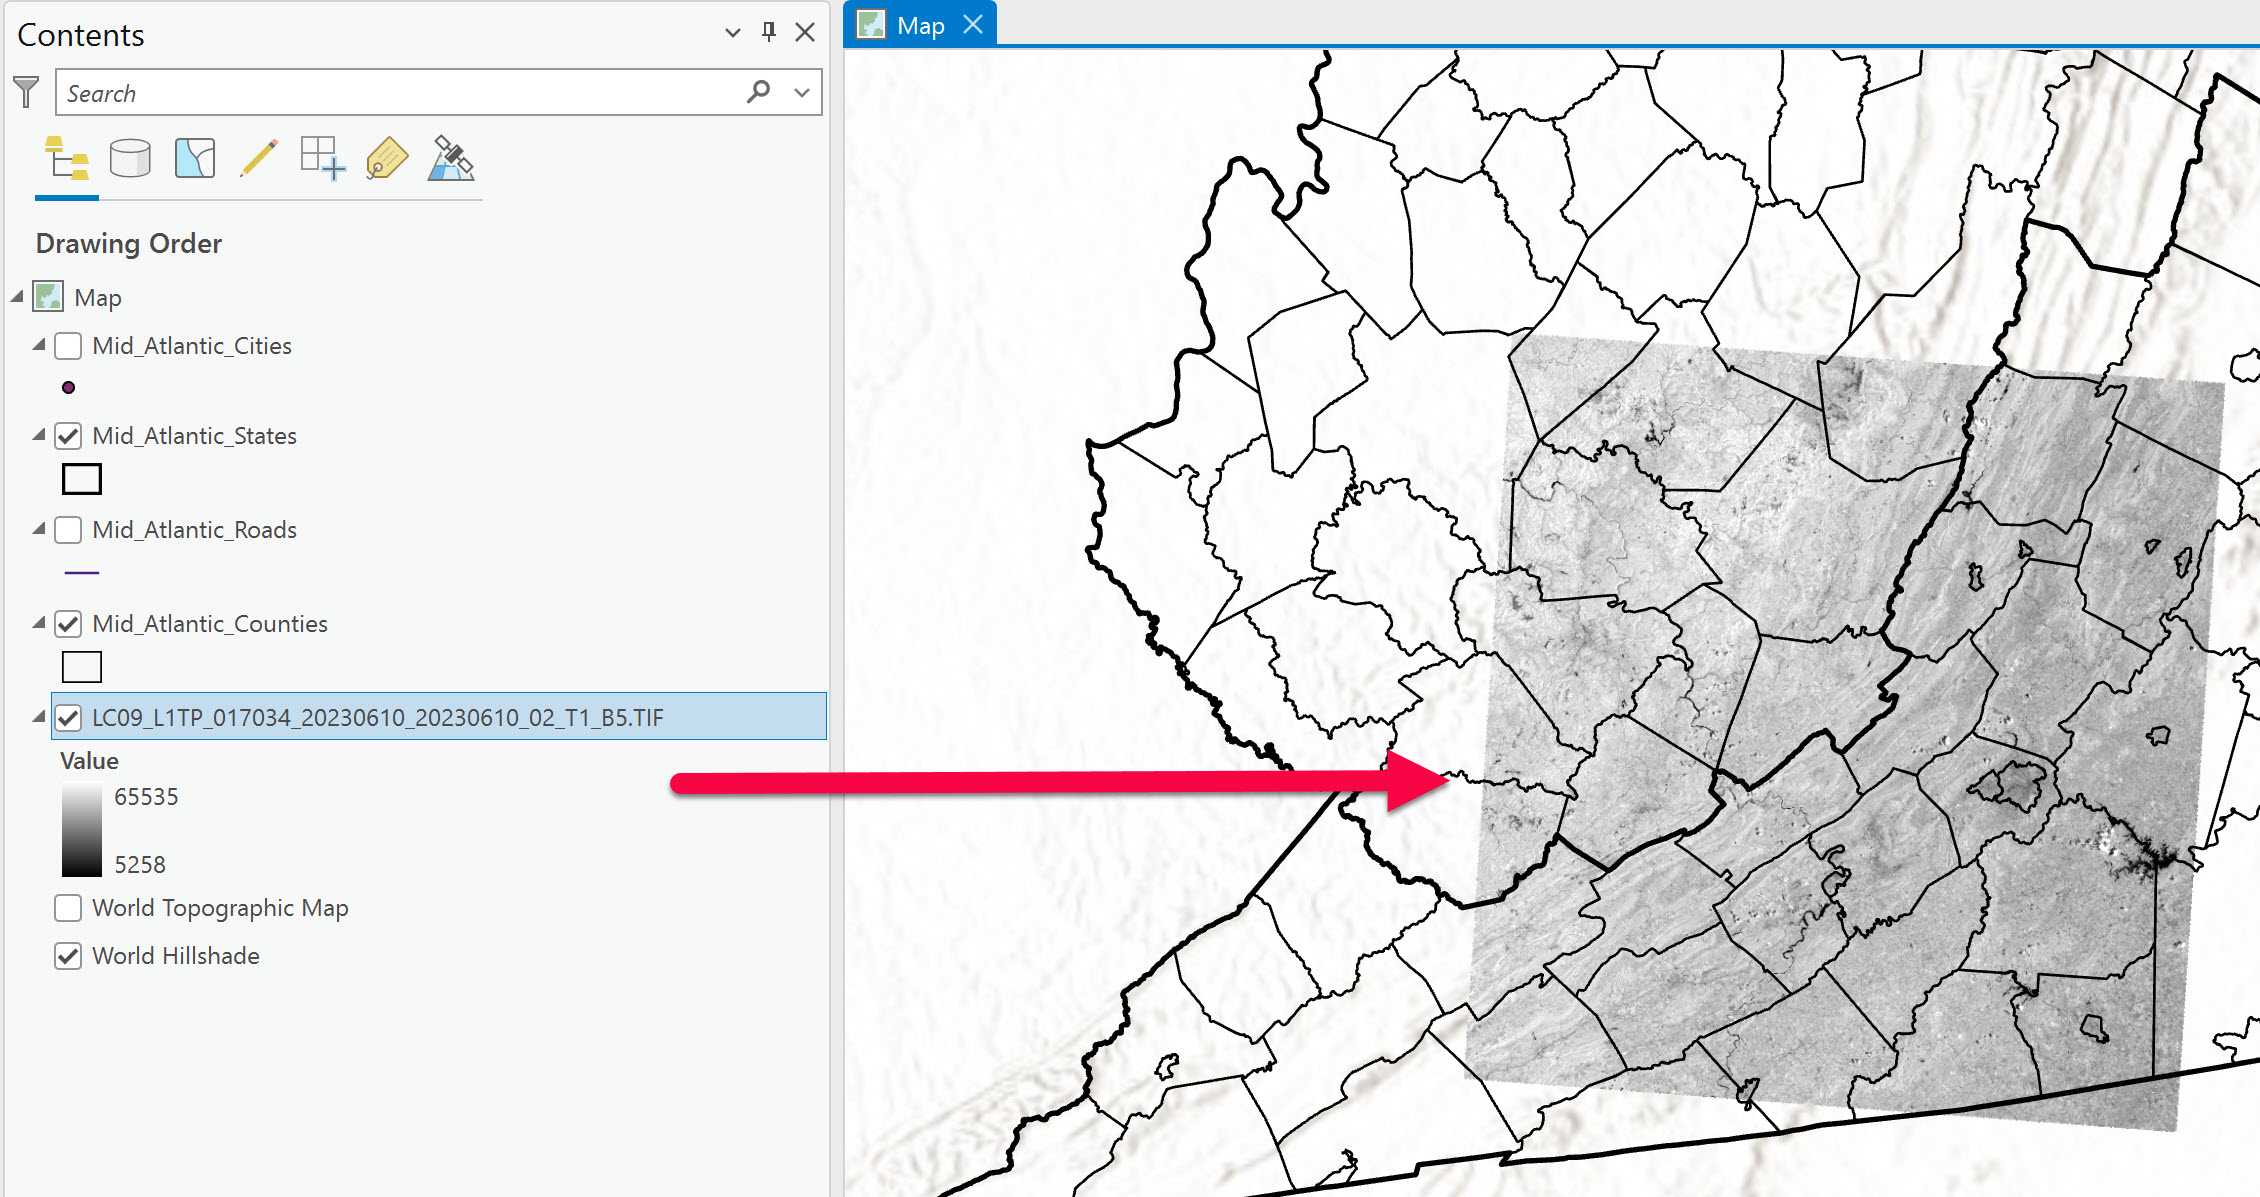
Figure 6.11. Raster data in Contents
That is all that is required to add vector and raster files to the map project.
Please note that our files have different coordinate systems and datums. We will discuss displaying data and coordinate systems in the next chapter.