10 Chapter 10: Imagery Available from the United States Geological Survey
Introduction
Remotely sensed imagery is acquired using various methods (aerial cameras, radar, lidar, satellite sensors) and aerial platforms (drones, aircraft, balloons, satellites). The United States Geological Survey (USGS) has been designated as a central clearinghouse for much of the imagery collected by the federal government, with a mission to organize imagery and facilitate its distribution to the public. The USGS library is searchable using Earth Explorer (https://earthexplorer.usgs.gov/) or The National Map (https://apps.nationalmap.gov/downloader/). Such images are available to the public for purchase or for free, depending upon the specifics of the acquisition.
Although the USGS collection is vast, it does not have a complete library of all remotely sensed Earth imagery. This chapter briefly discusses some of the data available on the sites. Because the library expands regularly, we recommend examining the sites frequently.
Remote Sensing Basics
Various characteristics categorize different forms of remotely sensed imagery. For example, Landsat and Sentinel satellite imagery consist of multiple image bands. A distinctive region of the electromagnetic spectrum, specific radiometric properties, and a specific spatial resolution characterize each image band.
The electromagnetic spectrum encompasses a range of all types of radiation (energy)—reference Figure 10.1 from NASA’s Goddard Space Flight Center website.
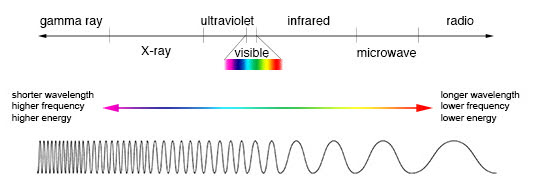
Figure 10.1 The electromagnetic spectrum. Source: NASA https://imagine.gsfc.nasa.gov/science/toolbox/emspectrum1.html
Humans can only see radiation in a very small range of the electromagnetic spectrum (the visible portion), but mechanical sensors can record radiation in wavelengths outside the visible spectrum for display and analysis by computer systems. Why is this important? Features on the Earth’s surface, such as water, soil, plants, snow, and all artificial objects, absorb and re-emit energy, conveying spectral properties that uniquely characterize the Earth’s surface and the things we observe on its surface. Because of these unique spectral properties, we can “see” and analyze Earth’s features with remotely sensed imagery using more than just visual spectral data. We discuss further specifics of spectral analysis in Chapter 19: Spectral Enhancement of Landsat 9 Imagery.
Radiometric properties refer to the “brightness” of the various features, defined by a range of brightness values used by a specific sensor. For example, an 8-bit image provides 256 brightness values, and a 16-bit image provides 65,536 brightness values. We discuss radiometric analysis in Chapter 17: Radiometric Enhancement of Landsat 9 Imagery.
Spatial properties refer to the area of the Earth’s surface covered by one pixel of the image. Spatial properties vary from sensor to sensor but also within one sensor, depending on its sensitivity to a specified region of the electromagnetic spectrum. For example, Landsat 9’s red band pixel size measures 30 meters by 30 meters, and Sentinel’s red band pixel size measures 10 meters by 10 meters. And while Landsat 9’s red band has a ground resolution of 30 meters by 30 meters, Landsat 9’s thermal band has a ground resolution of 100 meters by 100 meters. We discuss spatial resolution in Chapter 18: Spatial Enhancement of Landsat 9 Imagery.
When we compare one image to another, spectral, spatial, and radiometric properties are important. When we analyze changes in vegetation, we must compare bands with the same spectral properties.
Landsat
The U.S. Landsat program consists of a family of Earth imaging satellites, developed and maintained through a partnership between the USGS and NASA. The Landsat program retains the distinction of being the world’s longest-running system of land-observation satellites. Landsat 1 was launched in 1972, and its most recent satellite, Landsat 9 was launched on September 27, 2021 (https://www.usgs.gov/landsat-missions/landsat-9). Landsat Next is being designed with enhanced sensors and capabilities (including spatial resolution, spectral resolution, and revisit times) designed to better observe, map, and monitor our planet (Figure 10.2). Landsat Next is scheduled to launch in 2030. 
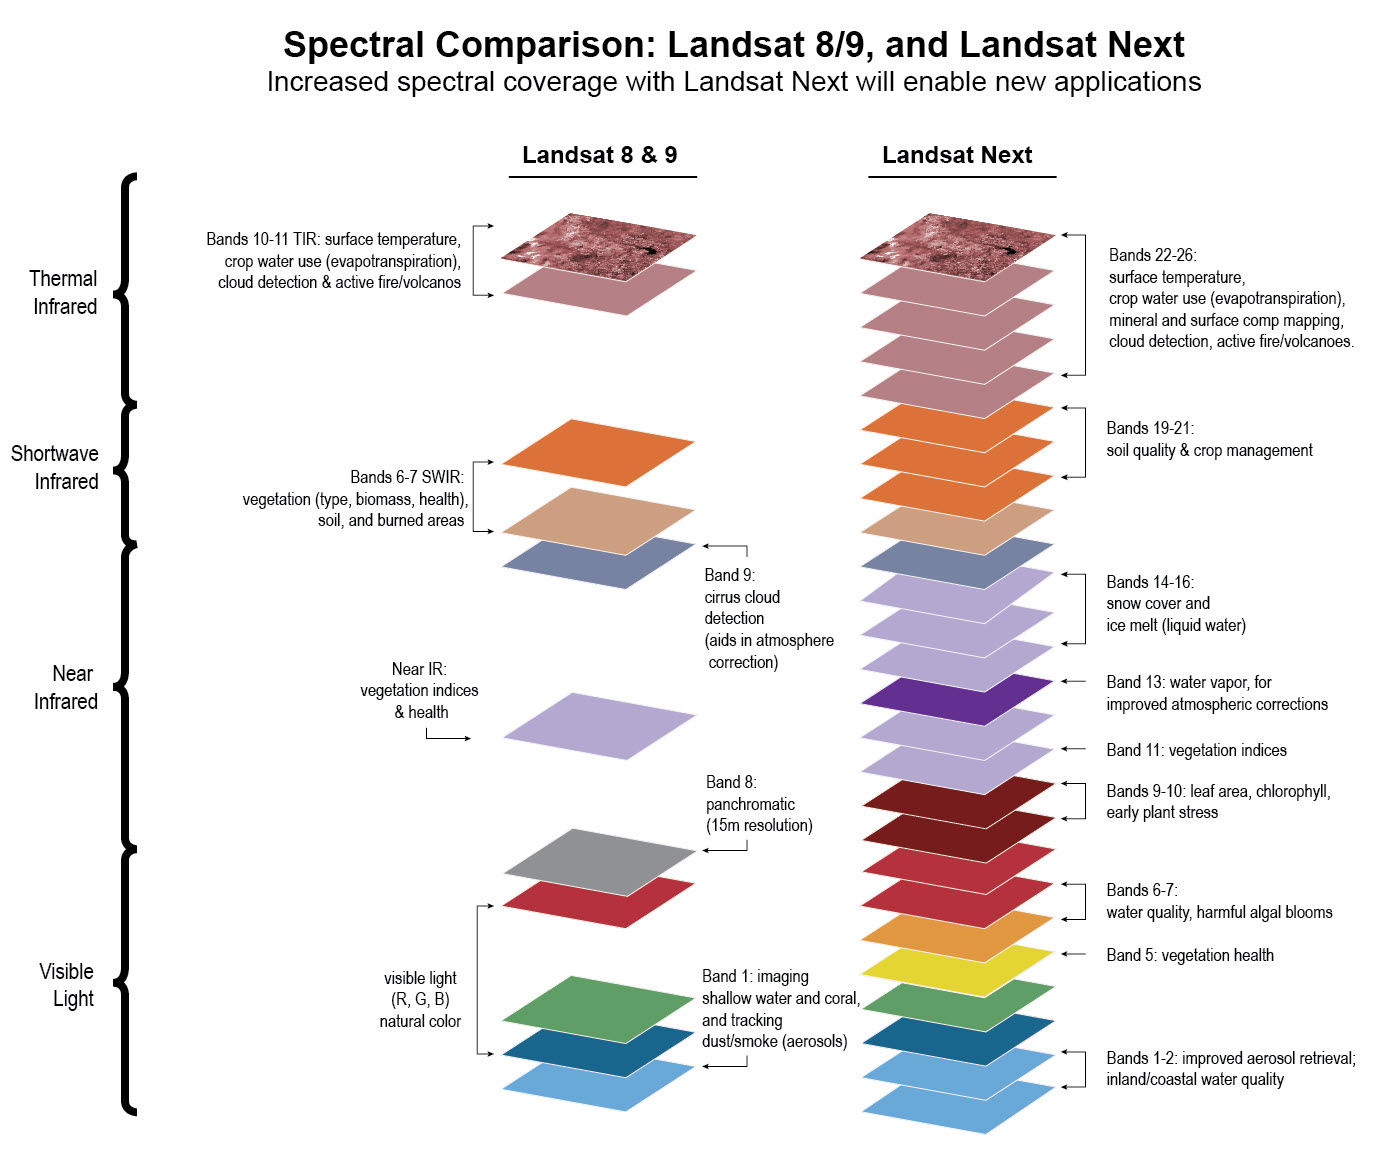
Figure 10.2: Spectral comparison of Landsat 9 and Landsat Next. Source: USGS https://www.usgs.gov/media/images/spectral-comparison-landsat-8-9-and-landsat-next
All Landsat images are available for download, at no cost, from the USGS’s Earth Explorer library. Image downloads are discussed in Chapter 11: Downloading Landsat 9 Imagery using Earth Explorer.
As with other remotely sensed imagery, distinctive regions of the electromagnetic spectrum define Landsat’s spectral bands, sometimes referred to as channels, but not all sensors cover the same regions. Landsat 8, for example, uses band definitions that differ from previous Landsat sensors. For more information about band designations, see the charts in Chapter 13 or on the USGS website at https://www.usgs.gov/faqs/what-are-band-designations-landsat-satellites. Figure 10.3 provides a visual comparison through Landsat 8. Landsat 9 sensors are the same as Landsat 8.
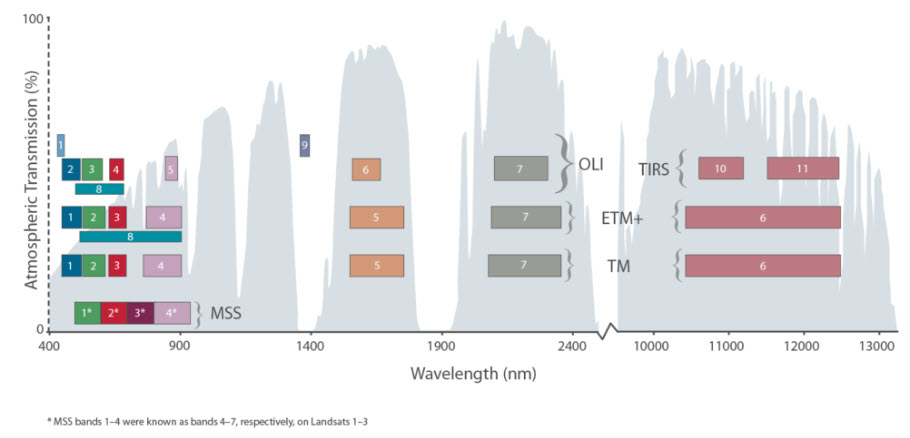
Figure 10.3. Comparison of Landsat program sensor payloads. Source: NASA. http://landsat.gsfc.nasa.gov/about/technical-information/)
For more information and specific details of Landsat satellites, sensors, and potential analyses using Landsat images, visit http://landsat.usgs.gov/.
Sentinel
Sentinel is also an Earth-imaging satellite program. The Sentinel program is designed, launched, and managed by the European Space Agency. Each Sentinel mission involves two satellites. For example, Sentinels 1-A (launched in 2014) and 1-B (launched in 2016) are radar imaging weather satellites. Sentinels 2-A (launched in 2015) and 2-B (launched in 2017) are multi-spectral high-resolution land-observation satellites comparable to the US Landsat system. The first of the Sentinel-6 satellites launched in 2020, with the second scheduled for 2025. Sentinel satellites monitor global sea level changes.
Sentinel 2 acquires images in 13 spectral bands and various spatial resolutions. See Figure 10.3 and http://www.esa.int/Our_Activities/Observing_the_Earth/Copernicus/Overview4 for more information).
As with Landsat, some Sentinel images are available to the public without cost from the European Union via the Copernicus website at https://www.copernicus.eu/en/access-data. We do not discuss downloading Sentinel imagery in this book, but the image download and analysis procedures are similar to Landsat’s.
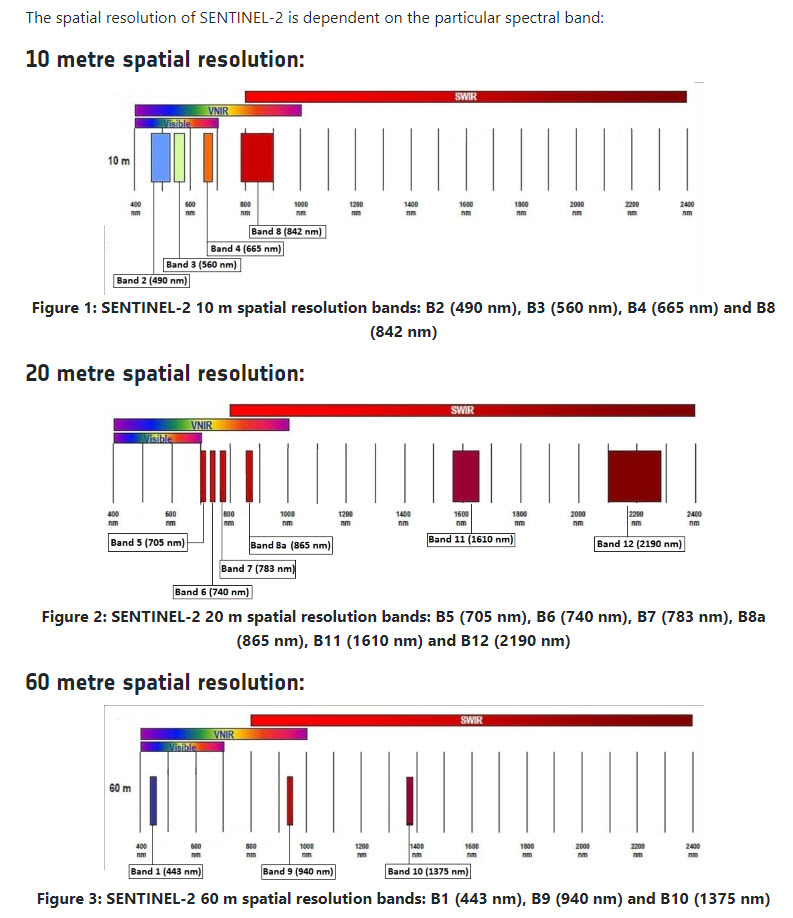
Figure 10.4 Comparison of Sentinel 2 bands. Source: The European Space Agency [ESA]. https://sentinels.copernicus.eu/web/sentinel/user-guides/sentinel-2-msi/resolutions/spatial)
Other Imagery Available from Earth Explorer
Many other remotely sensed image products and data are available from the USGS data library via Earth Explorer.
When entering the Earth Explorer website at https://earthexplorer.usgs.gov/, choose the Data Sets tab, indicated by the red box in Figure 10.5, to see the available images.
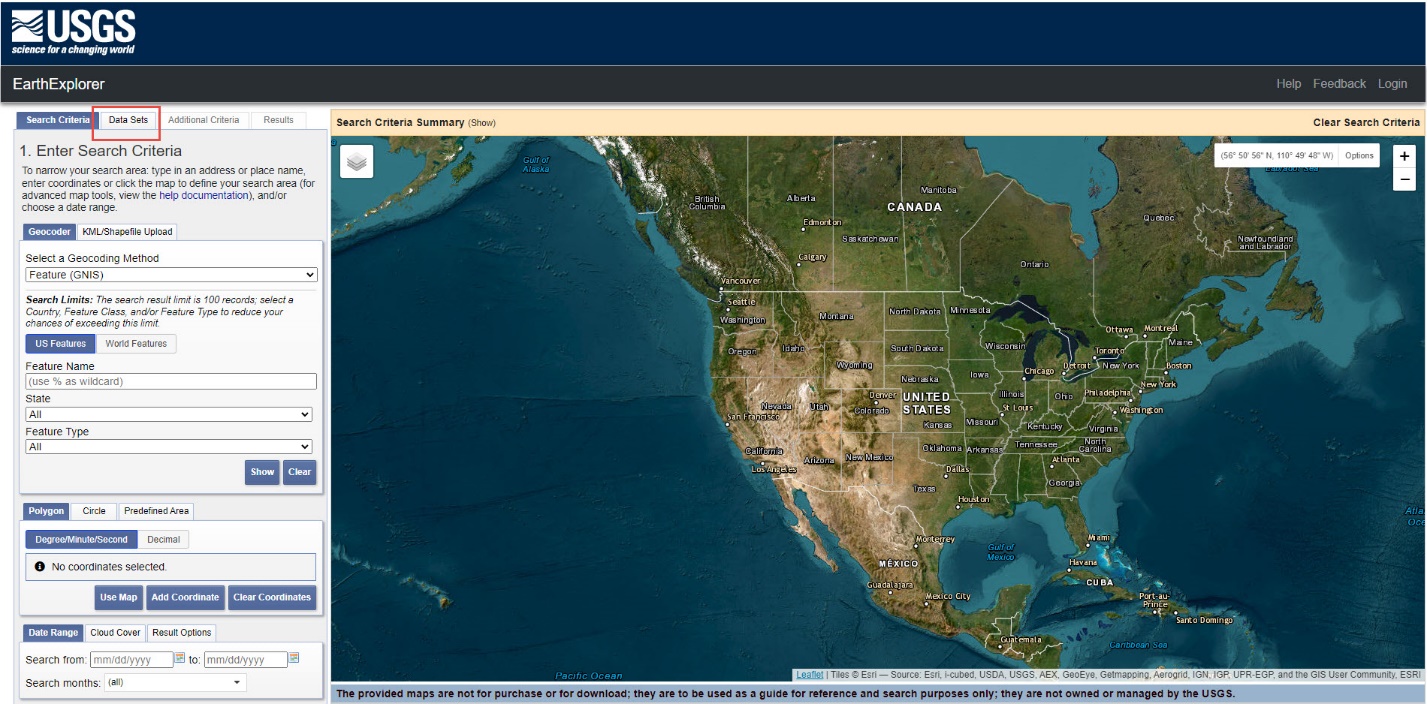
Figure 10.5. Launching USGS Earth Explorer
Figure 10.6 shows the Data Set categories as of March 2023.
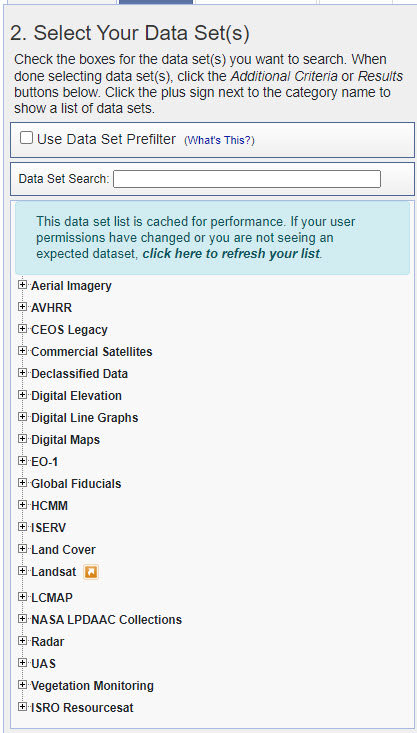
Figure 10.6. Exploring data sets in Earth Explorer
Select the + sign before the category name to expand it and reveal the images and data available under the category. Figure 10.6 shows the expanded Aerial Imagery category and the available images.
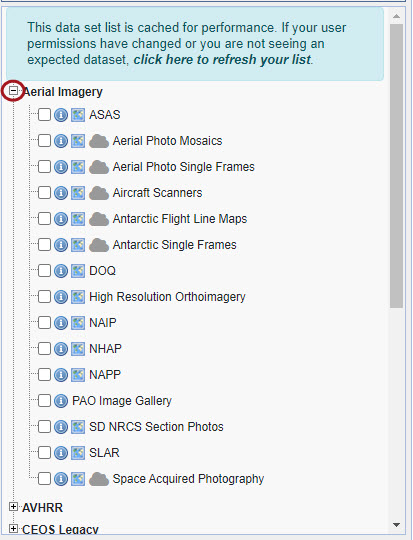
Figure 10.7: Data sets: Aerial imagery
To access metadata associated with a specific image, click the information button next to the image’s name (Figure 10.7).
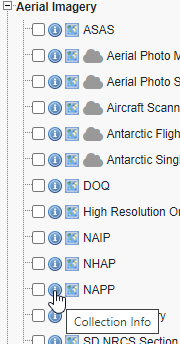
Figure 10.8. Data sets: Aerial imagery
In this case, clicking on the Information icon took us to the website for the NHAP program—the USGS EROS Archive–Aerial Photography–National High Altitude Photography (NHAP), as shown in Figure 10.8.
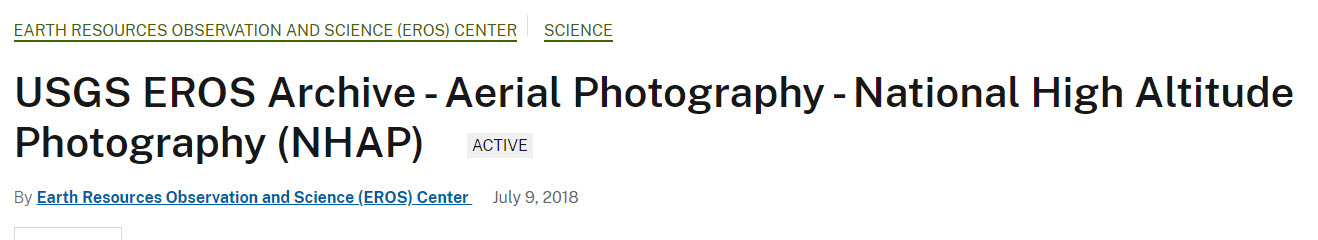
Figure 10.9. The information icon
Select the Toggle Coverage Map icon next to the image’s name to identify the geographic region covered by an image product. It is the center of the three icons (red box in Figure 10.9). The map window shows broad swaths of blue illustrating areas with available imagery for the chosen product (Figure 10.9).
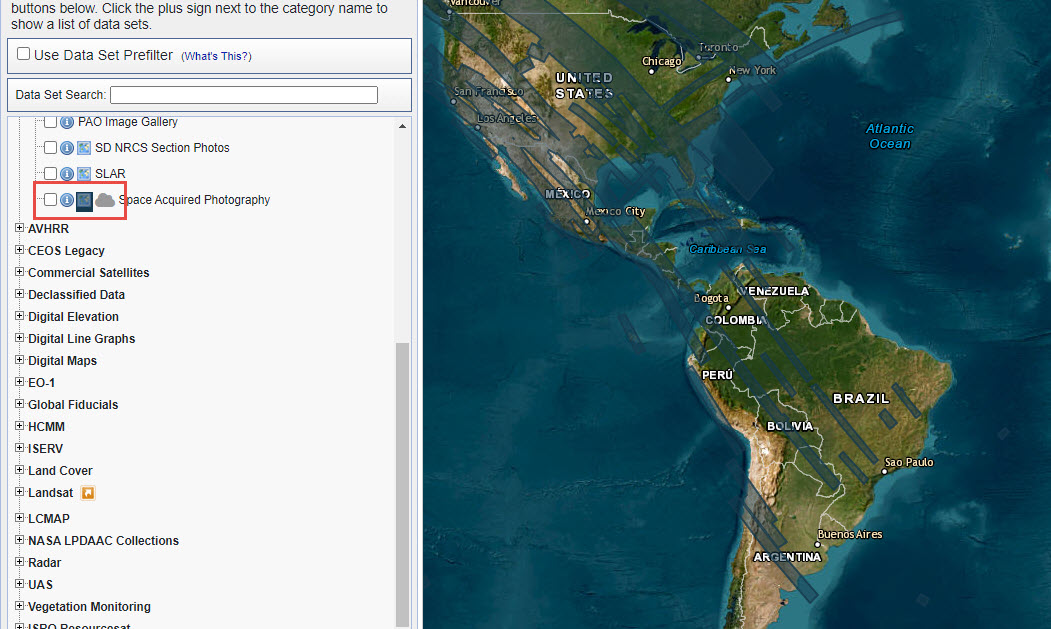
Figure 10.10. The map display
In Figure 10.11, we selected QuickDRI from the Vegetation Monitoring category. The coverage areas are highlighted in cyan.
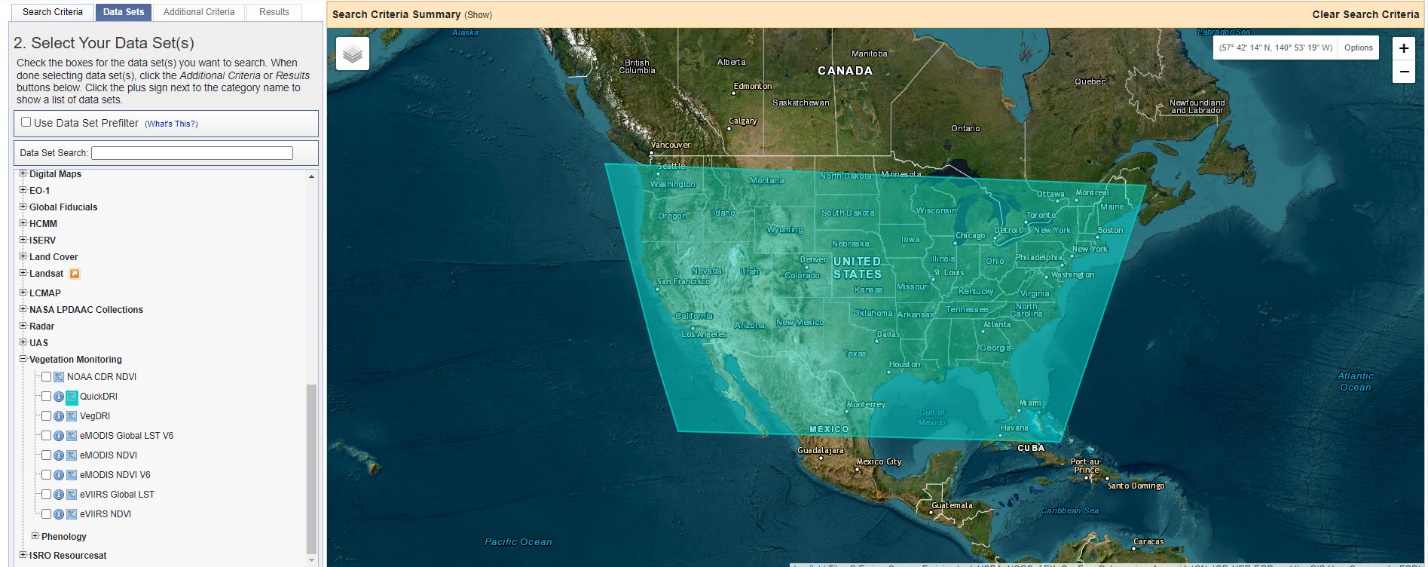
Figure 10.11. QuickDRI in Earth Explorer
Using different colors to highlight coverage areas allows the display of multiple image locations simultaneously and will help determine what images are available for a specific area (Figure 10.12).
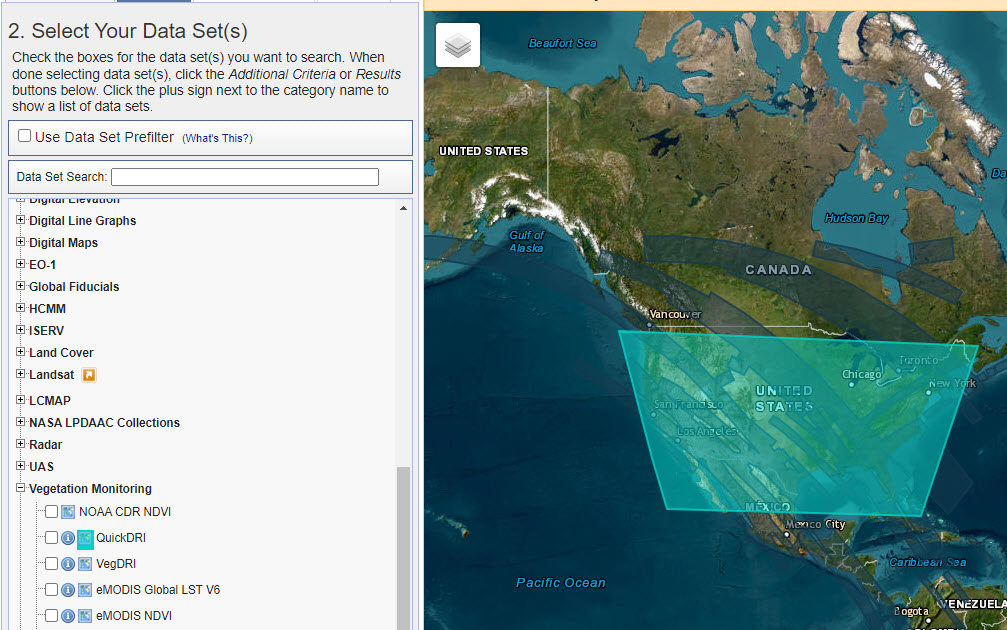
Figure 10.12. Identifying area coverage
Landsat images are available under the Landsat category (Figure 10.13). These are discussed in Chapter 11, Downloading Landsat 9 Imagery using Earth Explorer.
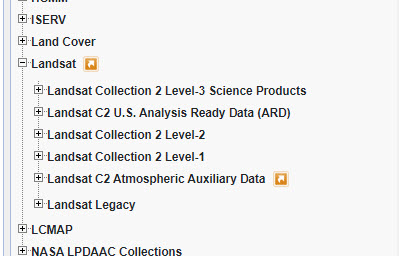
Figure 10.13. Landsat image options
Whether remotely sensed imagery is used for analysis or as a stand-alone image for reference purposes, choosing the most appropriate one is essential. If the image is needed for a specific purpose, coverage area, spatial extent, spectral and radiometric properties, the audience, and the customer must all be considered during the selection process. Such decisions are beyond the scope of this book, and we refer to our introduction for additional literature to assist in this decision-making process and recommend that all metadata be reviewed for all images under consideration.
In the next chapter of this book, we provide step-by-step instructions on downloading imagery, specifically a Landsat 9 image used in other chapters of this book.
Data Available from The National Map
Some remotely sensed data is available from The National Map download website at https://apps.nationalmap.gov/downloader/. This website includes imagery and data types such as elevation, Lidar, IfSAR, and US Topographic Maps (Figure 10.14). Downloading remotely sensed data from this site is beyond the scope of this book. Information on using The National Map downloader can be found at the USGS YouTube Channel here https://www.youtube.com/watch?v=4kh2lqm5ryE or https://www.youtube.com/watch?v=OCnCd94IucE&list=PLIxlFowAfHBAzSIeg7wszuUVsLzVkspQN&index=29, among other sites.
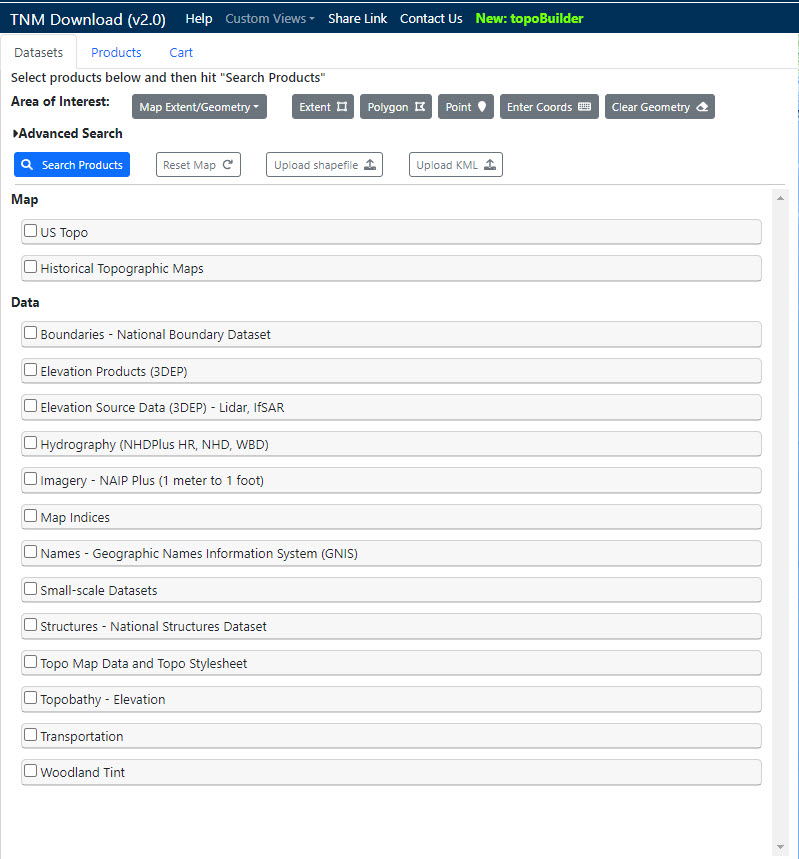
Figure 10.14. The National Map