12 Chapter 12: Information about Downloaded Landsat 9 Imagery
Introduction
Landsat is the longest continuously operating Earth observation satellite program. The first Landsat satellite was launched in 1972, and the most recent, Landsat 9, was launched in 2021. Landsat missions continue—Landsat Next is in development and will support current spectral bands associated with Landsat 8 and 9, as well as 15 additional bands (26 bands in total; Figure 12.1). Landsat Next is anticipated to launch in 2030. For additional details on the Landsat program, see http://landsat.usgs.gov/. For additional information on the Landsat Next mission, see https://www.usgs.gov/landsat-missions/landsat-next.
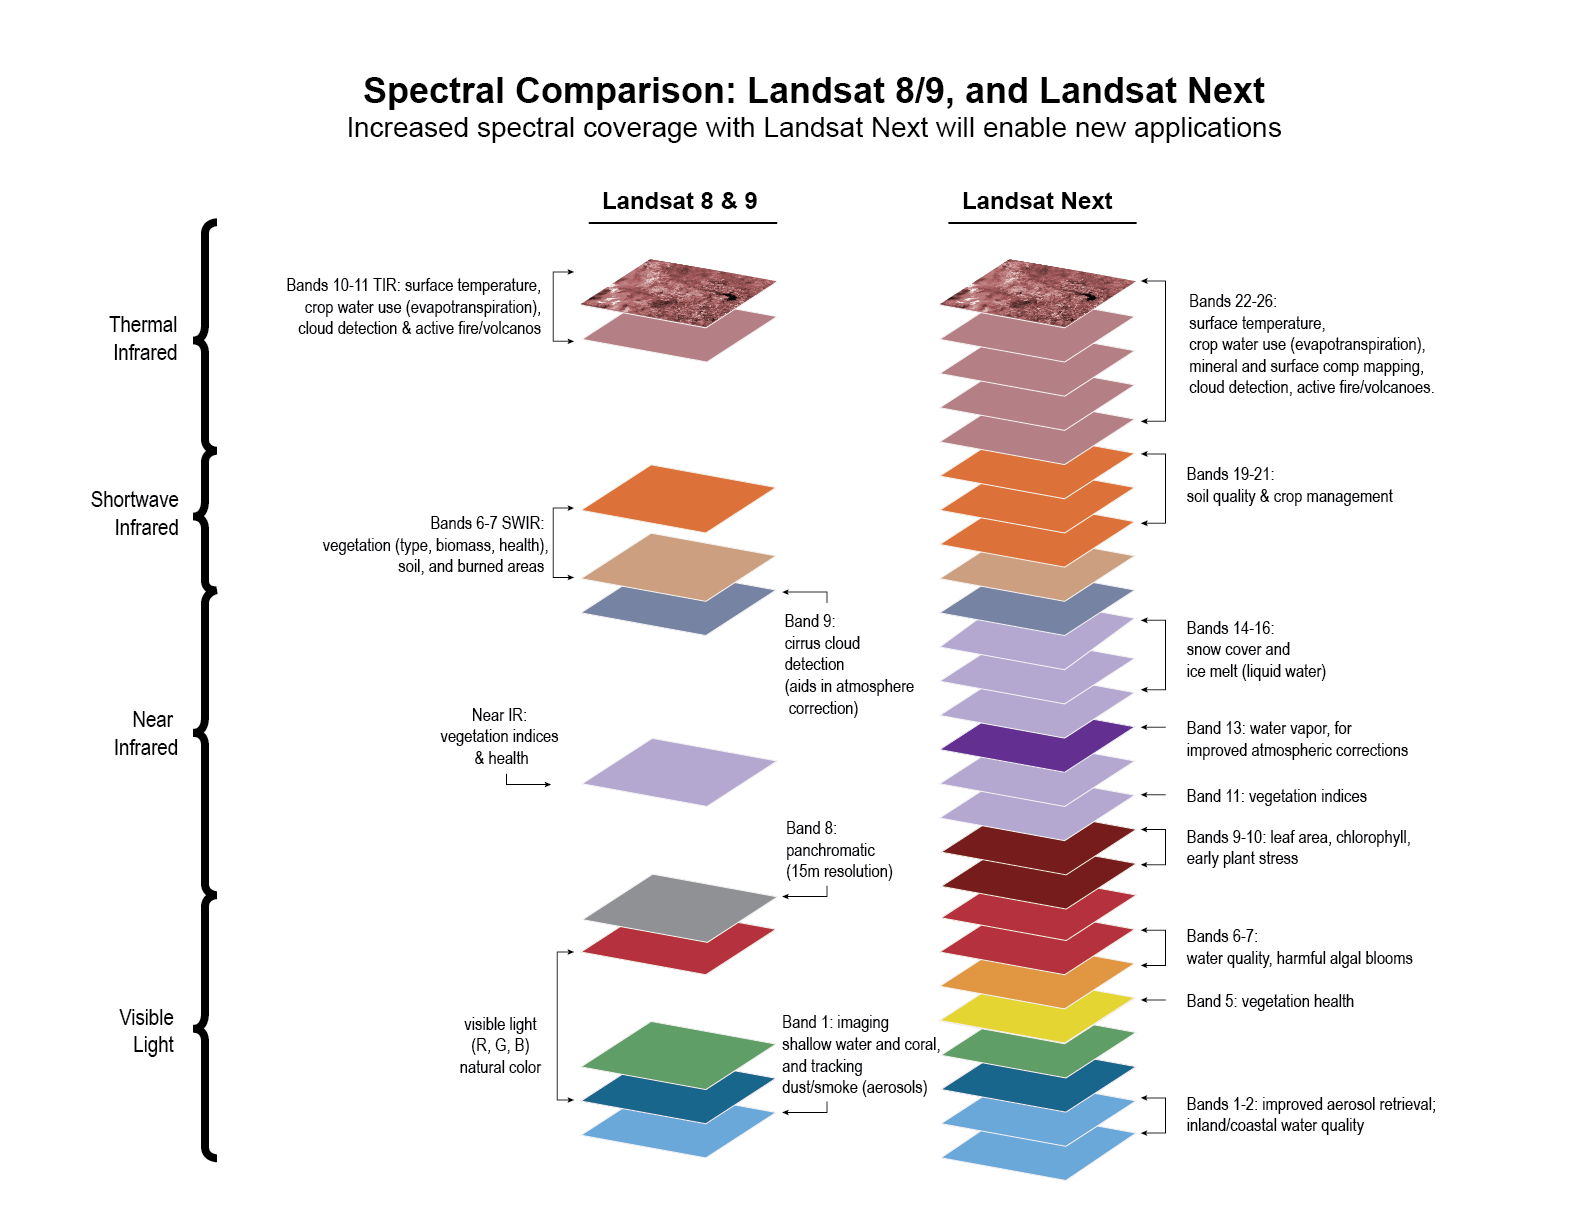
Figure 12.1 Comparison of Landsat 8/9 and Landsat NEXT spectral bands. Source: USGS https://www.usgs.gov/media/images/spectral-comparison-landsat-8-9-and-landsat-next
In the previous chapter, we downloaded a Landsat 9 scene dated June 10, 2023, from the USGS Earth Explorer image clearinghouse (Figure 12.2). This chapter explores information about the scene. Decisions on exactly which images are required for specific analyses are beyond the scope of this chapter and this book.
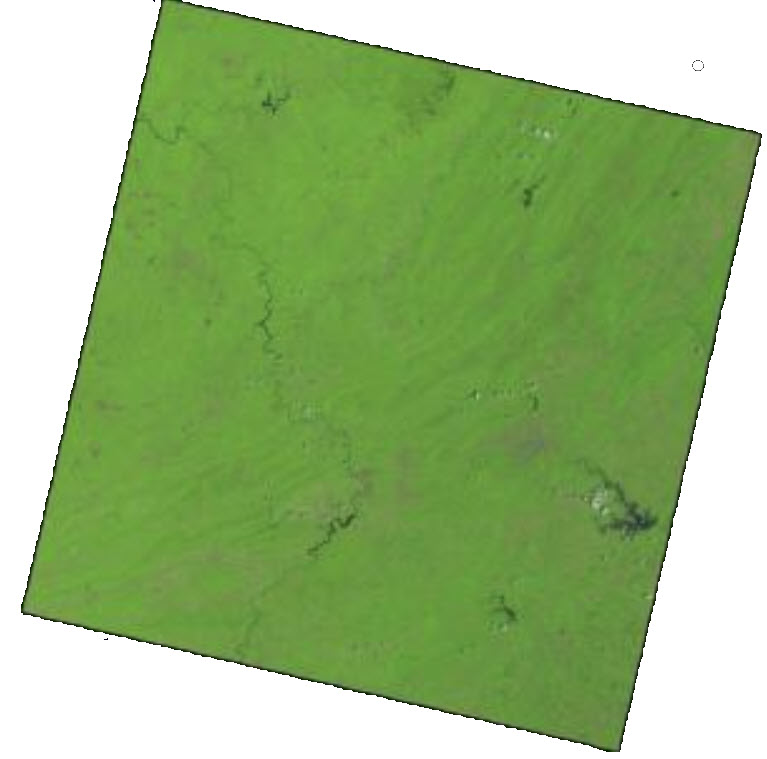
Figure 12.2. JPEG of the Landsat scene downloaded from the previous chapter
Metadata provides information about each Landsat Scene, and when exploring available images in Earth Explorer, metadata relevant to the image is provided. In this chapter, we discuss some metadata elements, but we will only review some of the metadata, many of which are self-explanatory.
Metadata as displayed in Earth Explorer1
For our Landsat scene, the table below shows the metadata category on the left with the metadata value for the category on the right (12.3).
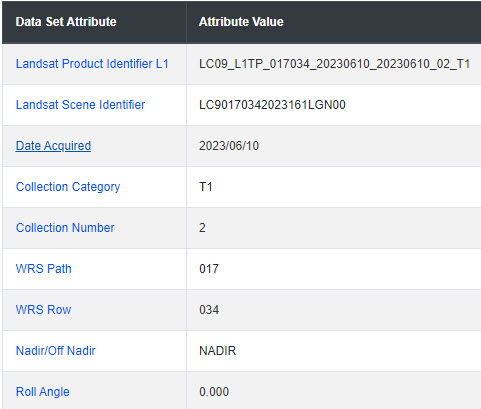
Figure 12.3. Metadata in Earth Explorer
If unsure what the category means, click the category name (in Figure 12.3, we clicked the “Landsat Product Identifier L1” category name). The Landsat Product Identifier L1 link opens a webpage describing the category (Figure 12.4). This is the file name “naming convention of each acquired scene based on acquisition and processing parameters.” Each character associated with the Landsat Product Identifier has meaning.
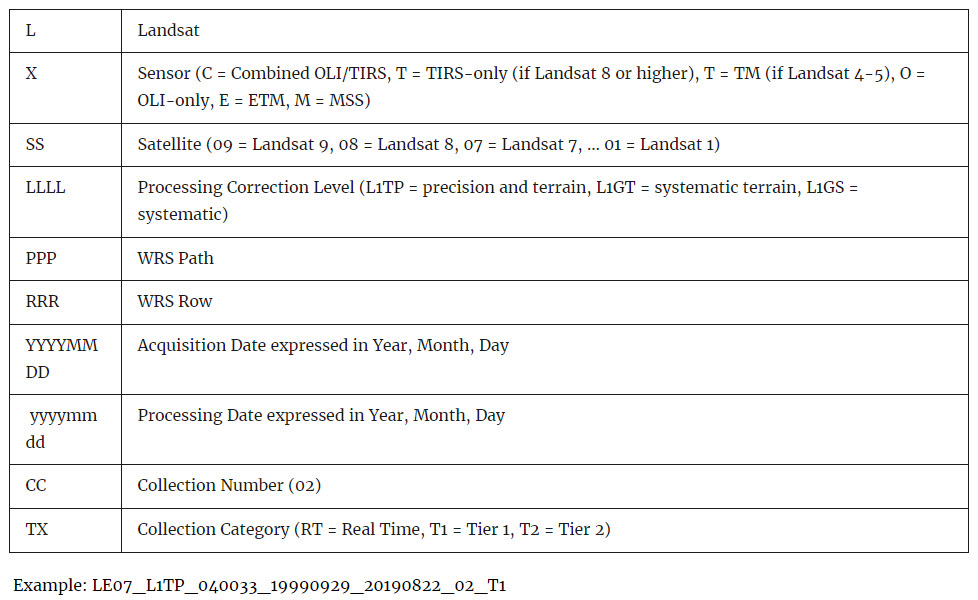
Figure 12.4. Understanding the Landsat product identifier
From the metadata, let’s examine our scene’s product identifier:
LC09_L1TP_017034_ 20230610_20230610_02_T1
- L = Landsat
- C = Combined OLI and TIRS—the sensors aboard Landsat 8 and 9.2
- 09 = Landsat 9
- L1TP = Level 1 precision and terrain
- 017 – WRS path for this scene
- 034 – WRS row for this scene
- 20230610 – date in YYYYMMDD the scene was acquired: June 10, 2023
- 20230610 – date in YYYYMMDD the USGS last processed the scene (this date can change as new processing methods are developed).
- 02 – Collection number
- T1 – a tier one product (refer to https://www.usgs.gov/landsat-missions for more information)
The next item in the metadata list is the Landsat Scene Identifier. This number can be used to order this scene again without the necessity of following all the steps of searching demonstrated in Chapter 11: Downloading a Landsat 9 Image using Earth Explorer. This number looks very similar to the Product Identifier—the primary difference is the date of acquisition. In the Landsat Scene Identifier, the date the image was acquired is expressed as a Julian calendar date, 2023161, the 161st day of the year 2023. After the date of acquisition, are the characters LGN00. LGN is the ground station identifier3; 00 denotes the version of this scene.
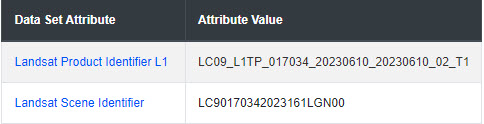
Figure 12.5. The Landsat scene identifier
Scrolling down, the next few lines of this metadata repeat information within the Product and Scene identifiers.
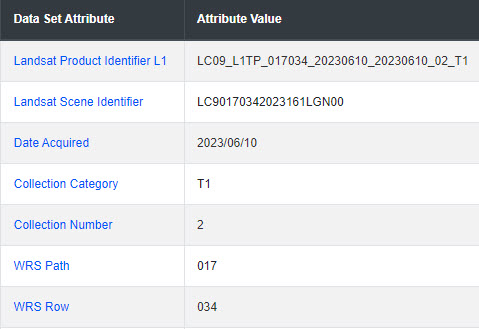
Figure 12.6. Product scene identifiers
Let’s look at Start Time and Stop Time. This is the time Landsat 9 acquired this scene on June 10, 2023, when the satellite was passing over this region. Time is expressed in GMT (Greenwich Mean Time).

Figure 12.7. Scene acquisition times
Other useful elements are Land Cloud Cover and Scene Cloud Cover. In this example, both are at 0.37%
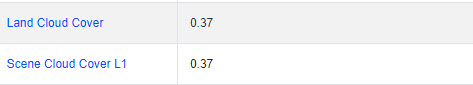
Figure 12.8. Cloud cover information
Ground Control Points—a satellite image, or any remotely sensed image, must be referenced to the ground to identify specific features, and the number of points used for georeferencing the scene is provided. Geometric referencing is usually the first processing completed by the USGS, and RMSE (root mean square error) of the georeferencing process is included.
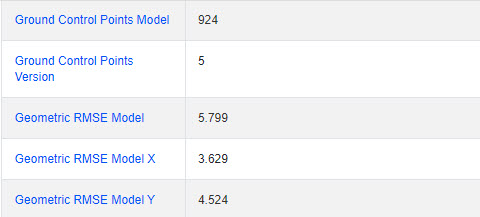
Figure 12.9. GCP information
Sun Elevation and Sun Azimuth—this category is essential for areas above and below the Equator. Remember, the sun’s position changes with the season and may affect the spectral properties of individual features.
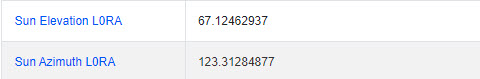
Figure 12.10. Sun elevation and azimuth
Sensor Identifier—this is Landsat 9, so the sensors aboard are OLI and TIRS. A scene with only OLI data can be ordered.
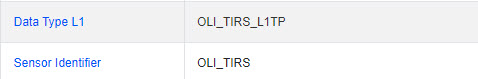
Figure 12.11. Sensor identifier
Projection—is UTM and includes the Zone and Datum. What is missing in the UTM zone? Because this is above the Equator: North Zone 17. If the same zone were south of the Equator, the zone would be designated as South Zone 17.
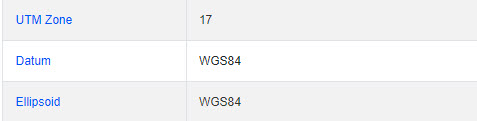
Figure 12.12. Projection information
Grid Cell sizes—note the difference in sizes. Refer to previous chapters on cell size for raster data and differing cell sizes for each Landsat band.
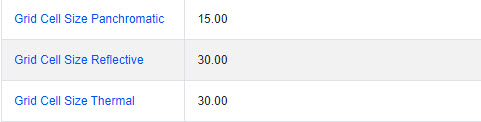
Figure 12.13. Grid cell size
Moving down a few lines, latitude and longitude are provided in degrees, minutes, and decimal seconds for the different regions of the scene, for example, Corner Upper Left, Corner Lower Right, etc. (Figure 12.14)
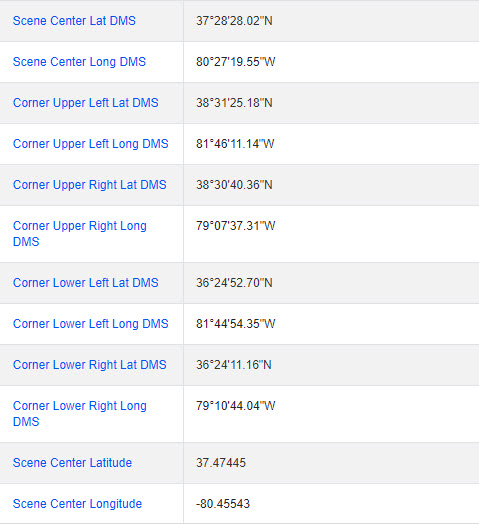
Figure 12.14. Corner coordinates
Exploring Downloaded Metadata
So, if when downloading the Landsat scene, you forgot to record the metadata on Earth Explorer, does that mean returning to Earth Explorer? Recall that the metadata file is always included with each image and in the downloaded zip folder by default. When the downloaded scene was unzipped, the individual supporting files were revealed. All the files have the Landsat Product Identifier—remember our discussion above—the LPI number contains metadata since it provides some basic information about each Landsat scene!
Importing Metadata into Notepad
Most files in the downloaded package are in TIF format—image files available for analysis. But there are also two text Documents (Figure 12.15).
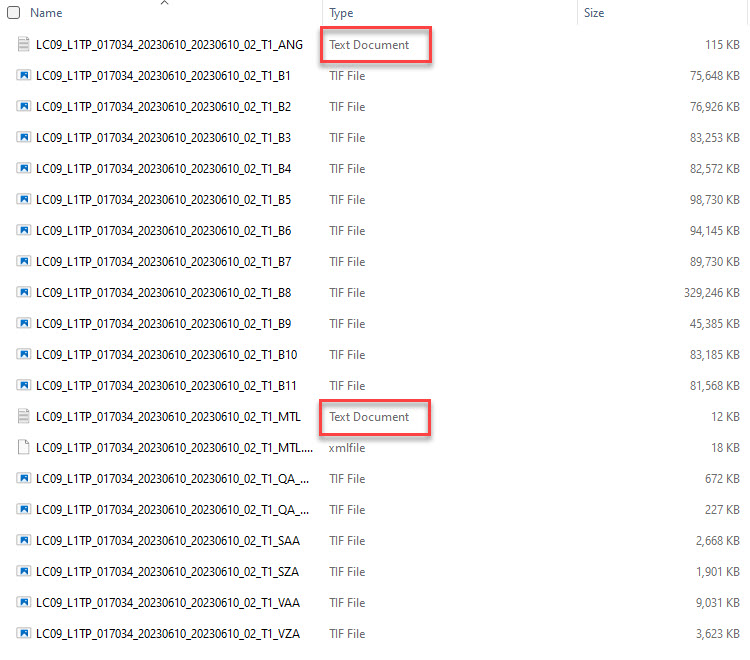
Figure 12.15. Landsat file formats
Right-click the text document and open it (Figure 12.16). In a Windows-based environment, it usually opens in Notepad or a similar application.
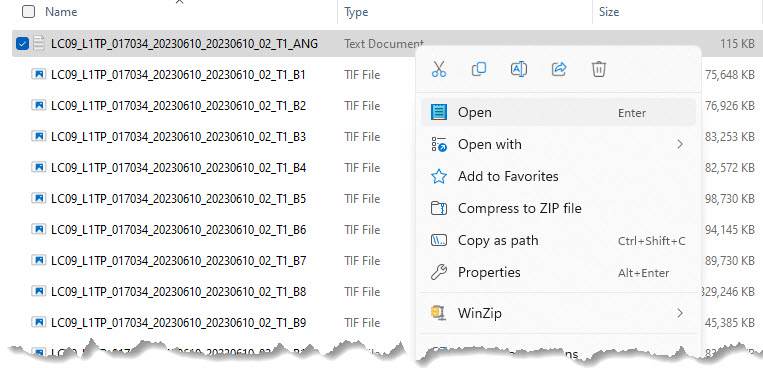
Figure 12.16. Opening a text file
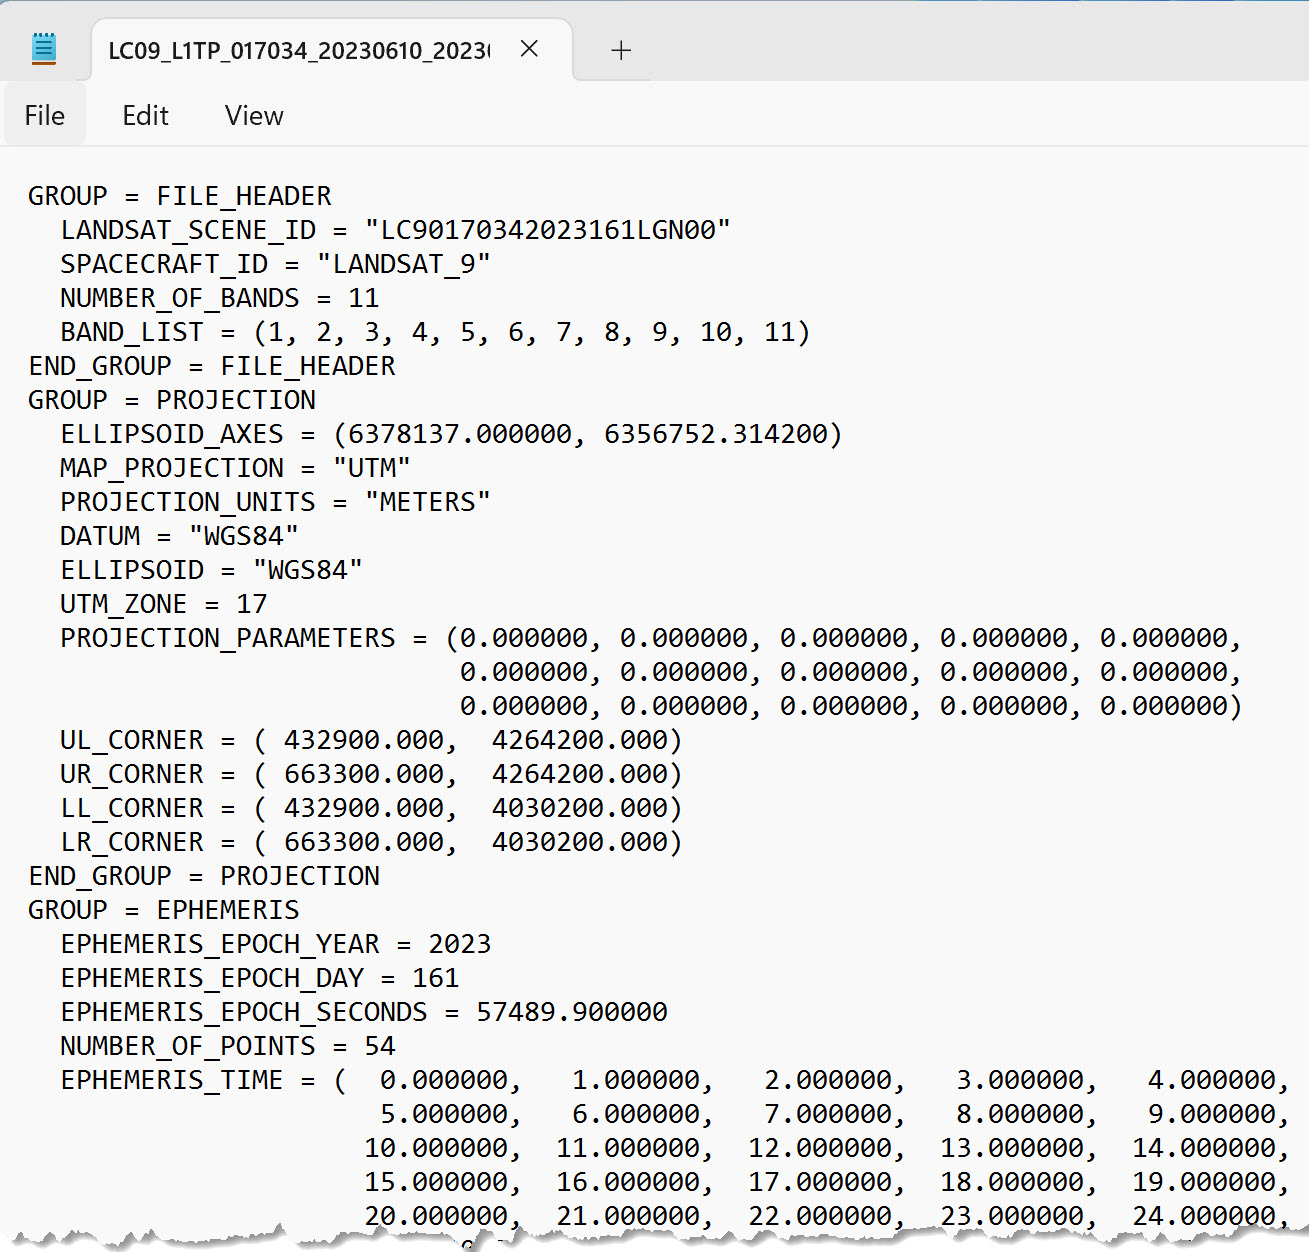
Figure 12.17 File opened in Notepad
Importing Metadata into Excel
The metadata file can also be opened in a spreadsheet application like Microsoft® Excel®.
To view the metadata in Excel, open Excel with a new blank workbook (Figure 12.18).4
Figure 12.18. Opening Excel
Select the Data tab on the ribbon (Figure 12.19).
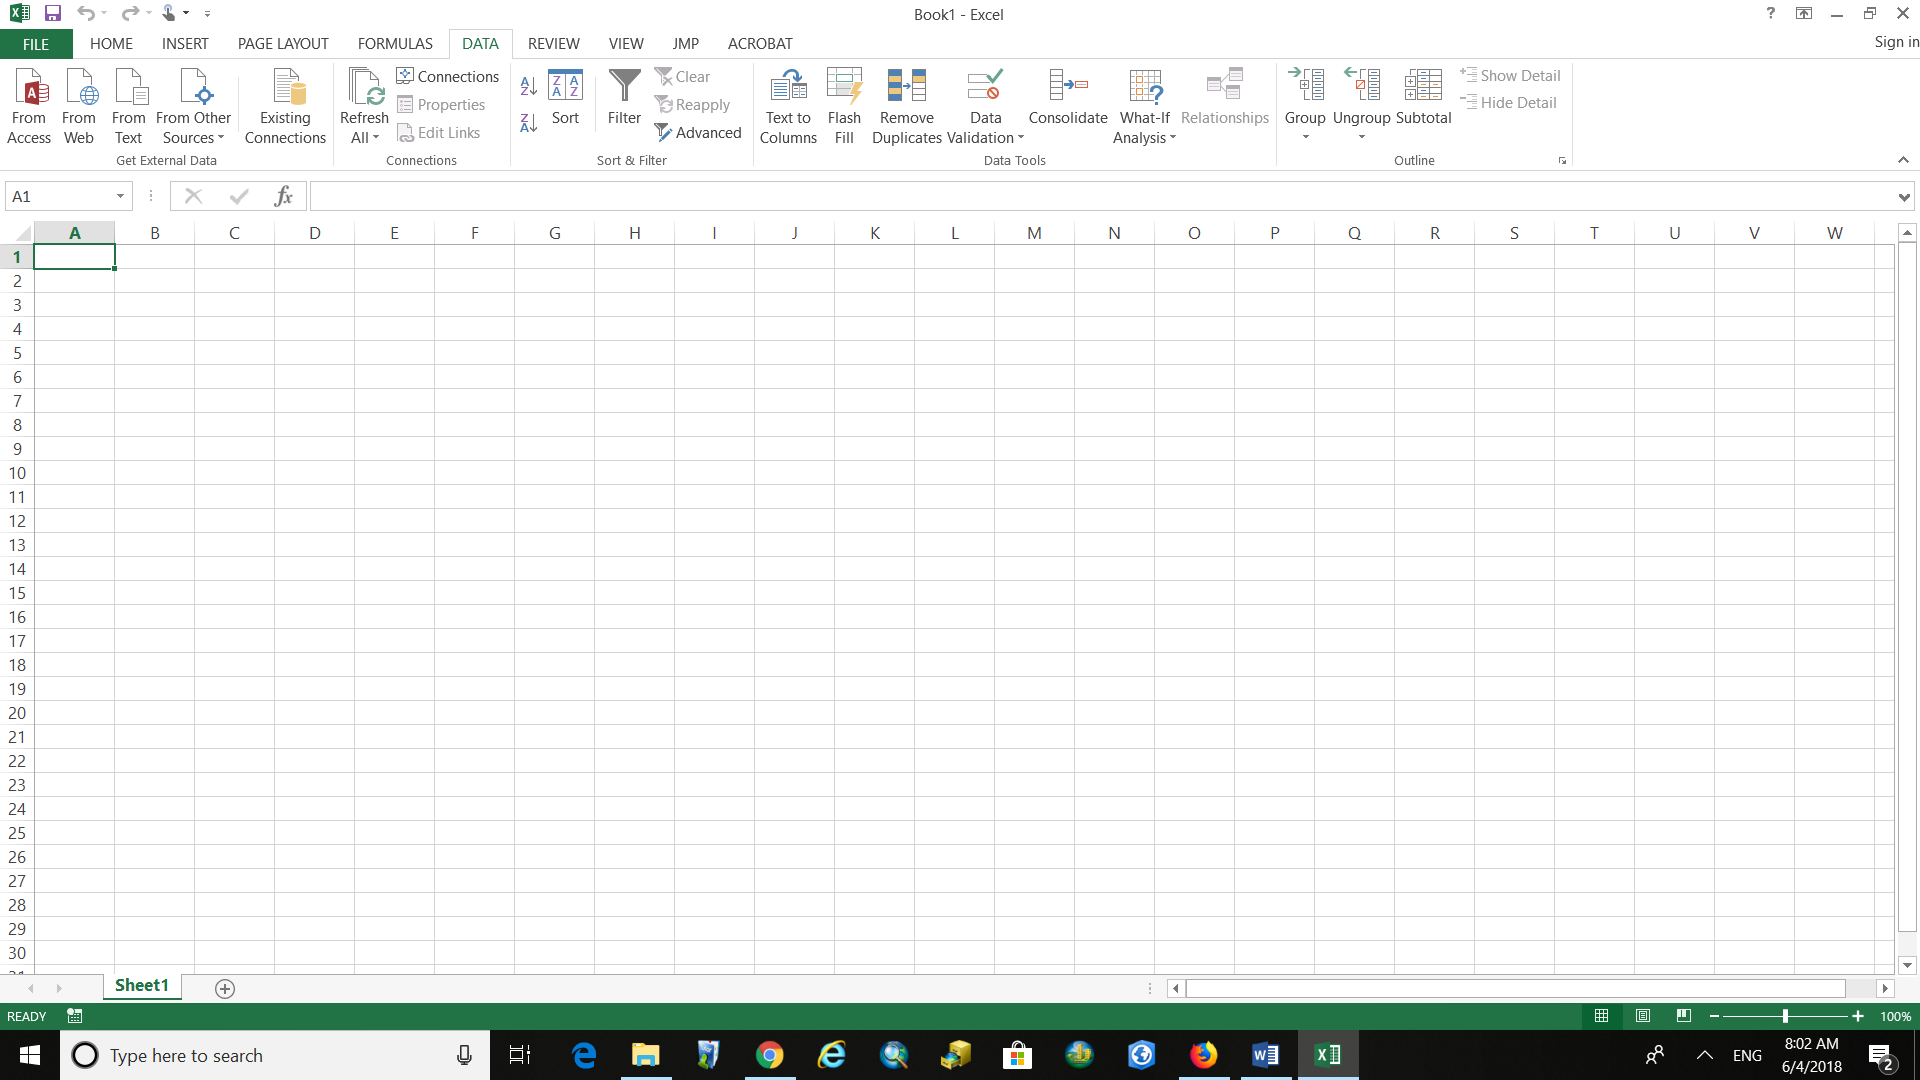
Figure 12.19. The Data tab in Excel
Select From Text/CSV in the Get & Transform Data group (Figure 12.20).
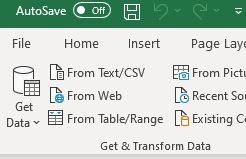
Figure 12.20. Importing a Text/CSV file
Navigate to the folder containing the unzipped Landsat files and locate the two text documents (Figure 12.21).
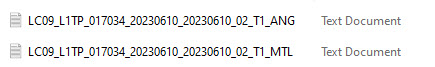
Figure 12.21. Unzipped Landsat files
Select the text file (highlighted in Figure 12.22) and click Import.
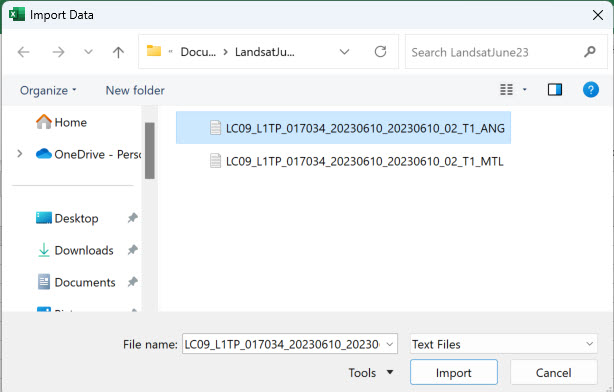
Figure 12.22. Importing a Text/CSV file
In the dialog box that opens, click Load to populate the Excel® worksheet with the imported metadata information (Figure 12.23).
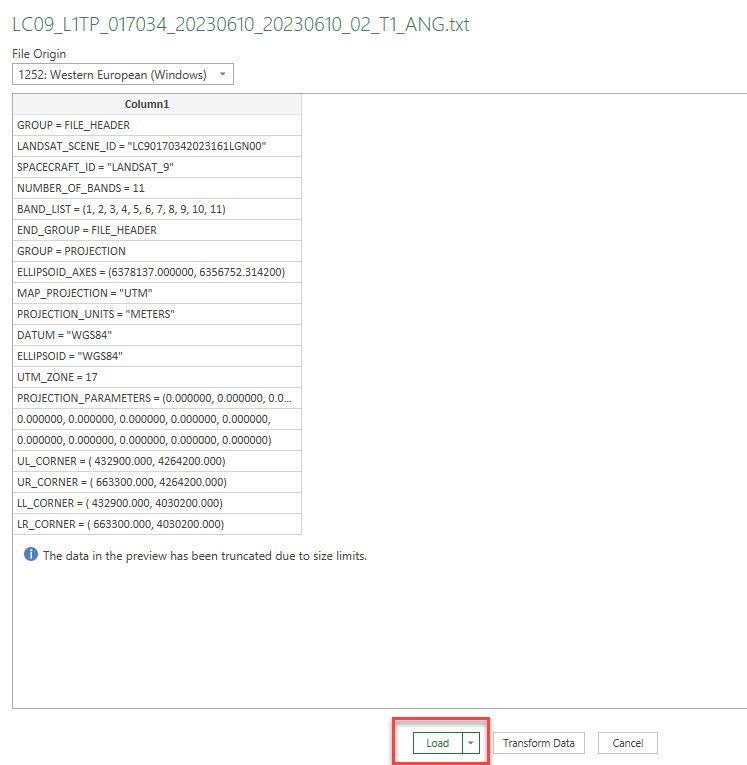
Figure 12.23. Importing a Text/CSV file
The metadata file opens in Excel (Figure 12.24).
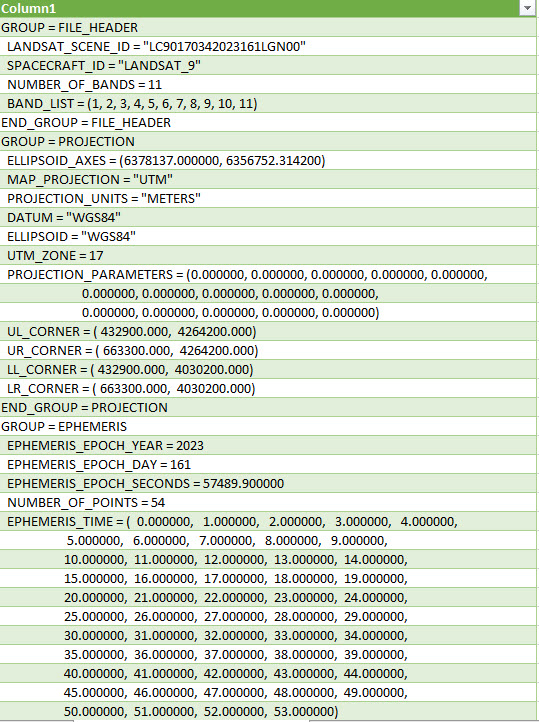
Figure 12.24. The metadata file in Excel
As shown in Figure 12.24, the results in Excel® (or another spreadsheet application) are often easier to read. You can now save it as an Excel® Workbook if you like.
This metadata file contains additional elements not included in Earth Explorer. For example, much of this information is related to the image processing already completed by the USGS (Figure 12.25).
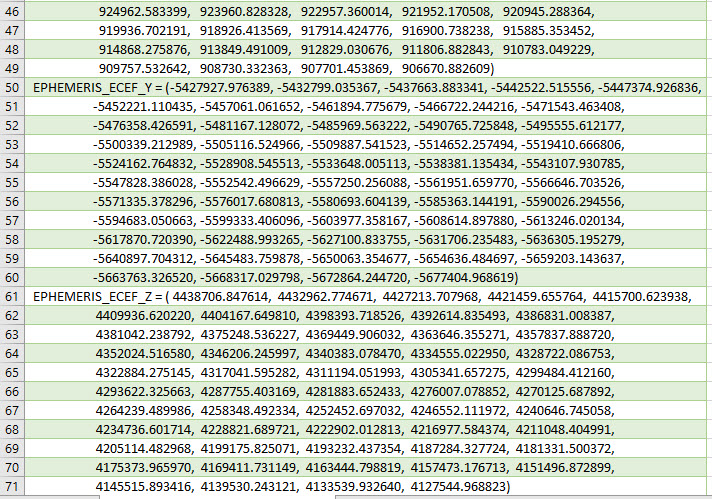
Figure 12.25. Viewing a metadata file in Excel
Now, import the second text document into Excel®. You need not begin with a new workbook; add a new sheet and follow the same procedure.
As seen in Figure 12.26, the second metadata file is exactly like the metadata in Earth Explorer.
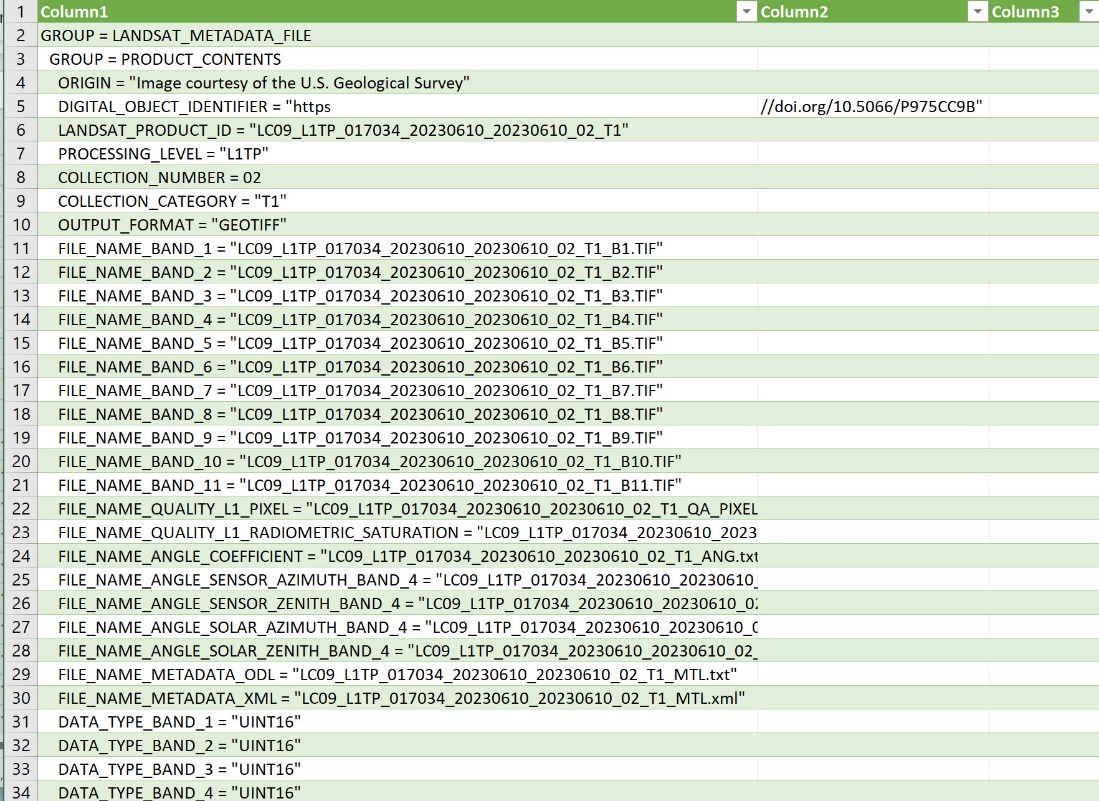
Figure 12.26. Viewing a metadata file in Excel
Now, save the Excel® workbook with a meaningful name, so the import will not need to be redone (File, Save As).
Deciphering Landsat 9 Download Files
What else was provided in the Earth Explorer download? Remember, we noted the TIF files in the above discussion (Figure 12.27).
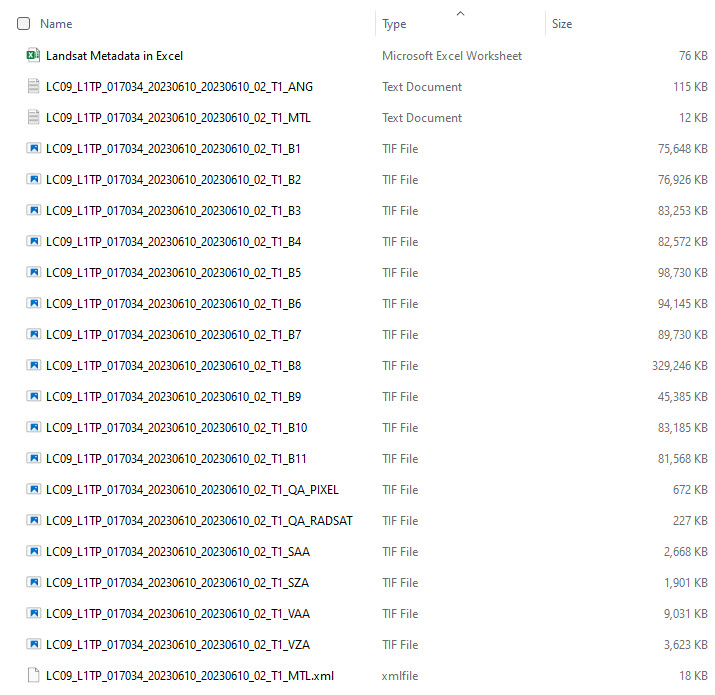
Figure 12.27. Viewing downloaded files
Some of the characters at the end of the Landsat Product Identifier for the TIF files are B1, B2, B3, etc. These are the individual band numbers and the images used for analysis. Remember, we discussed the electromagnetic spectrum in Chapter 10: Imagery Available from the USGS. Each band number represents a different portion of the electromagnetic spectrum (Figure 12.28). The last column represents each band’s pixel (cell) size.
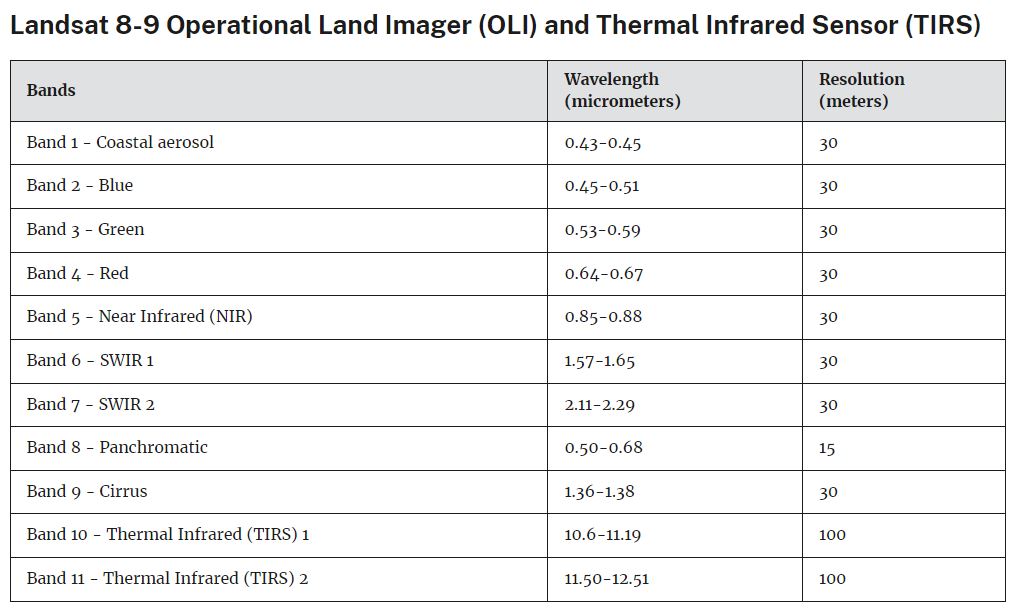
Figure 12.28. Spatial and spectral resolution of Landsat 8 & 9. (Source: USGS https://www.usgs.gov/faqs/what-are-band-designations-landsat-satellites)
Also, recall that we cautioned that the band numbers for different satellites may not correspond to the same region of the electromagnetic spectrum. As an example, for Landsat 5, these are as follows (Table 12.1):
|
Description |
Spectral Band Width |
Pixel size |
|
Band 1 Visible Band 2 Visible Band 3 Visible Band 4 Near-Infrared Band 5 Near-Infrared Band 6 Thermal Band 7 Mid-Infrared |
(0.45 – 0.52 μm) (0.52 – 0.60 μm) (0.63 – 0.69 μm) (0.76 – 0.90 μm) (1.55 – 1.75 μm) (10.40 – 12.50 μm) (2.08 – 2.35 μm) |
30 m 30 m 30 m 30 m 30 m 120 m 30 m |
Table 12.1 Landsat 5 electromagnetic spectrum table. Source: Landsat 5 bands (Source: USGS http://landsat.usgs.gov/about_landsat5.php)
Note that Band 4 in Landsat 5 is near-infrared (covering 0.76 – 0.90 µm), but Band 5 in Landsats 8 & 9 is near-infrared (covering 0.85 – 0.88 µm), a much narrower range.
Is any other pre-processing required before you start using the Landsat Scene? You may wish to consider preprocessing for surface reflectance. See Masek, J.G. et al., A Landsat surface reflectance data set for North America, 1990-2000. Geoscience and Remote Sensing Letters, 2006. 3: p. 68-72. And for more information about the level and type of USGS processing of Landsat scenes, see https://www.usgs.gov/landsat-missions.
Please proceed to the next chapter, which begins to prepare this downloaded Landsat 9 scene for analysis.