13 Ventilation and Perfusion
Learning objectives
- Derive the consequences of changing V/Q (from 0 to infinity) on alveolar and arterial gas tensions.
- Describe the consequences of regional variation in V/Q across the lung from apex to base on alveolar and arterial gas tensions.
- Describe the response of the pulmonary vasculature to changes regional of ventilation.
Ventilation and Perfusion in the Normal Lung
As alluded to previously, in order for gas exchange to be efficient, each region of the lung must receive equal amounts of ventilation and pulmonary perfusion to its alveoli. If ventilation and perfusion are not matched, then gas exchange diminishes, particularly in the case of oxygen. The relationship between ventilation and perfusion is referred to as V/Q, which describes the ratio between ventilation (V) and perfusion (Q) for a particular lung region. Because V/Q is critical to gas exchange and as many pulmonary diseases cause ventilation–perfusion mismatches, it is well worth understanding the effect of changing V/Q on arterial gases, and the regional differences in V/Q across the lung and the lung’s responses to maintain V/Q when it deviates from normal.
Let us start with a description of the ideal situation, where ventilation to alveoli is matched with the perfusion, then we will see how the lung does not quite achieve this.
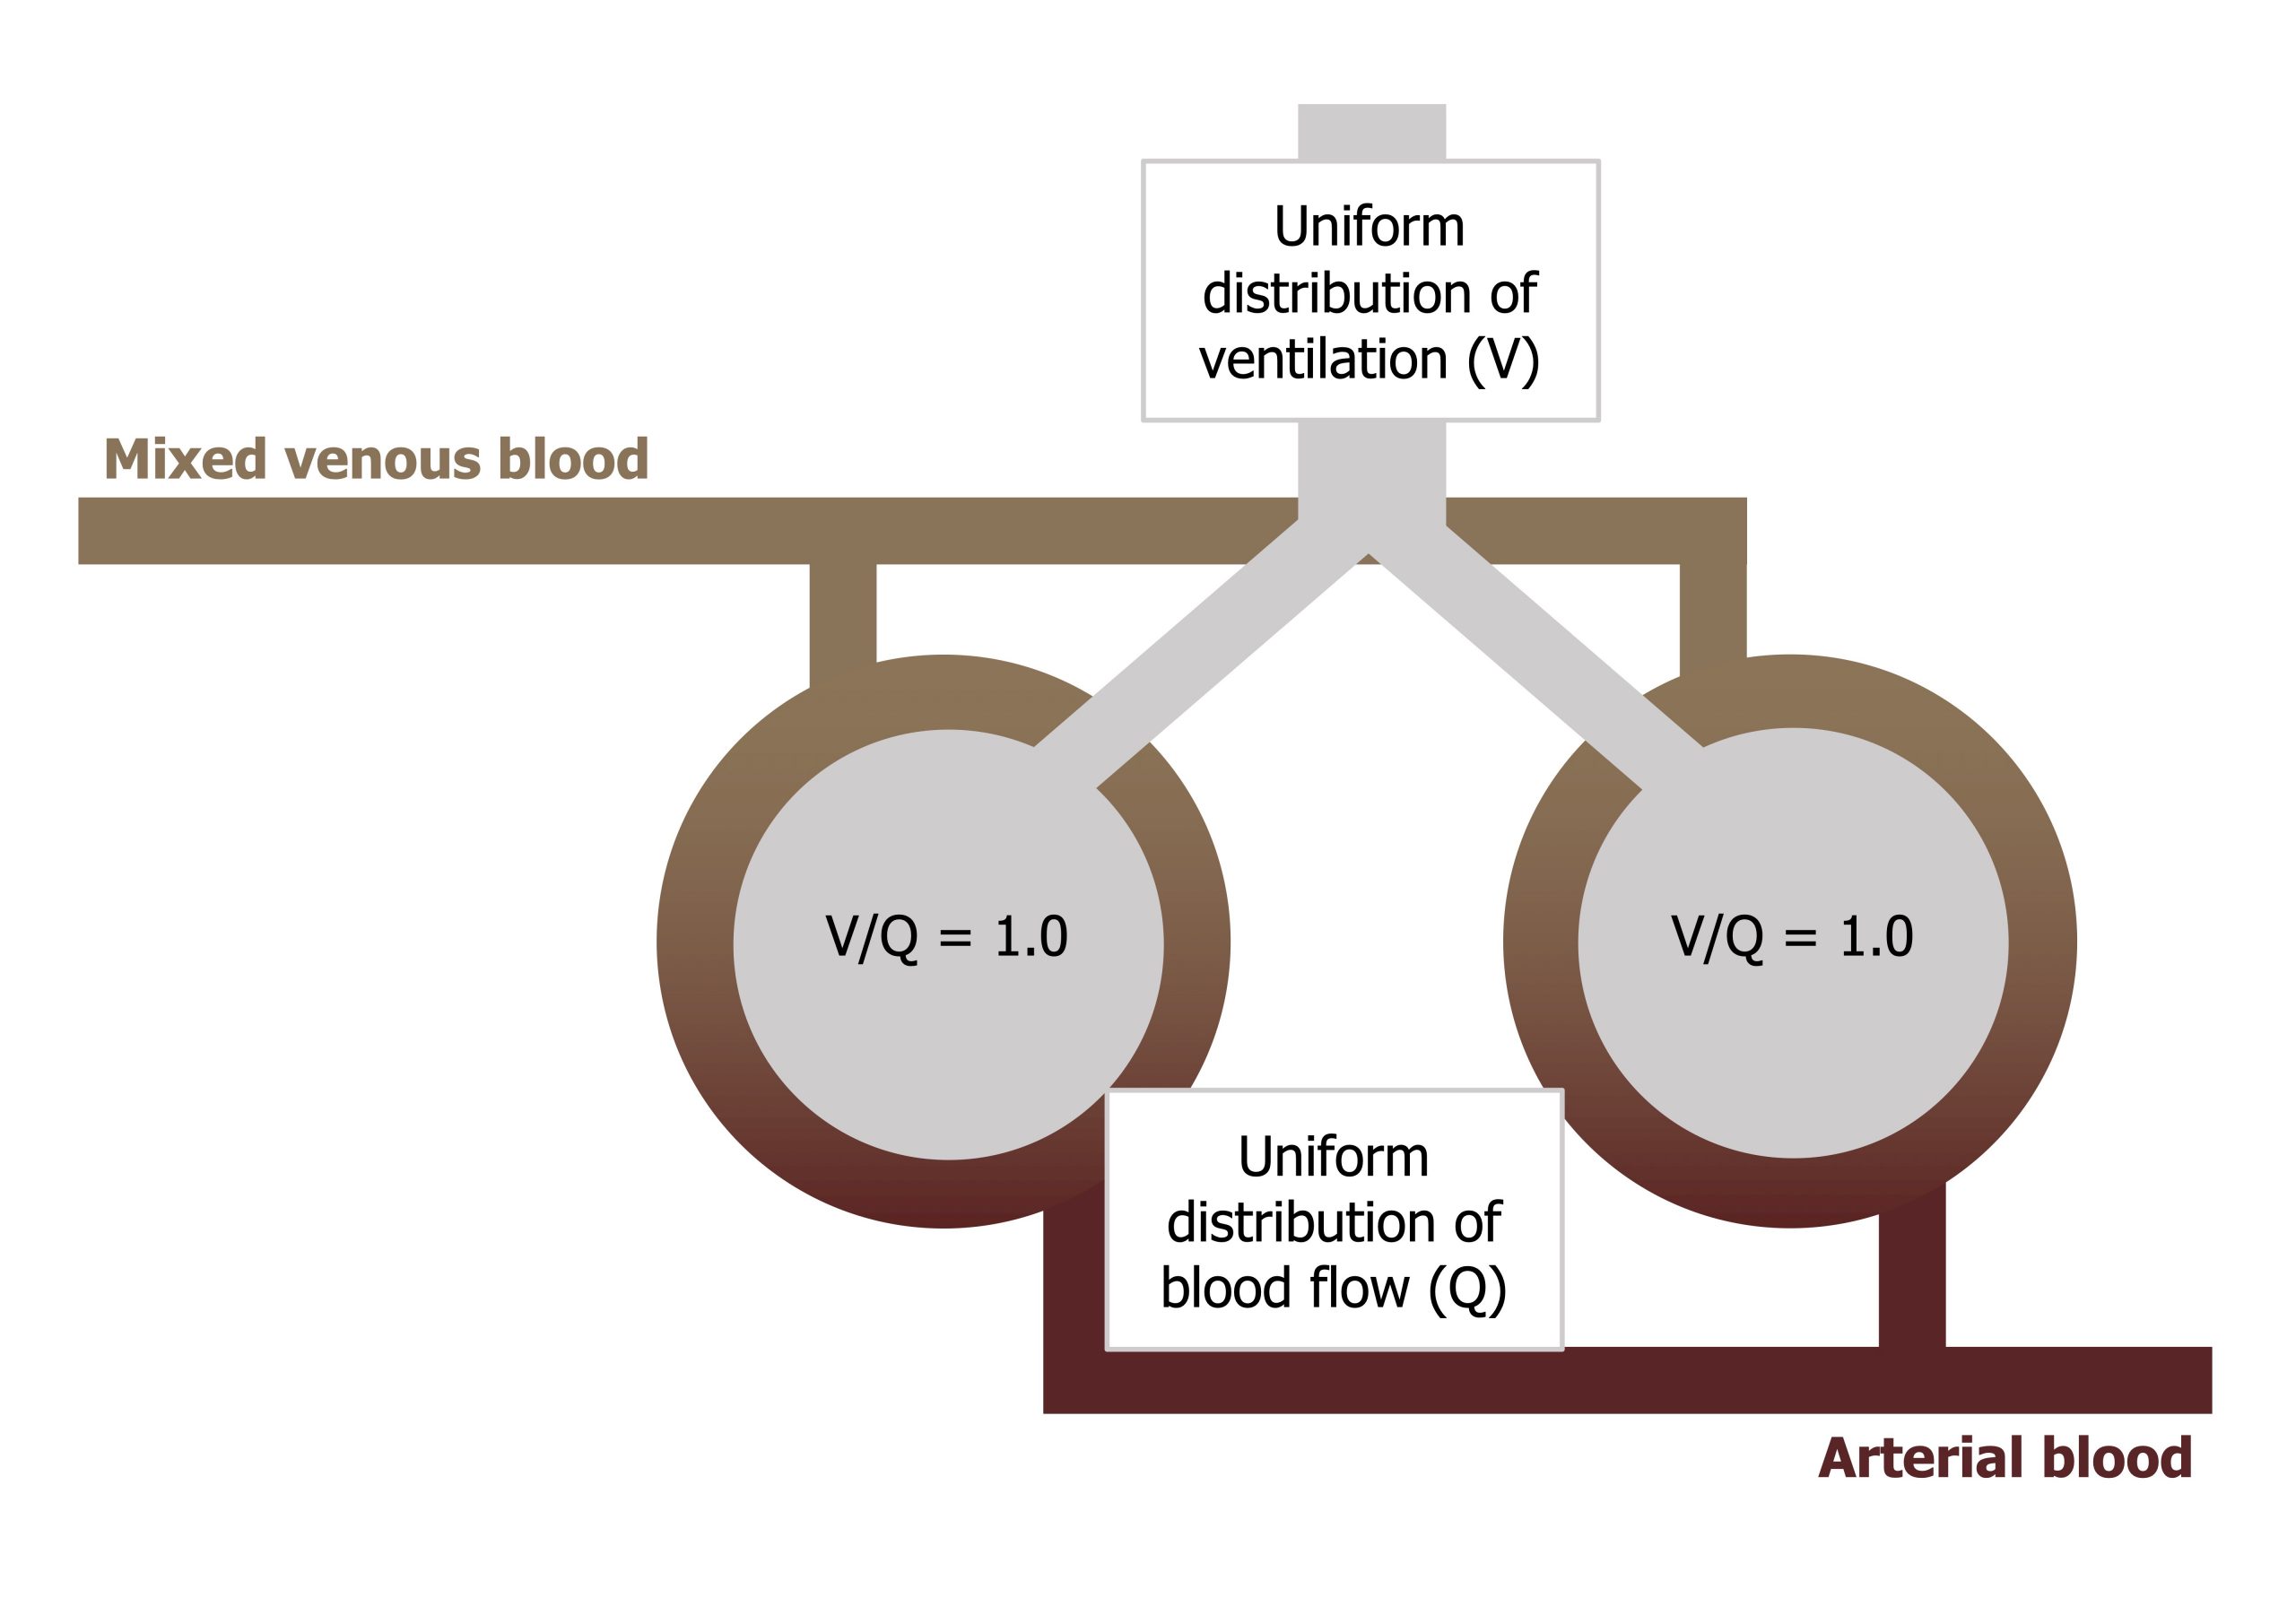
Figure 13.1 shows venous blood approaching and passing two alveoli, becoming oxygenated, and then heading back toward the left heart. The ideal situation is that both alveoli are both ventilated and both perfuse and that the ventilation and perfusion ratio (the V/Q) to each is equal (i.e., 1). If this is the case, then gas exchange is highly efficient, blood PO2 comes into equilibrium with alveolar PO2, and consequently there is no alveolar–arterial PO2 difference.
This is what we would expect if the lung were perfect, with uniform distribution of ventilation and perfusion to all regions and a V/Q of 1 in all regions.
The lung is not a perfect organ, however, and ventilation and perfusion are not equally distributed, and the lung as a whole only achieves an average V/Q of 0.8, which is close to our ideal of 1, but not quite there. Consequently, by the time the blood has passed the alveoli and regrouped in the pulmonary veins, the PO2 of the blood is less than alveolar. This alveolar–arterial PO2 difference is caused by the less-than-perfect matching of V and Q across the lung; but it is not all the lung’s fault, as venous blood that has been through the bronchial and a small section of the coronary circulation (and therefore is deoxygenated) is mixed into the vessels returning to the left heart, which brings down arterial saturation as well. The mixing-in of bronchial and coronary circulations and the less-than-ideal V/Q in the lung as a whole is the reason why your saturation monitors do not read 100 percent, but normal oxygen saturation is considered as 96–98 percent.
Partial Pressures and V/Q
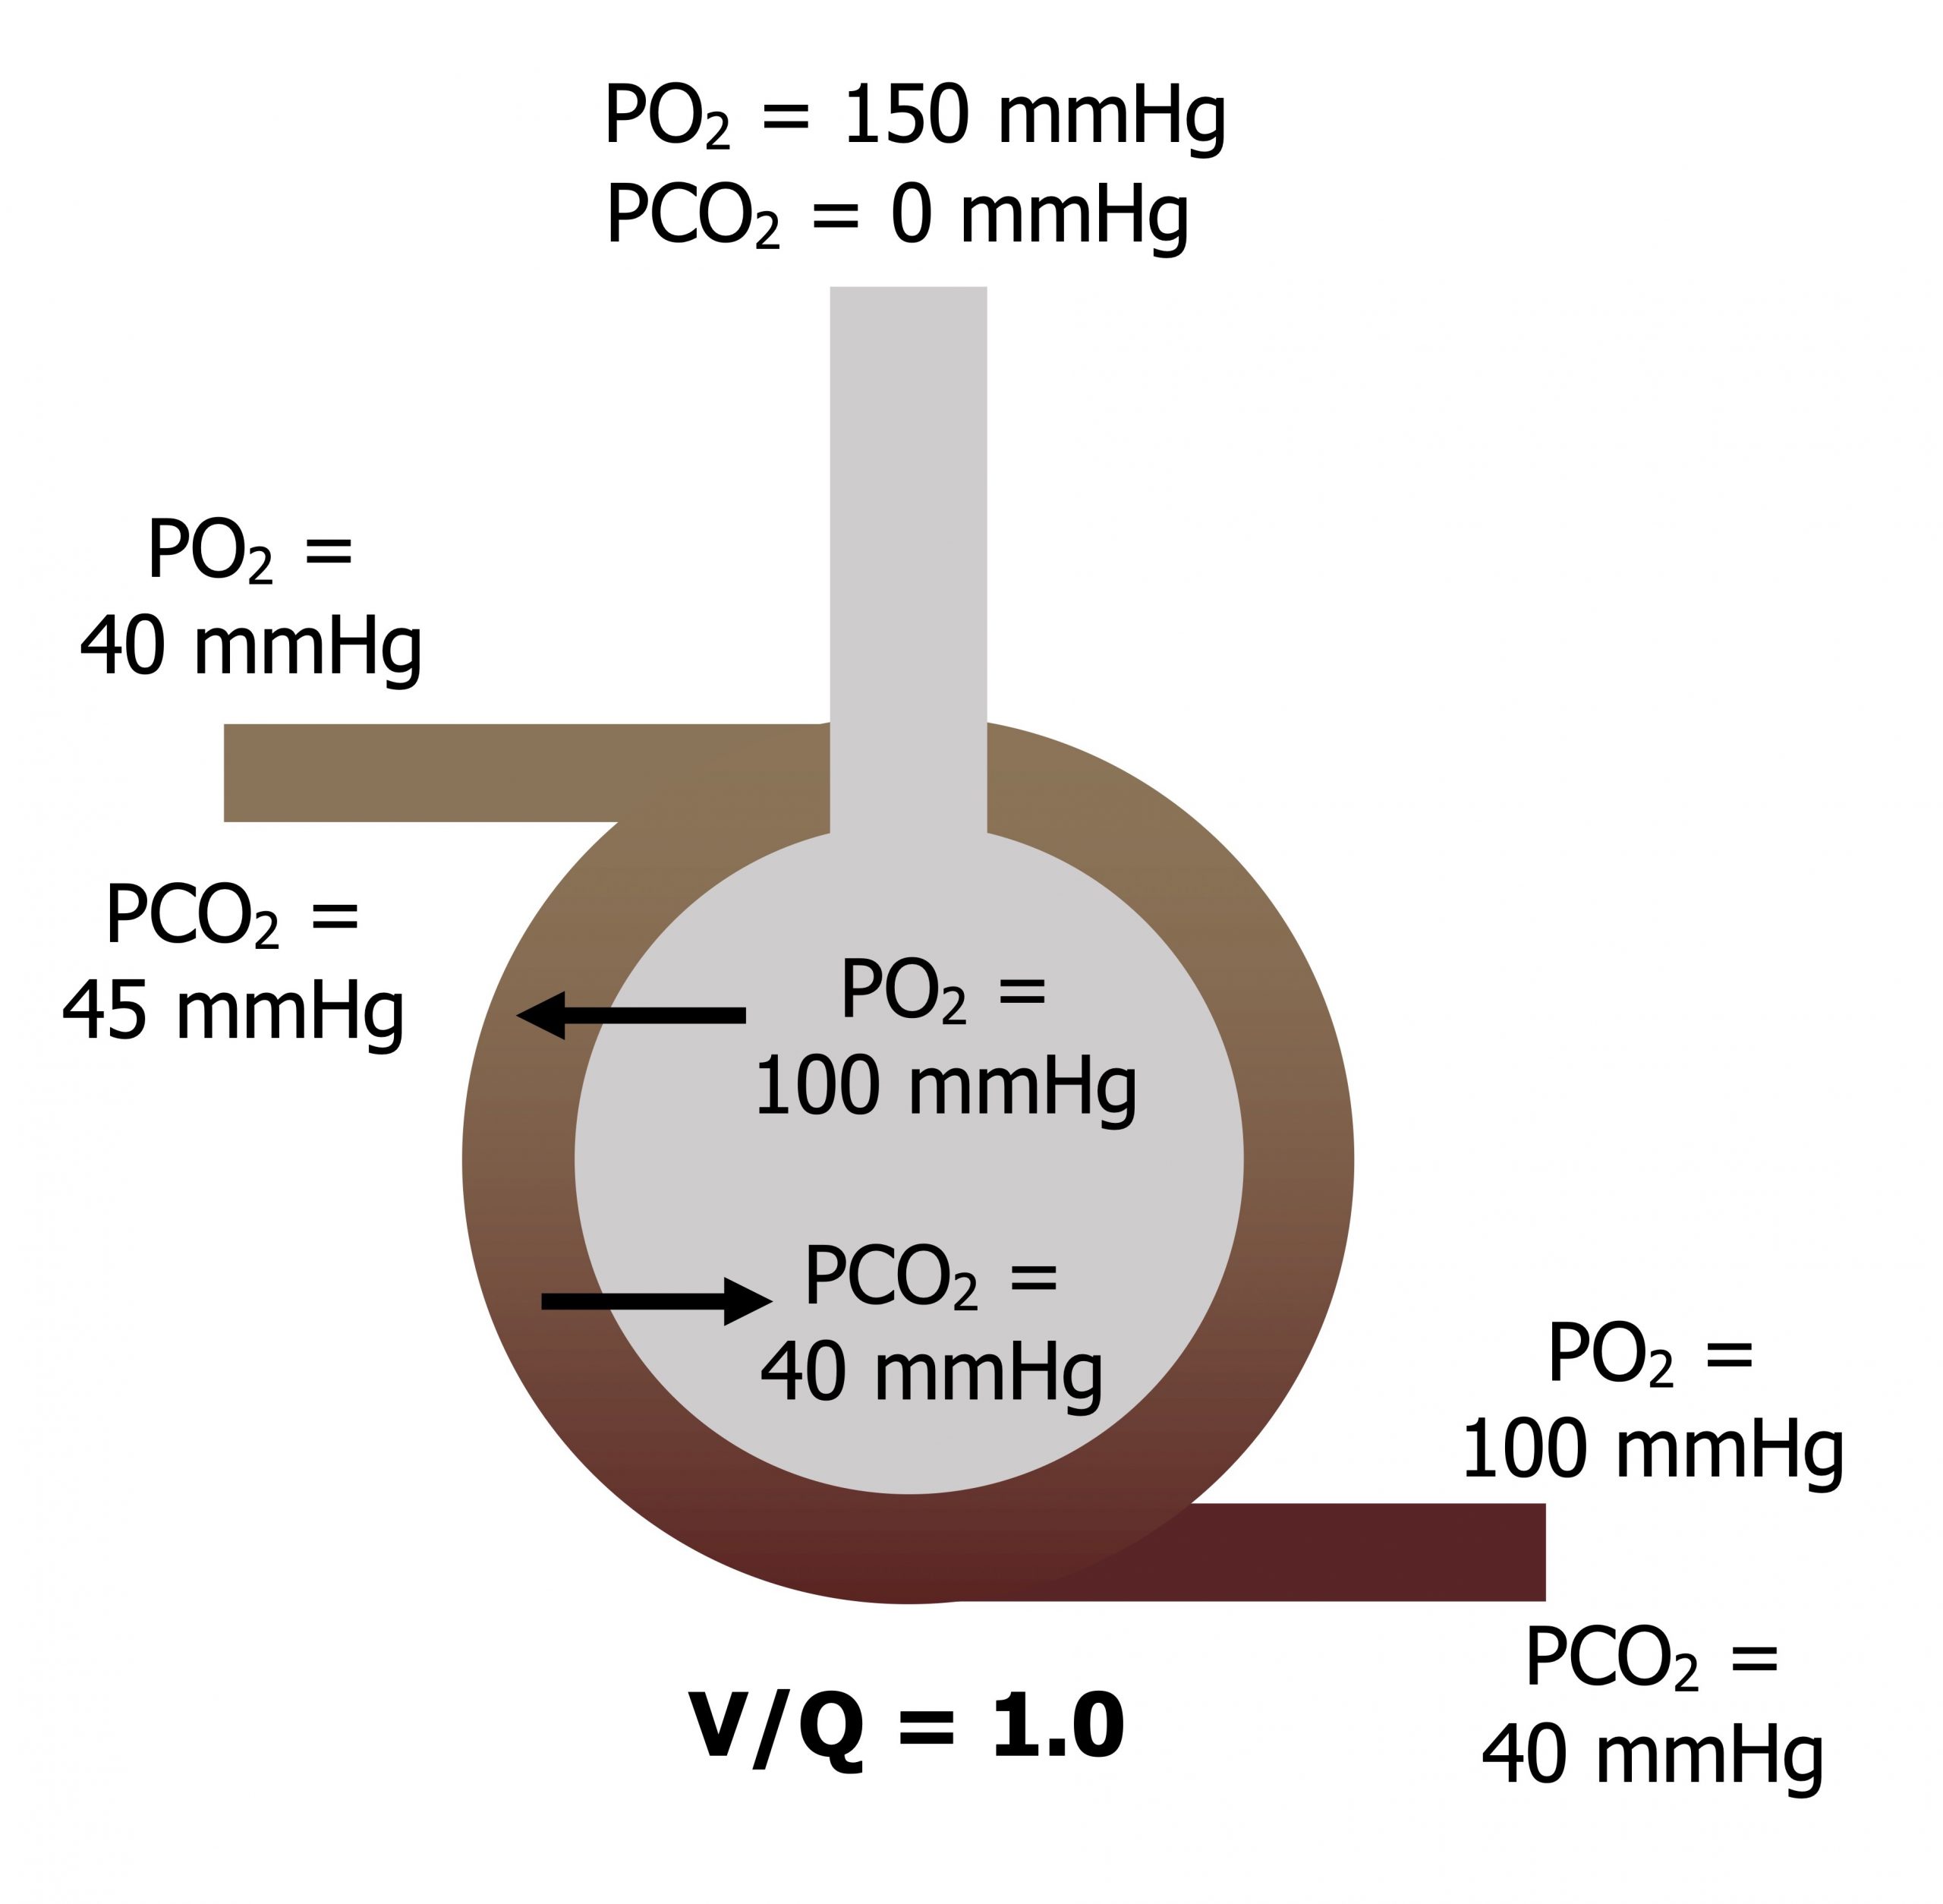
When V and Q are matched (V/Q = 1): Atmospheric PO2 is diluted as it descends the airways to give an alveolar PO2 of 100 mmHg, and alveolar PCO2 is 40 mmHg. The blood returning from the tissue has a diminished PO2 of 40 mmHg and a raised PCO2 of 45 mmHg. As this blood passes the alveolus, oxygen moves into the bloodstream down its pressure gradient and CO2 moves into the alveolus down its pressure gradient. As ventilation and perfusion are matched then equilibrium is reached and the blood leaves with arterial gas tensions that are the same as alveolar tensions (figure 13.2).
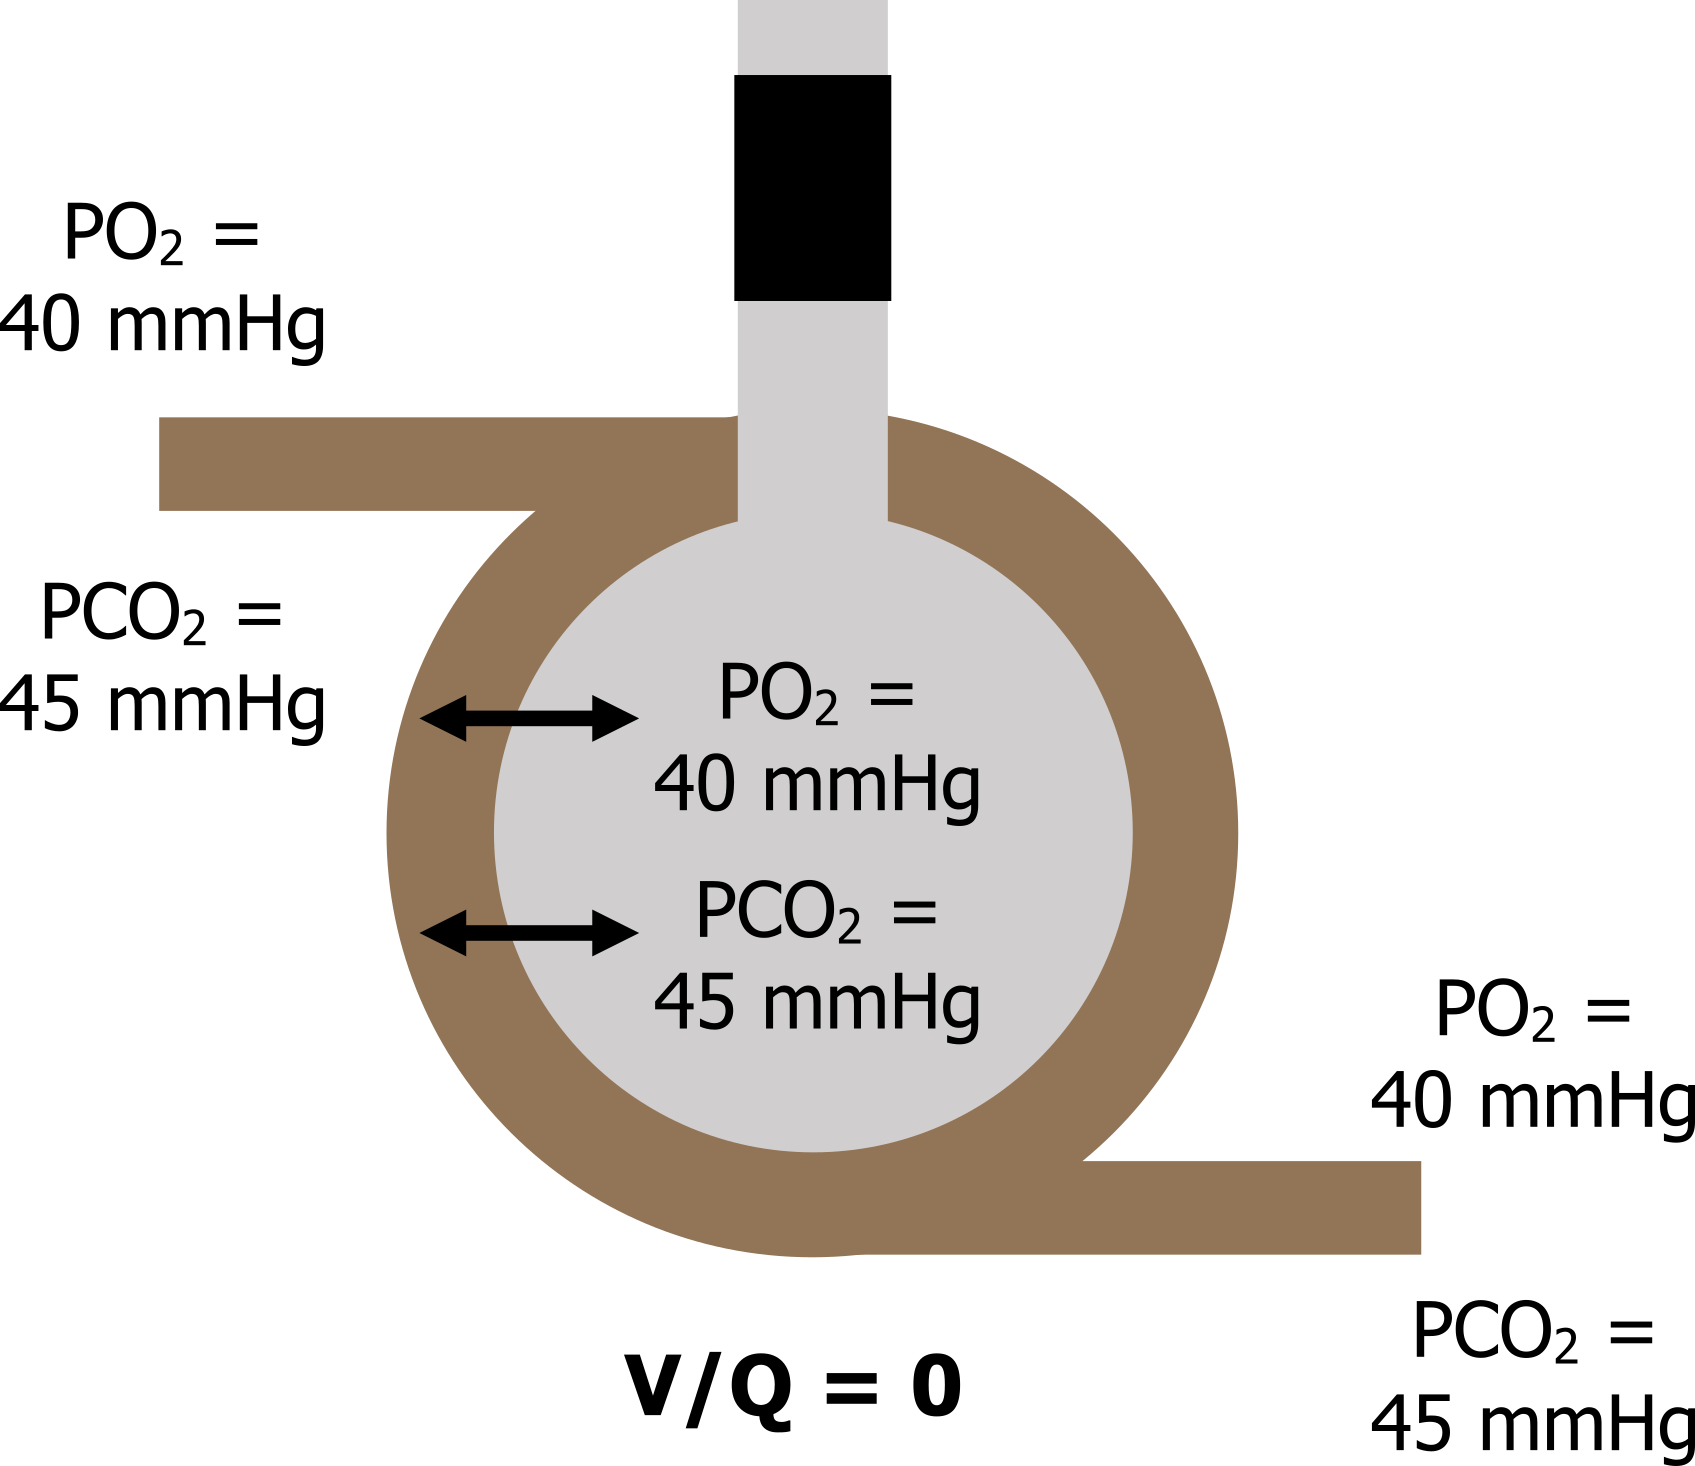
When V = 0: Now let us look at another and extreme situation, where ventilation (V) is zero so our V/Q is zero (zero divided by anything is zero).
This situation is clinically possible as airways can collapse or become blocked with a mucus plug. Without any ventilation the gas tensions inside the alveolus rapidly equilibrate with the returning venous blood, so alveolar gas tensions end up as a PO2 of 40 mmHg and a PCO2 of 45 mmHg. The venous gas tensions, never having been exposed to a ventilated alveolus, now circulate into the arterial system, and arterial PO2 becomes 40 mmHg and PCO2 becomes 45 mmHg there as well (figure 13.3).
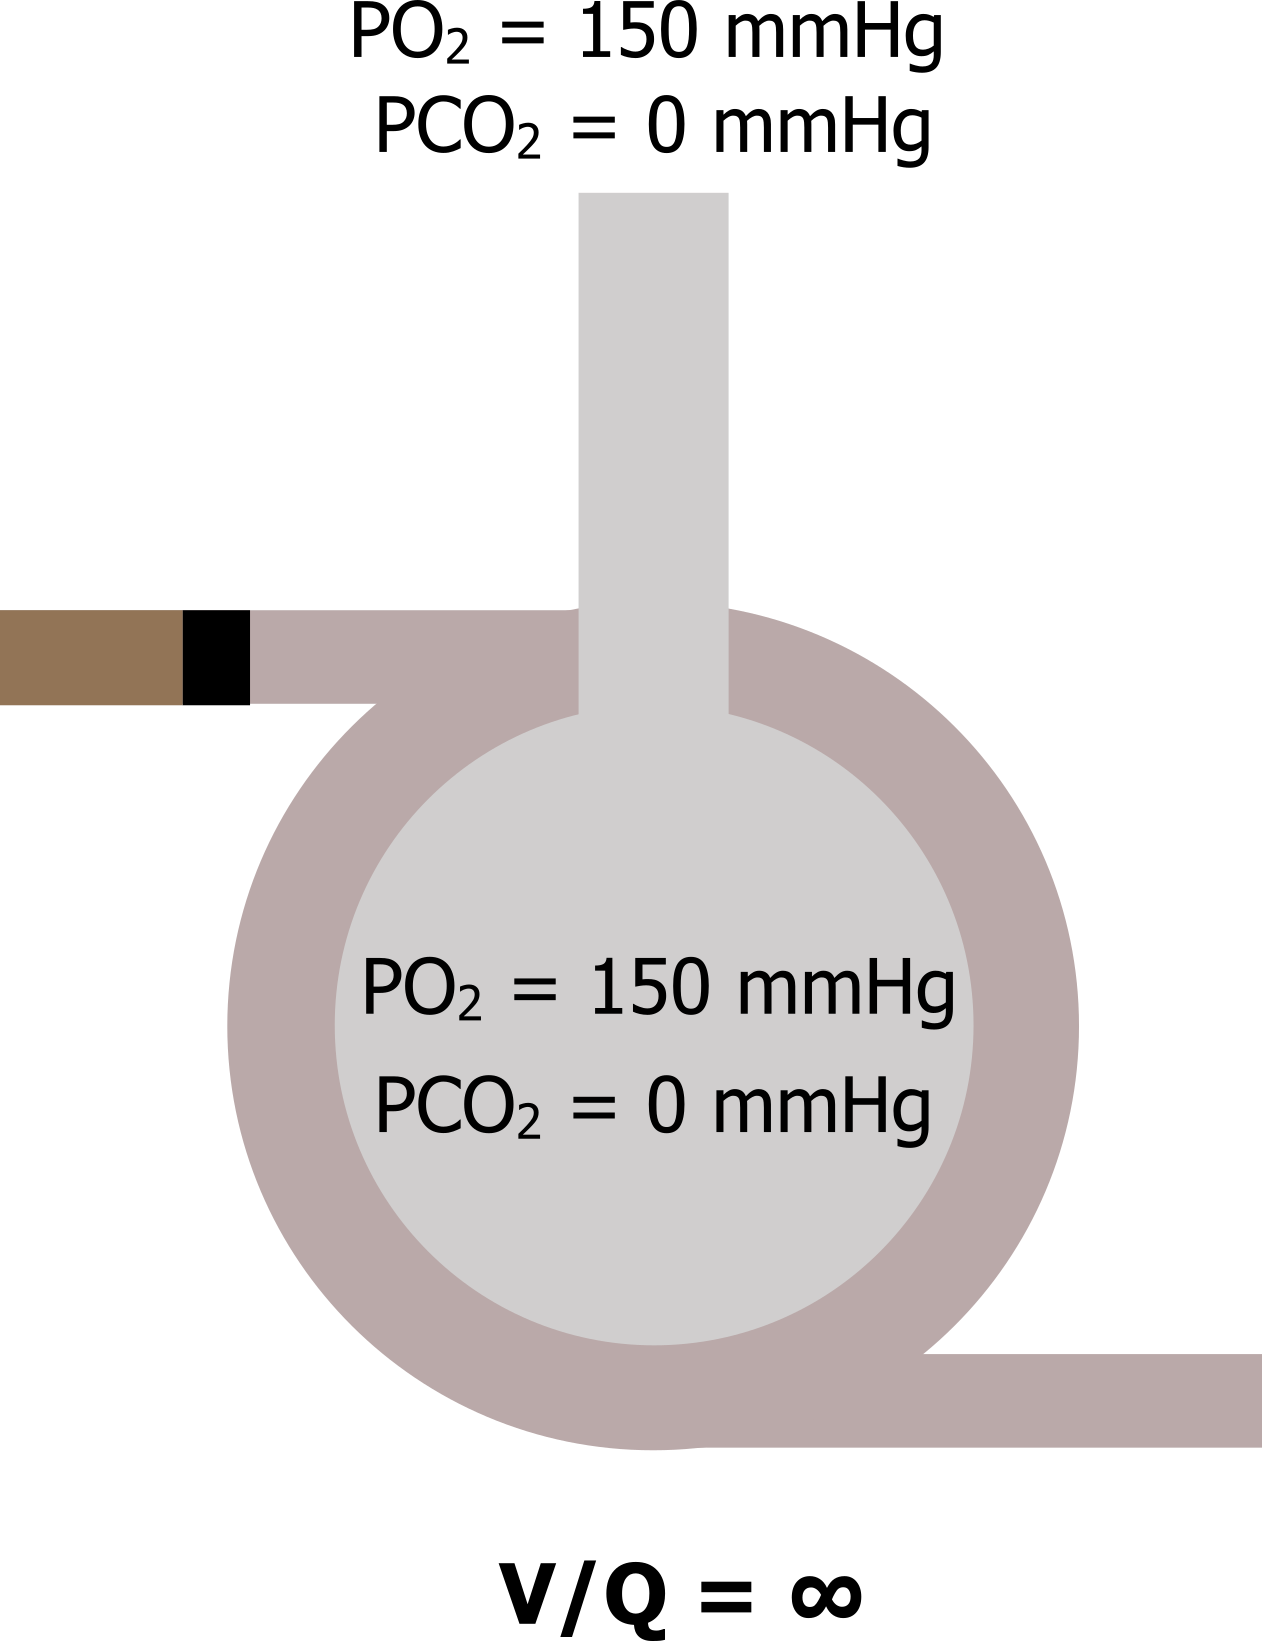
When Q = 0: Now let us go to the other extreme, where perfusion is zero and ventilation is normal (V/Q goes to infinity). Again, this can occur in reality should a pulmonary vessel become blocked by an embolus. In this scenario V/Q becomes infinity—anything divided by zero is infinity. With no perfusion, no gas exchange occurs in this alveolus, and as it is still being ventilated then the alveolar gas tensions equilibrate with the atmosphere (figure 13.4).
So going from these extremes of V/Q as zero, passing through the ideal of V/Q of 1 to a V/Q of infinity, we get a range of alveolar gas tensions going from venous gas tensions when V/Q is zero to atmospheric gas tensions when V/Q is infinite.
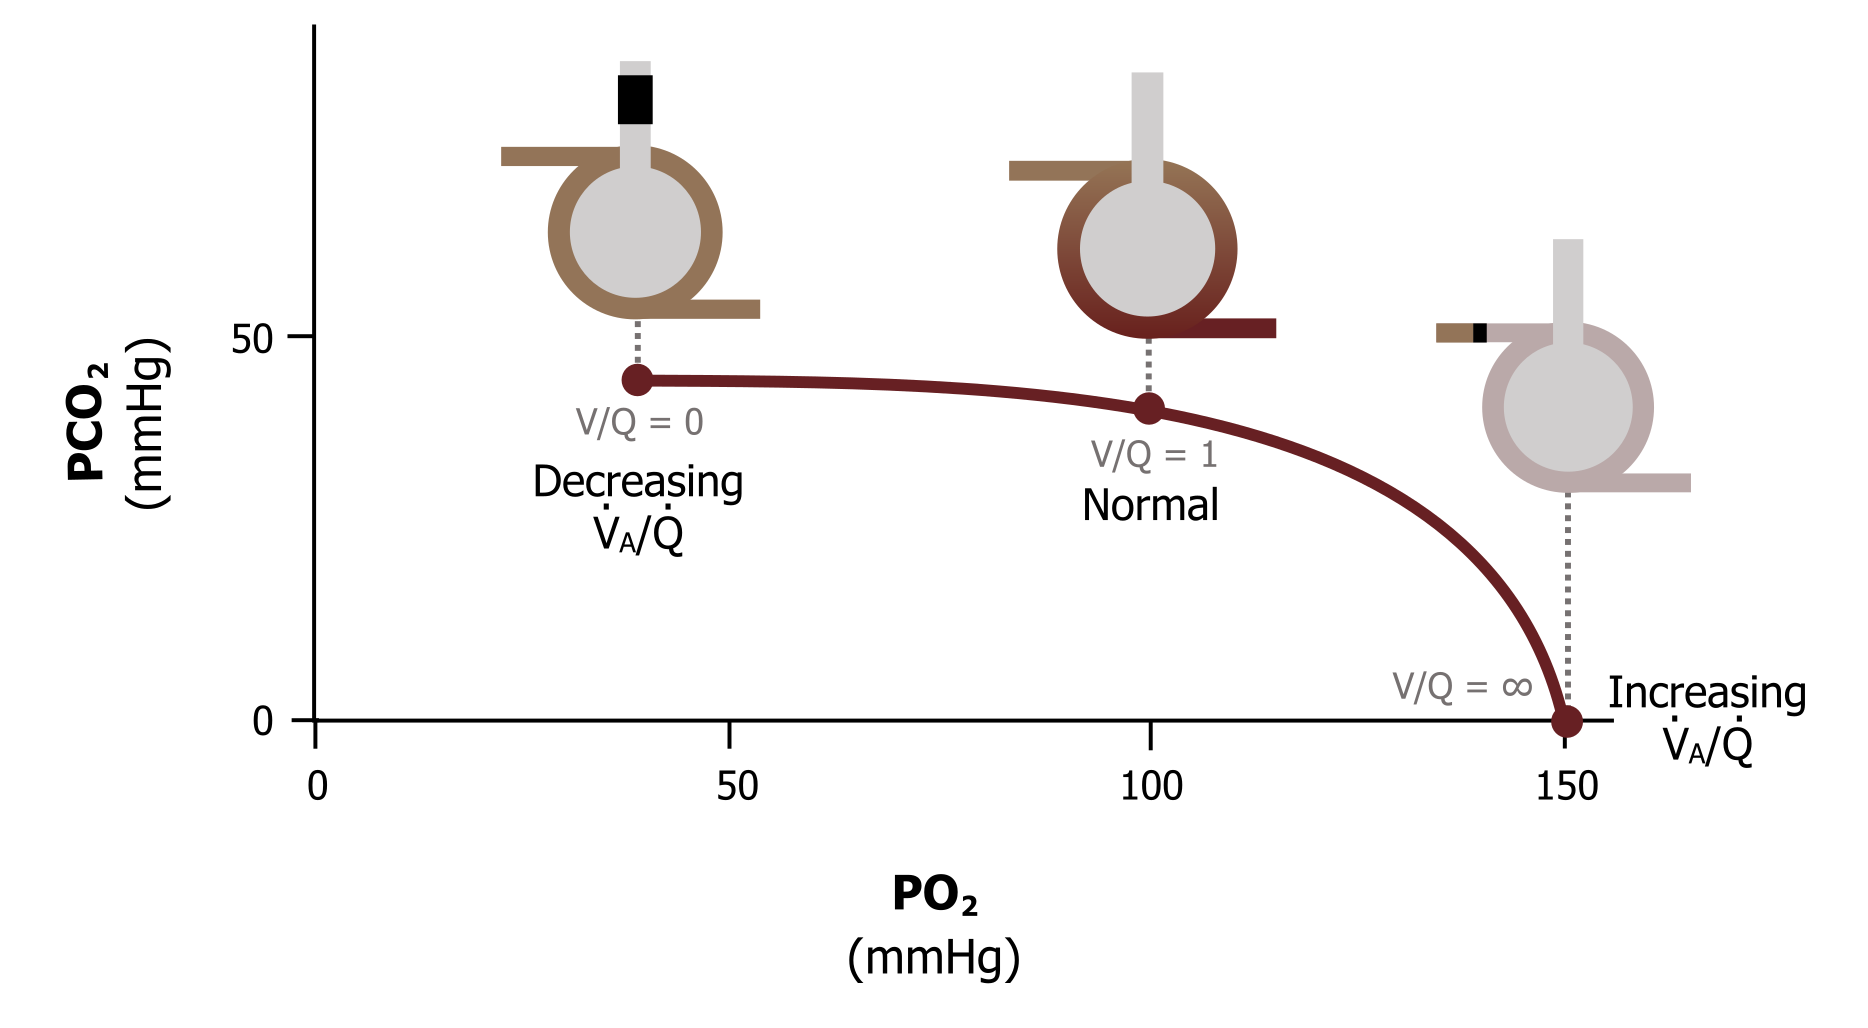
This range of alveolar gas tensions is represented by the ventilation–perfusion line (figure 13.5). This graph takes a minute to come to grips with, so let us break it down. The axes of the graph show alveolar PO2 on the X and alveolar PCO2 on the Y. The plot shows the range of V/Q ratios we have just discussed, ranging from zero when there is perfusion but no ventilation, to infinity when there is ventilation but no perfusion. Looking at figure 13.5 more carefully will confirm our numbers. When ventilation and perfusion are present and V/Q is 1, then our alveolar PO2 is 100 mmHg, and the alveolar PCO2 is 40 mmHg—just as we have seen.
If we stop ventilation and go to a V/Q of zero, we again see that the alveolar gas tensions become equal to venous values, with alveolar PO2 at 40 mmHg and PCO2 at 45 mmHg.
And finally, when we stop perfusion and V/Q becomes infinite, then alveolar PO2 becomes 150 mmHg and PCO2 becomes zero (i.e., equilibrates with the atmosphere).
Summary
In summary, the ventilation–perfusion line show the effect of changing V/Q on alveolar gases. Reduce V/Q toward zero and the alveolar gas tensions tend toward venous gas tensions. Increase V/Q toward infinity and the alveolar gas tensions get closer to atmospheric partial pressures.
The importance of understanding this becomes apparent when we see that V/Q changes across the structure of the lung, and if V/Q changes, then alveolar partial pressures change to.
Let us look at the distribution of V/Q across the lung and why it changes from apex to base.
Distribution of V/Q
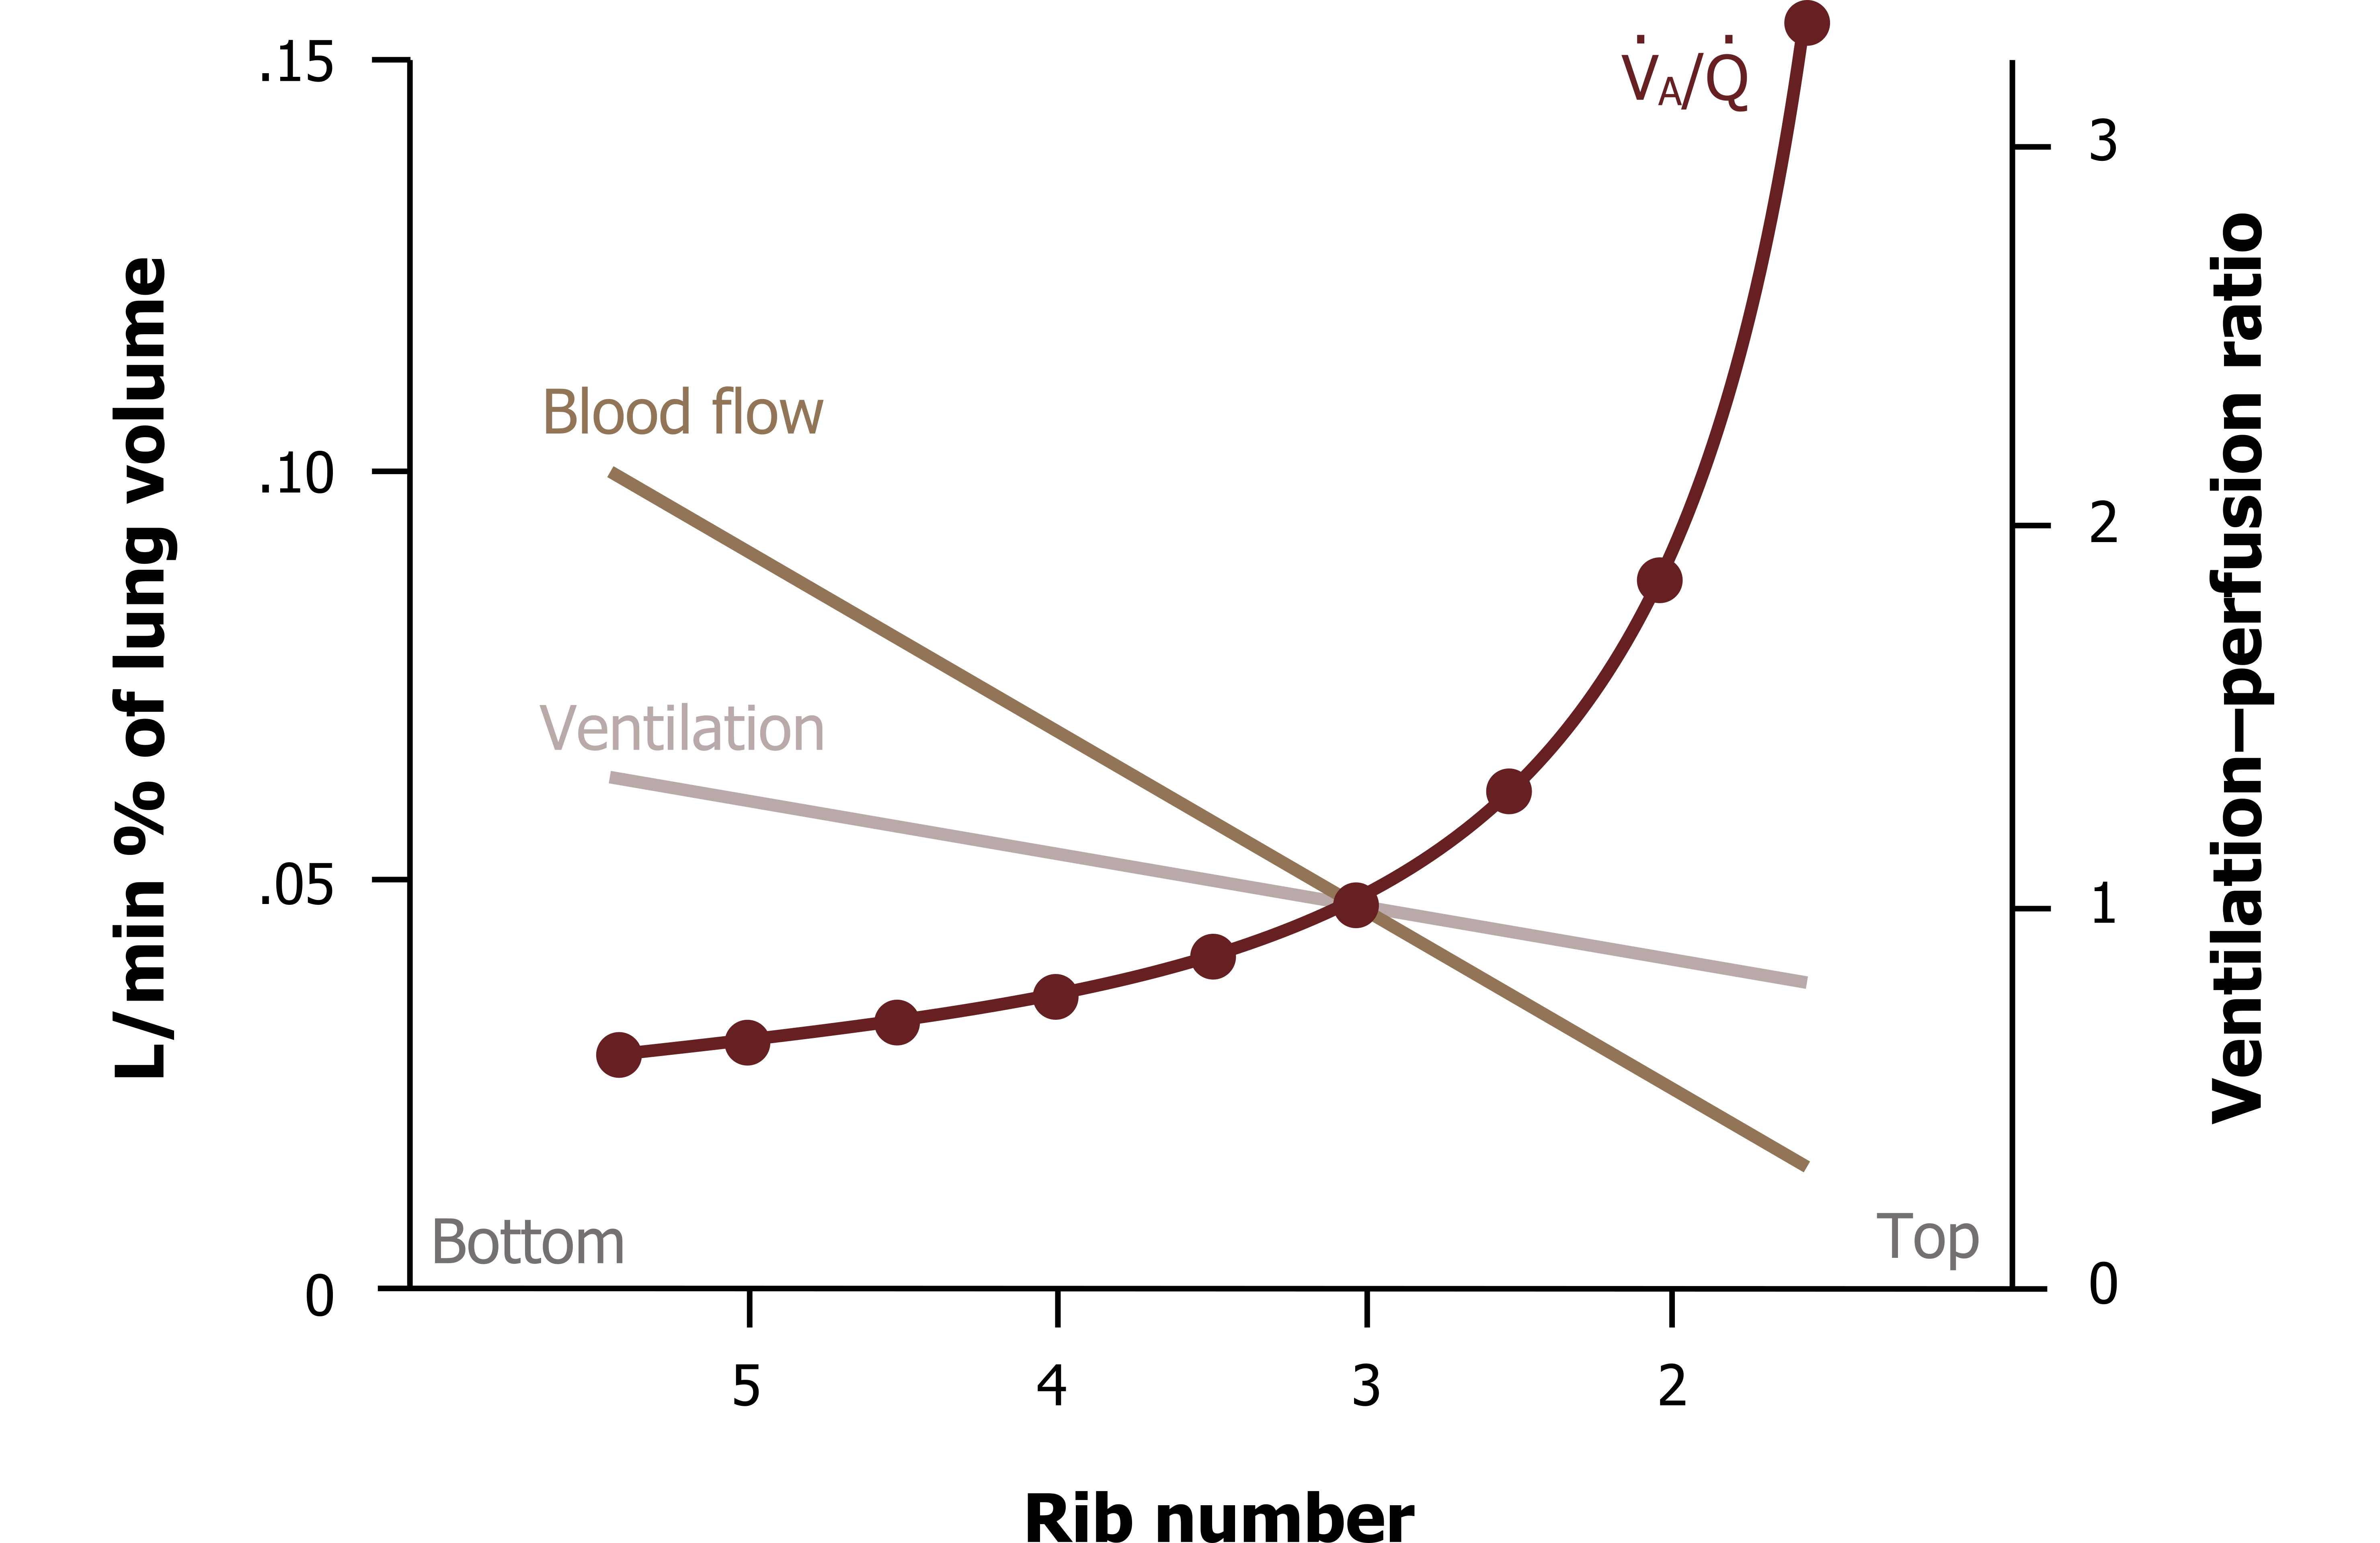
As you should understand, ventilation increases down the lung so is greatest at the base, and perfusion follows the same pattern—all due to the effects of gravity. But the increase in ventilation down the lung structure is not equal to the increase in perfusion, as can be seen in figure 13.6. You can see here that perfusion is higher than ventilation at the base; it falls off much more rapidly as the lung is ascended, so it ends up being lower than ventilation at the apex.
This means there is a range of ventilation–perfusion ratios up the height of the lung (figure 13.6, maroon plot). At the base perfusion is higher than ventilation, so V/Q is less than 1, while toward the apex V/Q rises and becomes greater than 1. At about the level of the third rib, V/Q is perfect (yay!) as ventilation and perfusion are matched, seen here at the points the lines cross. This range of V/Q results in the previously mentioned whole lung average of 0.8.
As you should appreciate from understanding the ventilation–perfusion line, this range of V/Q across the lung results in a range of alveolar gas partial pressures across the lung. The apical alveoli, being relatively overventilated (or underperfused, whichever way you would like to think about it), have a high V/Q and consequently have partial pressures closer to atmospheric partial pressures. On the other extreme, the basal alveoli are relatively underventilated (or overperfused, your choice) and so have a low V/Q, tending toward zero; thus their partial pressures are closer to venous values (figure 13.7).
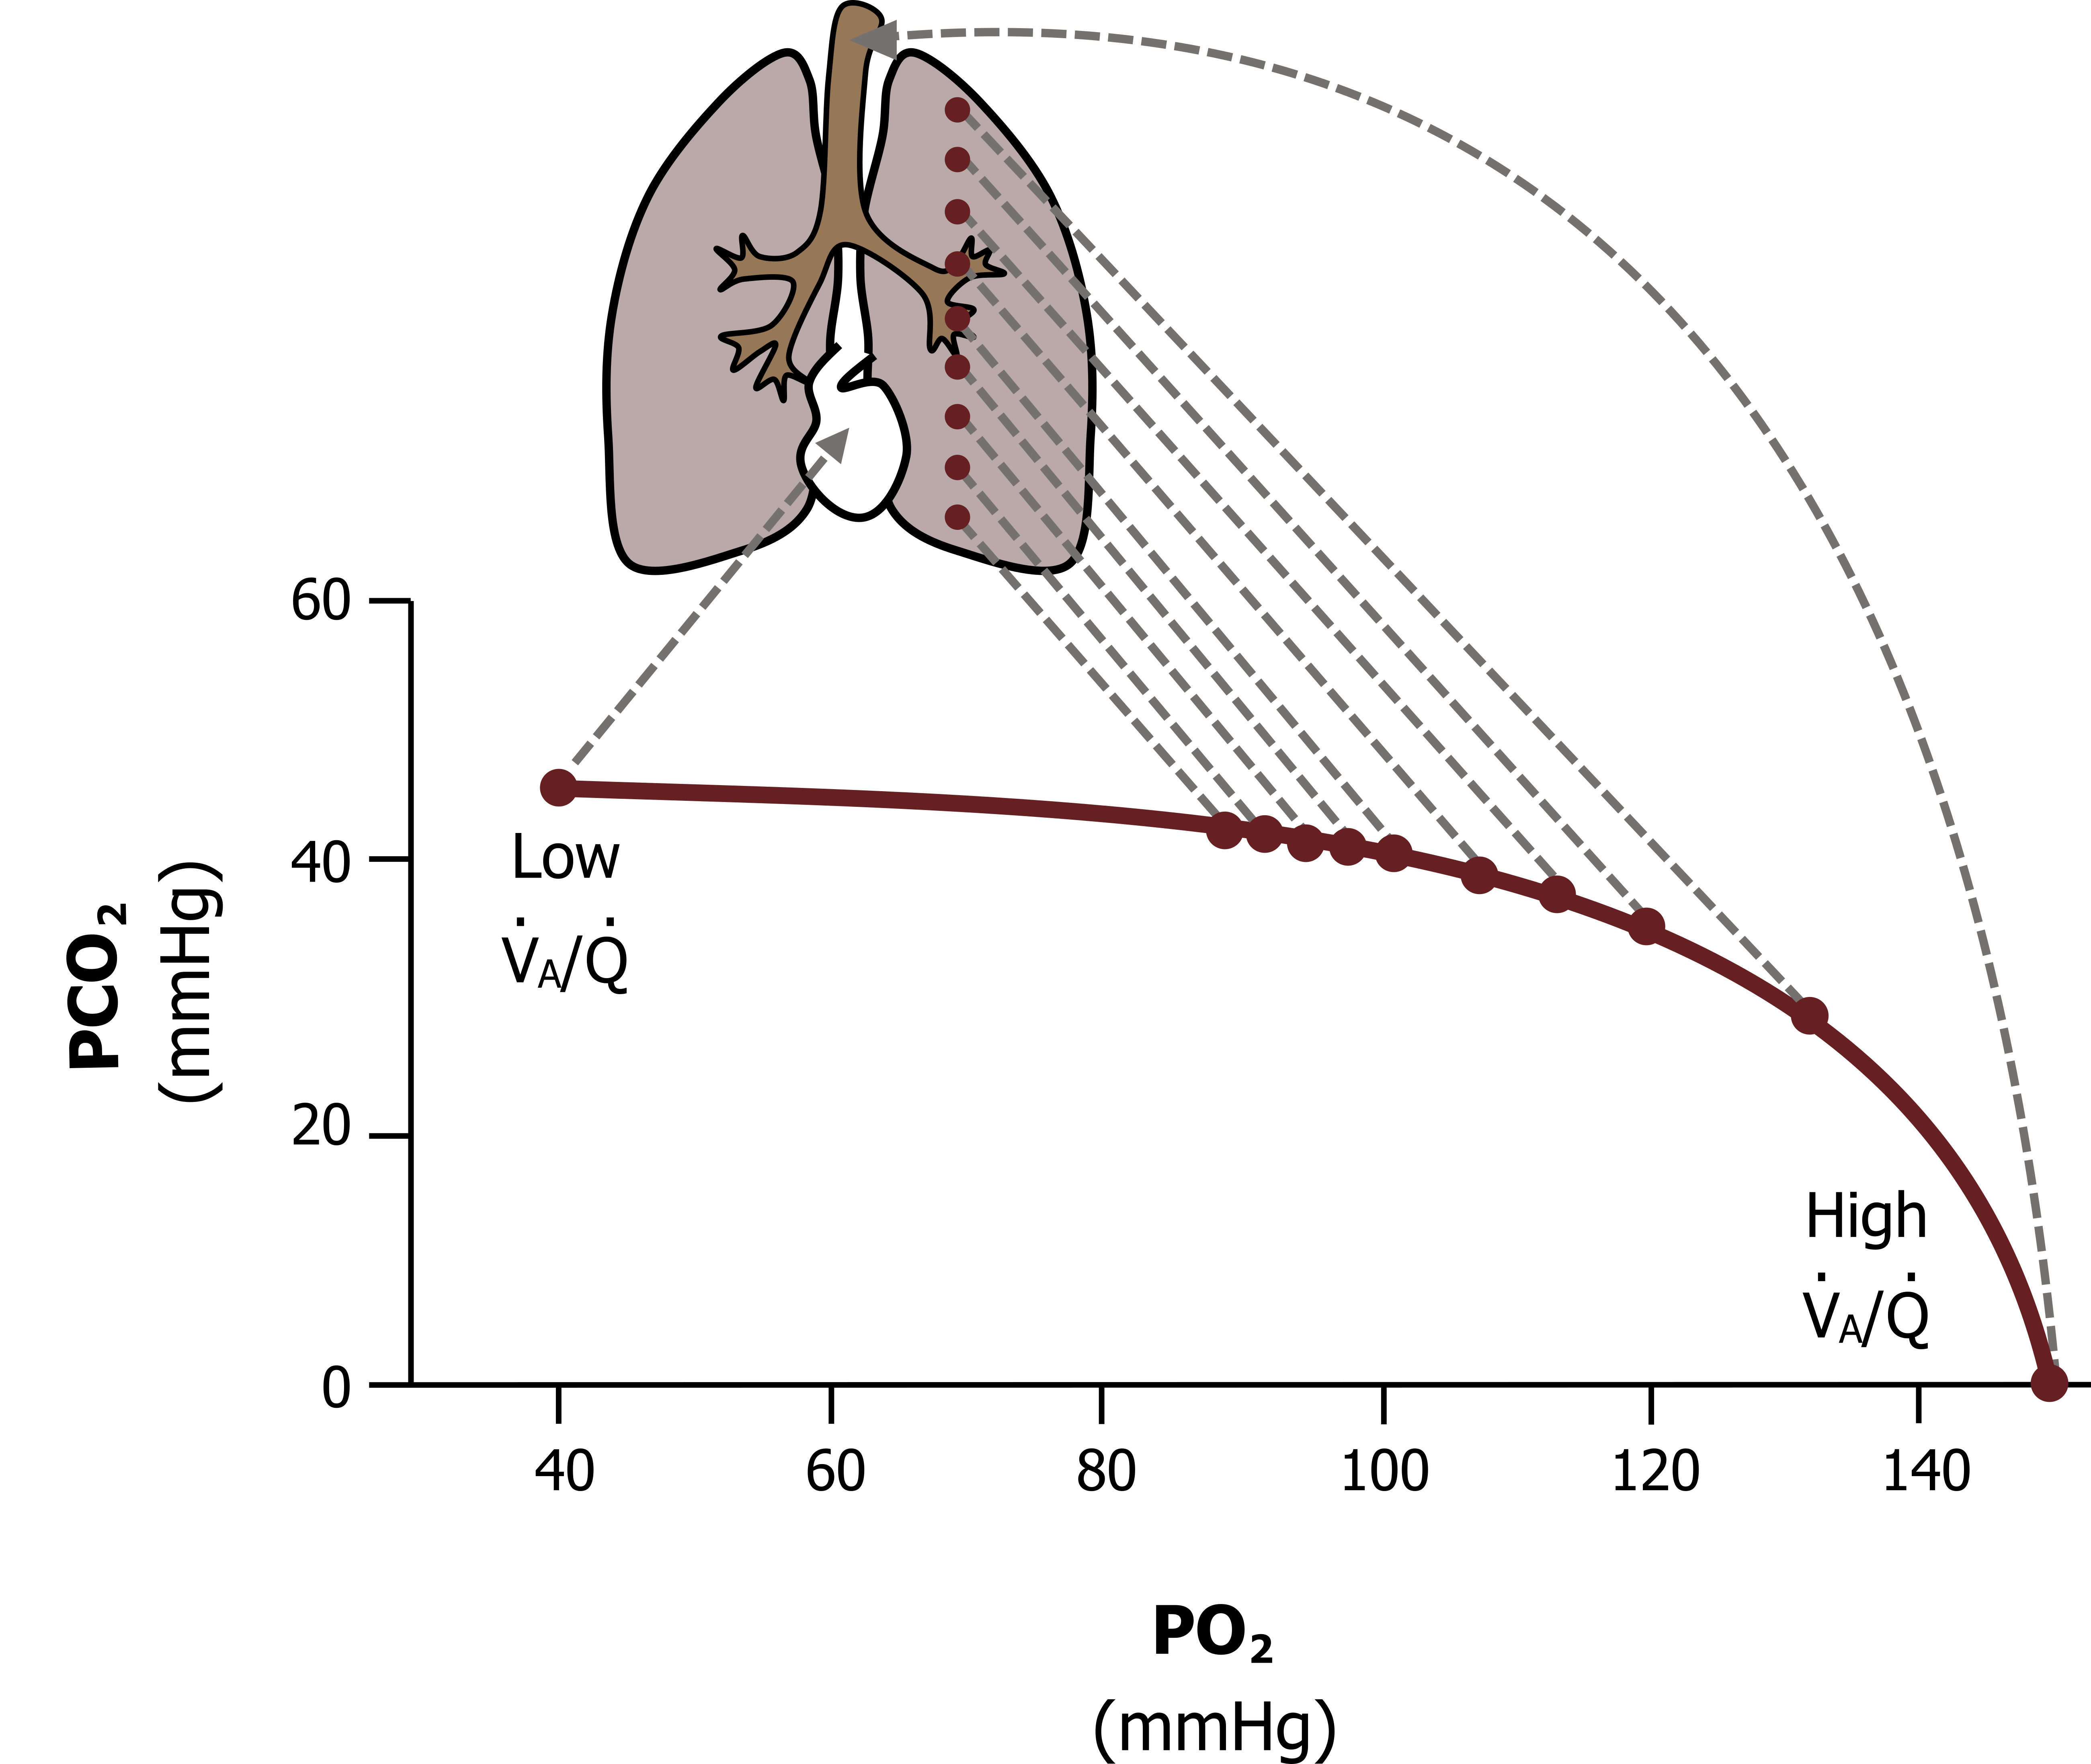
In between these two extremes is a progressive range, so what we see is that alveolar PO2 declines down the lung while alveolar PCO2 rises. As you might imagine, having a range of alveolar gas tensions down the lung has ramifications for gas exchange and particularly for oxygen saturation. This inequality in V/Q resulting in differences in alveolar PO2 is substantial enough to suppress arterial oxygen saturation—and contribute to your oxygen saturation meter never reading 100 percent. Let us see why.
The difference in alveolar PO2 from apex to base is as high as 40 mmHg, as is reflected in this figure. The apical alveoli have a high PO2 (shown in figure 13.8 as 132 mmHg), primarily due to their poor perfusion and relatively high ventilation and thus high V/Q. This produces a high diffusion gradient from 132 mmHg in the apical alveoli, to 40 mmHg in the apical blood. Consequently, what blood does go to the apex becomes fully saturated before it heads back toward the left heart.
Down at the base, however, V/Q is low because of the high perfusion and relatively low ventilation. Consequently the PO2 in basal alveoli tend toward venous values, shown in figure 13.8 as 89 mmHg. This lower alveolar PO2 means a diminished diffusion gradient (from 89 in the alveoli to 40 mmHg in the blood), and combined with a shift down the hemoglobin saturation curve (more on this later), this means blood leaving the basal alveoli may not be completely saturated with oxygen.
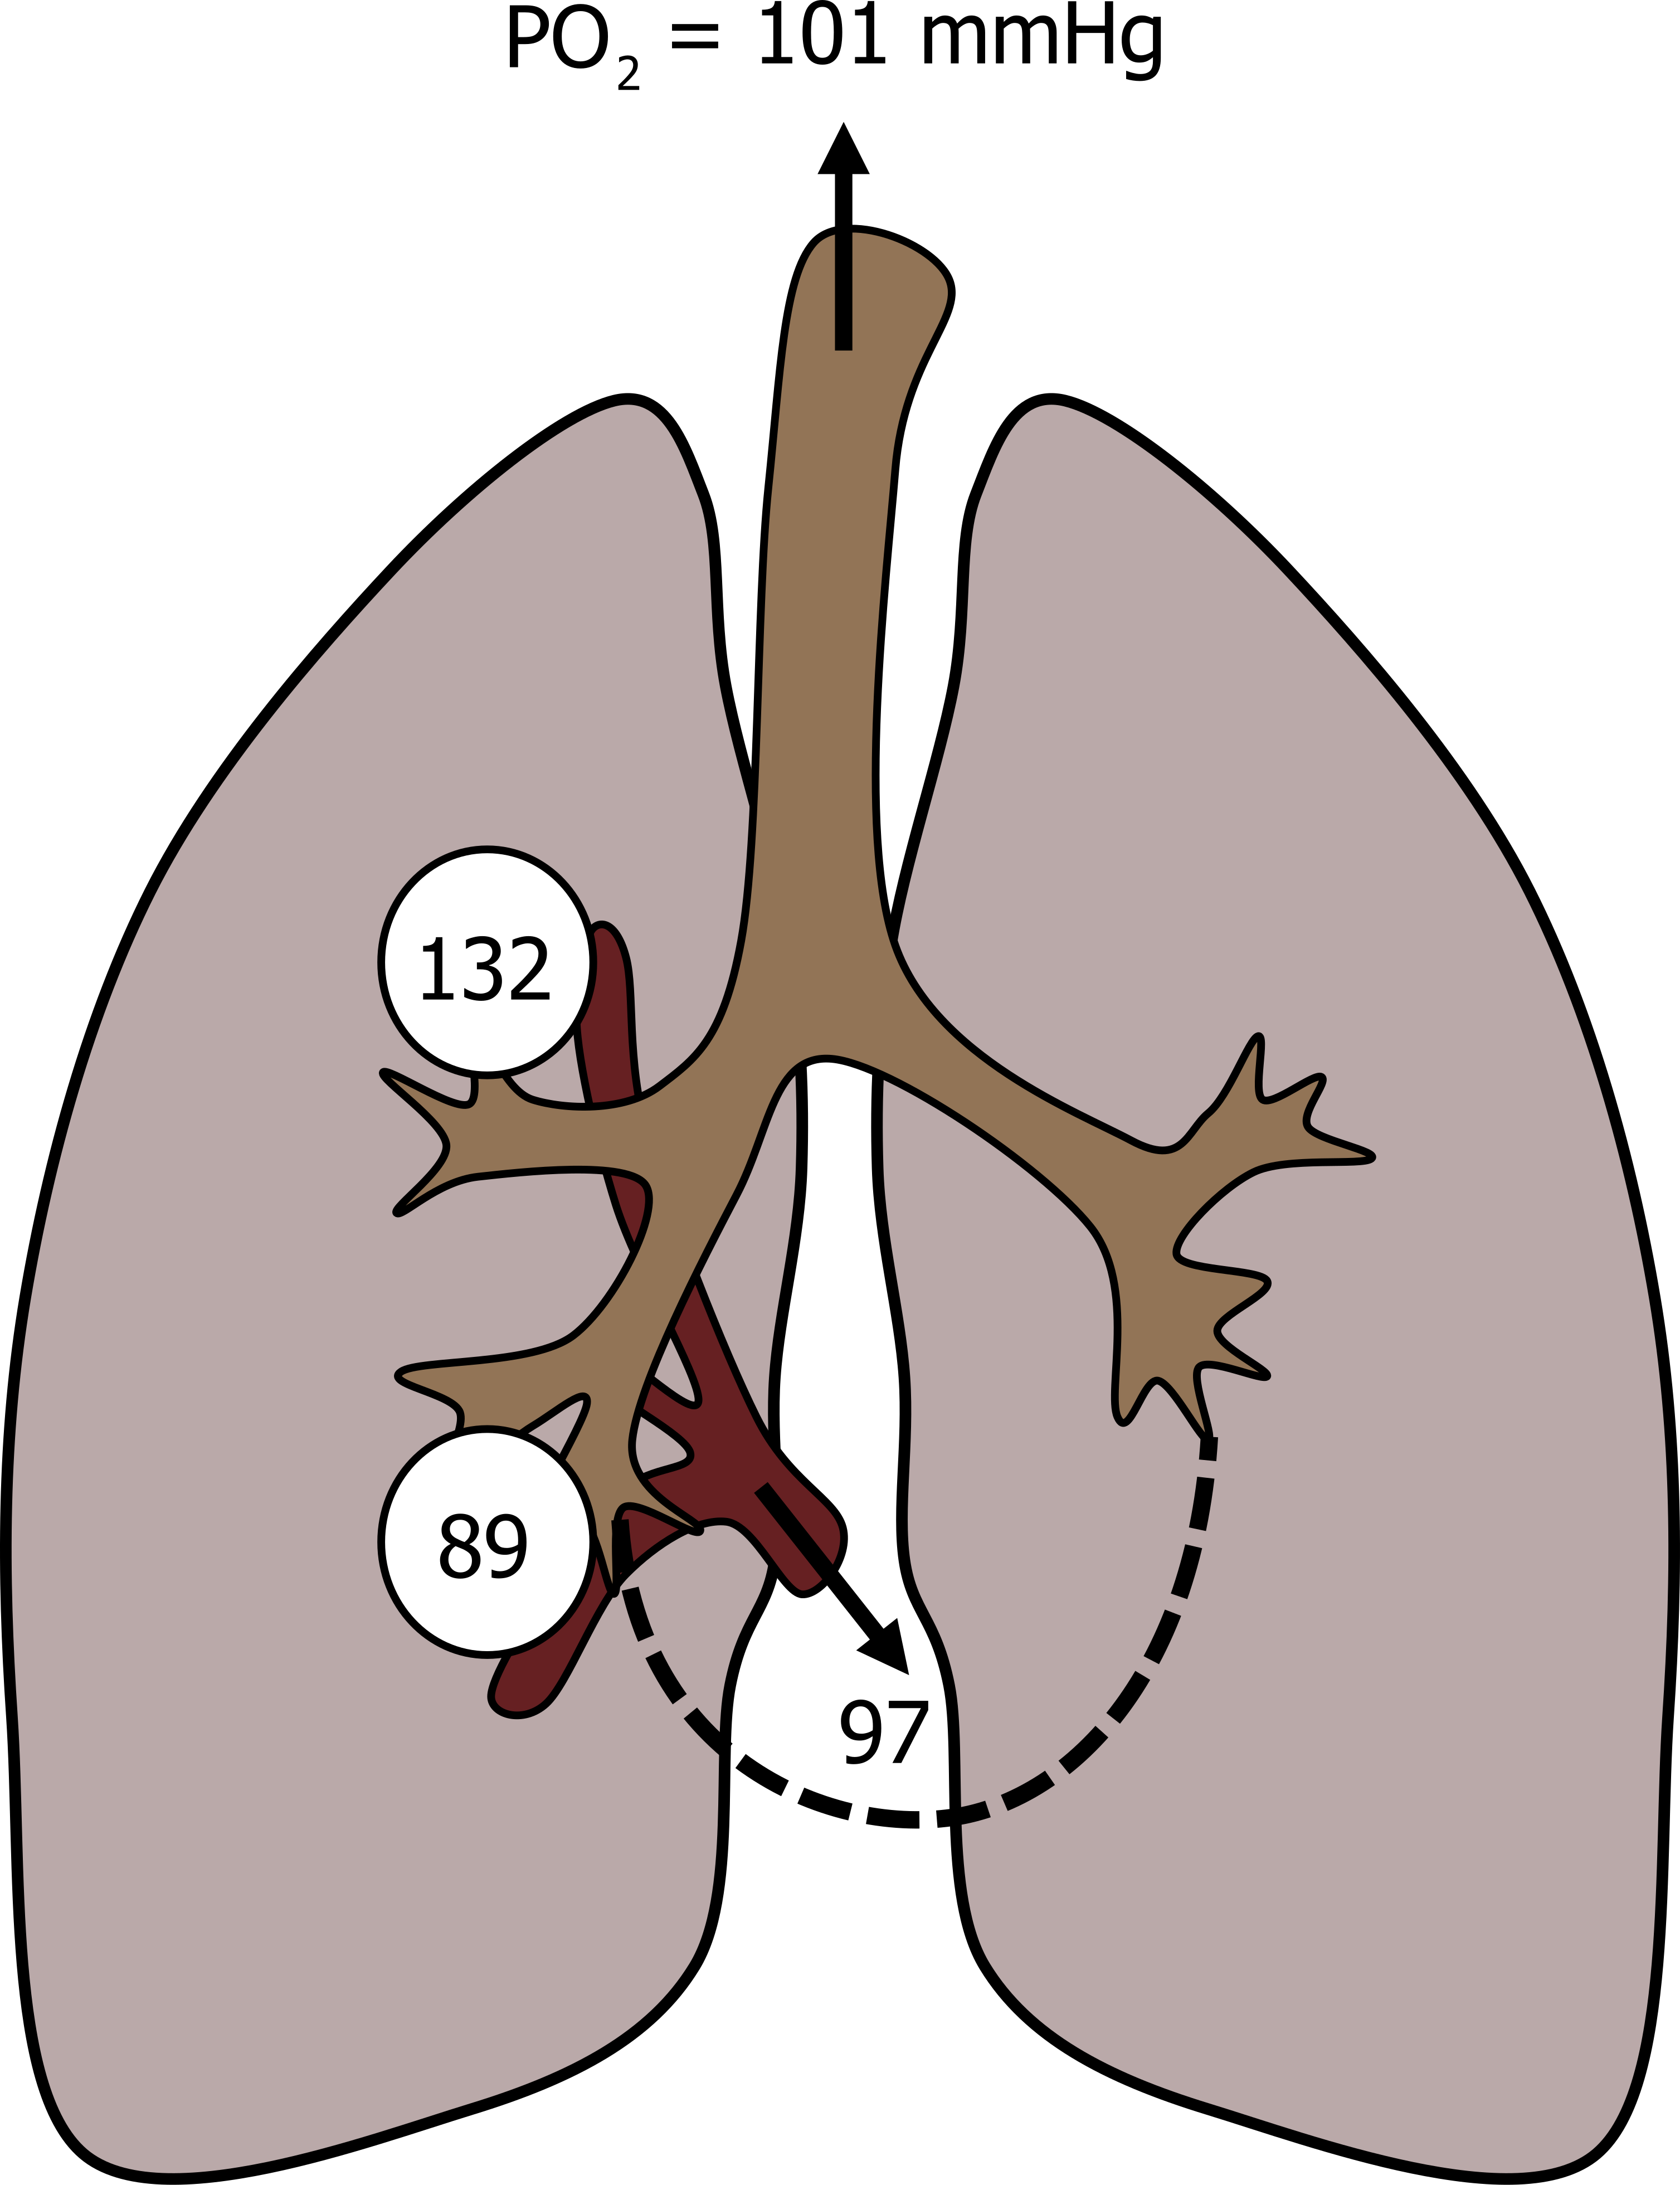
When the blood from the apex and base mix on their journey back to the left heart, the outcome is that the combined oxygen saturation is less than 100 percent, about 97 percent. It is worth making perhaps an obvious but critical point here. The blood from the apex is exposed to a substantially higher PO2 and becomes 100 percent saturated (i.e., it cannot take on any more O2 as it is at its full oxygen carrying capacity). There is no way that it can pick up extra to compensate for the blood coming from basal alveoli, which are not at capacity.
The same is not true for CO2 though. Because of its high solubility, CO2 transport does not rely on a transporter protein like hemoglobin; the transfer of CO2 is really dependent on the diffusion gradient present. So at the apex the lower alveolar PCO2 (slightly less than 30 mmHg looking at our V/Q line) generates a larger diffusion gradient with venous blood, and more CO2 is transferred out the blood, meaning that it can compensate for the low diffusion gradient (perhaps only a few mmHg) that occurs between the alveoli and blood at the lung’s base.
As a study exercise it may be worthwhile for you to go back to the ventilation–perfusion line and calculate the diffusion gradients for oxygen and carbon dioxide between the alveoli and venous blood at different heights in the lung. I urge you to come to grips with this concept as it is highly pertinent to respiratory disease and can explain clinical-related changes in blood gases.
The take-home message, however, is that even the normal lung is not perfect and has an average V/Q ratio of 0.8, rather than the ideal of 1, and this slight matching of ventilation and perfusion contributes to the arterial saturation being slightly less than 100 percent, but has little effect on arterial CO2. If respiratory disease increases the mismatch, this effect on oxygen saturation can become more pronounced, but the lung has a defense mechanism for this.
Correcting V/Q Mismatches
In an attempt to maintain V/Q close to 1 and prevent V/Q mismatching, the pulmonary vasculature has an unusual response to hypoxia. While the systemic vasculature responds to local hypoxia with a vasodilation to bring more blood to the area, the pulmonary vasculature constricts in the presence of low oxygen to shunt blood away from hypoxic regions.
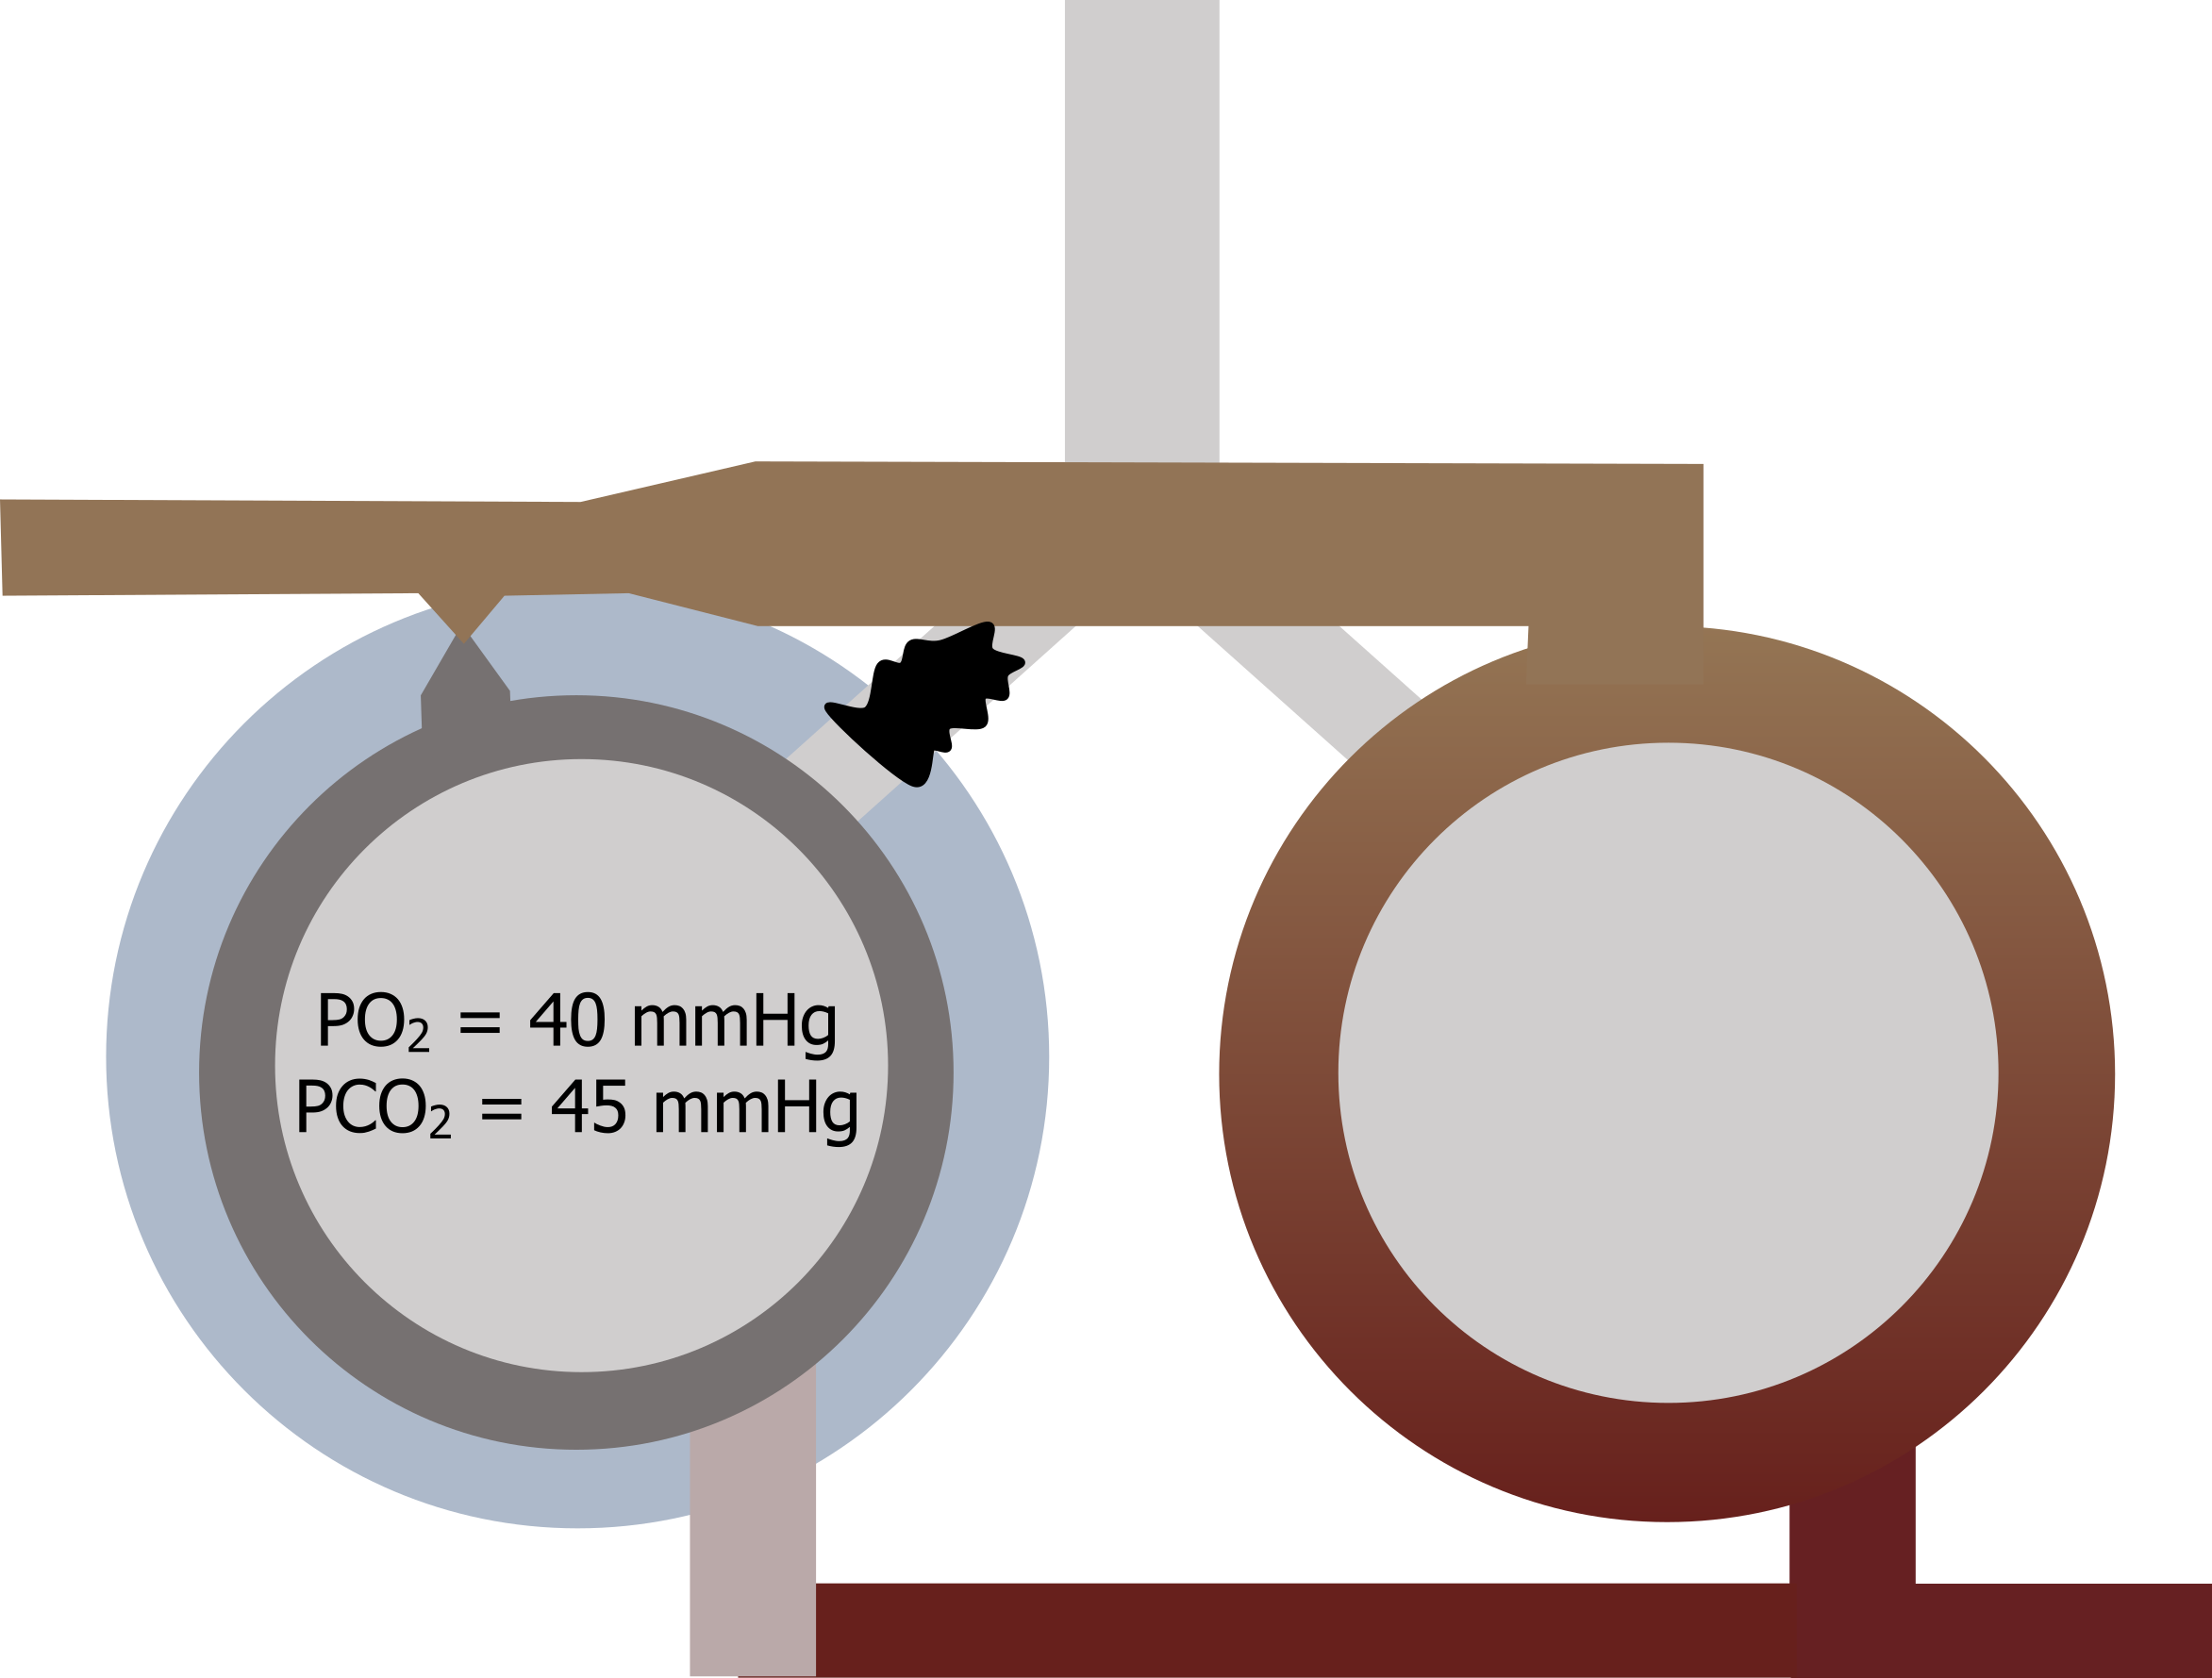
Let us look at a common scenario that might occur in a patient with chronic bronchitis. Figure 13.9 represents two regions of the lung. One region becomes blocked by a mucus plug, and ventilation to that region goes to zero.
The alveolar partial pressures will rapidly equilibrate to venous pressures, and desaturated blood goes back to the left heart from this region while the local region around this area becomes mildly hypoxic. The pulmonary vasculature responds to the hypoxia by vasoconstricting, reducing the perfusion to the unventilated region and helping to rematch the V/Q ratio in this region (i.e., low ventilation is matched with low perfusion). In common sense terms, there is no point sending pulmonary blood to an unventilated region, so the hypoxia-driven vasoconstriction prevents this from happening.
The distensibility of the pulmonary vasculature means that the blood is shunted to unconstricted vessels (i.e., those supplying ventilated regions). Thus the lung has its own inherent mechanism to optimize V/Q and promote the most effective gas exchange possible.
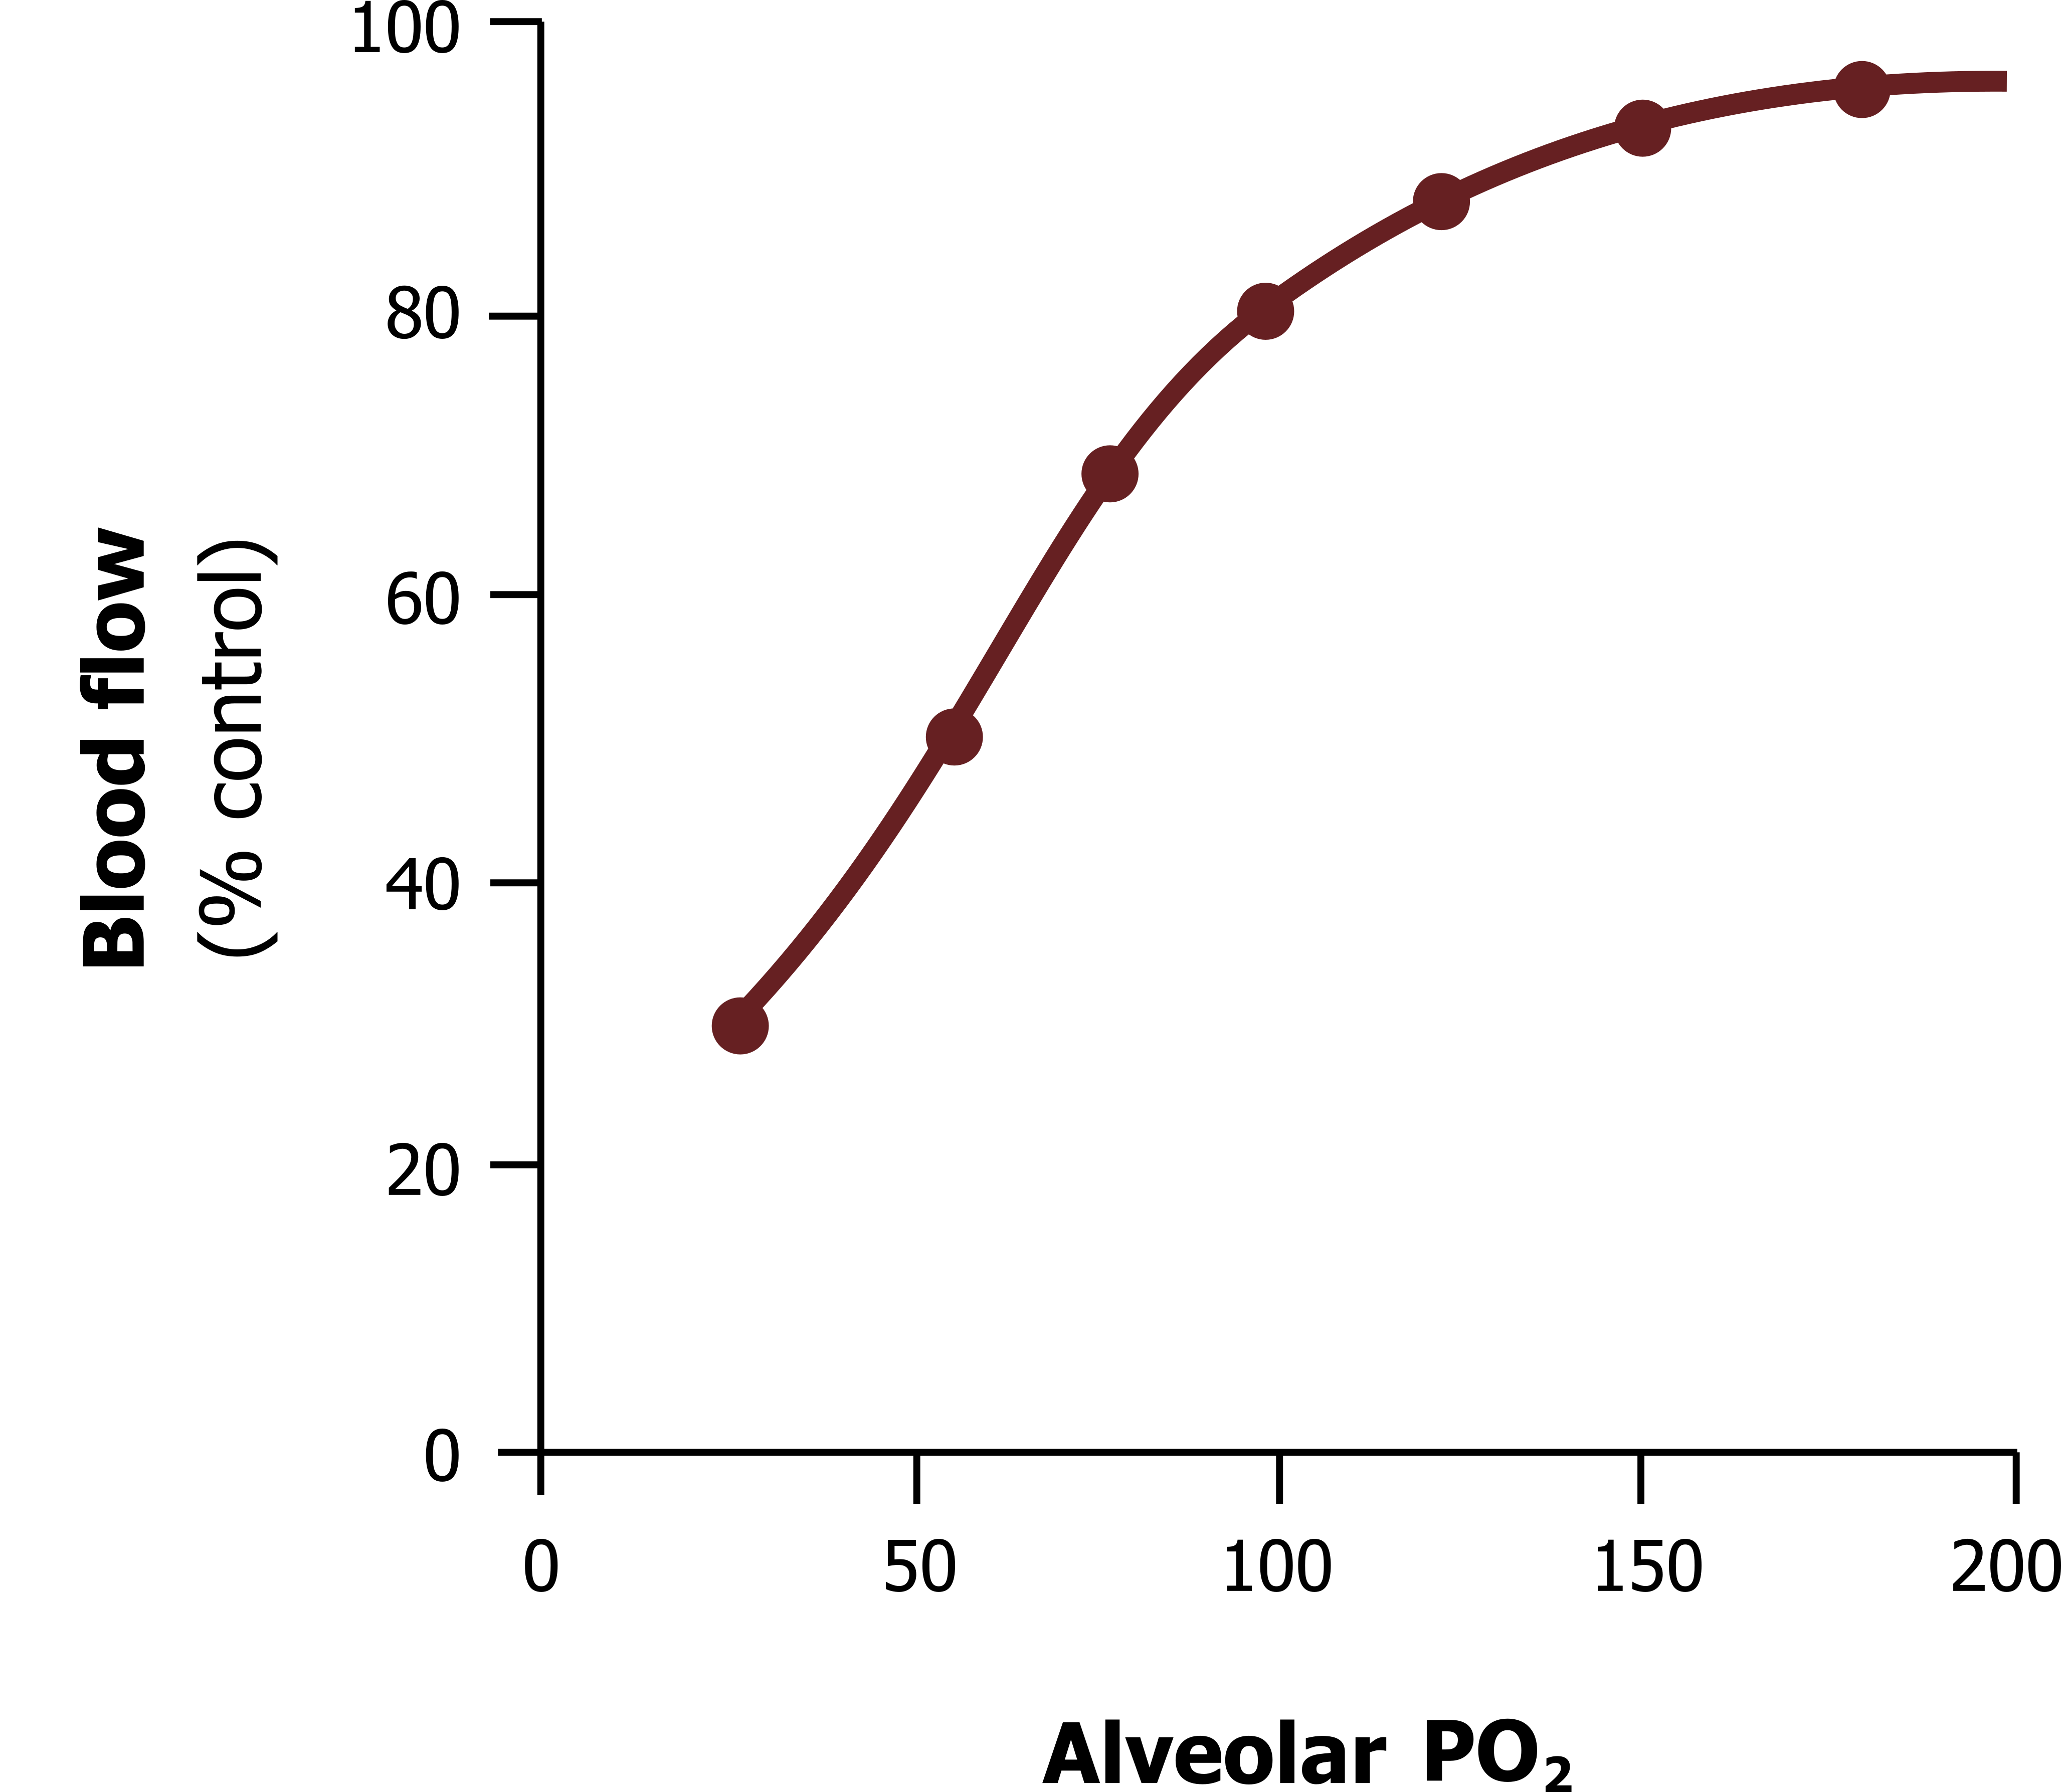
The unusual response of the pulmonary vasculature is demonstrated in figure 13.10, showing how as alveolar PO2 falls (as occurs with a decline in alveolar ventilation) then blood flow falls—and likewise, the more oxygen in the alveolus, the more pulmonary perfusion it receives.
This effect is driven by a hypoxia-sensitive potassium channel found on the albeit sparse smooth muscle of the pulmonary arterioles. This channel is normally open and allows the exit of potassium, which in turn keeps the inside of the muscle cell polarized. When exposed to hypoxia the channel closes, and the outward potassium current stops, allowing the muscle cell’s membrane potential to rise and consequently depolarize to cause a contraction.
Summary
So to summarize, the ratio of ventilation and perfusion changes across the lung, and this affects the alveolar and consequently arterial gas tensions from those regions. While the lung does not reach the ideal V/Q ratio, it is capable of shunting pulmonary blood flow away from unventilated areas to optimize gas exchange.
References, Resources, and Further Reading
Text
Levitsky, Michael G. “Chapter 5: Ventilation–Perfusion Relationships.” In Pulmonary Physiology, 9th ed. New York: McGraw Hill Education, 2018.
West, John B. “Chapter 5: Ventilation–Perfusion Relationships—How Matching of Gas and Blood Determines Gas Exchange.” In Respiratory Physiology: The Essentials, 9th ed. Philadelphia: Wolters Kluwer Health/Lippincott Williams and Wilkins, 2012.
Widdicombe, John G., and Andrew S. Davis. “Chapter 7.” In Respiratory Physiology. Baltimore: University Park Press, 1983.
Figures
Figure 13.1: Ideal relationship of V/Q. Grey, Kindred. 2022. CC BY 4.0. https://archive.org/details/13.1_20220125
Figure 13.2: Partial pressures when V/Q=1. Grey, Kindred. 2022. CC BY 4.0. https://archive.org/details/13.2_20220125
Figure 13.3: Partial pressures when V/Q=0. Grey, Kindred. 2022. CC BY 4.0. https://archive.org/details/13.3_20220125
Figure 13.4: Partial pressures when V/Q is infinite. Grey, Kindred. 2022. CC BY 4.0. https://archive.org/details/13.4_20220125
Figure 13.5: Ventilation–perfusion line. Grey, Kindred. 2022. CC BY 4.0. https://archive.org/details/13.5_20220125
Figure 13.6: Ventilation, perfusion and V/Q distributions. Grey, Kindred. 2022. CC BY 4.0. https://archive.org/details/13.6_20220125
Figure 13.7: V/Q and alveolar gas distribution. Grey, Kindred. 2022. CC BY 4.0. https://archive.org/details/13.7_20220125
Figure 13.8: Consequences of V/Q nonuniformity on arterial PO2. Grey, Kindred. 2022. CC BY 4.0. https://archive.org/details/13.8_20220125
Figure 13.9: Correcting V/Q mismatches. Grey, Kindred. 2022. CC BY 4.0. https://archive.org/details/13.9_20220125
Figure 13.10: Response of pulmonary vasculature to hypoxia. Grey, Kindred. 2022. CC BY 4.0. https://archive.org/details/13.10_202201
