15 Pulmonary Shunts
Learning objectives
- Calculate the proportion of shunted blood in a right–left shunt using capillary oxygen tensions.
From understanding V/Q ratios the importance of pulmonary blood passing a ventilated surface is obvious; without sufficient blood flow, ventilated regions of the lung cannot perform gas exchange. There are occasions, however, when blood bypasses ventilated regions of the lung, or bypasses the lung altogether. When this occurs the blood in question reenters the systemic arterial circulation without having performed gas exchange. This bypassing of the ventilated lung is referred to as shunting. There are examples of blood shunting even in the healthy cardiopulmonary system, but shunts may arise or worsen with disease and cause systemic hypoxemia. Here we will look at some of the causes of shunts and how to calculate their severity.
Normal Anatomical Shunts
There are two circulatory networks that normally form shunts. The bronchial circulation, that supplies the bronchi, empties its venous blood into the pulmonary veins, thereby sending slightly deoxygenated blood back toward the left heart and into the systemic arterial system. Likewise a very small portion of the coronary venous blood is returned to the left ventricle (through the thebesian veins) and thereby bypasses the lung completely before going back in the systemic circulation.
These two wayward circulations and the imperfect V/Q matching in the lung serve to suppress arterial oxygen saturation.
Abnormal Shunts
Shunts can also be created by abnormal physiology or anatomy. There are several heart structural defects that allow blood from the right heart to enter the systemic circulation and bypass the lungs altogether; one common example is a patent foramen ovale where the incomplete atrial septum between the right and left heart allows deoxygenated venous blood to directly enter the arterial circulation, bypassing, or “shunting,” past the lungs.
In pulmonary disease, areas of the lung may not receive ventilation (e.g., as airways are blocked or collapsed). Perfusion to these areas is therefore wasted as no gas exchange takes place; effectively a right–left physiological shunt has formed, and V/Q approaches zero (i.e., low V and normal Q).
Detecting Shunts
There is a quick and easy way to detect whether a shunt is contributing to a patient’s low arterial PO2 by giving a patient 100 percent O2 to breathe. The blood passing through capillaries that are exposed to the 100 percent O2 becomes fully saturated. However, any shunted blood never “sees” the high PO2 and consequently stays at venous PO2. When the two routes rejoin and the blood mixes, it remains below 100 percent (i.e., the alveolar–arterial PO2 difference is not abolished by the 100 percent O2, and it never can be as long as the shunt exists).
Calculating the Size of a Pulmonary Shunt
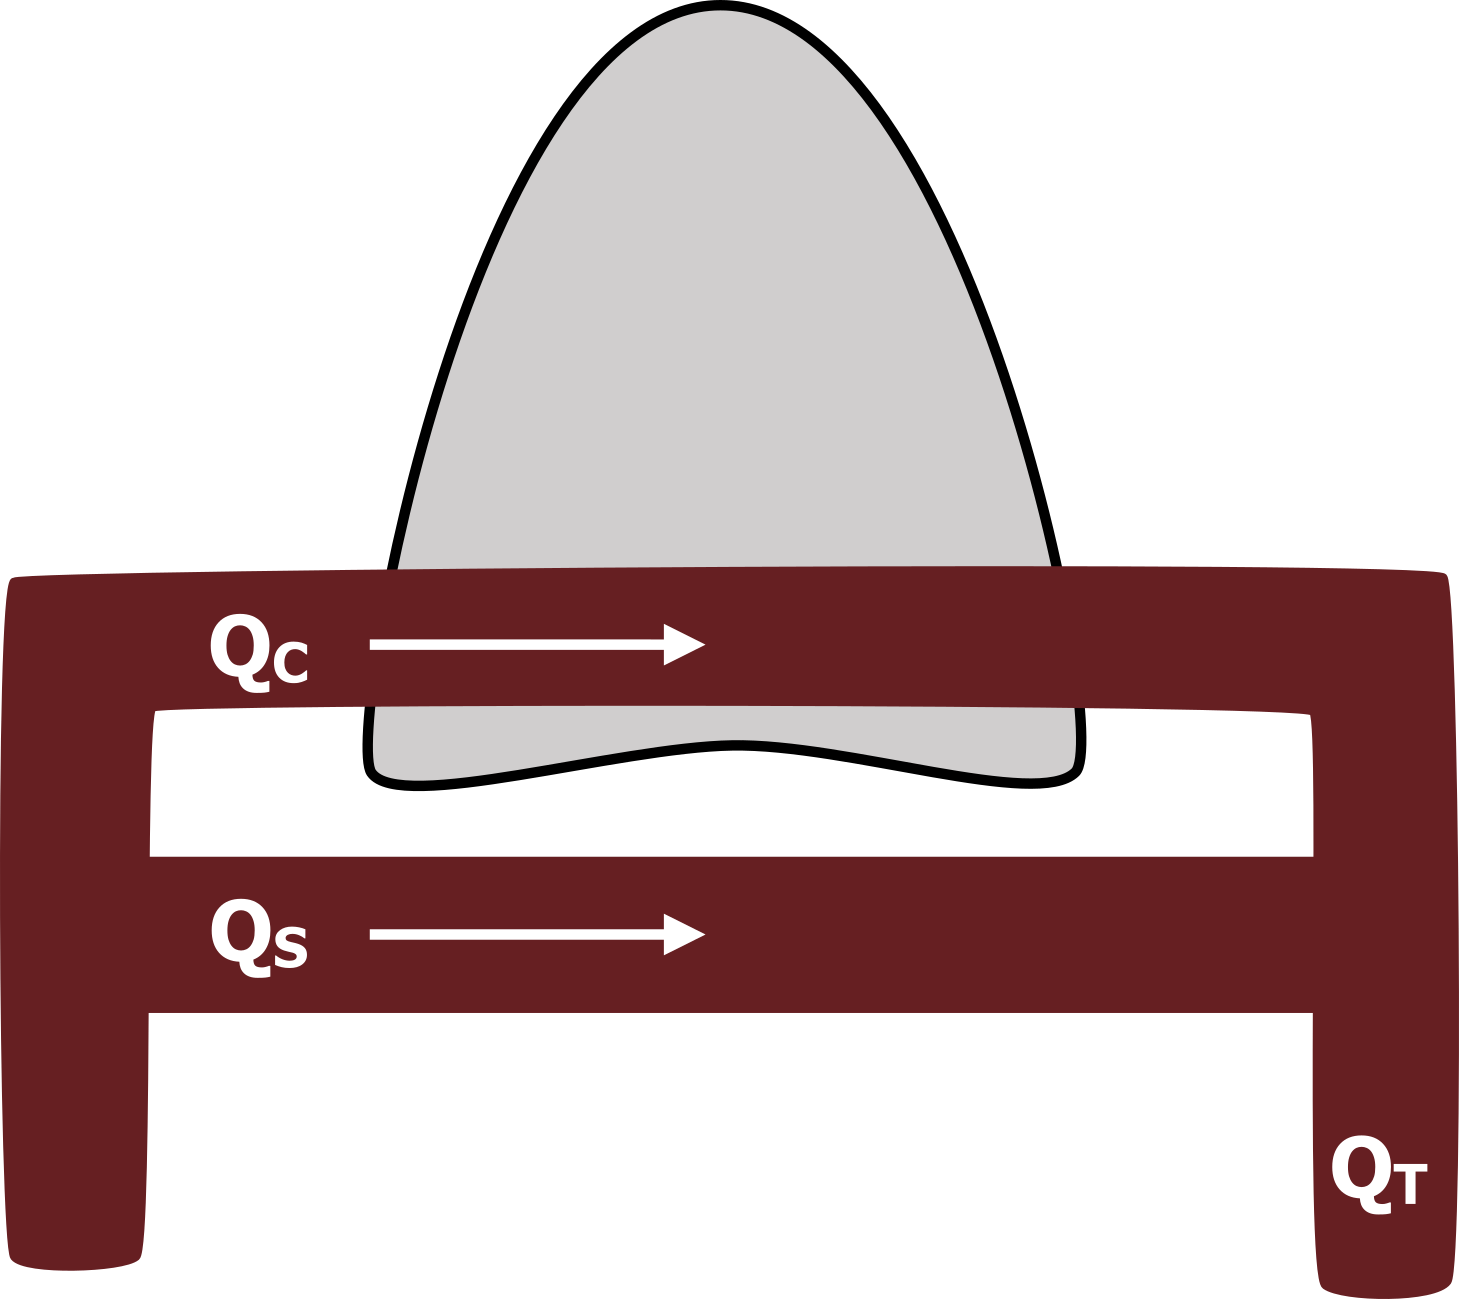
Because even a small shunt can have a large effect on arterial PO2, it is critical to determine the size of a shunt should one be suspected. Figure 15.1 shows the lungs with blood passing through as normal (QC), while some bypasses the heart (QS) and is shunted back into the systemic circulation. The size of a shunt (QS) is expressed as the percentage of total blood (QT in figure 15.1) (i.e., QS/QT). We will look now at how this is calculated from oxygen concentration. First, let us see what we know.
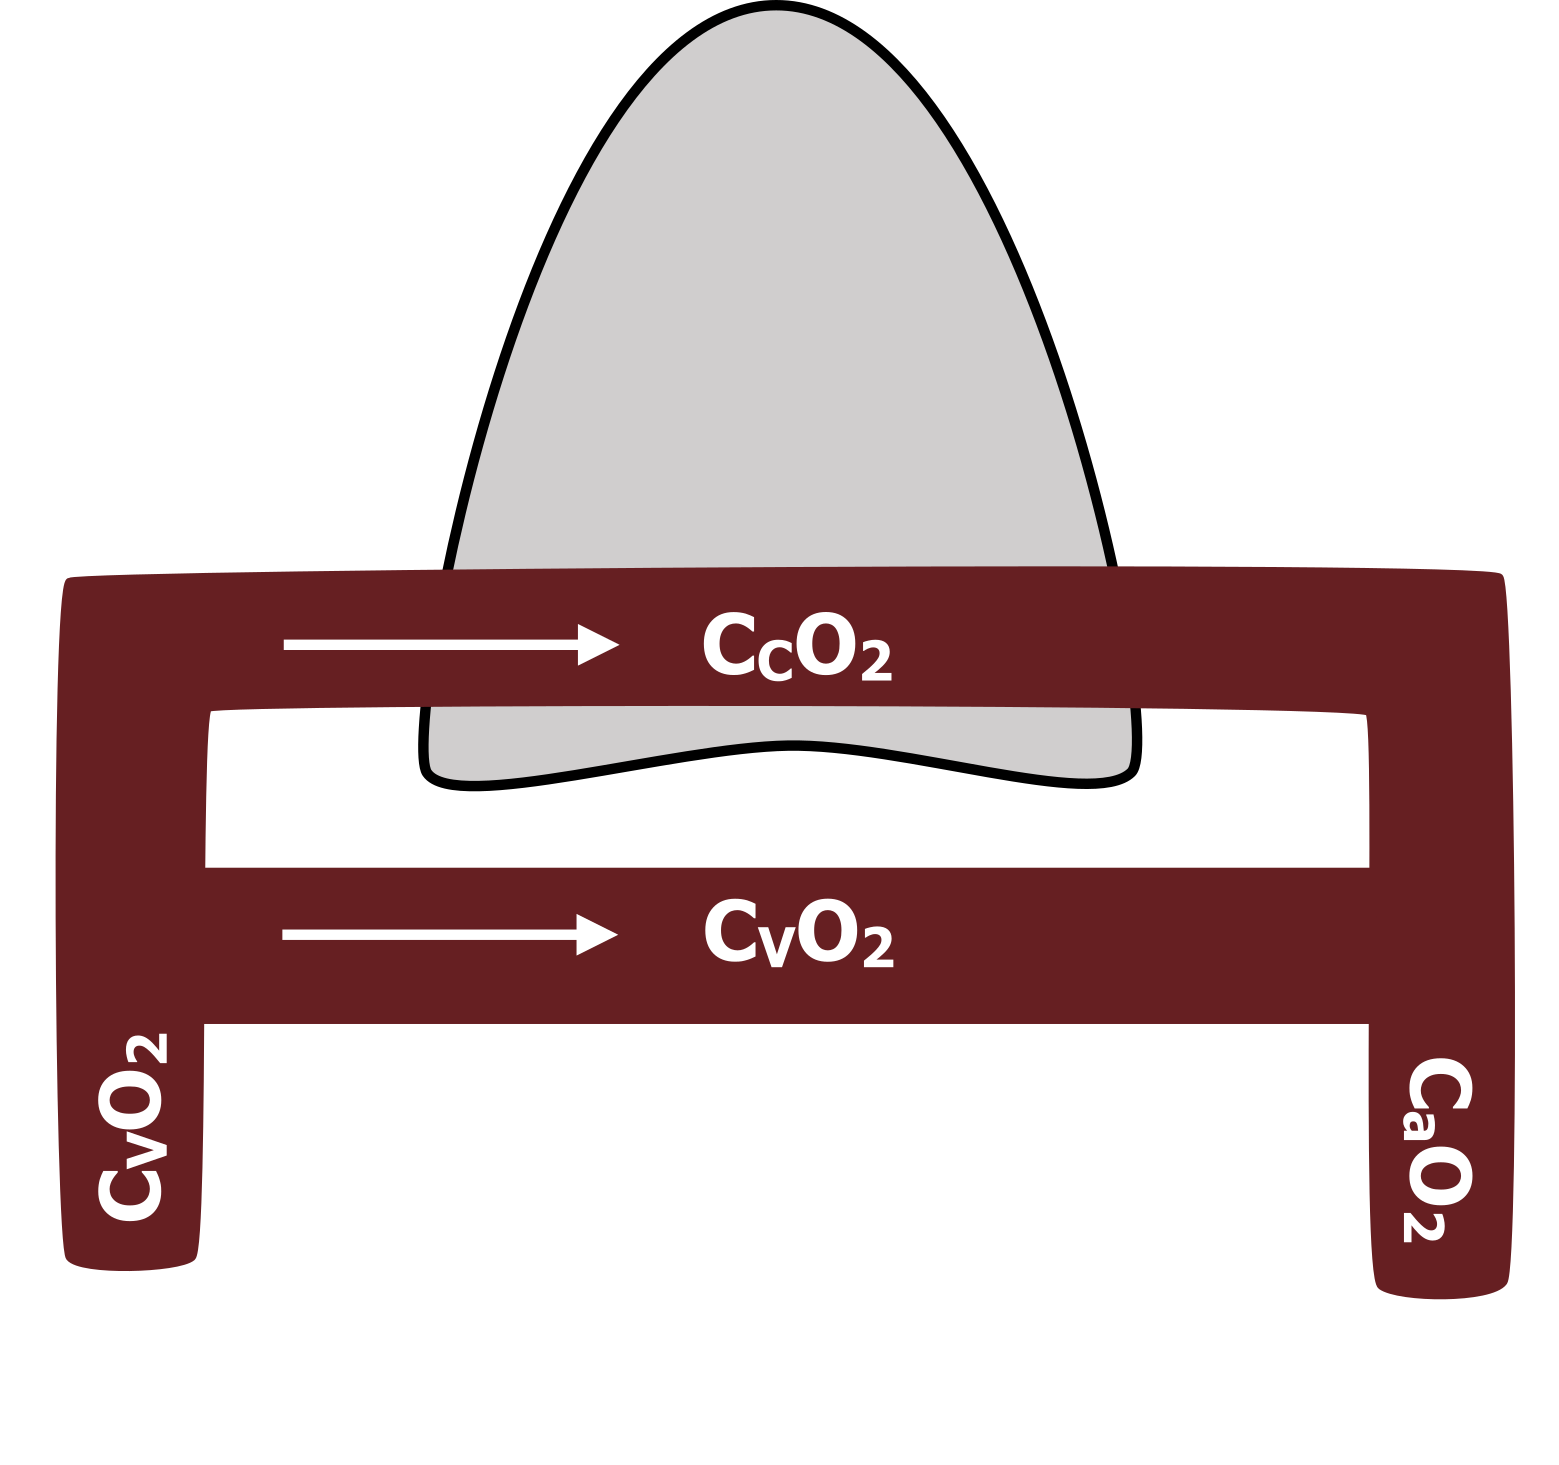
We can measure the oxygen concentration of the venous system (CVO2 in figure 15.2) and can assume that the shunted blood, having performed no gas exchange, will have the same oxygen concentration. We can also measure the oxygen concentration in the arterial system (CaO2 in figure 15.2), and if we assume that all the blood that passed through the gas exchange capillaries in the lungs equilibrated with the alveolar PO2, we can use the alveolar gas equation to determine the capillary oxygen concentration (CCO2 in figure 15.2).
So know we can use these oxygen concentrations to work out the percentage of shunted blood.
Now let us combine our flow and oxygen concentration and think in terms of absolute oxygen contents in each part of our diagram. (Critical point: The absolute oxygen content is the product of the blood volume and oxygen concentration.) So now thinking of absolute oxygen contents, let us generate a first basic equation (equation 15.1) with what we know—the amount of oxygen in our flow going back to the left heart (QT) equals the oxygen from the pulmonary capillaries, plus that from the shunt.
Equation 15.1
[latex]Total\:oxygen\:content = oxygen\:from\:capillaries\: + oxygen\:from\:shunt[/latex]
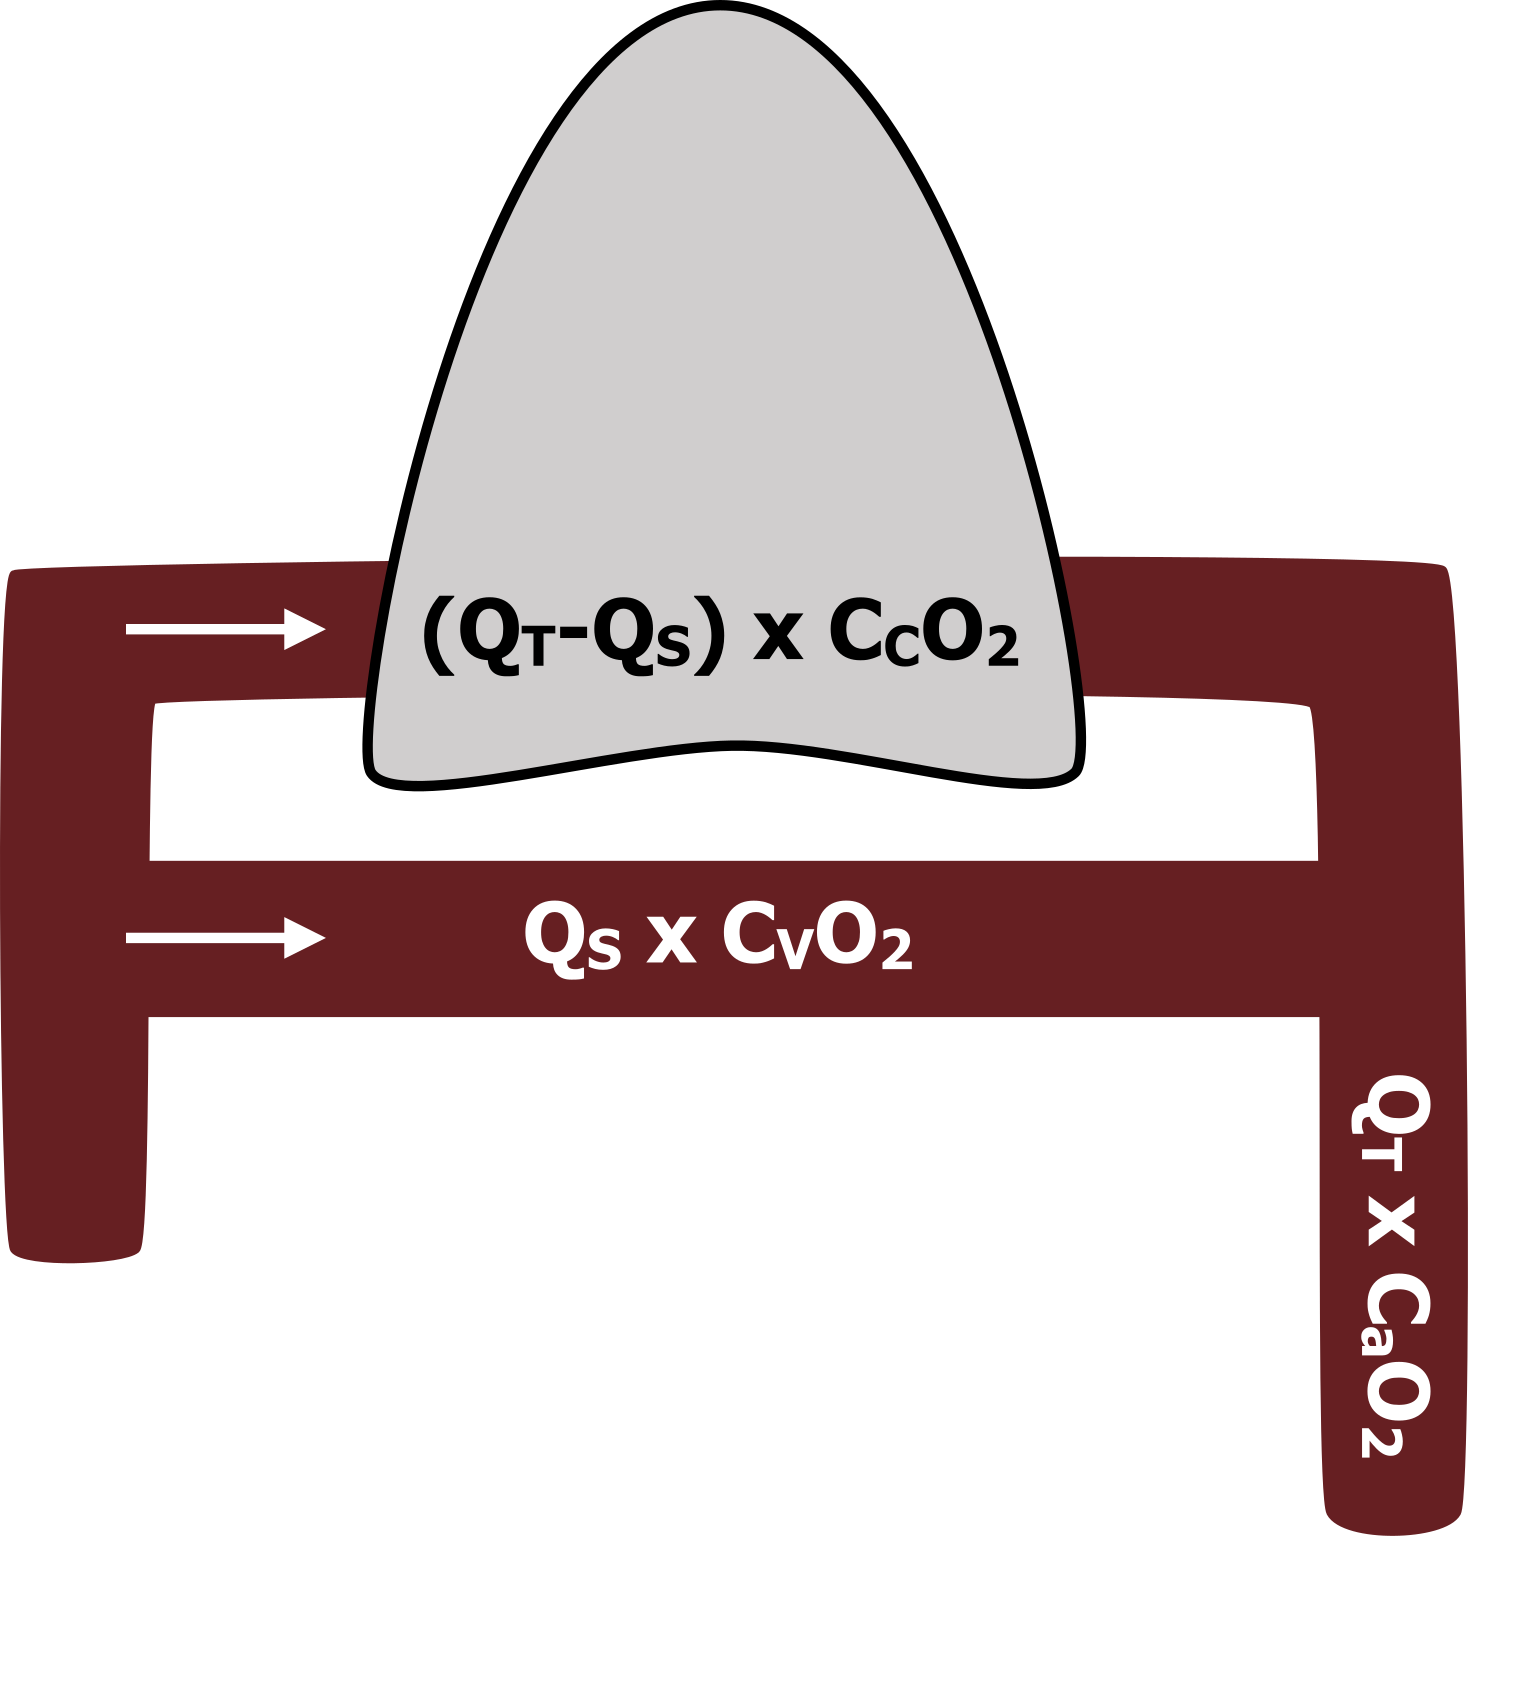
Let us build on that and put some values in place. The amount of oxygen arriving back in the arterial side must equal the volume of blood multiplied by the arterial oxygen concentration (QT x CaO2), as shown in figure 15.3. And we know that this amount of O2 must be the sum of that from the capillaries, and that from the shunt.
The amount of oxygen from the shunt is calculated as shunt flow multiplied by the venous oxygen concentration (QS x CVO2), as shown in figure 15.3.
The amount of oxygen going through the pulmonary capillaries can be described as the total volume minus the shunt volume (QT−QS) multiplied by the capillary oxygen concentration (figure 15.3).
Let us put those terms into our basic equation (equation 15.2).
Equation 15.2
[latex]\displaystyle\frac{Q_S}{Q_T} = \frac{C_CO_2 - C_aO_2}{C_CO_2 - C_VO_2}[/latex]
So at this point we might panic, thinking that we have no measure of flow (Q) for any of these variables, that we only have oxygen concentrations from our blood gases and alveolar gas equation. But panic not. Through the magic of mathematics we can rearrange this equation (15.2) to eliminate our flows (Qs) and be left with an equation that meets our objective of QS/QT.
The shunt equation (equation 15.3) describes the proportion of total perfusion that is passing through the shunt. This is the equation worth remembering: the portion of blood going through the shunt is the difference between the capillary and arterial O2 concentrations, divided by the difference between the capillary and venous oxygen concentrations.
Equation 15.3
[latex]Q_T \times C_aO_2 = [(Q_T - Q_S) \times C_CO_2] + [Q_S \times C_VO_2][/latex]
Let us look at an example to put this in context. We have a patient with normal lungs, but a right–left shunt is present. We find out that his arterial blood O2 concentration is 18 mL and venous is 14. Capillary oxygen concentration is calculated to be 20 mL/100 mL. Now we plug the numbers in the equation and see that the proportion of blood going through the shunt is a third, or 33 percent.
Summary
So to recap, small pulmonary shunts exist even in the normal cardiopulmonary system, but abnormal shunts can arise from a number of different pathological causes. Although the presence of a shunt is relatively easy to detect, it is important to calculate its size, which is also a relatively easy process.
References, Resources, and Further Reading
Text
Levitsky, Michael G. “Chapter 5: Ventilation–Perfusion Relationships.” In Pulmonary Physiology, 9th ed. New York: McGraw Hill Education, 2018.
West, John B. “Chapter 5: Ventilation–Perfusion Relationships—How Matching of Gas and Blood Determines Gas Exchange.” In Respiratory Physiology: The Essentials, 9th ed. Philadelphia: Wolters Kluwer Health/Lippincott Williams and Wilkins, 2012.
Figures
Figure 15.1: Schematic of a pulmonary shunt. Grey, Kindred. 2022. CC BY 4.0. https://archive.org/details/15.1_20220125
Figure 15.2: Oxygen concentrations used to calculate the size of a pulmonary shunt. Grey, Kindred. 2022. CC BY 4.0. https://archive.org/details/15.2_20220125
Figure 15.3: Elements of the shunt equation and where they exist physiologically. Grey, Kindred. 2022. CC BY 4.0. https://archive.org/details/15.3_20220125
