6 Dynamic Airway Compression
Learning objectives
- Describe how pleural and airway pressures interact to cause dynamic airway compression in the healthy lung and how this is exacerbated in disease.
- Briefly describe how flow-volume loops can help distinguish between obstructive and restrictive lung diseases.
Compression of Airways During Expiration
The interaction of intrapleural and airway pressures is relatively simple during inspiration; intrapleural pressure becomes more negative, and the airways are pulled open as lung volume increases. This chapter will focus on the interaction of these forces during expiration and the potential for intrapleural pressure to cause airway compression.
Although this phenomenon is present in the healthy lung, we will see how it is exacerbated in certain disease states and how this exacerbation can be detected by common pulmonary function tests.
First, let us look at the forces involved during a normal, passive expiration.
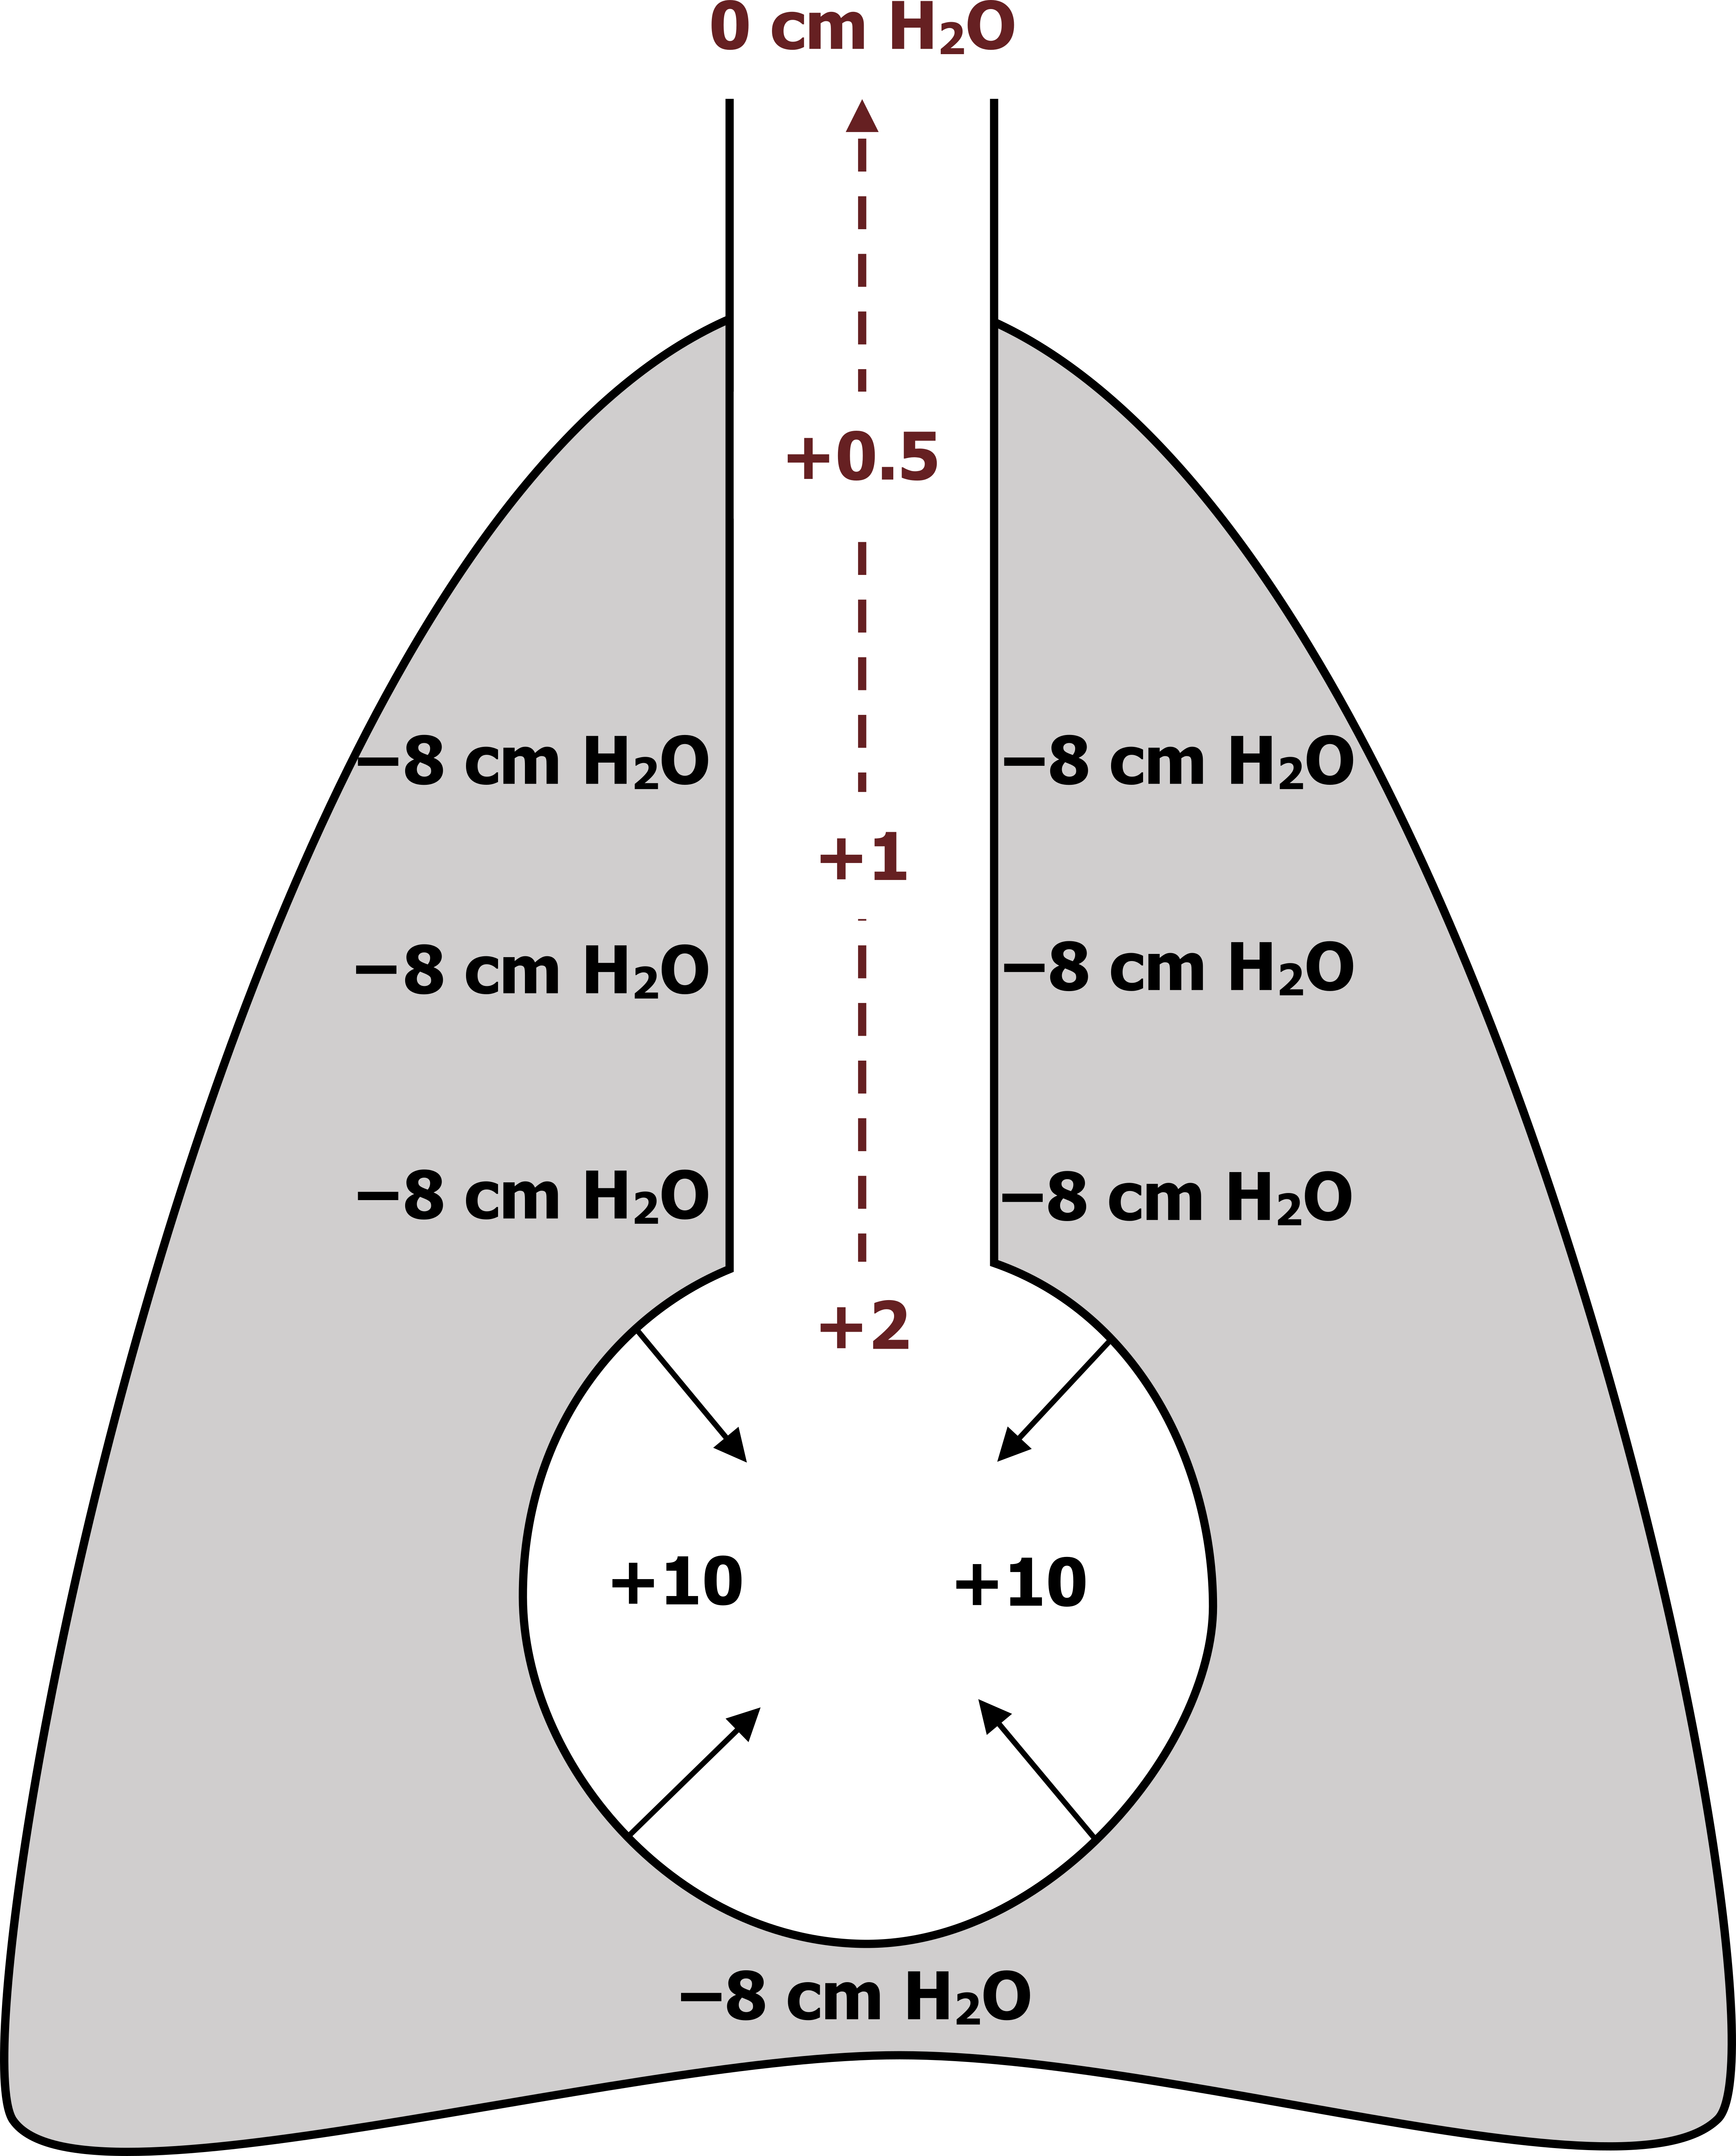
For simplicity, the schematic in figure 6.1 shows one airway and an alveolus within the thoracic cavity. At the onset of passive expiration (driven by the recoil of the expanded lung), the intrapleural pressure is negative (about −8 cm H2O). As it remains negative, intrapleural pressure helps keep the airways open.
The elastic forces of the alveolus wall exert an inward force of about +10 cm H2O. This results in a net force of +2 cm H2O in the alveolus, and a gradient between this positive pressure is established between the alveolus and the atmosphere outside the lung. That means that along the airway toward the mouth there is a gradient of progressively decreasing pressure to zero (shown in maroon).
Importantly in this example of passive expiration the airway pressure is greater than the pleural pressure along the whole length of the airway toward the mouth. Along with the radial traction provided by the surrounding parenchymal tissue, this favorable transmural pressure gradient helps keep the airway open during expiration.
Now let us look at what happens if expiration is forceful, or active, rather than passively relying on lung recoil.
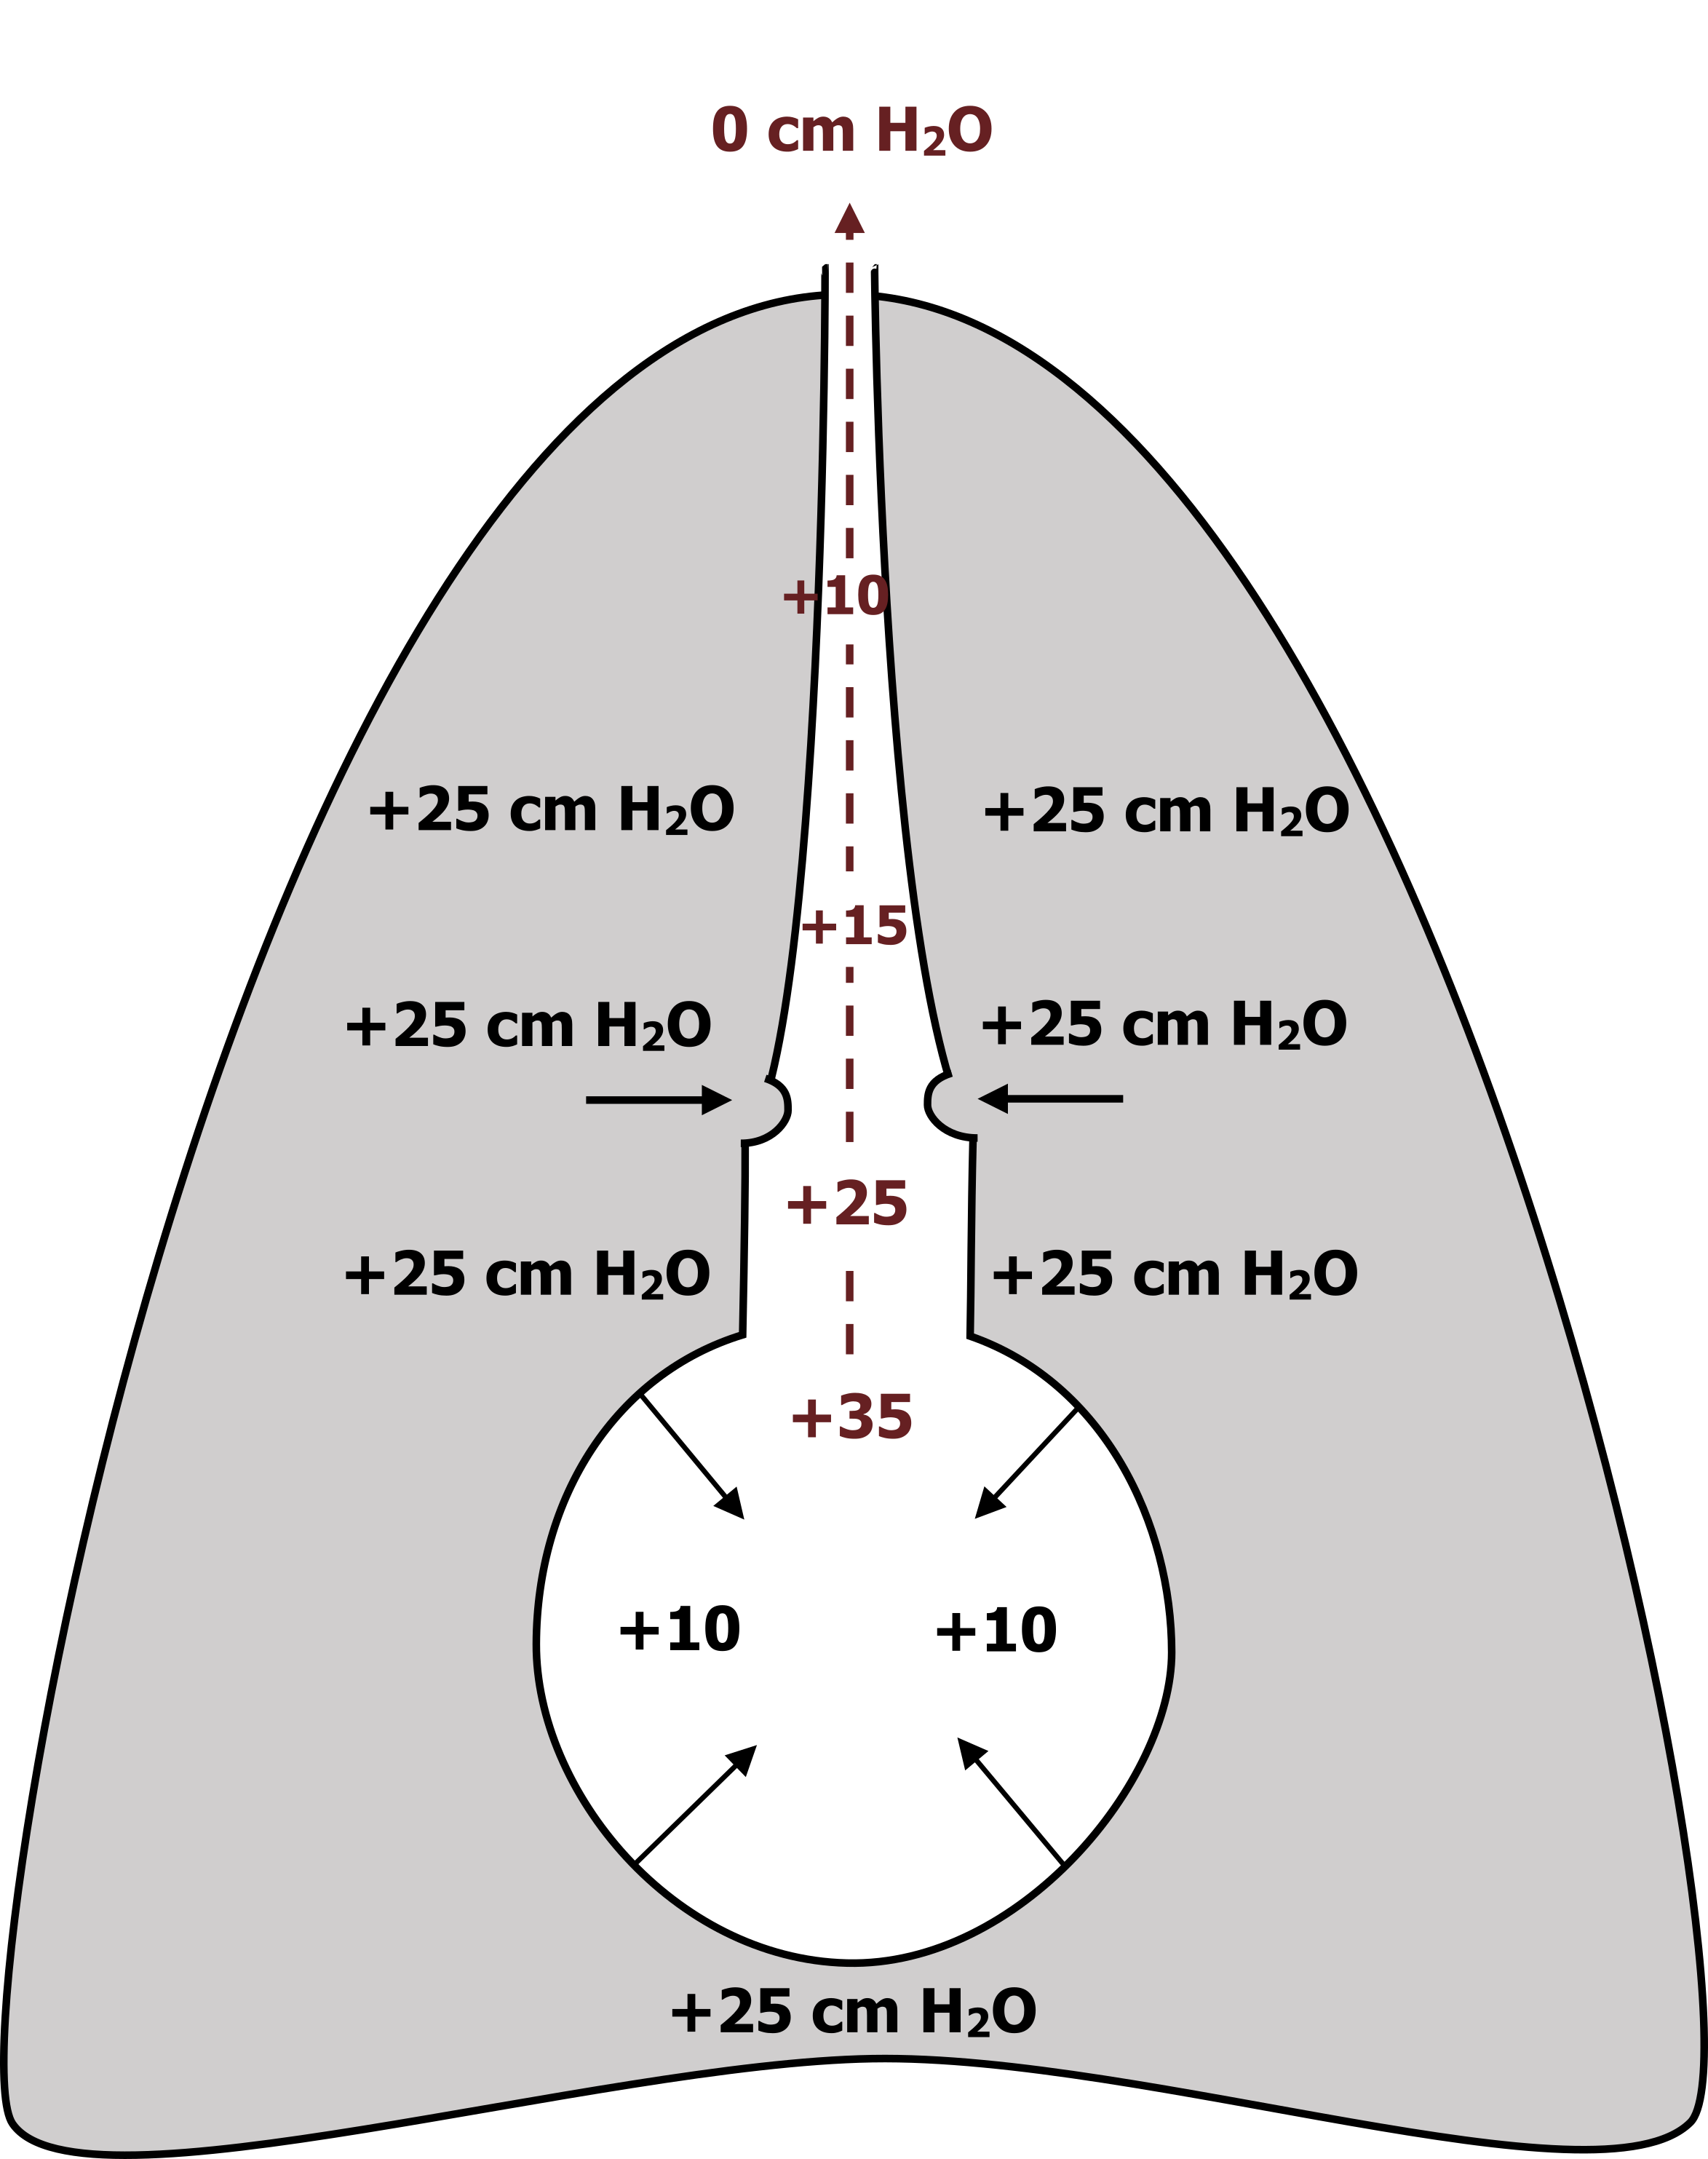
In a forced expiration (see figure 6.2) the intrapleural pressure can become positive (as much as 120 cm H2O), but in this example we will say it is 25 cm H2O. This positive pressure in the pleural cavity comes from the chest wall and diaphragm now “pushing” the pleural membranes together and compressing the lung.
Again, we have the elastic forces of the alveolus generating an inward force (still +10 cm H2O), and when summed with the now positive intrapleural forces, we end up with an alveolar pressure of +35 cm H2O.
Again, a pressure gradient between the alveolus and the atmosphere is established (again shown in maroon), but this time there is a fundamental difference caused by the larger intrapleural pressure.
At some point along the airway, as airway pressure is decreasing, the intrapleural pressure exceeds airway pressure (in this example it is 25 cm H2O). At this “choke” point (arrows pointing toward airway in figure 6.2), the airway can become compressed or even collapse.
This effect is somewhat reduced by the radial traction of the parenchyma, but airway compression occurs even in the healthy normal lung, and the greater the effort of expiration (i.e., the more positive the intrapleural pressure), the greater degree airways compress and compression occurs closer to the alveoli (i.e., further up the pressure gradient in the airway).
If airways are already narrowed, as in obstructive lung diseases such as asthma, or parenchymal traction is lost, such as in emphysema, dynamic airway compression occurs to a greater extent. In these obstructive diseases the increased airway resistance results in the patient having to forcefully expire to overcome the increased resistance of the narrowed airways. This promotes airway compression and leads to air being trapped behind the choke point, causing hyperinflation (breathing at an elevated lung volume).
This airway compression or any other increase in airway resistance can be demonstrated by a common pulmonary function test, the flow-volume loop.
Flow-Volume Loops
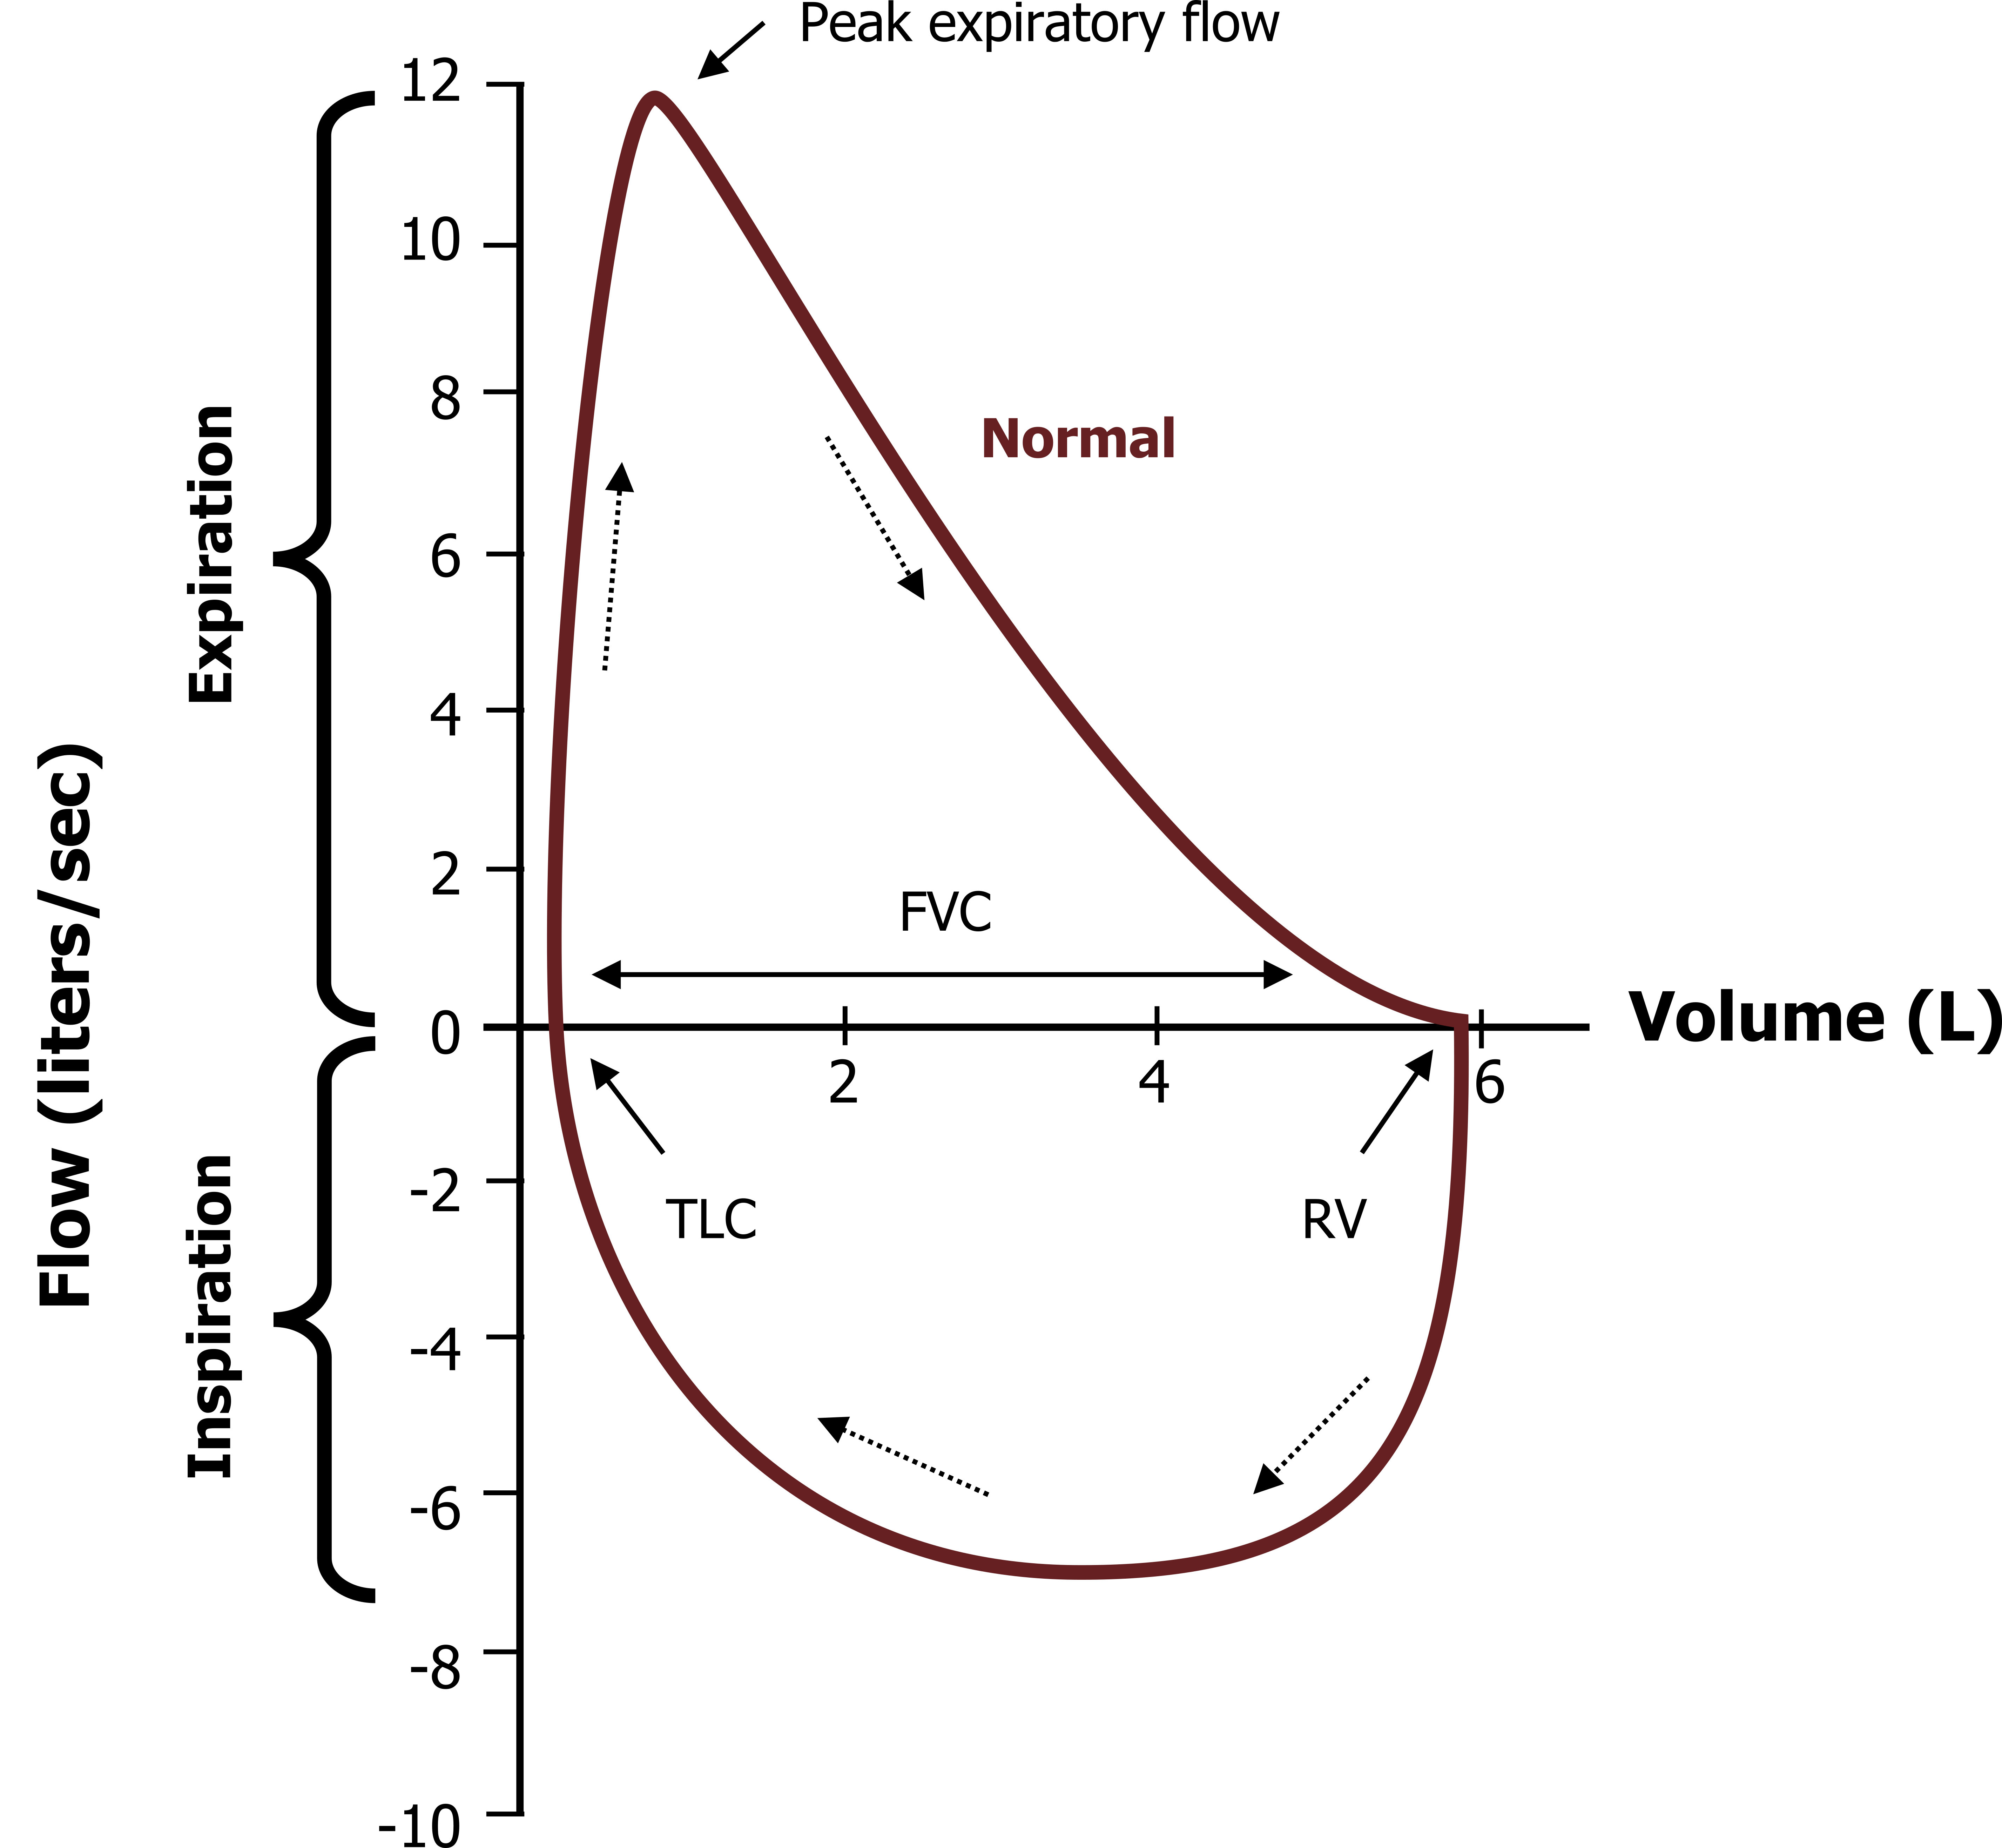
Flow-volume loops are briefly discussed in context of the relevant physiology. Figure 6.3 shows a normal flow-volume loop. Note that the volume axis seems to be the wrong way around; this is because expired volume and flow are generally more useful, so the plot has expiratory flow as positive and lung volume orientated for expiration. While breathing on a spirometer, the patient begins to breathe in from residual volume (bottom half of maroon line). As inspiration continues, lung volume increases (moves toward the y-axis) and airflow increases (moves downward). The patient continues inhaling until they are at total lung capacity (or TLC).
They then exhale as hard and as fast as they can, forcefully emptying the lung as quickly as possible. During forced exhalation of the first liter or so, expiratory flow rapidly increases until it reaches peak expiratory flow; this is the first clinically pertinent measure. After this point expiratory flow begins an exponential decline; as lung volume continues to decrease, so does the flow rate until flow reaches zero when the lung is emptied (at residual volume).
The rate of this decline in flow rate is also an important clinical measure and brings together a couple of important physiological points:
- Flow is declining during this phase of expiration due to the forceful expiration causing airway compression and thereby increasing airway resistance.
- Airways will also become smaller as radial traction of the parenchyma also declines with lung volume.
Although there are a number of measurements that are calculated from this forced exhalation, two are most commonly reported. First, the total volume that is expelled from the lung is referred to as the forced vital capacity (FVC). The forced expiratory volume that is expelled from the lung in the first second of expiration is referred to as FEV1. The ratio of these two values, known as FEV1/FVC, describes the percentage of lung volume that can be emptied in one second and is a useful indicator of airway resistance. A normal FEV1/FVC is 90 percent or higher, meaning over 90 percent of vital capacity can be emptied from the lung within a second. This value is dependent on age, gender, and body size, but commonly used predicted values take these variables into account when assessing for disease.
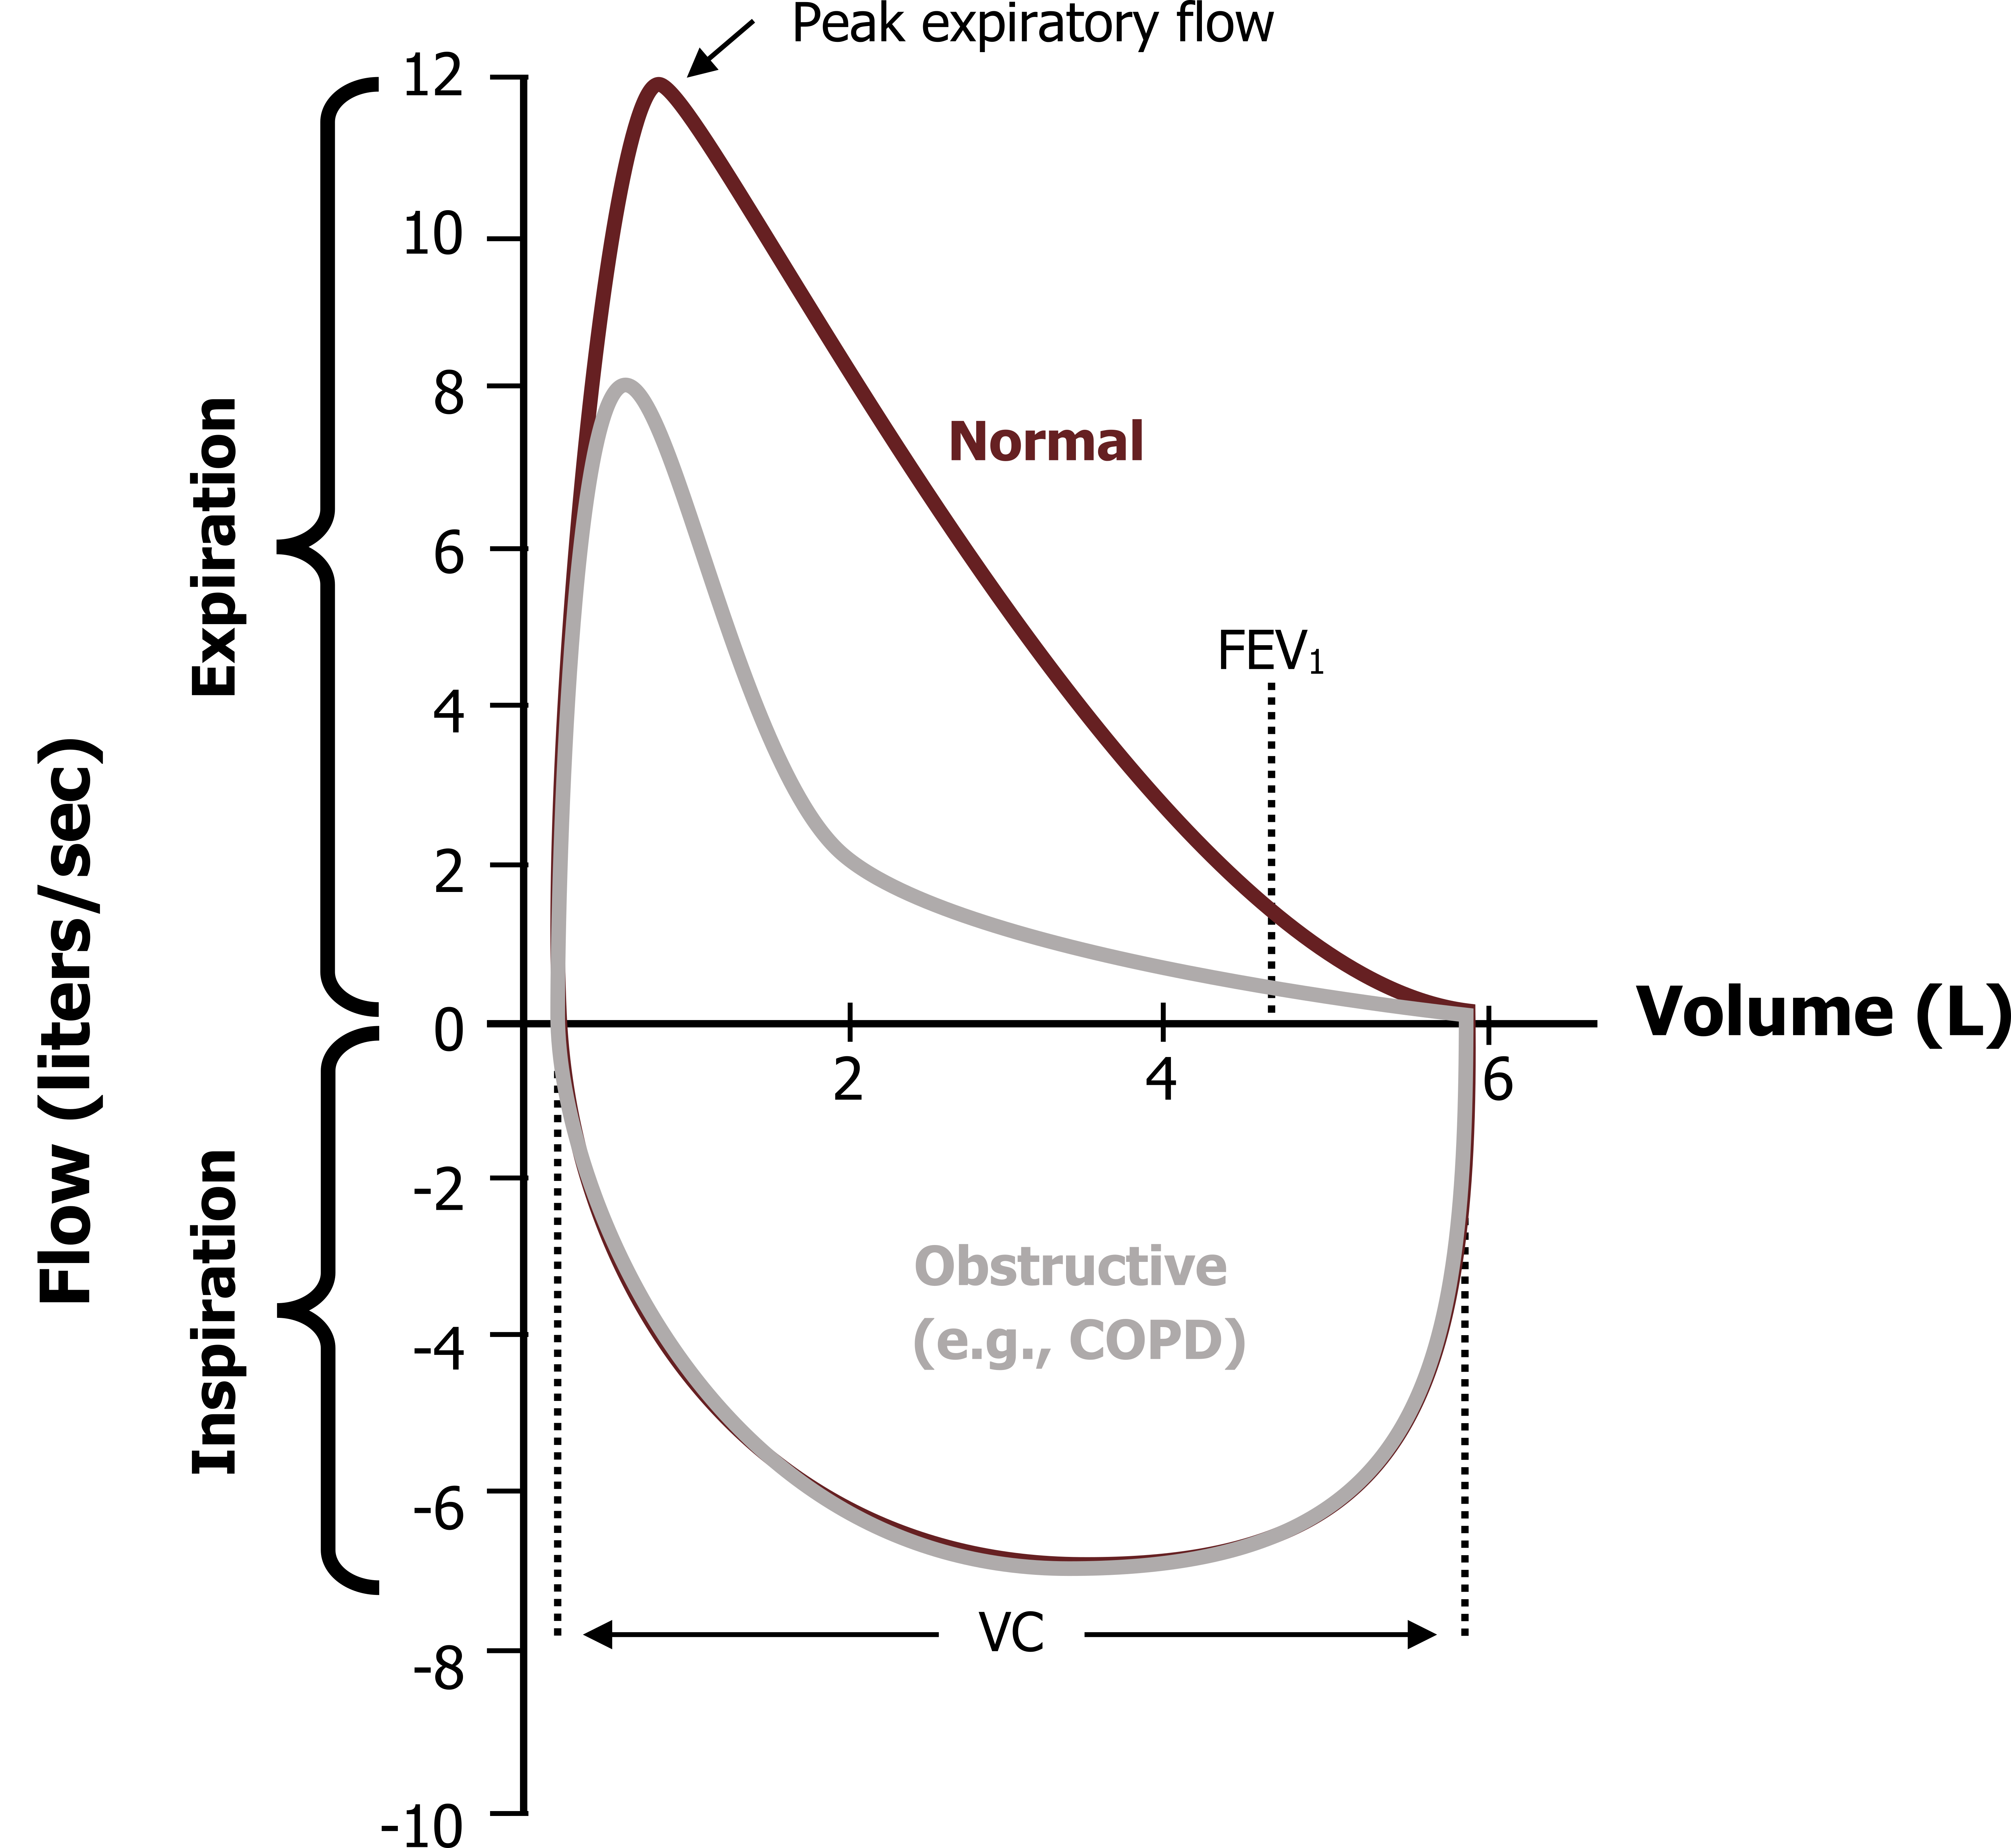
The loop produced by a patient with chronic obstructive lung disease, or COPD, looks very different (gray line in figure 6.4). With disease causing airway narrowing, the peak expiratory flow is significantly reduced, and the decay in expiratory flow as lung volume declines is much more pronounced as the narrowed airways can be easier to collapse due to a lower starting radius and/or loss of radial traction.
This means that FEV1 is significantly reduced, but FVC may remain unchanged (i.e., the lung volume is the same, but it takes longer to empty). An FEV1/FVC significantly less than 90 percent is indicative of obstructive disease. Notice that the inspiratory loop of the COPD patient appears normal, illustrating the effect of increasingly negative intrapleural pressure, increasing lung volume and radial traction on airway resistance.
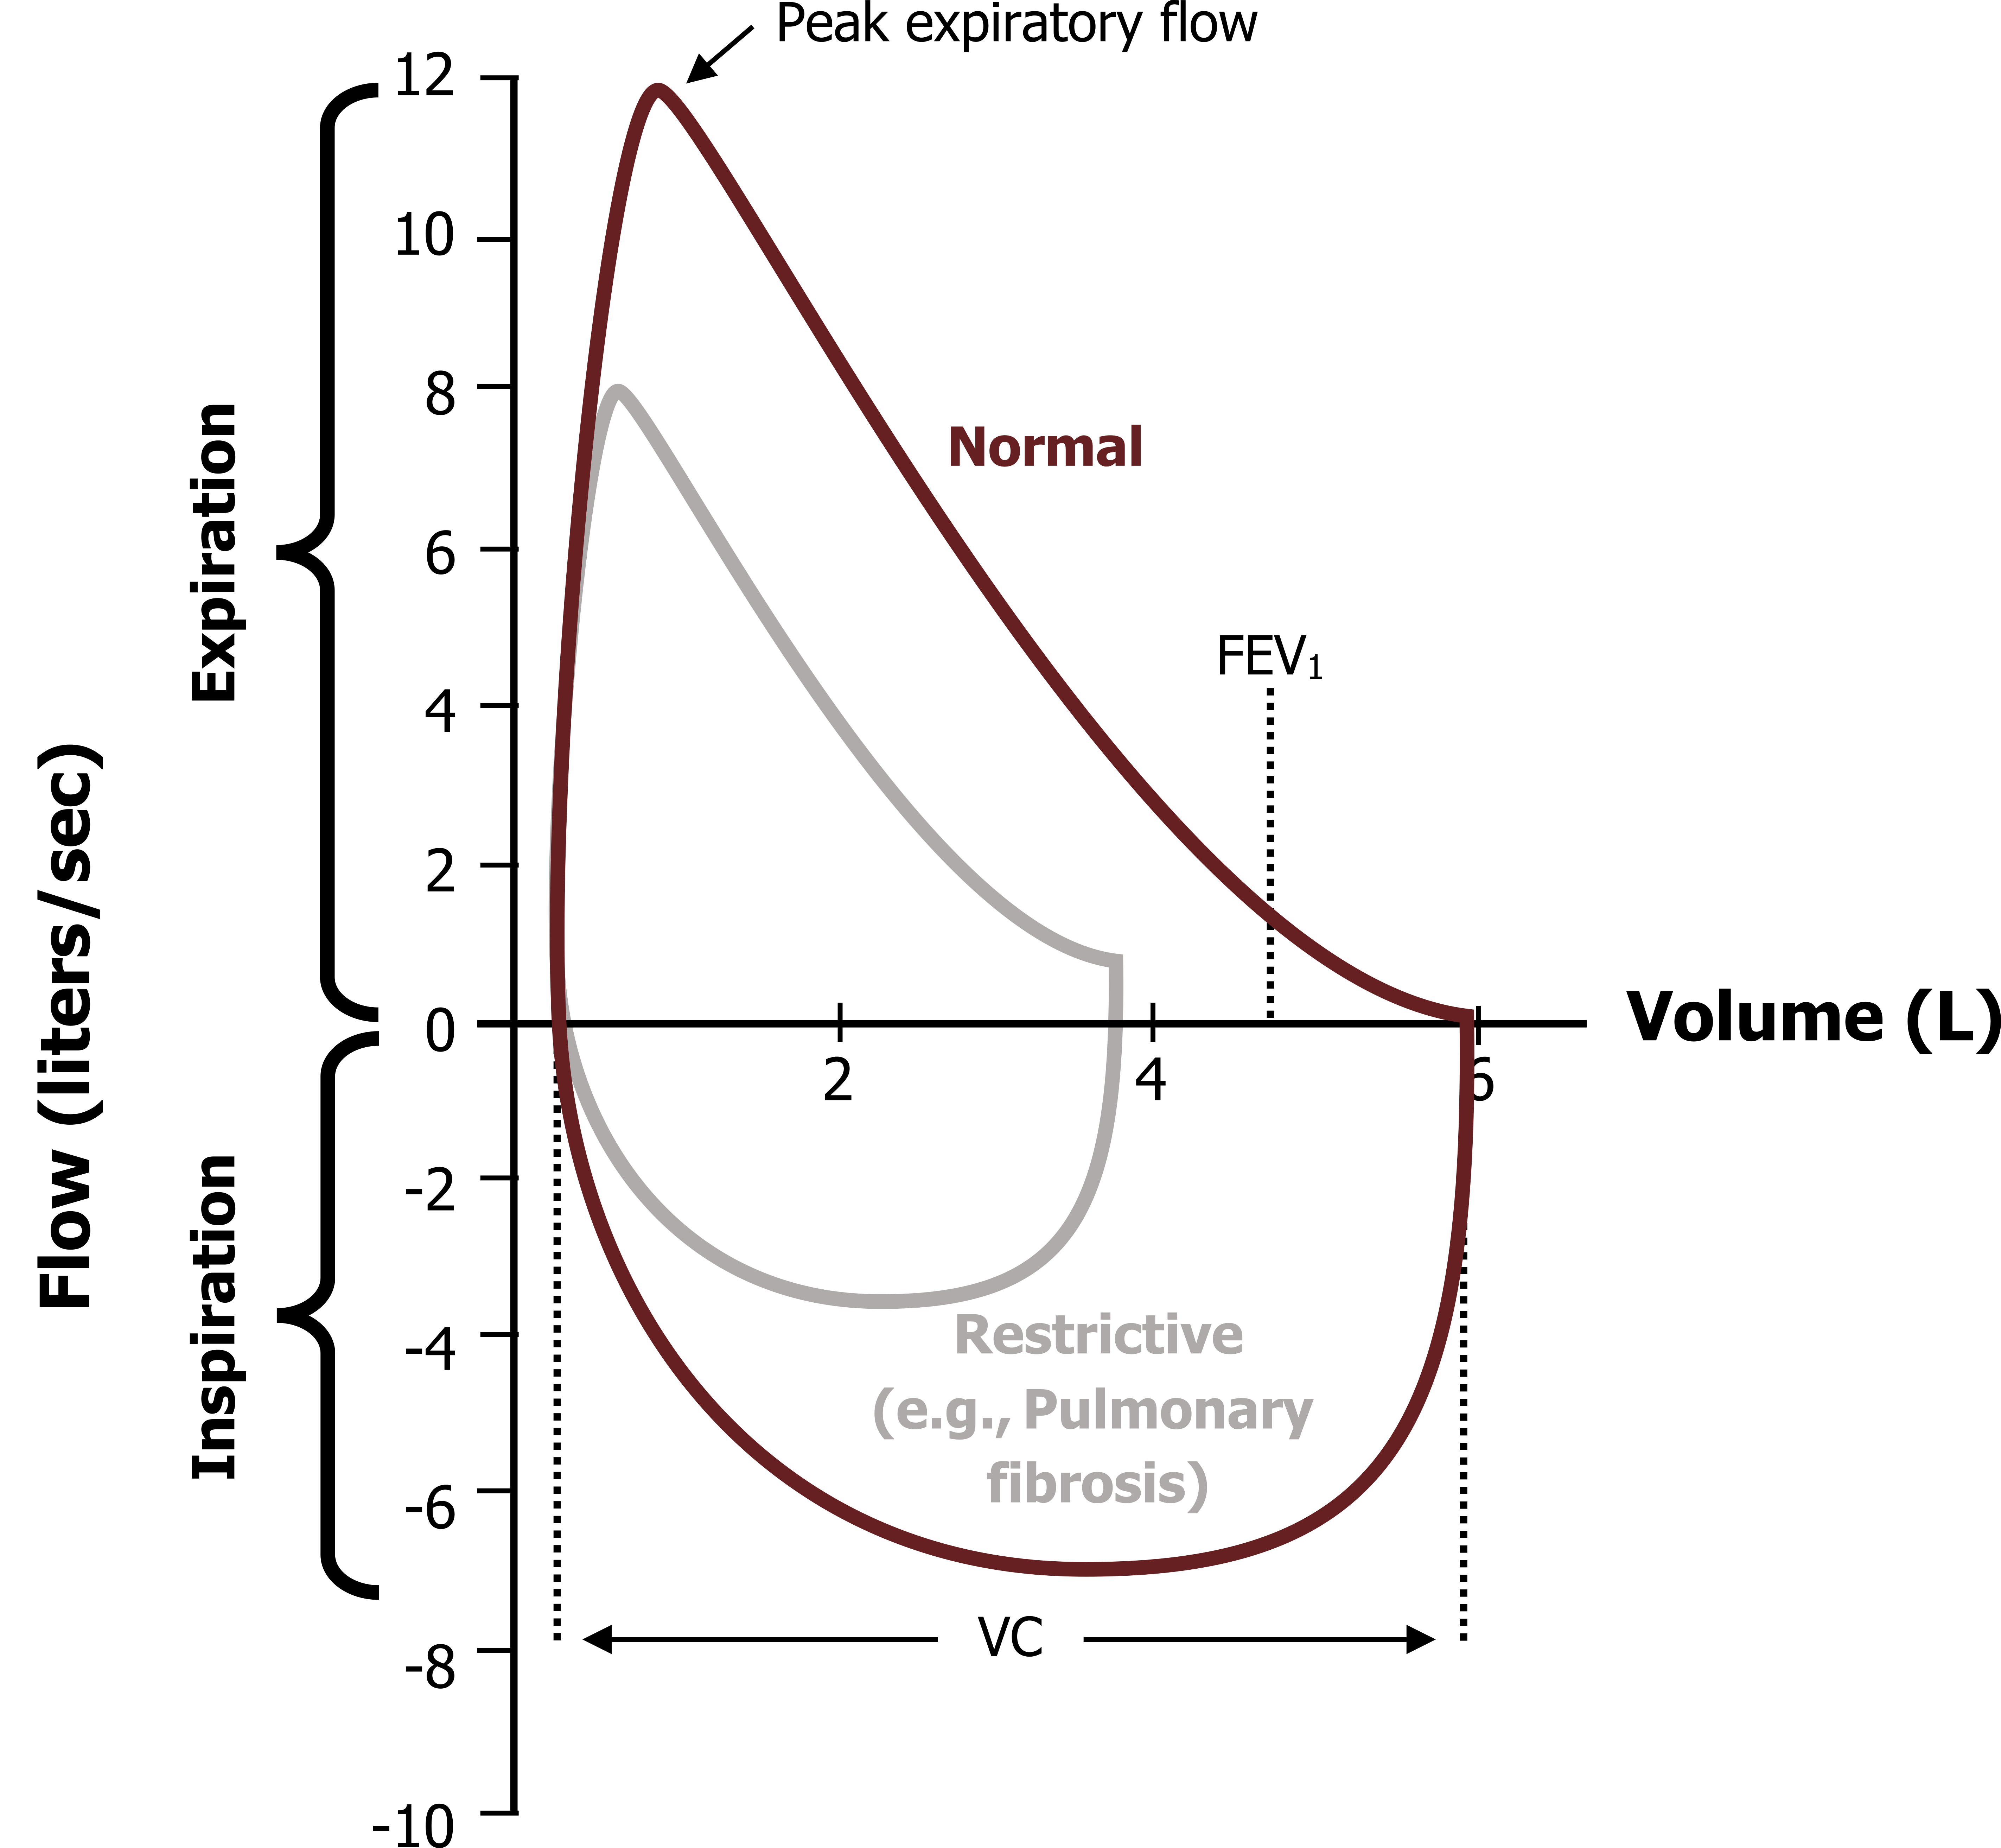
Alternatively, diseases that restrict lung expansion (figure 6.5), such as pulmonary fibrosis, demonstrate a reduced lung volume, where FVC is substantially reduced, but FEV1 may not be significantly affected; in fact it is not uncommon for FEV1/FVC to increase to about normal in restricted diseases, but this is of course due to a decline in FVC rather than a rise in FEV1. Notice also that the inspiratory loop is affected, with volumes being reduced here as well.
A flow-volume loop is a quick, cheap, and powerful diagnostic measure, but it is highly dependent on the patient performing a forced expiration to encourage dynamic compression and peak flows be obtained so that any airway abnormalities can be seen. This is why you may hear a pulmonary function technologist (PFT) shouting encouragement to a patient as you walk past the lab.
Summary
So we have dealt with a couple of relatively complex issues in this chapter, particularly the interaction between intrapleural pressure and airway pressure during forced or active expirations and how airways can become compressed.
We have also looked at the use of flow-volume loops to determine the degree of airway obstruction and to distinguish between obstructive and restrictive disorders.
References, Resources, and Further Reading
Text
Levitsky, Michael G. “Chapter 3: Alveolar Ventilation.” In Pulmonary Physiology, 9th ed. New York: McGraw Hill Education, 2018.
West, John B. “Chapter 7: Mechanics of Breathing—How the Lung Is Supported and Moved.” In Respiratory Physiology: The Essentials, 9th ed. Philadelphia: Wolters Kluwer Health/Lippincott Williams and Wilkins, 2012.
Widdicombe, John G., and Andrew S. Davis. “Chapter 3.” In Respiratory Physiology. Baltimore: University Park Press, 1983.
Figures
Figure 6.1: Intrapleural and airway pressures during normal/passive expiration. Grey, Kindred. 2022. CC BY 4.0. https://archive.org/details/6.1_20220125
Figure 6.2: Intrapleural and airway pressures during forced expiration. Grey, Kindred. 2022. CC BY 4.0. https://archive.org/details/6.2_20220125
Figure 6.3: Typical and normal flow-volume loop. Grey, Kindred. 2022. CC BY 4.0. https://archive.org/details/6.3_20220125
Figure 6.4: Normal (maroon) and obstructive disease (gray) flow-volume loops. Grey, Kindred. 2022. CC BY 4.0. https://archive.org/details/6.4_20220125
Figure 6.5: Normal (maroon) and restrictive (gray) flow-volume loops. Grey, Kindred. 2022. CC BY 4.0. https://archive.org/details/6.5_20220125
