7 Fundamentals of Gas Exchange
Learning objectives
- Calculate a partial pressure of a gas of known concentration at a known barometric pressure.
- Describe how changes in factors included in Fick’s law of diffusion may contribute to incomplete gas exchange.
Partial Pressures
The lung is well designed to perform its function of gas exchange with the atmosphere, and in this chapter we will look at some of the factors that allow the lung to perform this function and how these factors might change in disease.
Before we do that though, we need to be able to calculate the units of measurement we use when describing gas exchange. When referring to gas exchange we are really referring to diffusion of gases down their concentration gradient, but rather than use concentrations, we use partial pressures.
Partial pressures describe what proportion of the total pressure is exerted by a particular component of a mixed gas. Let us look at the specific situation we are interested in to illustrate this description.
Atmospheric pressure at sea level is 760 mmHg. This pressure is generated by the collisions of all the molecules with each other and other objects. At high altitude there are fewer molecules, so fewer collisions, and hence atmospheric pressure is lower.
Now looking at the composition of our atmosphere we know that 79 percent is nitrogen, 20.9 percent is oxygen, and some trace gases collectively get us to 100 percent. Now let us calculate a partial pressure. If 79 percent of the atmosphere is nitrogen, then 79 percent of our atmospheric pressure is generated by the collisions by nitrogen molecules. Likewise 20.9 percent of the atmospheric pressure is due to oxygen, so to calculate the partial pressure of oxygen (PO2) we simply multiply atmospheric pressure (PB) by the percentage of oxygen, which means our atmosphere has a partial pressure of oxygen of 159 mmHg.
[latex]PO_2 = \%O_2 \times P_B[/latex]
[latex]PO_2 = 20.9\% \times 760\:mmHg = 159\:mmHg[/latex]
Alveolar PO2
Although related, we are more interested in the PO2 at the gas exchange surface—that is the alveolar PO2 denoted as PAO2 (note the uppercase A; lowercase refers to arterial PO2 (i.e., PaO2)). This value differs significantly from atmospheric PO2 at about 100 mmHg. So why the drop of nearly 60 mmHg from atmospheric PO2?
To calculate alveolar PO2 we need to account for the water vapor that is added to the inspired air as it enters the airways. This is equivalent to adding another gas and must be accounted for. Water vapor exerts a pressure of 47 mmHg. Subtracting this from our atmospheric pressure, our total gaseous pressure is 713 mmHg; multiplying this by our fraction of inspired O2 (FiO2 is merely the percentage (fraction) of oxygen inspired), we see our alveolar PO2 is theoretically 149.7 mmHg (i.e., ~150 mmHg).
[latex]P_AO_2 = FiO_2 \times (P_B - P_{H_2O})[/latex]
[latex]P_AO_2 = 20.9\% \times (760 - 47) = 149.7\:mmHg\:or \sim 150\:mmHg[/latex]
If we understand that there will be mixing with air remaining from the previous breath, the real PAO2 is 100 mmHg (however, we will see this varies across the regions of the lung).
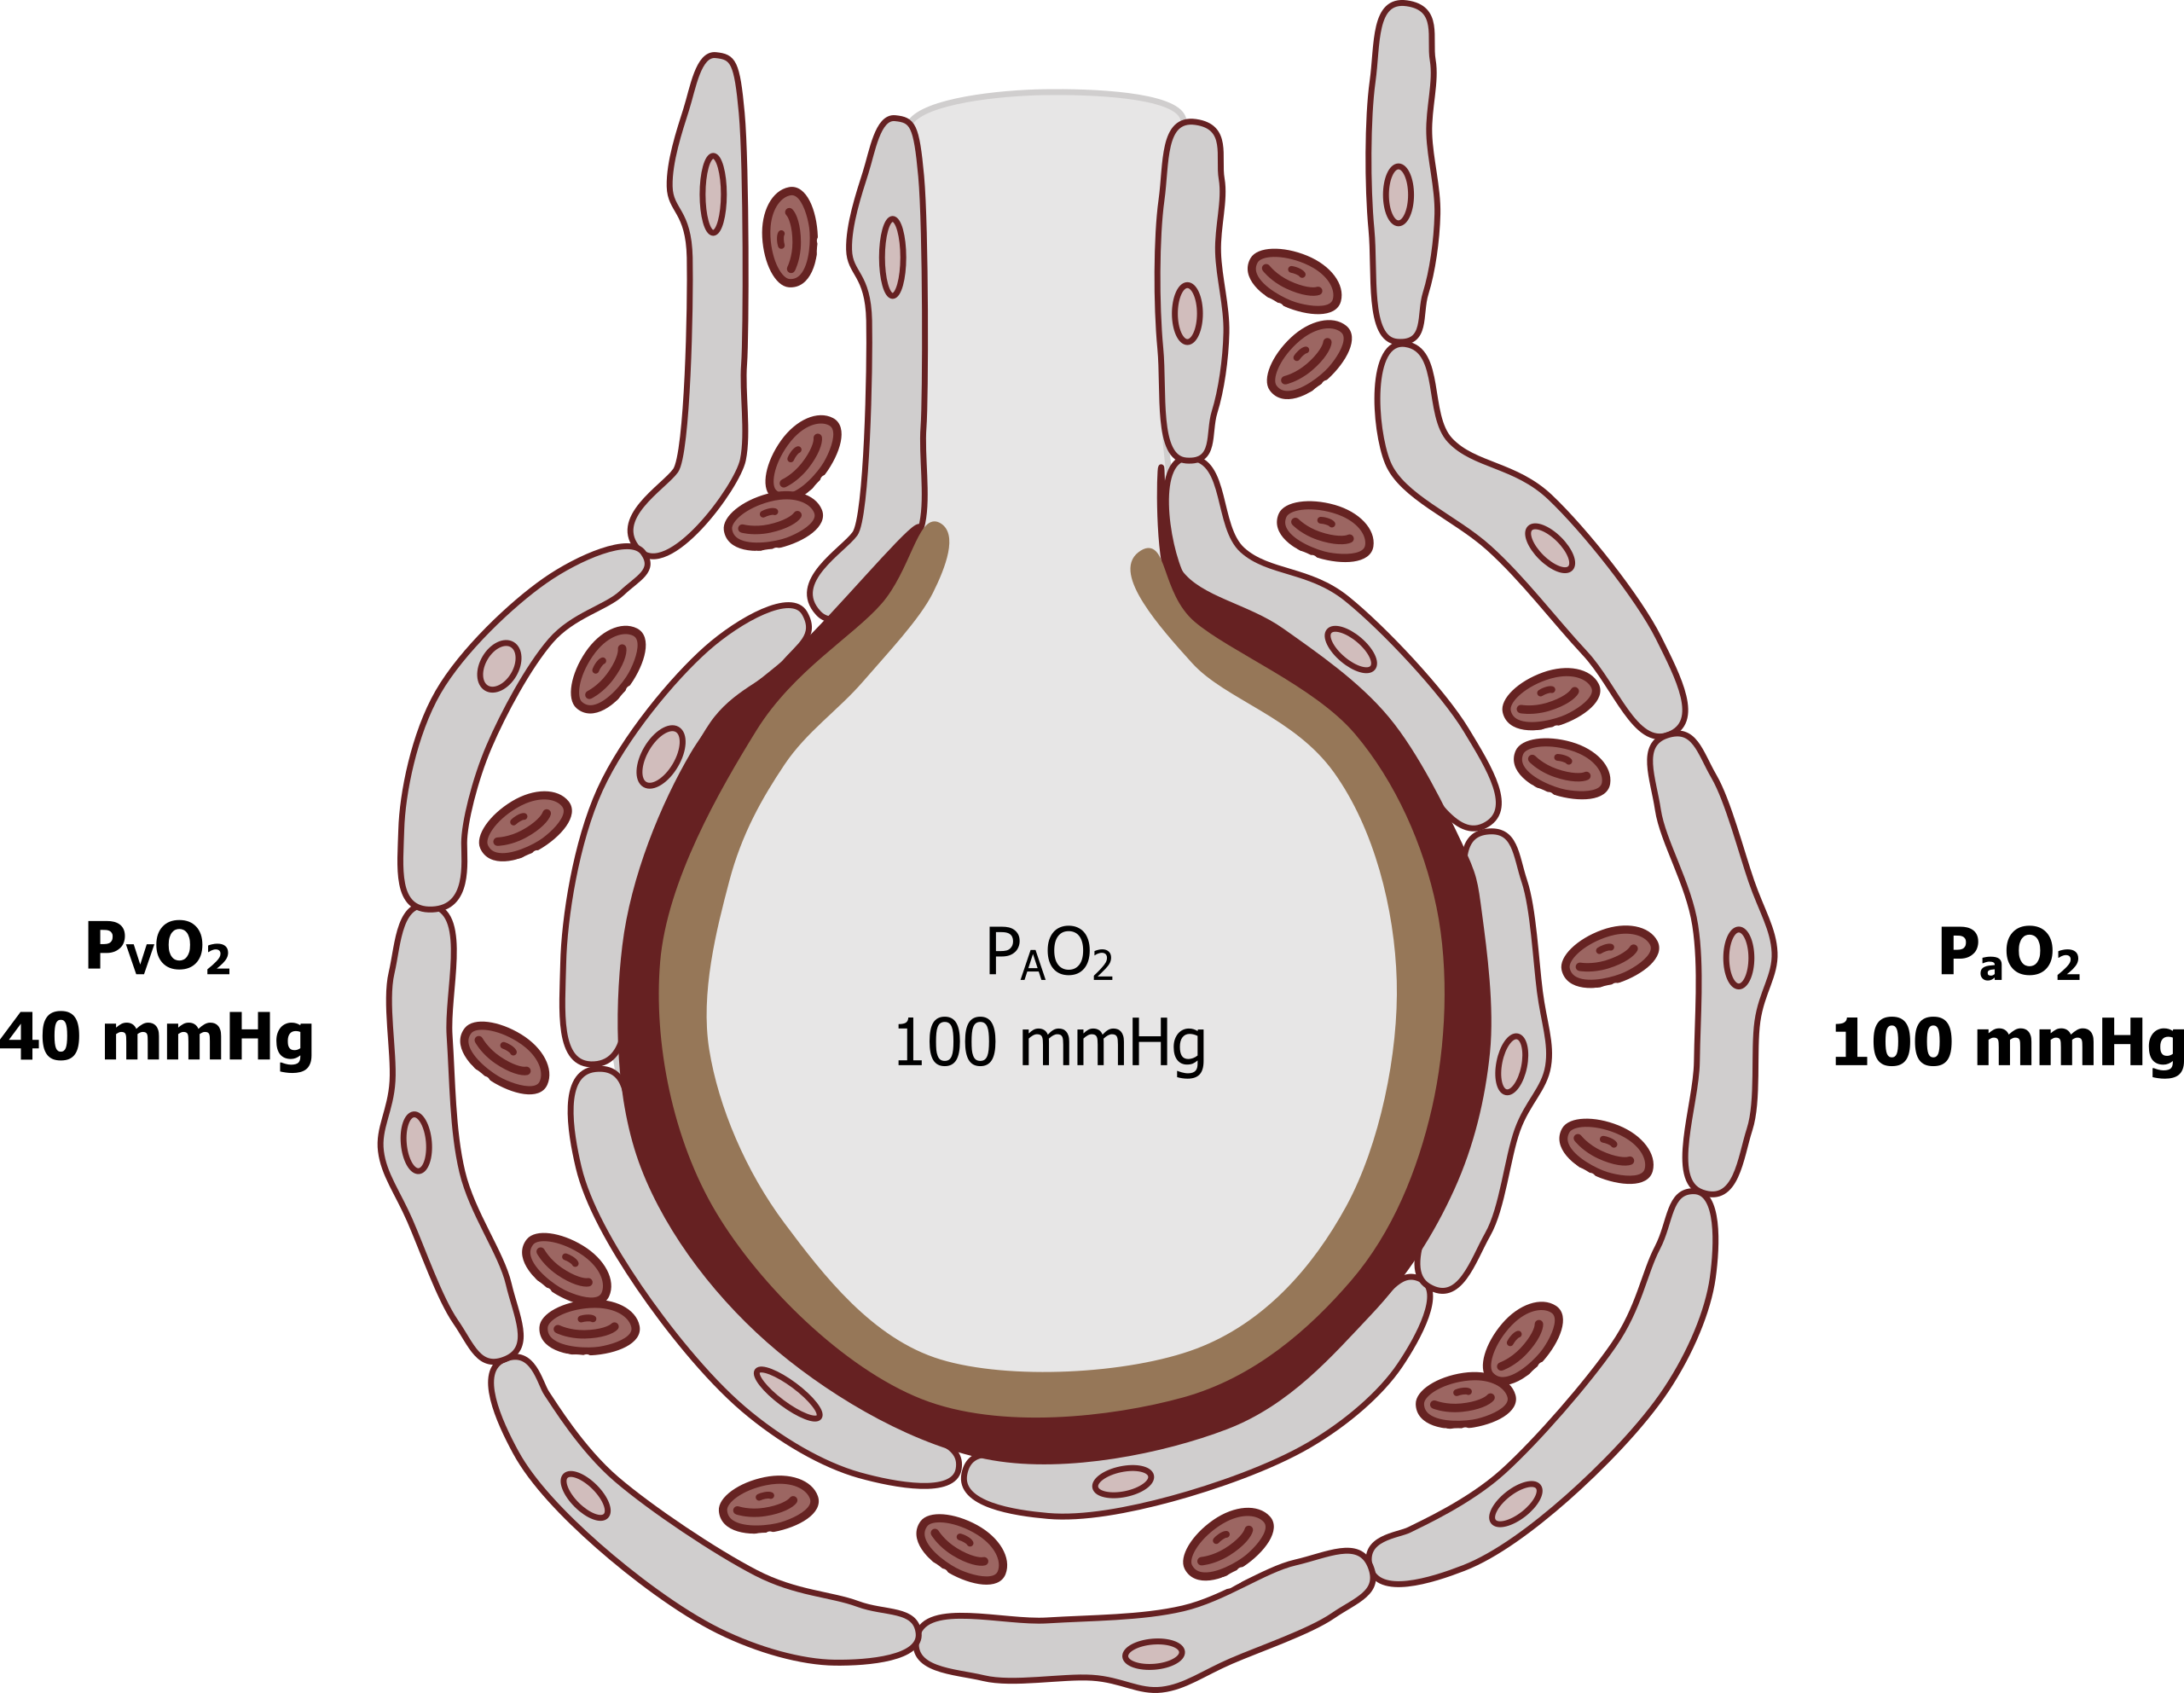
So how does this value relate to gas exchange in the lung? The venous blood PO2 (PVO2), returning from the systemic tissue where oxygen has been consumed, is 40 mmHg (see figure 7.1). This blood passes the gas exchange surface, and a pressure gradient of 60 mmHg allows oxygen to move into the pulmonary blood. By the time the blood has passed the alveolus, arterial PO2 will have equilibrated with the alveolar PO2 and will also be 100 mmHg. These numbers are well worth committing to memory.
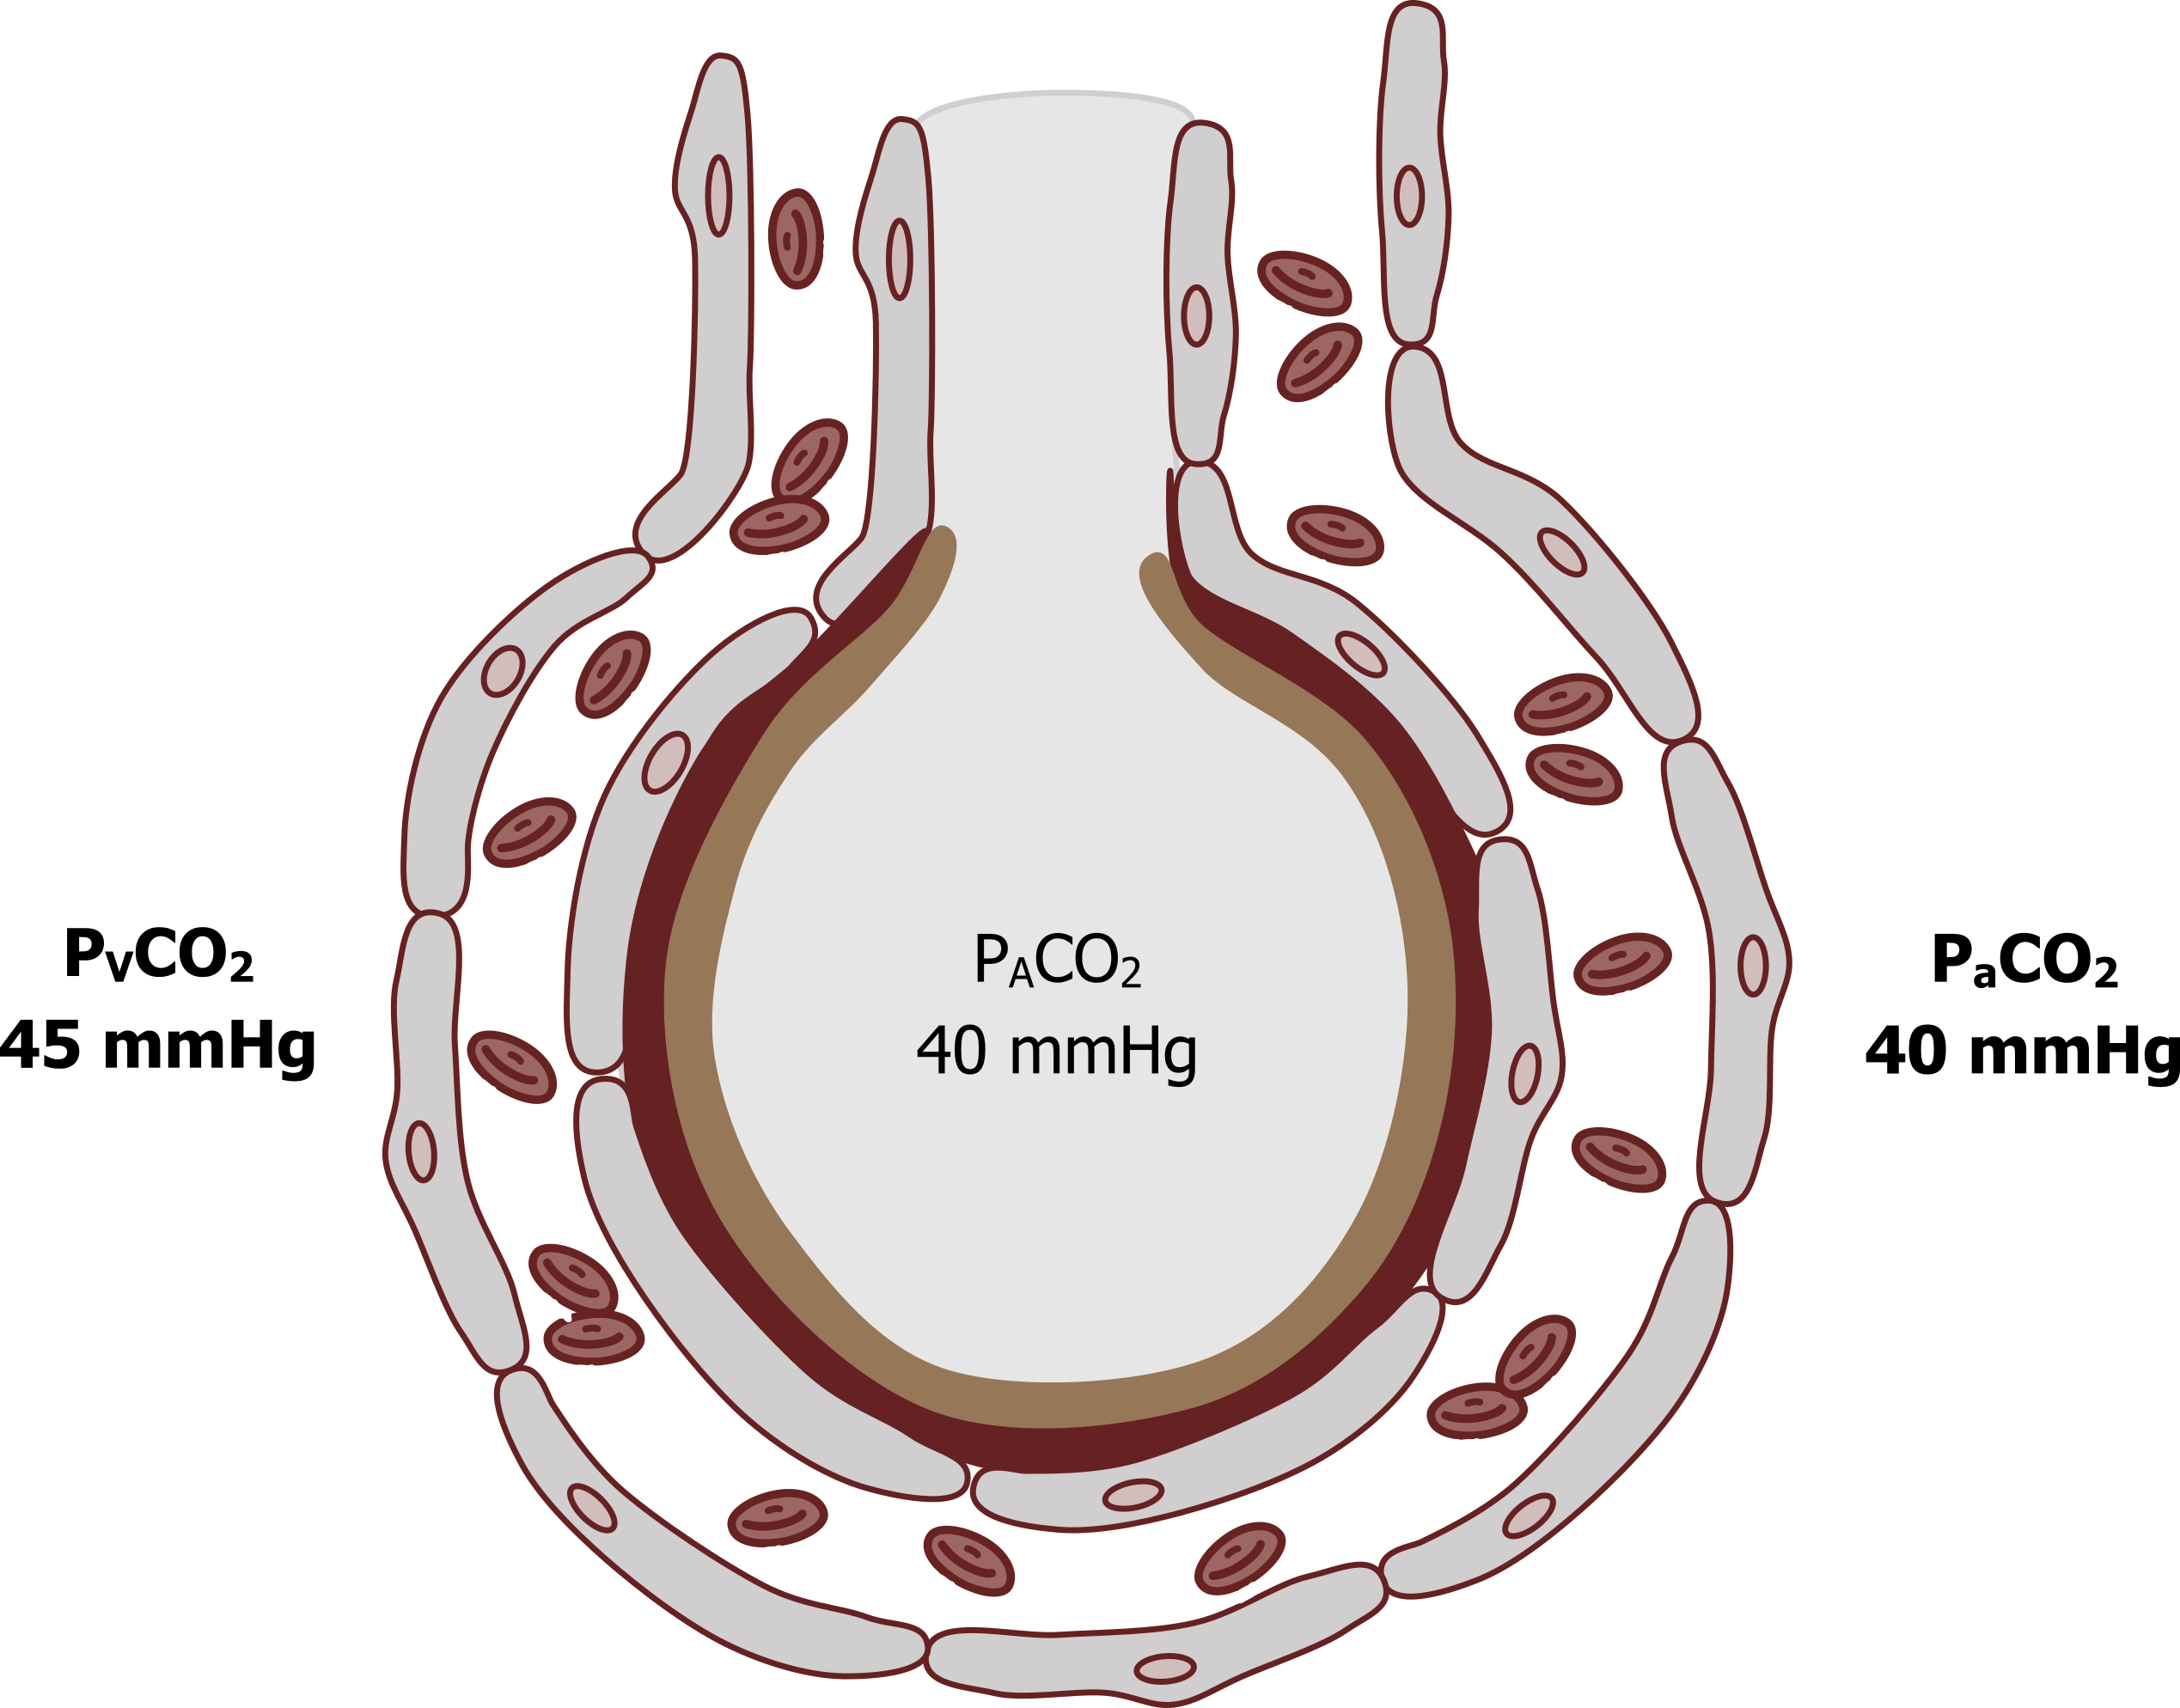
The other critical values we need to address here are the partial pressures of CO2 (see figure 7.2). Venous blood returning from the tissue has a PCO2 of 45 mmHg, compared to alveolar PCO2 that is 40 mmHg. This pressure gradient of 5 mmHg is enough to allow blood to equilibrate with the alveolus, and so arterial PCO2 is 40 mmHg. Again, these numbers are worth remembering.
A much smaller diffusion gradient is needed for CO2 because CO2 is much more soluble than oxygen, a factor among others that is included in Fick’s law of diffusion.
Fick’s Law of Diffusion
Fick’s law of diffusion (equation 7.1) describes all the factors that influence the transfer of gas (or flow, V) across a membrane.
Equation 7.1
[latex]\dot{V} \propto \displaystyle\frac{A}{T} \times D \times (P_1 - P_2)[/latex]
We will look at each factor in the equation and see how it relates to the physiology of the lung.
Pressure gradient (P1−P2): The higher the pressure gradient, the greater the transfer of gas, and the pressure gradient must be maintained for gas exchange to continue. The maintenance of the gradient is achieved by adequate ventilation to the alveolus to refresh the alveolar gases, and adequate perfusion to flush oxygen away from the gas exchange surface and supply more CO2. We will look at the importance of matching ventilation and perfusion in chapter 13.
Other factors in Fick’s law are fairly obvious and are reflected in the lung’s structure.
Surface area (A): The greater the surface area available for exchange, the greater the exchange. The lung has a surface area of 100 m2, which is more than adequate to maintain sufficient gas transfer, even during maximal exercise.
Membrane thickness (T): The thickness of the membrane that gas has to cross also determines the rate of transfer; the thinner the membrane, the more rapid the transfer. The gas exchange membrane in the lung is approximately a 0.3 um thick—and poses little opposition to gas movement.
Diffusion constant (D): The last variable is the diffusion constant of the gases in question, which for us are O2 and CO2. The important issue here is that CO2 is much more soluble (x 20) than O2 and so has a much greater diffusion constant; hence it transfers across the membrane much more readily and does not need the large pressure gradient like the relatively insoluble oxygen (5 mmHg compared with 60 mmHg).
Some of these factors can change in lung disease and can result in decreased gas exchange and so result in deranged blood gases. Loss of surface area occurs in diseases, such as emphysema, that destroy the lung architecture, and cause a loss of gas transfer. Likewise, any disease that causes thickening of the alveolar membrane, such as pulmonary fibrosis, increases the distance for, and resistance to, gas transfer. If ventilation or perfusion of the gas exchange surface fails—for example, a mucus plug blocking an airway or a pulmonary embolus blocking a vessel—then the pressure gradient across the membrane is lost and gas exchange is reduced compared to the ideal situation of ventilation and perfusion being matched.
Summary
After this chapter you should be able to calculate the alveolar partial pressure of a gas at any atmospheric pressure and relate it to the rate of gas exchange.
You should also now understand the different factors that contribute to the rate of gas exchange described in Fick’s law of diffusion and be able to appreciate how they might change in disease.
References, Resources, and Further Reading
Text
Levitsky, Michael G. “Chapter 6: Diffusion of Gases and Interpretation of Pulmonary Function Tests.” In Pulmonary Physiology, 9th ed. New York: McGraw Hill Education, 2018.
West, John B. “Chapter 3: Diffusion—How Gas Gets Across the Blood–Gas Barrier.” In Respiratory Physiology: The Essentials, 9th ed. Philadelphia: Wolters Kluwer Health/Lippincott Williams and Wilkins, 2012.
Widdicombe, John G., and Andrew S. Davis. “Chapter 4.” In Respiratory Physiology. Baltimore: University Park Press, 1983.
Figures
Figure 7.1: Oxygen tensions around the alveolus. Grey, Kindred. 2022. CC BY 4.0. Added red blood cells by Lucas Helle from Noun Project. CC BY 3.0. https://archive.org/details/7.1_20220125
Figure 7.2: Carbon dioxide tensions around the alveolus. Grey, Kindred. 2022. CC BY 4.0. Added red blood cells by Lucas Helle from Noun Project. CC BY 3.0. https://archive.org/details/7.2_20220125
