3 Lung Volumes and Compliance
Learning objectives
- Describe the lung volumes that can be determined by spirometry.
- Describe the factors that determine lung compliance as the lung inflates from residual volume to total lung capacity.
- Describe the ramifications of dead space on the pattern of breathing during hyperpnea.
Lung Volumes
Introduction
In this section we will look at some of the nomenclature for a variety of lung volumes and how these are clinically pertinent and can change in disease. We will also begin to look at the work of breathing and what factors affect how easy or hard the lung is to inflate, that is, lung compliance. We will then see how breathing pattern is generated to improve the efficiency of the lung and reduce the work of breathing.
Lung Volumes
First let us look at lung volumes. This trace from a spirometer (figure 3.1) shows the change in lung volume as a patient breathes normally and then performs some specific maneuvers.
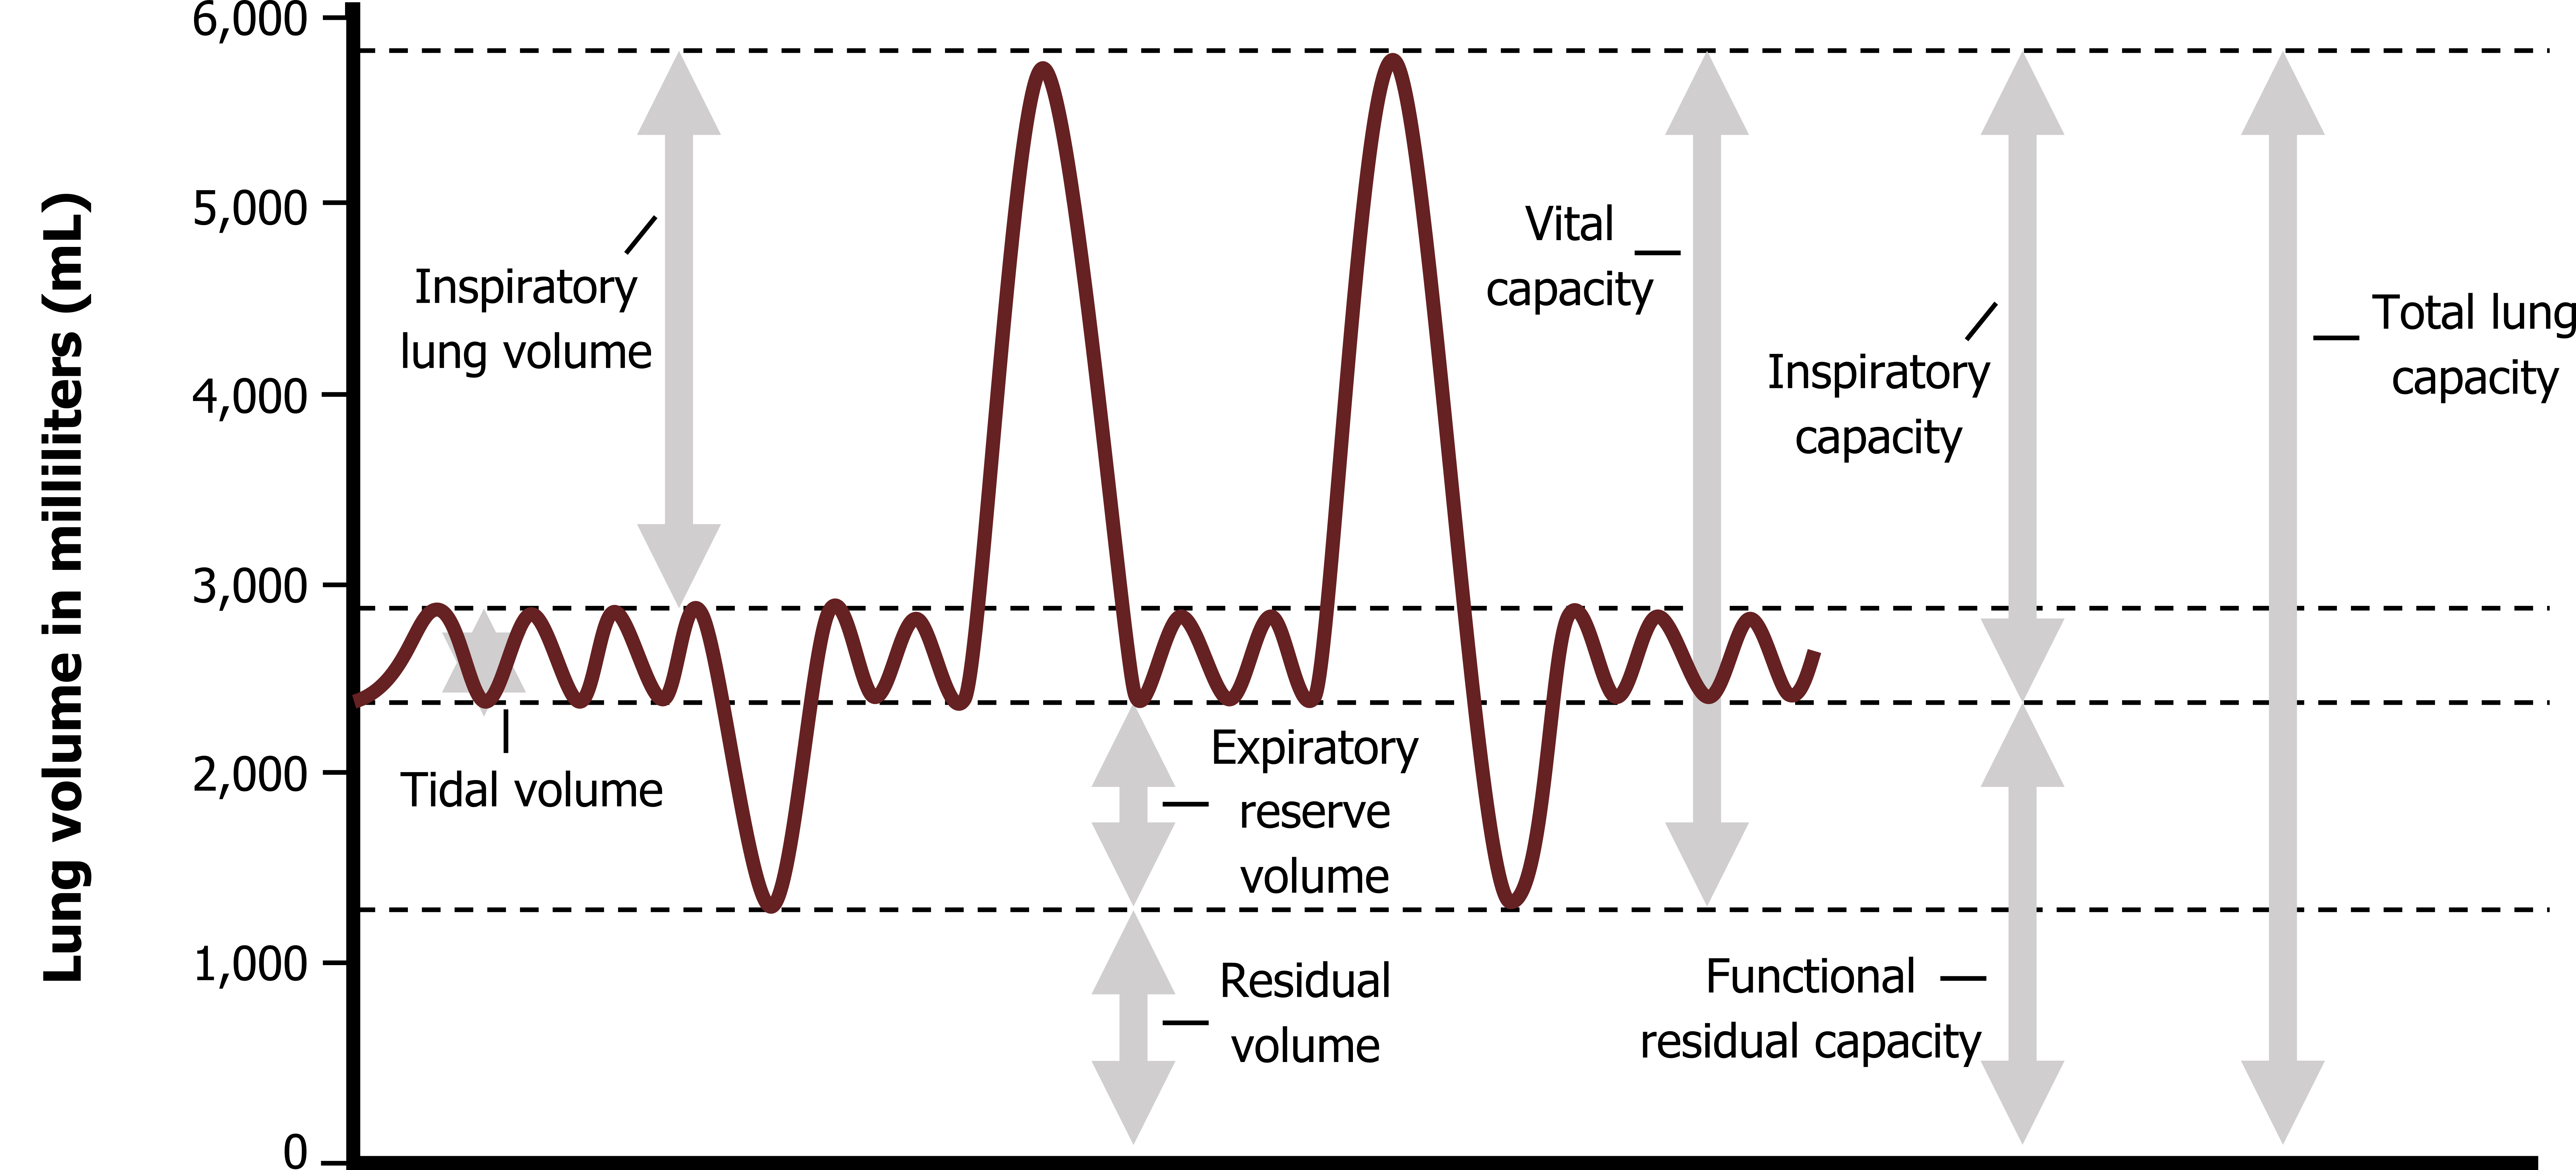
Let us work through the trace from left to right. The initial part of the trace shows resting or “tidal” breathing. The amount of volume inspired during each breath is referred to as tidal volume.
Once a normal expiration is complete, however, the lung is far from empty, and when instructed, this patient (figure 3.1) breathes out as far as they can; this excess that comes out the lung is referred to as the expiratory reserve volume.
Even at this point, however, some air remains in the lung, and this is referred to as residual volume. Even with maximal efforts, this volume cannot be exhaled, so at no point can the lung be fully emptied. This also means that residual volume can never be measured with a spirometer.
Our patient (figure 3.1) returns to normal tidal breathing for two breaths before taking a full breath in, filling the lungs as much as they can. This extra volume into the lung after a normal tidal inspiration is referred to as inspiratory reserve volume. Related to this volume is the inspiratory capacity, which is the volume that can be taken into the lung after a normal expiration; inspiratory capacity is a useful clinical measurement that we will return to when we deal with some disease states.
Another clinically valuable measurement is vital capacity, which is the volume of air that our patient can move out of the lung after a full inspiration, that is, the total lung capacity, minus the residual volume (remember: residual volume cannot be expelled). Forced vital capacity is a common measure taken in pulmonary function testing, and this is simply the volume that can be expelled from total lung capacity during a forceful expiration. The importance of this maneuver being forced will be dealt with when we look at airway compression (chapter 6).
While the volumes we have just seen measured by spirometry in the pulmonary function lab provide valuable clinical information, we need to now look at some physiological variables that are also critical for our understanding of lung function and disease.
Components of Tidal Breathing
As you have seen, the volume of air inspired during a normal breath is tidal volume, and the size of this is dependent on body size, but in the example here is listed as 500 mL (a good approximation). Not all this 500 mL reaches the gas exchange surfaces in the respiratory zone, however, as some never gets further than the conducting zone (i.e., it stays in the anatomical dead space). From chapter 1 we know that this dead space has a volume of 150 mL, so the amount of air reaching the alveoli in the respiratory zone is our tidal volume (500 mL), minus the dead space volume, so alveolar volume is 350 mL.
This brings us to an important point of clarification. Minute ventilation (denoted as Ve) is the volume of air exchanged in the lung within a minute. This is analogous to cardiac output, the volume of blood pumped by the heart in a minute. As such, minute ventilation is the average tidal volume (VT) multiplied by the number of breaths taken in a minute (RR).
Equation 3.1
[latex]Ve = RR \times V_T[/latex]
So if respiratory rate is 10 bpm and tidal volume is 500 mL, minute ventilation is 5,000 mL.
Equation 3.2
[latex]Ve = 10\:bpm \times 500\:mL = 5,000\:mL\:per\:min[/latex]
Physiologically more important, however, is the alveolar minute ventilation (VA) that accounts for the “wasted” ventilation that never reached a gas exchange surface but remained in the anatomical dead space. So the calculation for VA is
Equation 3.3
[latex]V_A = RR \times (V_T - V_D)[/latex]
where VD is the anatomical dead space (approximately 150 mL). So for our previous example, alveolar minute ventilation is
Equation 3.4
[latex]V_A = 10 \times (500 - 150\:mL) = 3,500\:mL\:per\:min[/latex]
describing only the volume of air that reached the respiratory zone.
So far the involvement of anatomical dead space might seem academic, as it remains constant. But let us consider a different breathing pattern (as often occurs in disease states).
In our example above minute ventilation is 5,000 mL, but accounting for dead space we see that alveolar minute ventilation is 3,500 mL. Now let us consider another breathing pattern—one typical of a patient with restrictive lung disease where tidal volume is reduced and respiratory rate is increased. With a tidal volume of 250 mL and rate of 20, the minute ventilation remains the same, 5,000 mL.
Equation 3.5
[latex]Ve = 20\:bpm \times 250\:mL = 5,000\:mL\:per\:min[/latex]
But calculating alveolar minute ventilation we see that a greater proportion of the reduced tidal volume is consumed by dead space.
Equation 3.6
[latex]V_A = 20 \times (250 - 150\:mL) = 2,000\:mL\:per\:min[/latex]
So despite maintaining the same minute ventilation, the second patient’s alveolar minute ventilation is reduced by 1,500 mL, which is significant given that this is the volume of air going to the gas exchange surfaces.
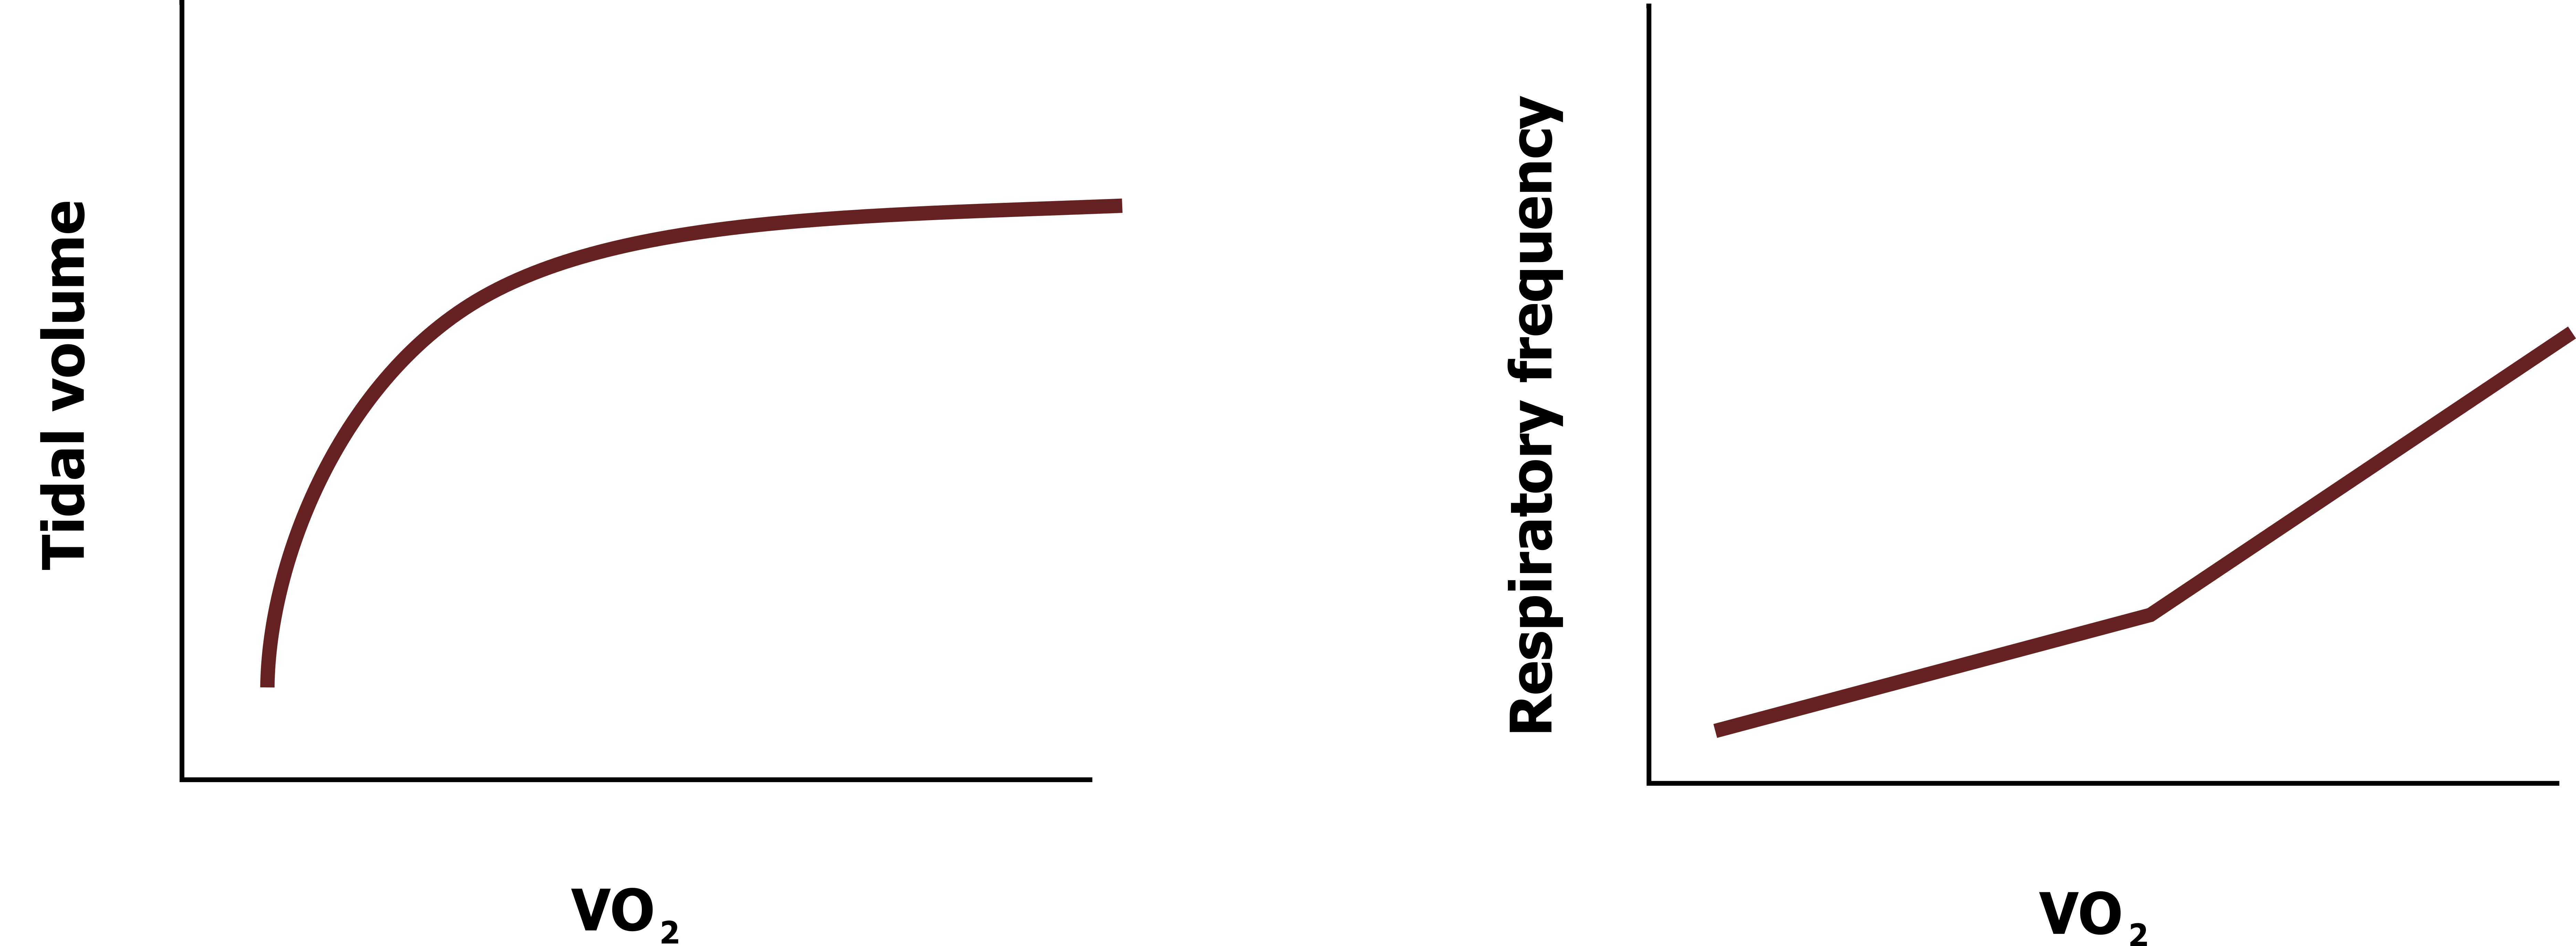
This partially explains why increases in ventilation are initially achieved by increases in tidal volume; as shown in figure 3.2, as tidal volume increases during exercise intensity (represented by oxygen uptake) until it reaches a plateau. Only when this plateau is reached are further increases in minute ventilation achieved by increasing respiratory rate.
So why not keep increasing tidal volume? At higher lung volumes the elastic limit of the lung is approached, and it takes more energy (muscular force) to expand, so it is more efficient and the work of breathing is less if the rate of breathing is increased to achieve higher levels of minute ventilation. This brings us to our next topic, lung compliance.
Lung Compliance
Introduction
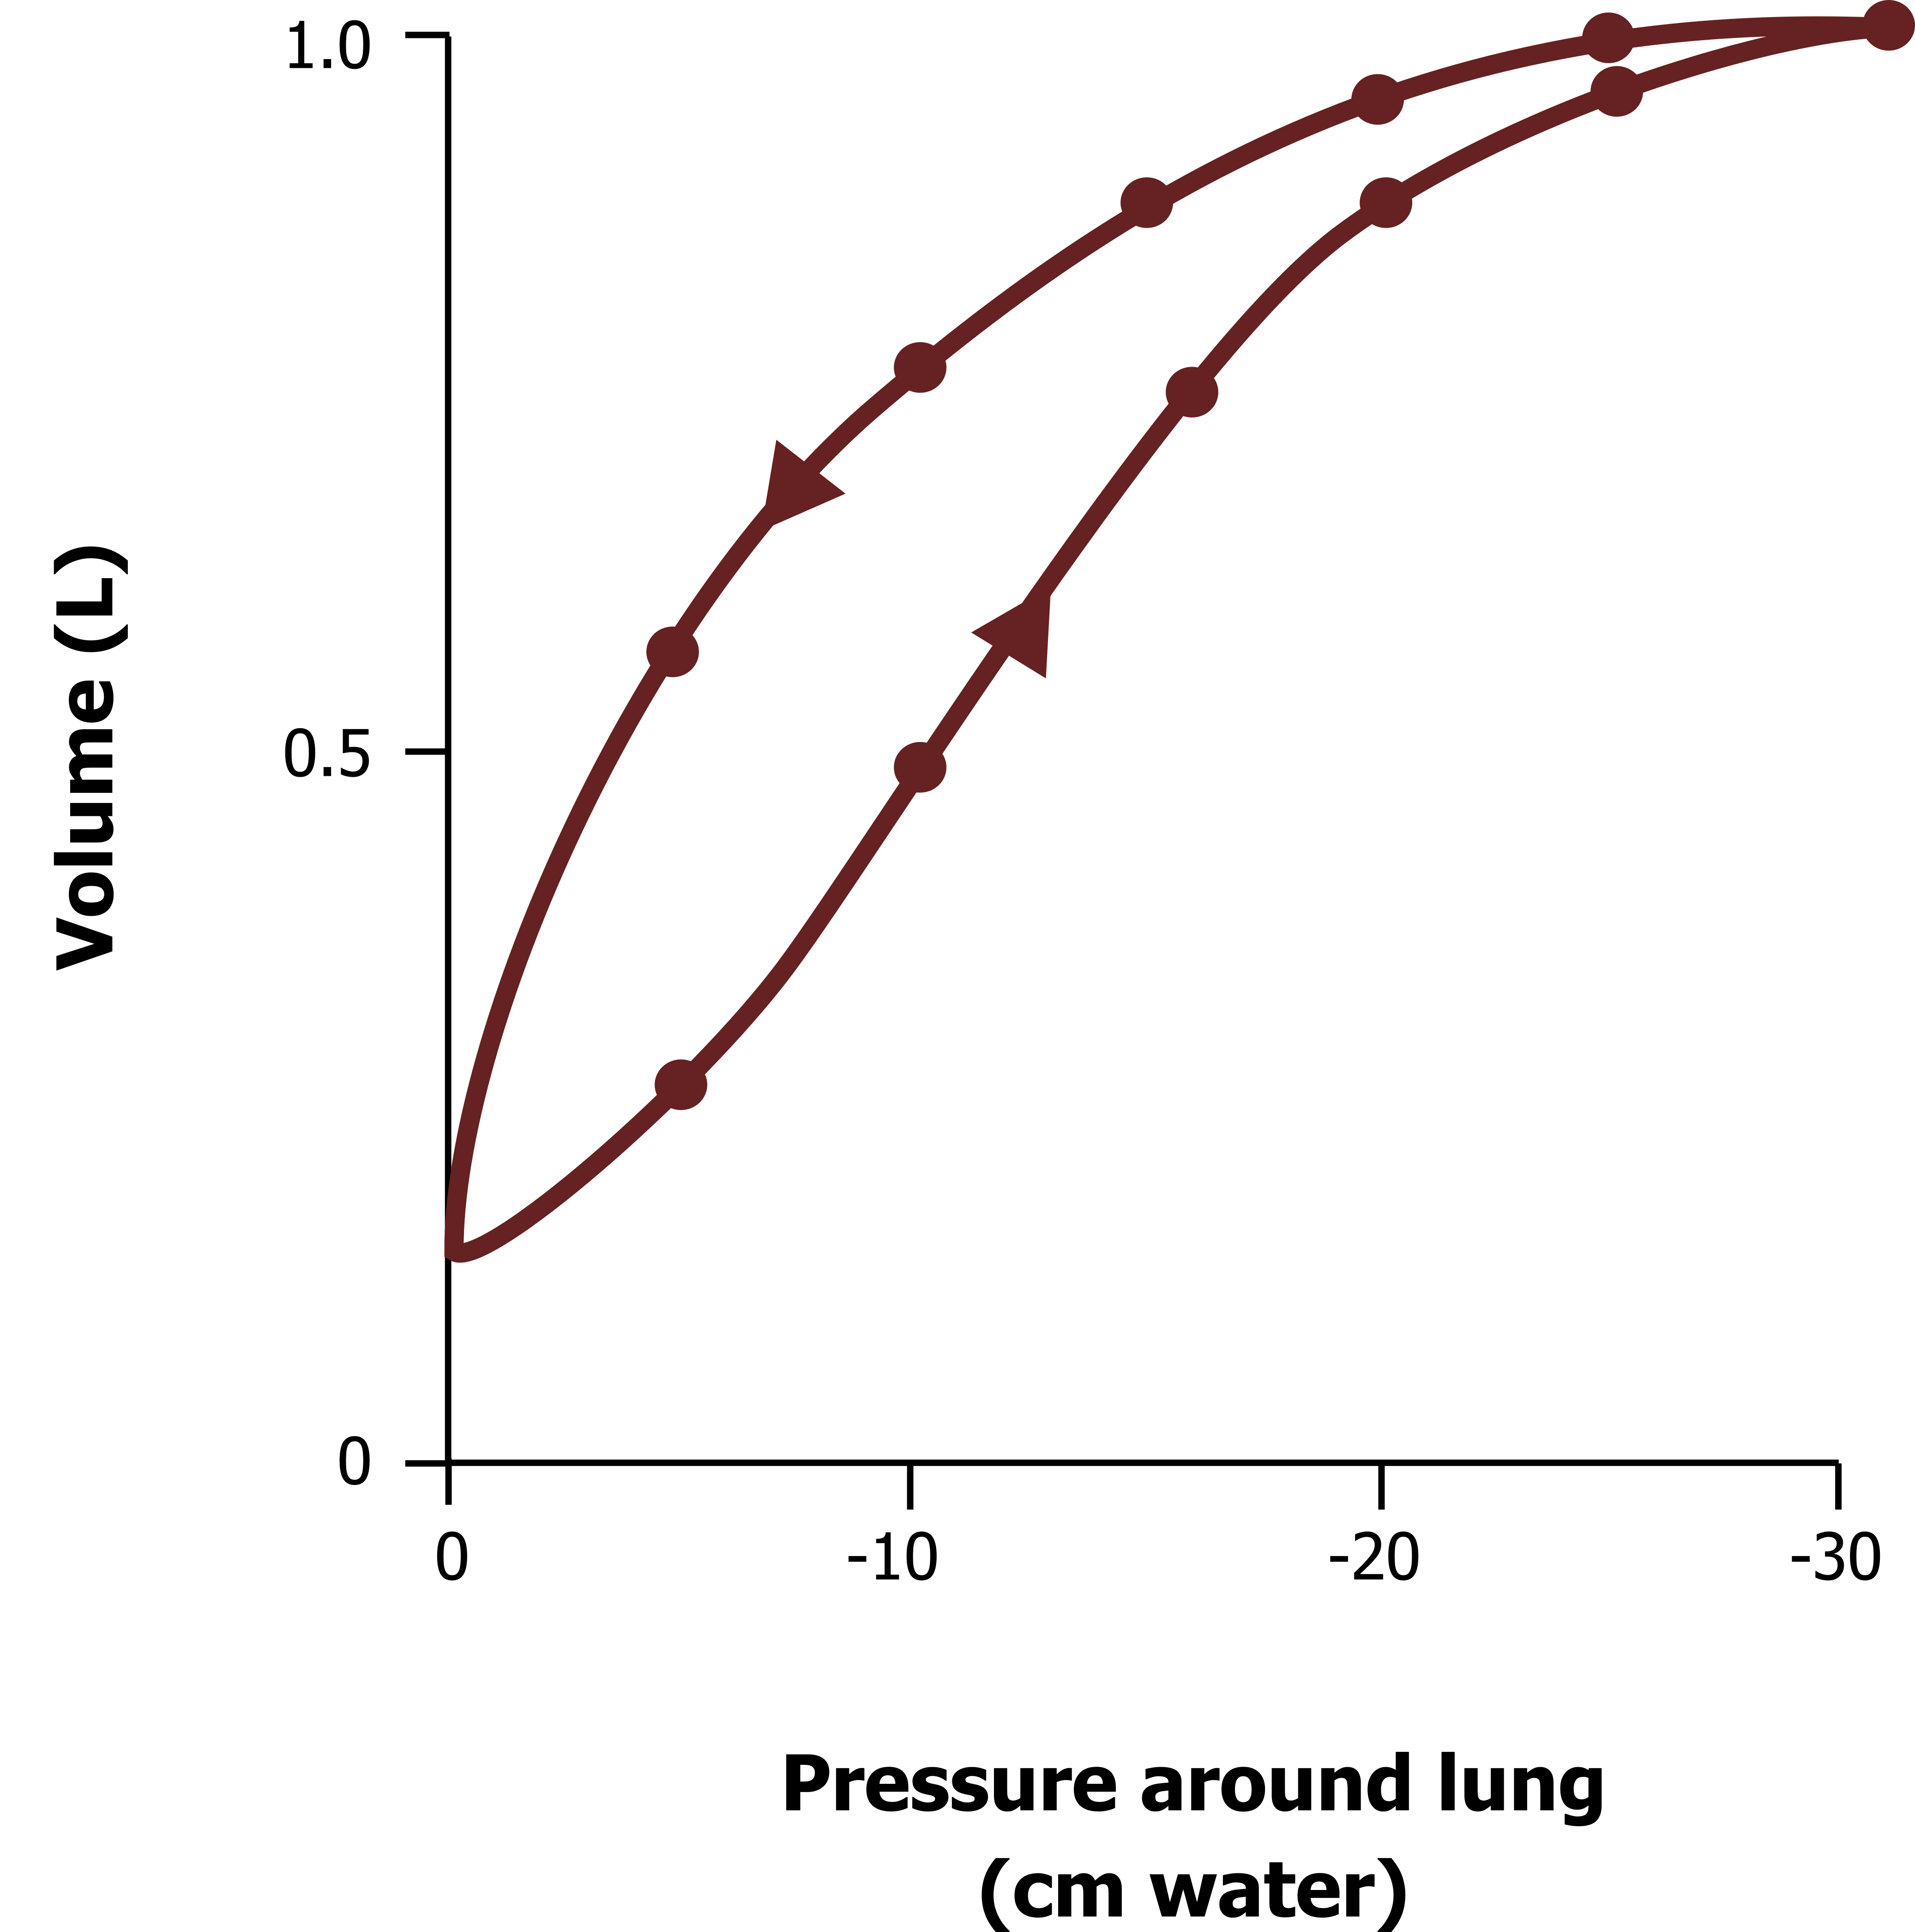
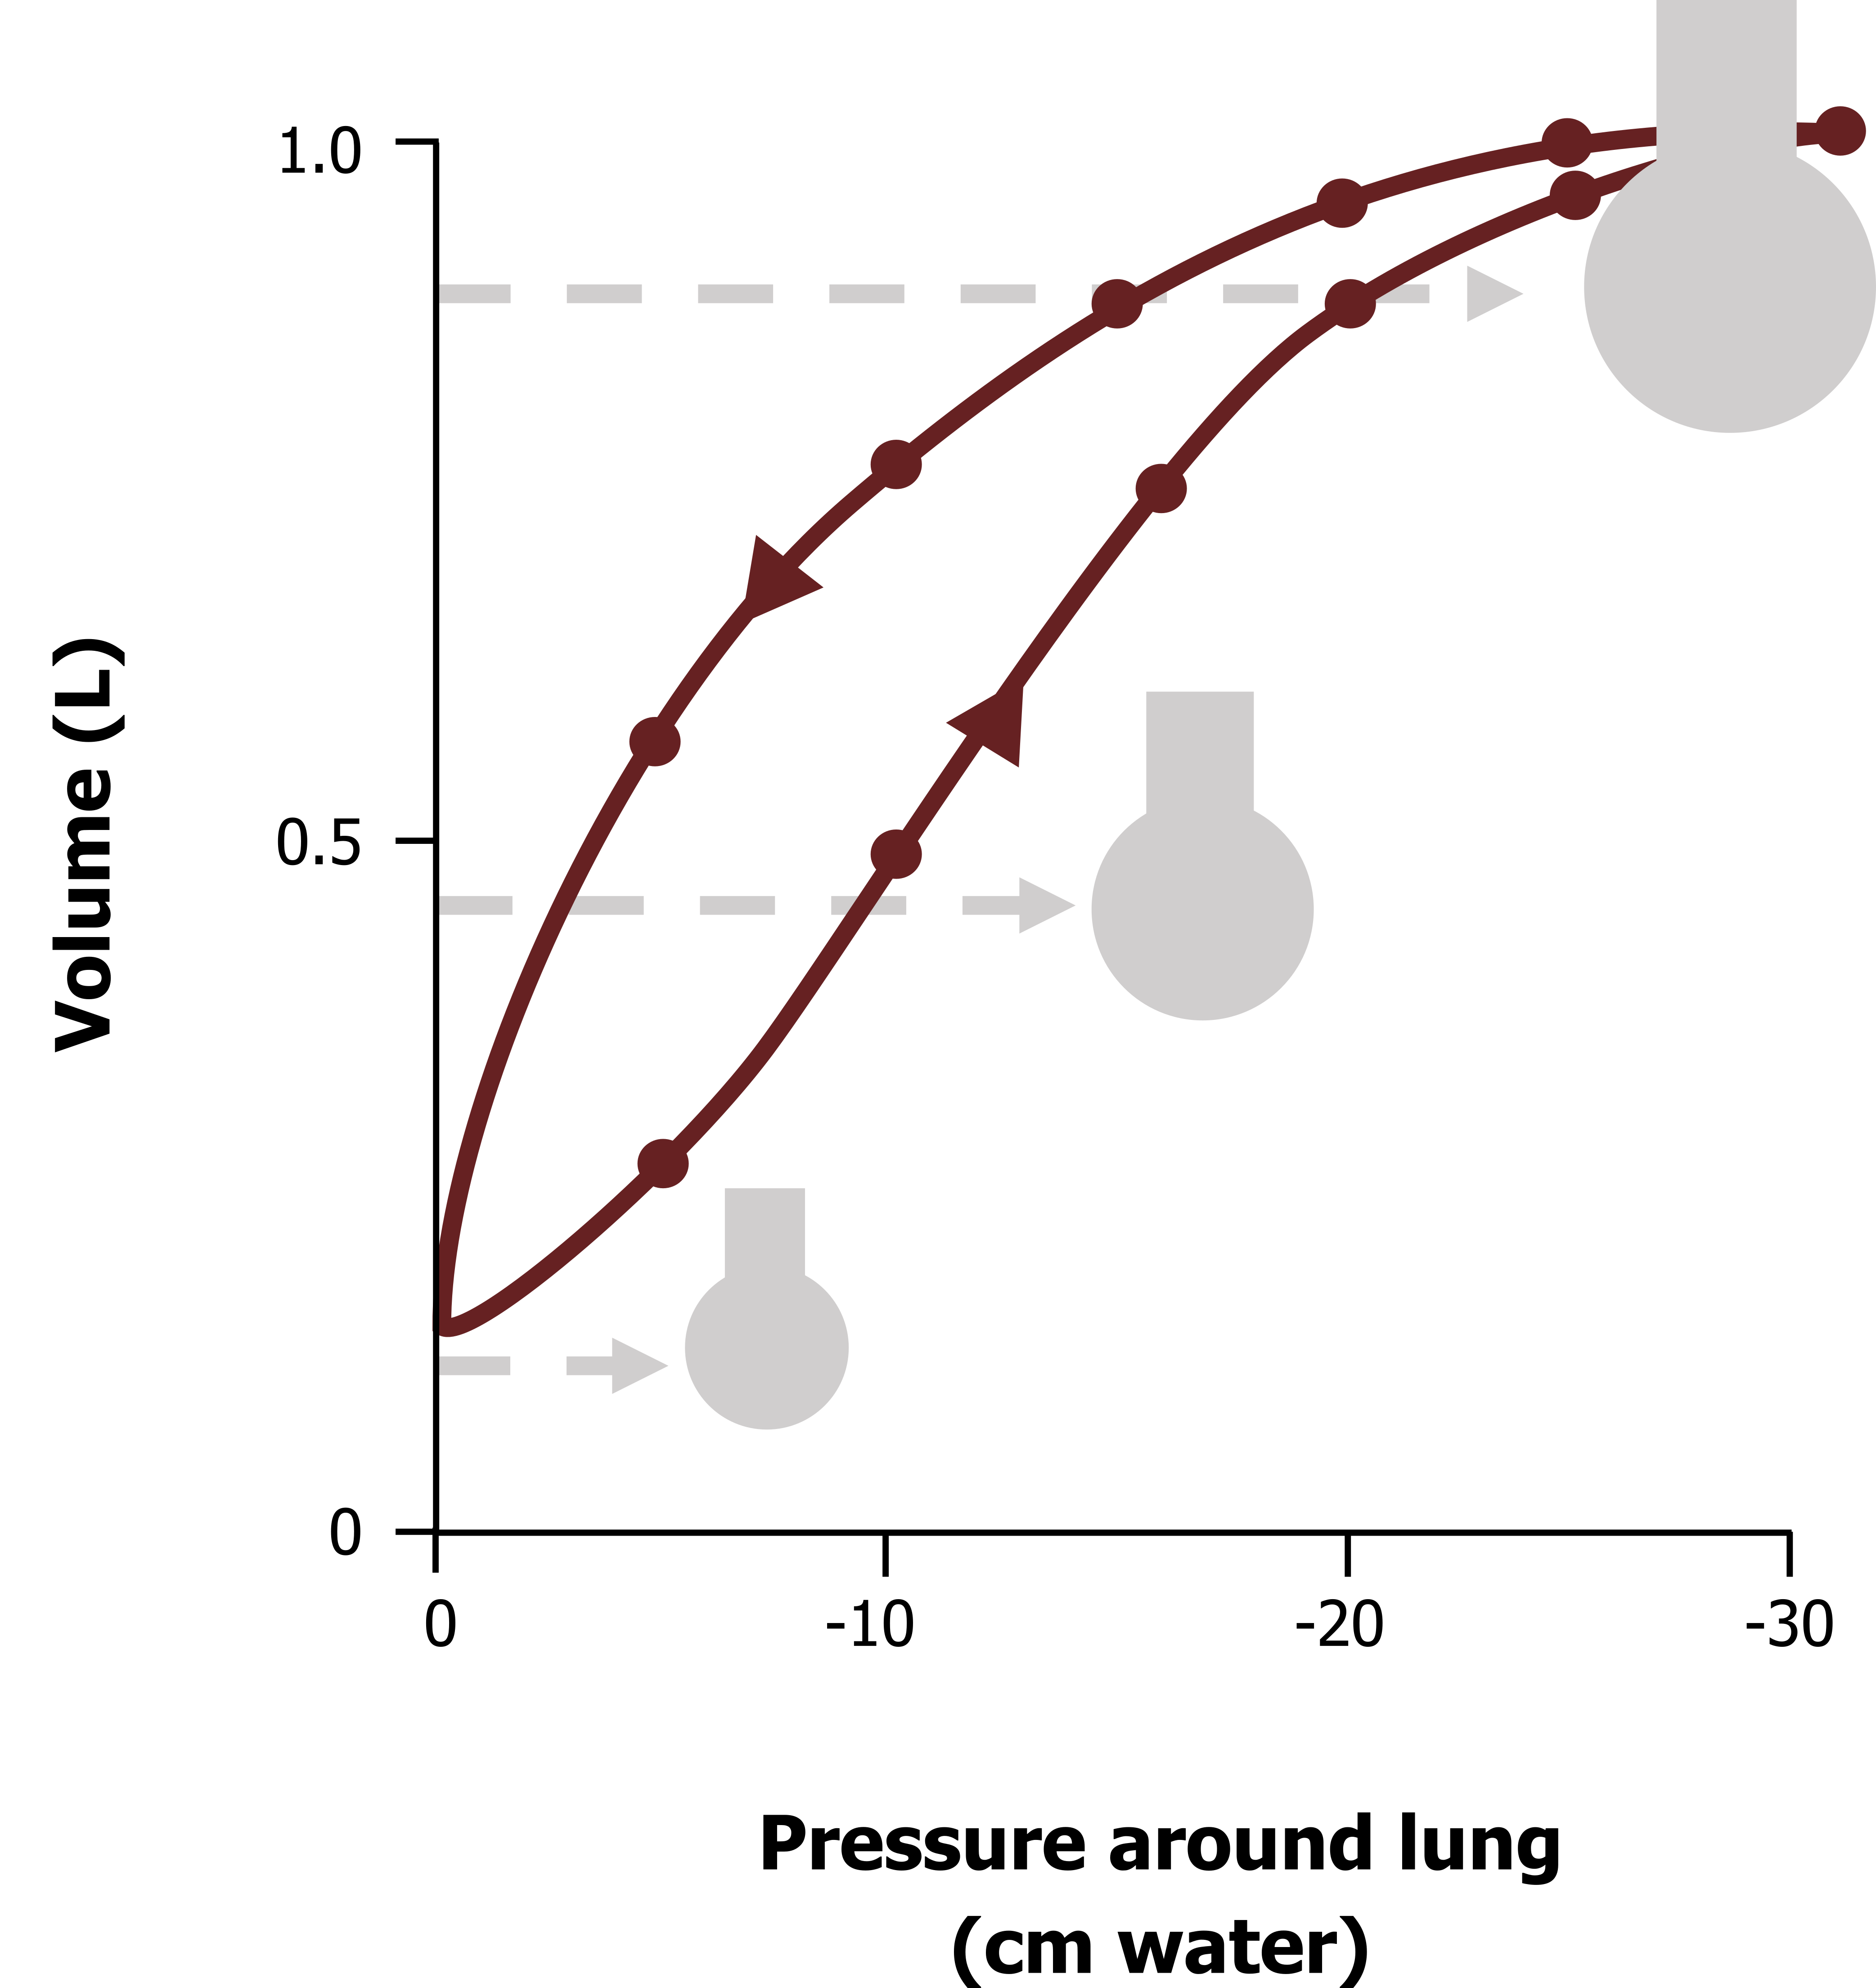
Lung compliance is a description of how easy the lung is to inflate, more specifically, how much volume will change for a given pressure differential. Figure 3.3 shows a typical and normal lung compliance curve. The lower line shows how volume changes as intrapleural pressure becomes more negative (as the chest wall and diaphragm expand the thorax). The upper curve is the compliance of the lung during expiration, and it is clearly different; this is an example of hysteresis, meaning that the relationship depends on direction, and we will see why this exists later.
Lung Compliance During Inspiration
You will notice at low lung volumes the slope of the compliance curve (figure 3.3) is shallower, meaning that it takes a relatively large pressure change to cause an increase in volume. This tells us at low lung volumes the lung is less distensible, or has low compliance.
If we start to breathe at a higher lung volume, the slope of the curve is steeper, meaning that for a similar change in pressure there is a greater change in volume (i.e., the lung is more compliant).
If we start breathing at a higher lung volume still, closer to total lung capacity, we see the slope of the compliance curve flatten out again, showing that at the lung volumes the compliance of the lung is low.
As you might imagine, the normal range for breathing is in the middle range where the slope is steep and the lung compliant. This corresponds to an intrapleural pressure range of −5 to −10 cm H2O, which you should know is the normal range of intrapleural pressures during tidal breathing. This means we normally breathe at a lung volume at which the lung is most compliant and therefore takes less work to inflate.
Too low a lung volume and compliance falls and work of breathing increases, likewise during breathing at high lung volumes, another contributing reason for why tidal volume plateaus during exercise.
So now let us look at why compliance is low at high and low lung volumes, starting with the cause of low lung compliance at low volumes.
Low compliance at low volumes—Surface tension: The reason why the lung takes more pressure to inflate at low volumes is surface tension. As mentioned in chapter 1 the alveoli have a thin layer of fluid lining their inner surface. As we saw in the pleural space, this causes surface tension. Unlike the surface tension in the pleural space, in the alveoli surface tension is a disadvantage.
Surface tension is generated as water molecules cluster together to reduce their exposure to the gas in the alveolar space. As they gather together they drag the alveolar wall with them, producing a force that tends to pull the alveolar walls inward. The alveolar pressure opposes this force and should prevent the alveolus from collapsing (figure 3.4).
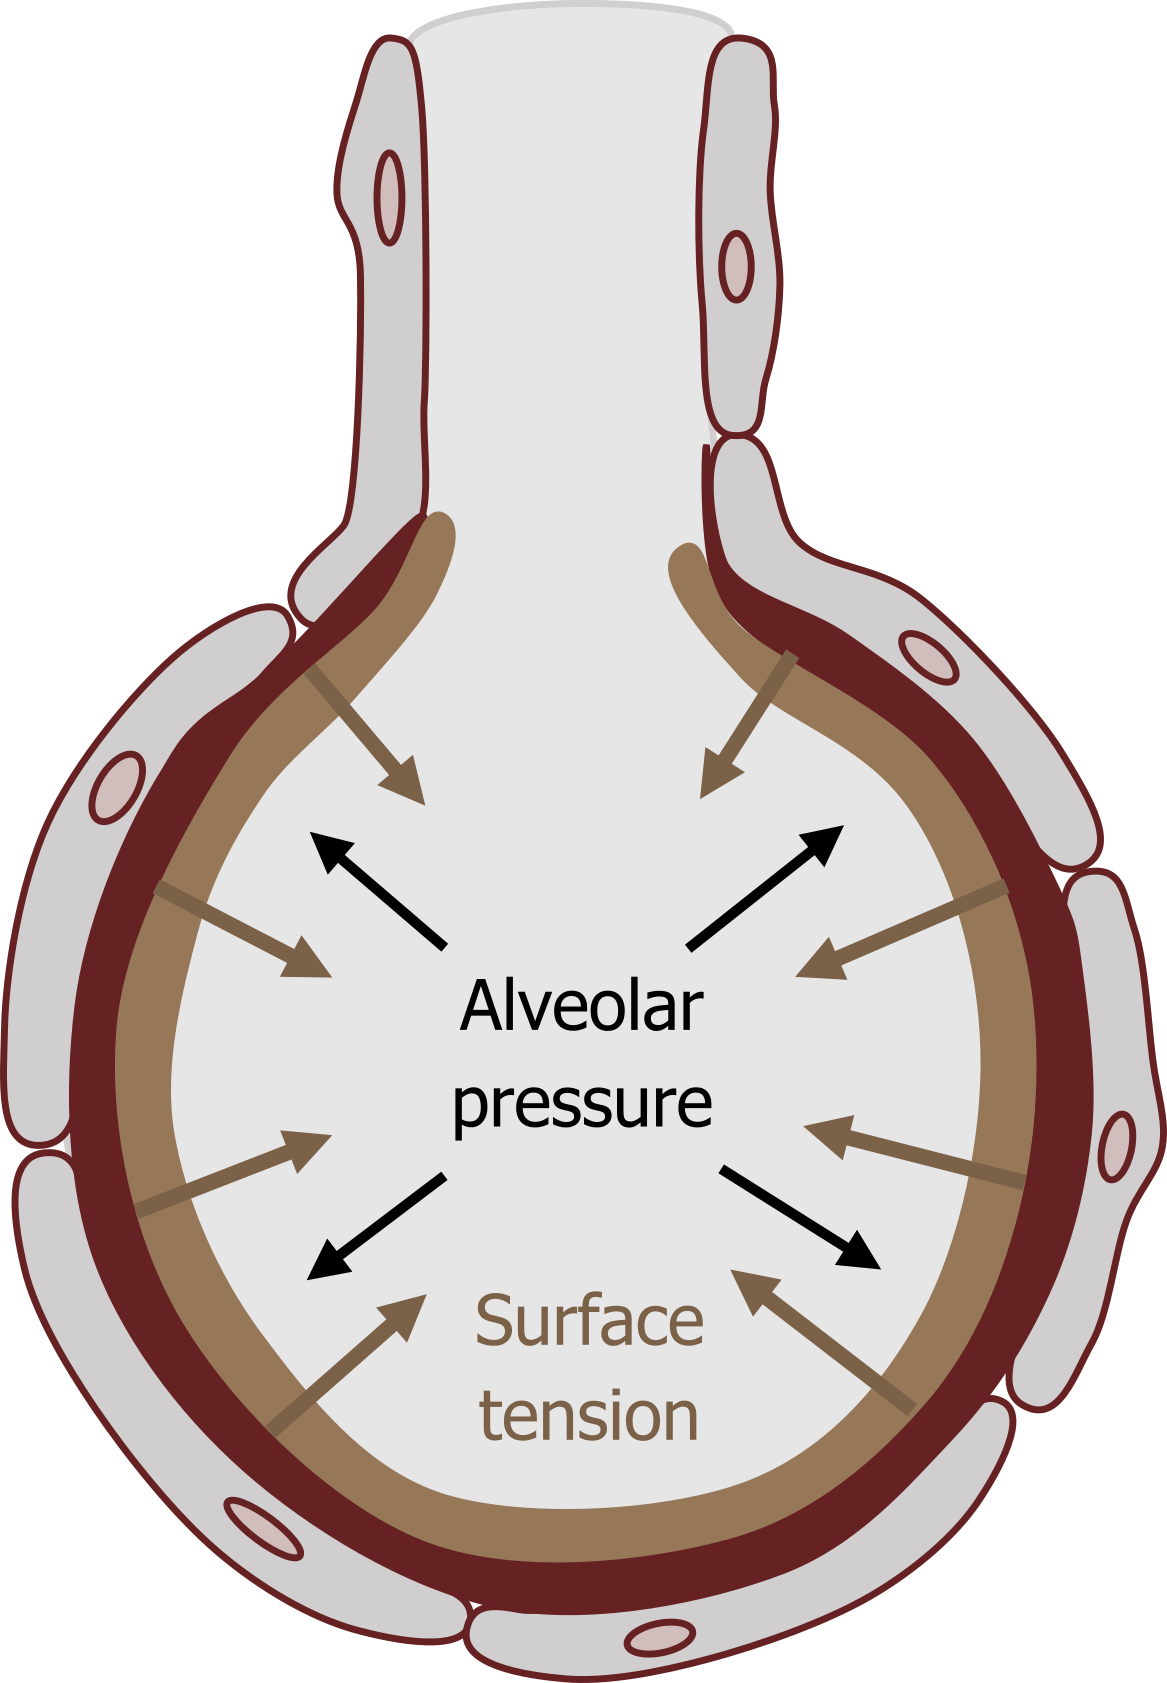
The relationship between these two opposing forces is described by Laplace’s law that states the outward (alveolar) pressure needed to oppose the inwardly directed tension is proportionate to the tension (obviously), but also inversely related to the radius of the alveolus (i.e., the smaller the radius, the greater the inwardly acting force).
This explains why compliance is low at low lung volumes. At low lung volumes the alveoli are smaller and thus have a smaller radius. Laplace’s law states that with a low radius the pressure needed to overcome the inward force will be greater, explaining why a larger alveolar (outward) pressure is needed to inflate the alveolus from a low starting volume.
As lung volume increases, and thus alveolar radius increases, the pressure needed to overcome the inward acting force becomes less and the compliance of the lung increases. This explains why compliance is improved at the normal operating range of lung volumes.
This also explains the hysteresis of the compliance curve. During expiration as alveoli are becoming progressively smaller, the inwardly acting force generated by surface tension becomes progressively greater. This phenomenon consequently assists expiration and contributes to expiration being a passive process.
Low compliance at high lung volumes—Elastic limit: At high lung volumes the alveolar radius has increased further, suggesting that compliance should be further improved as the effect of surface tension will be much less. But surface tension is not the only factor involved, and the compliance curve flattens here, meaning a greater pressure is needed to achieve a volume change at high lung volumes. The low compliance at high lung volumes is caused by another phenomenon altogether. At high lung volumes expansion of the lung becomes limited by the elastic limit of the lung, a little like trying to further stretched an already stretch elastic band—it is harder to do.
So with surface tension causing problems at low lung volumes and tissue elastic limit causing problems at high lung volumes, the compliance curve is steepest (i.e., most favorable) in the middle, as mentioned before, which is the operating volume of the lung. These principles are summarized in figure 3.5.
Improving lung compliance with surfactant: So after that information on how surface tension is a problem for the lung, we now have to look at how it could be so much worse if the lung did not protect itself.
Despite it having an effect, particularly at low lung volumes, the lung actually reduces the effect of alveolar surface tension by releasing “surfactant,” a molecule that disrupts surface tension. In brief, the surfactant molecule (dipalmitoyl phosphatidylcholine) has a similar structure to the phospholipids that make up cell membranes with a hydrophobic end and a hydrophilic end, allowing it to surround water and repel it at the same time, thus breaking up the interaction between water molecules. So as surfactant significantly reduces surface tension, it thereby increases lung compliance and the risk of alveolar collapse. It also helps keep the air space dry, as excessive surface tension tends to draw water into the space from the capillaries and interstitial spaces.
Surfactant is released onto the alveolar inner surface by Type II alveolar cells (recall Type I cells are those making up the alveolar wall). Type II cells produce surfactant at a high rate and thus demand a constant and generous blood flow; therefore any condition that disrupts this blood supply will cause surfactant concentrations to decline and therefore put the alveolus at risk of collapse as surface tension is allowed to increase.
A good illustration of the effect of surfactant is respiratory distress syndrome of the newborn. The underdeveloped lungs of infants born prematurely (at about twenty-eight weeks), cannot produce sufficient surfactant. Alveoli rapidly collapse (known as atelectasis), and pulmonary edema develops because of the excessive surface tension in the alveolar walls.
References, Resources, and Further Reading
Text
Levitsky, Michael G. “Chapter 2: Mechanics of Breathing.” In Pulmonary Physiology, 9th ed. New York: McGraw Hill Education, 2018.
West, John B. “Chapter 7: Mechanics of Breathing—How the Lung Is Supported and Moved.” In Respiratory Physiology: The Essentials, 9th ed. Philadelphia: Wolters Kluwer Health/Lippincott Williams and Wilkins, 2012.
Widdicombe, John G., and Andrew S. Davis. “Chapter 2.” In Respiratory Physiology. Baltimore: University Park Press, 1983.
Figures
Figure 3.1: Lung volumes detected by spirometry. Grey, Kindred. 2022. CC BY 4.0. https://archive.org/details/3.1_20220125/mode/1up
Figure 3.2: Changes in breathing tidal volume and respiratory rate with increasing levels of exercise. Grey, Kindred. 2022. CC BY 4.0. https://archive.org/details/3.2_20220125/mode/1up
Figure 3.3: Lung compliance curve. Grey, Kindred. 2022. CC BY 4.0. https://archive.org/details/3.3_20220125/mode/1up
Figure 3.4: Opposing forces of alveolar pressure and surface tension. Grey, Kindred. 2022. CC BY 4.0. https://archive.org/details/3.4_20220125/mode/1up
Figure 3.5: Summary of lung volumes and compliance. Grey, Kindred. 2022. CC BY 4.0. https://archive.org/details/3.5_20220125/mode/1up
