9 Pulmonary Blood Flow
Learning objectives
- Differentiate between the pulmonary and systemic circulations with respect to: total flow rate, blood volume, vascular compliance, vascular pressures, total vascular resistance, and response to hypoxia.
- Differentiate among zones 1, 2, 3, and 4 in the lung with respect to the relationship among pulmonary vascular pressures (arterial and venous), airway pressure, and patterns of pulmonary blood flow.
The Pulmonary Vasculature
The primary role of the pulmonary circulation is to achieve gas exchange with the airspaces. Sufficient perfusion of this circulation is as essential to gas exchange as sufficient ventilation of the alveoli. Because of this role, and the fact that pulmonary vessels are exposed to airway and alveolar pressures the pulmonary circulation has some unique characteristics that are covered in this chapter.
Functional anatomy
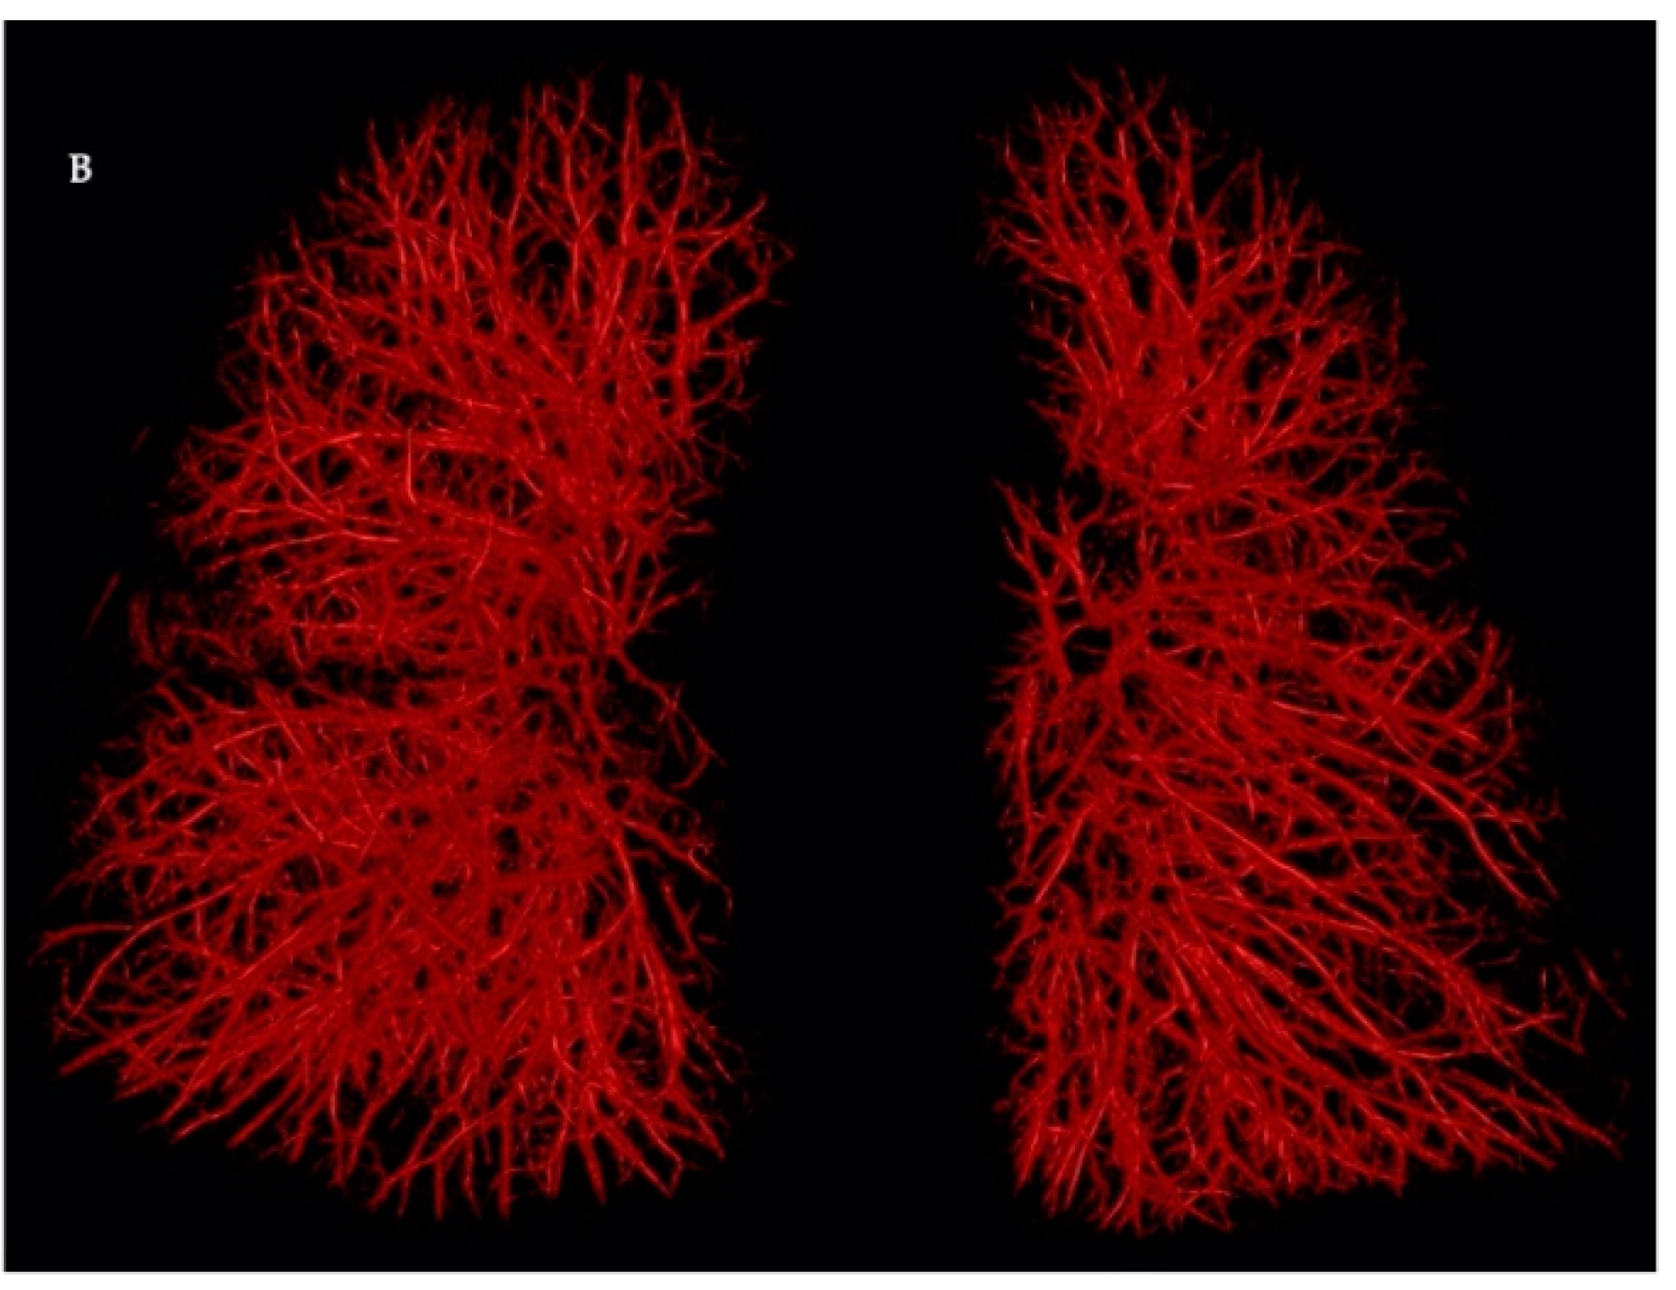
The pulmonary circulation takes all cardiac output from the right heart via the pulmonary arteries. Thus, even at rest it has a tremendous blood flow – about 5 liters per minute, just the same as the systemic circulation. This volume enters a vast array of vessels that penetrate all the lung structure – so much so that the complete lung structure is visible from the cast of the pulmonary vasculature in figure 9.1.
Main arteries follow a similar branching pattern to the bronchial tree until the terminal bronchioles are reached. This anatomical arrangement allows perfusion to follow the ventilation. Upon reaching the terminal bronchioles the vessels divide into a vast array of capillaries that wrap around the respiratory ducts and alveoli to form the respiratory zone of the lungs.
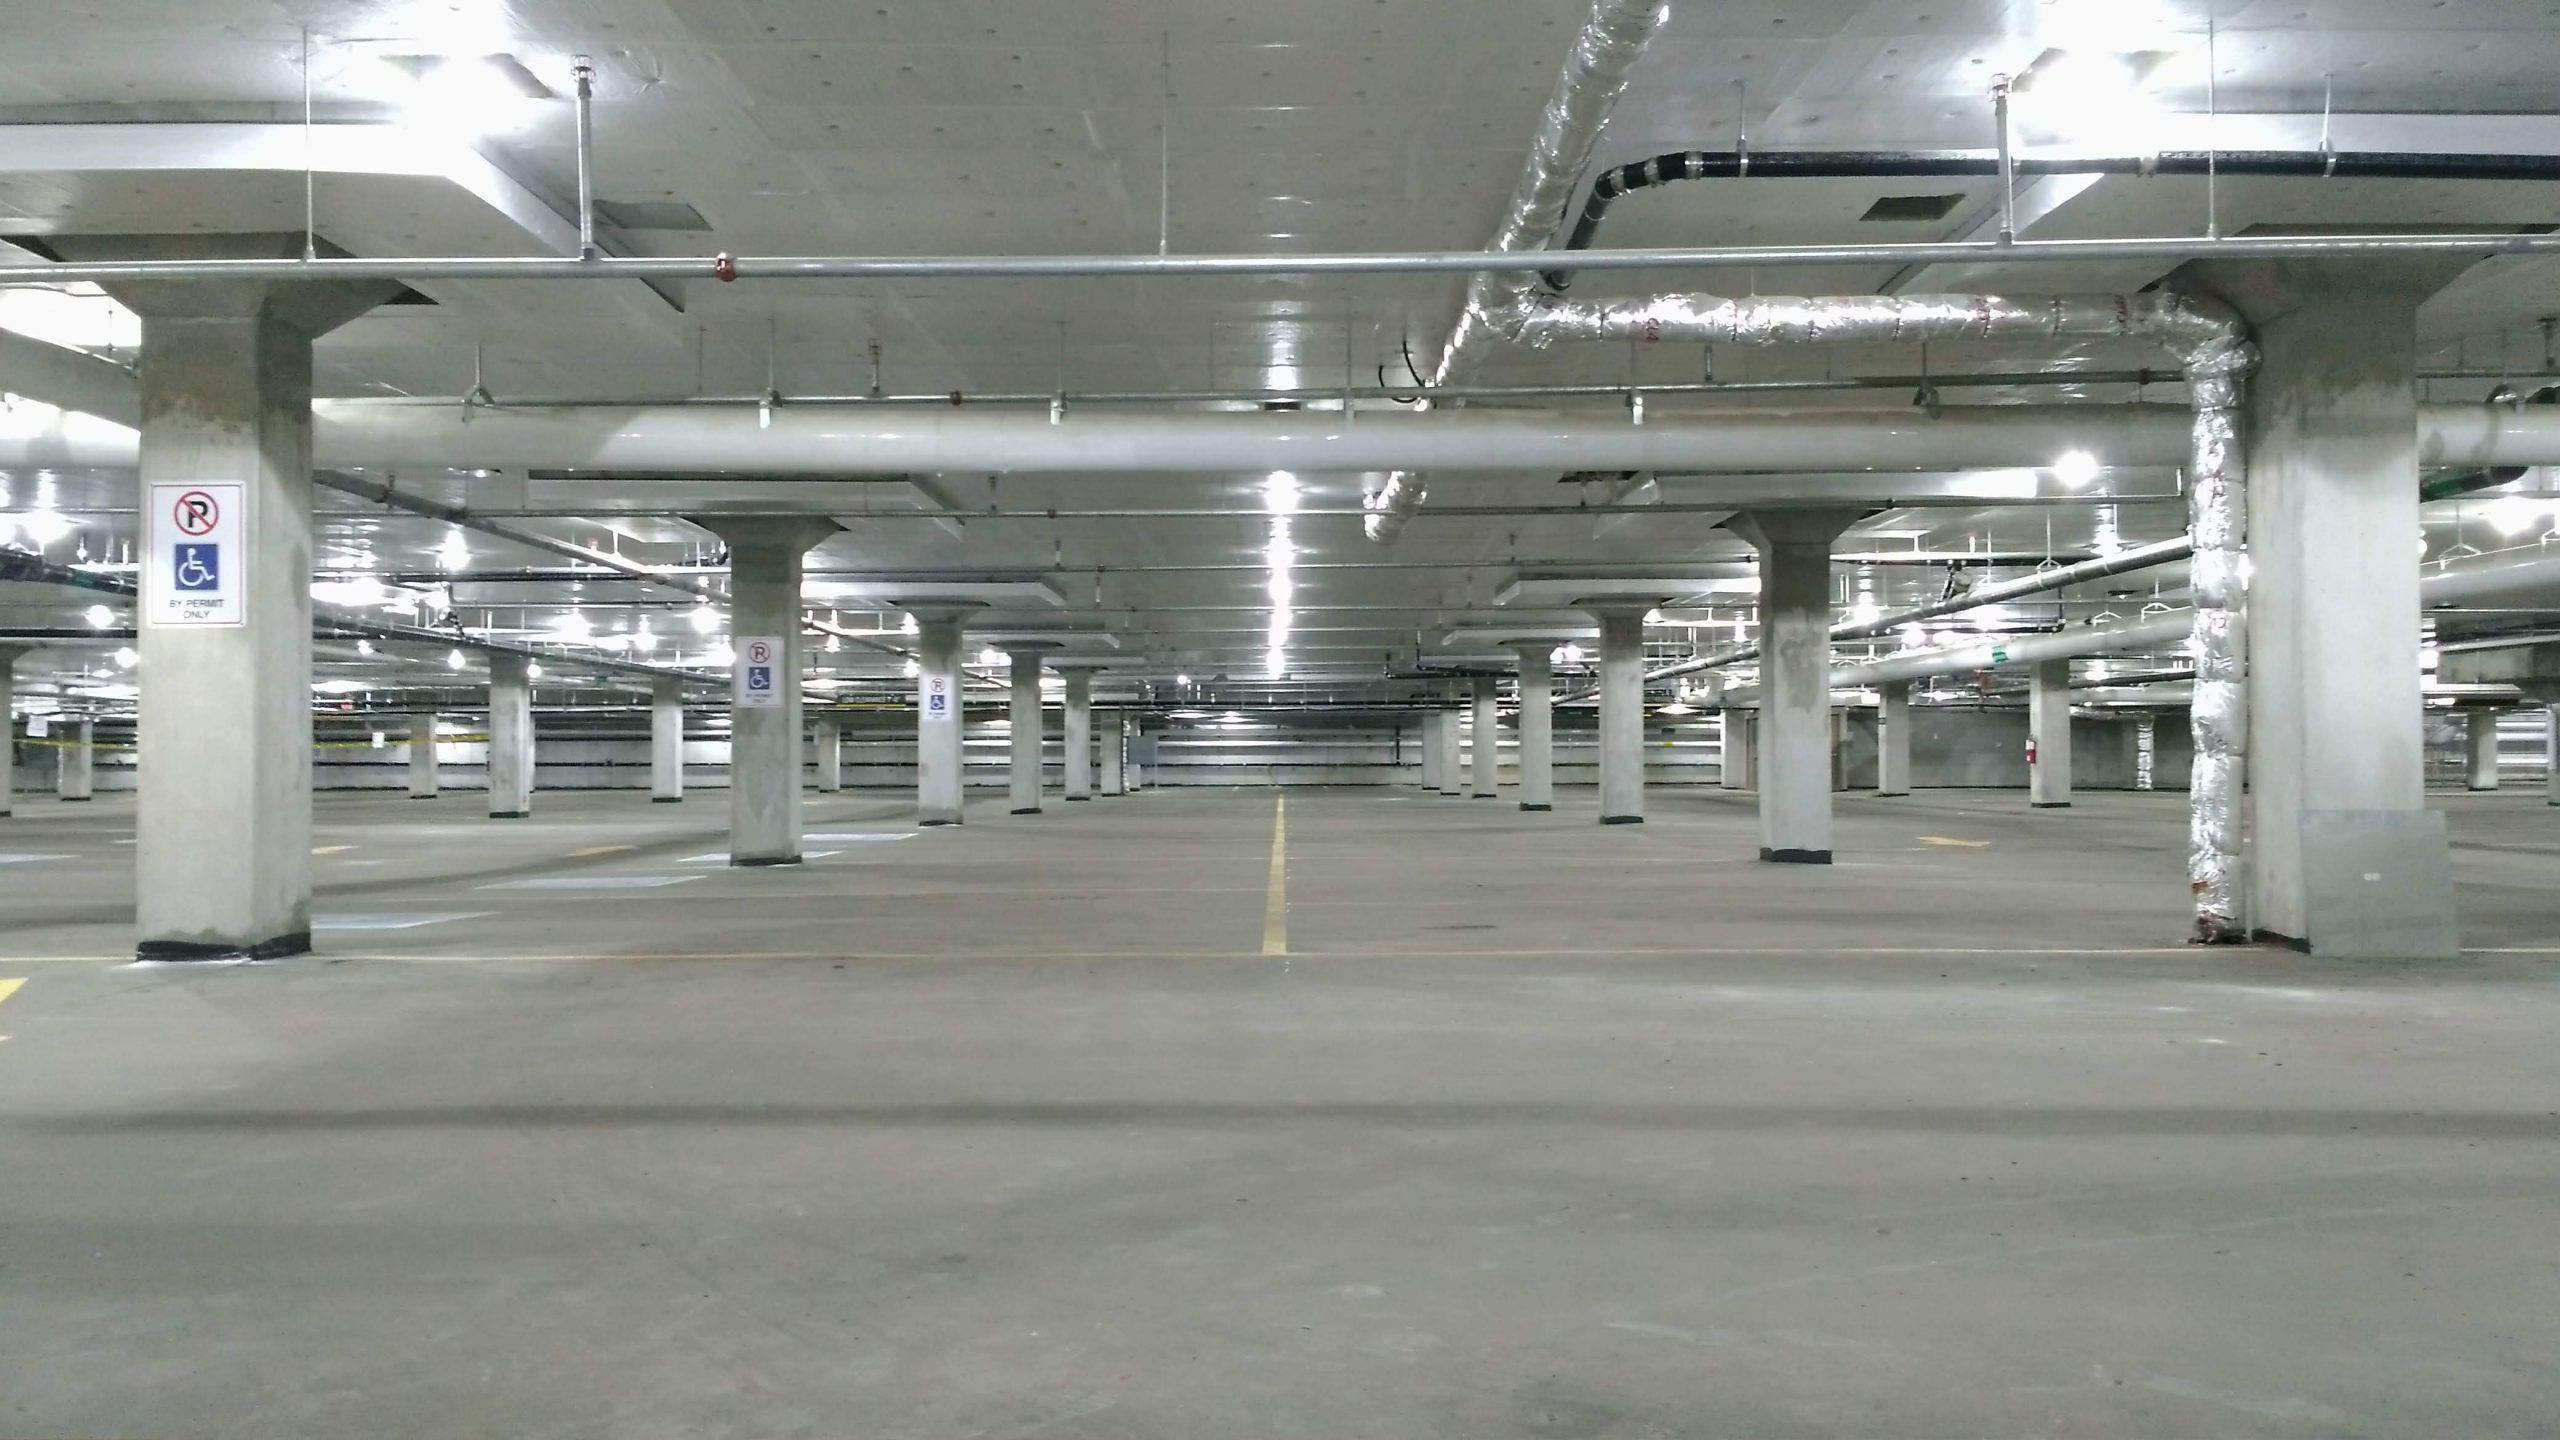
The density of the capillary beds is so great that individual capillaries can loose their distinct anatomy as can be seen in this electron micrograph where the capillaries are seen to form more sheet-like structures around where the alveoli would be. A common analogy for this is the capillaries look more like a floor of a parking garage with pillars for support but mainly open space – rather (figure 9.3) than the distinct tubes seen in other circulations.
The capillary beds converge into small veins after traveling over the alveolar surfaces, and these small veins then collect into four pulmonary veins that lead back to the left heart. This is an unusual example of veins carrying blood with arterial gas pressures.
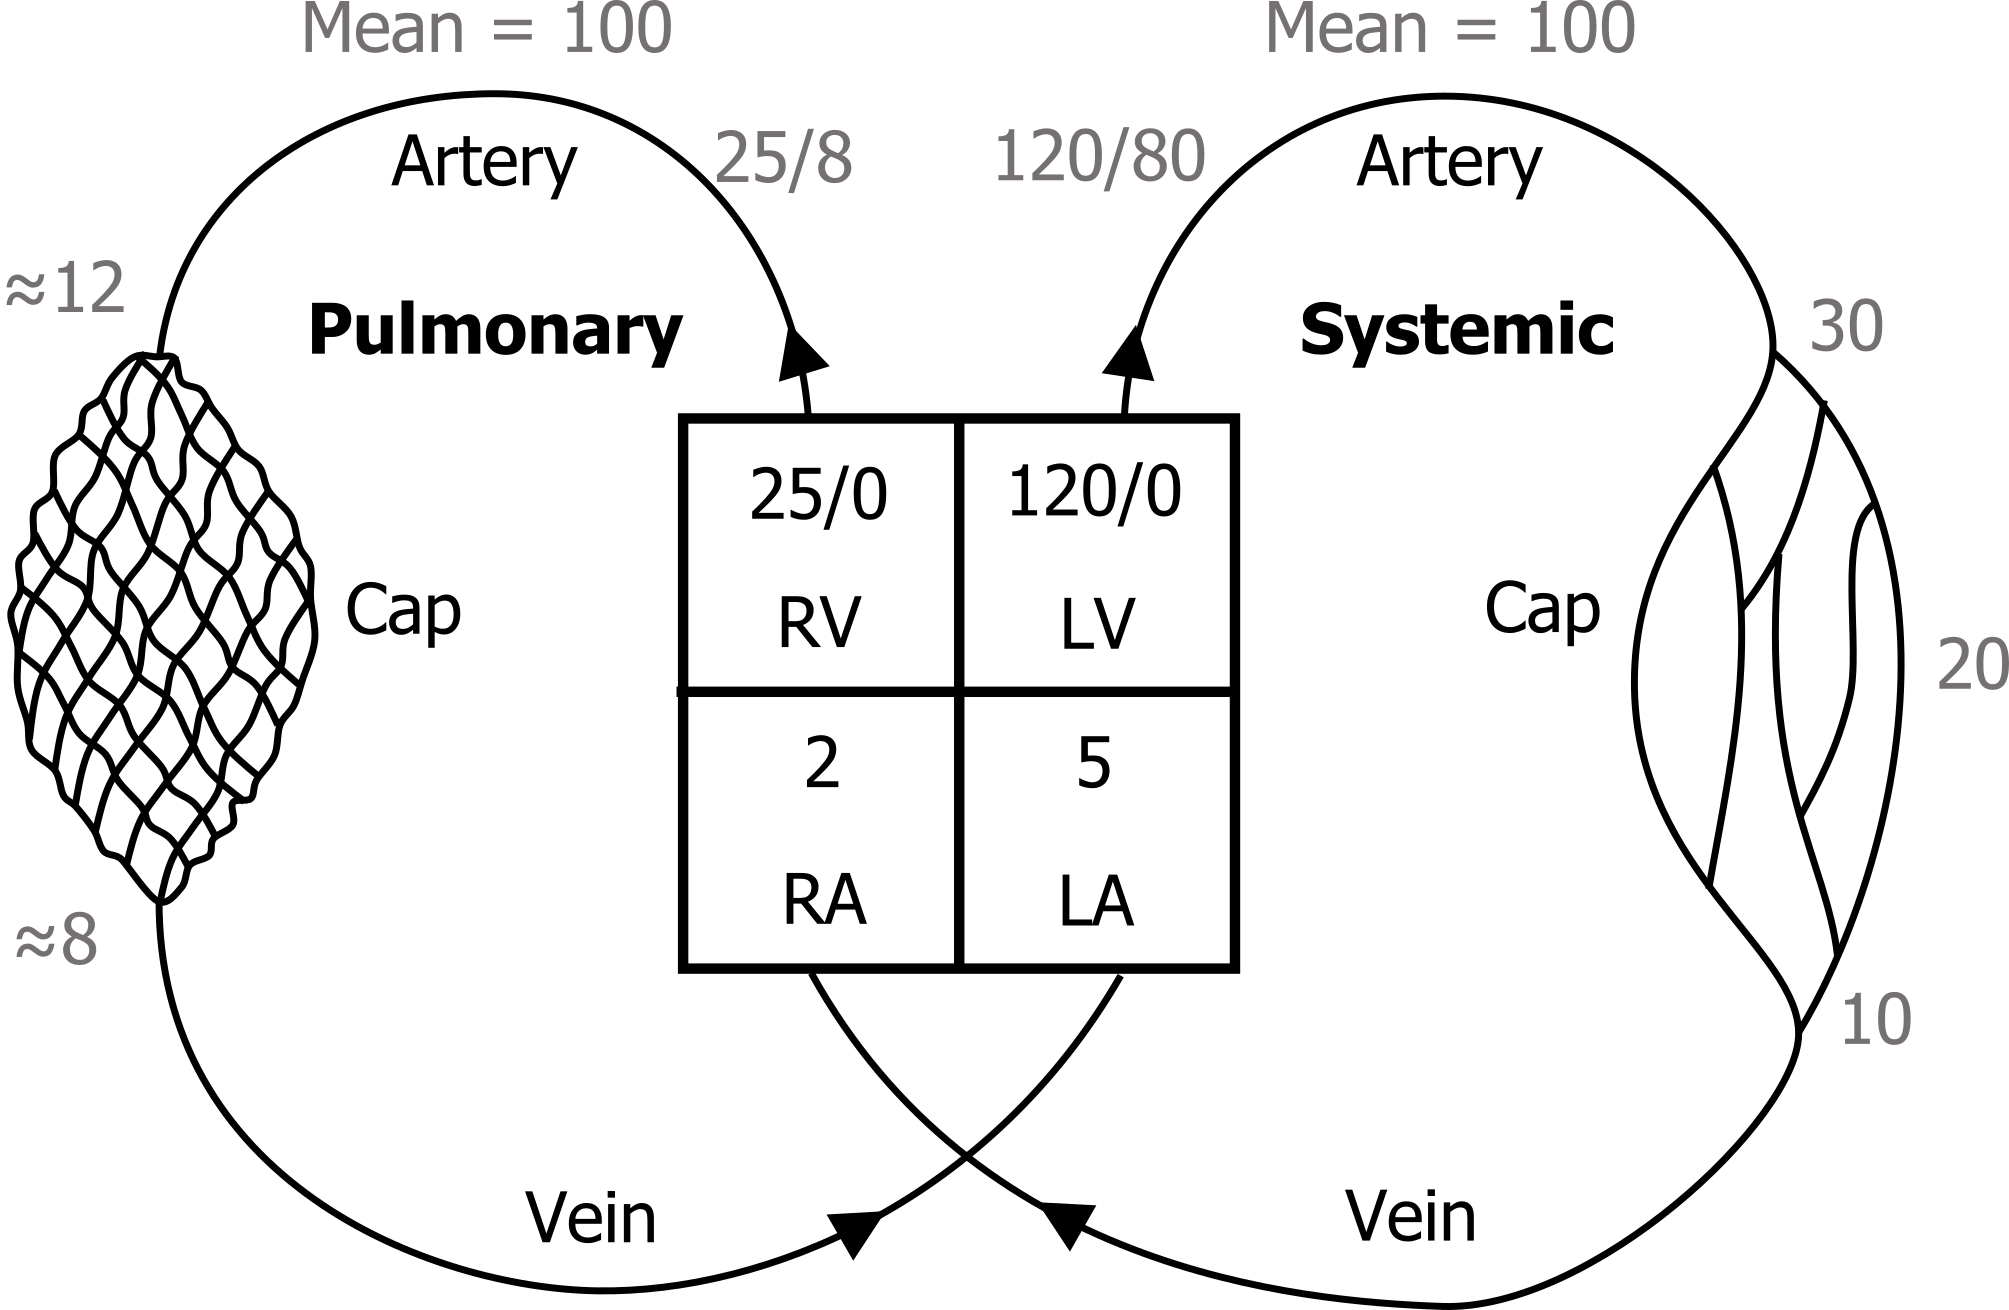
Despite receiving the same blood volume per minute as the systemic circulation the pulmonary circulation is a low-pressure system. Systolic pressure is normally only 25 mmHg, compared to 120 in the systemic circulation, diastolic is 8, compared to 80 and mean pulmonary artery pressure is only 15. These numbers are well worth remembering.
So how can this one circulation receive so much volume (the complete cardiac output) and yet remain at such low pressure? The first reason is the vast size of the capillary beds. As figure 9.4 suggests, the much higher density of pulmonary capillary beds than that seen in the systemic circulation allows pressure to dissipate much more quickly.
The pulmonary arteries show different characteristic to their systemic counterparts as well. The walls of a pulmonary arterioles are thin compared to systemic arterioles. They also lack the smooth muscle layer seen in the systemic arteriole. In fact pulmonary arterioles look much more like systemic veins and they are often mistaken for such in biopsy or dissection. With little smooth muscle it’s clear that these vessels have little role in controlling the distribution of blood flow – a vital role of their systemic counterparts. As the pulmonary circulation receives all cardiac output, all the time, such precise control isn’t required.
The thin walls and lack of smooth muscle also make the pulmonary arterioles highly compliant and so they behave much more like veins in their pressure response – extending when pressure increases. This gives the pulmonary arteriole system a rather unique pressure-resistance relationship that we’ll look at in a moment.
This low pressure and compliant system also means that the right heart has much less work to perform to generate its output. In fact the right ventricle has about a tenth of the work of the left heart to move exactly the same blood volume. Hence the structure and work capacity of the right heart is so much smaller than the left – something worth bearing in mind if disease causes changes in the pulmonary vasculature that in turn causes the less substantial right heart to work harder and undergo hypertrophy
Pulmonary Vascular Resistance, Lung Volume, and Gravity
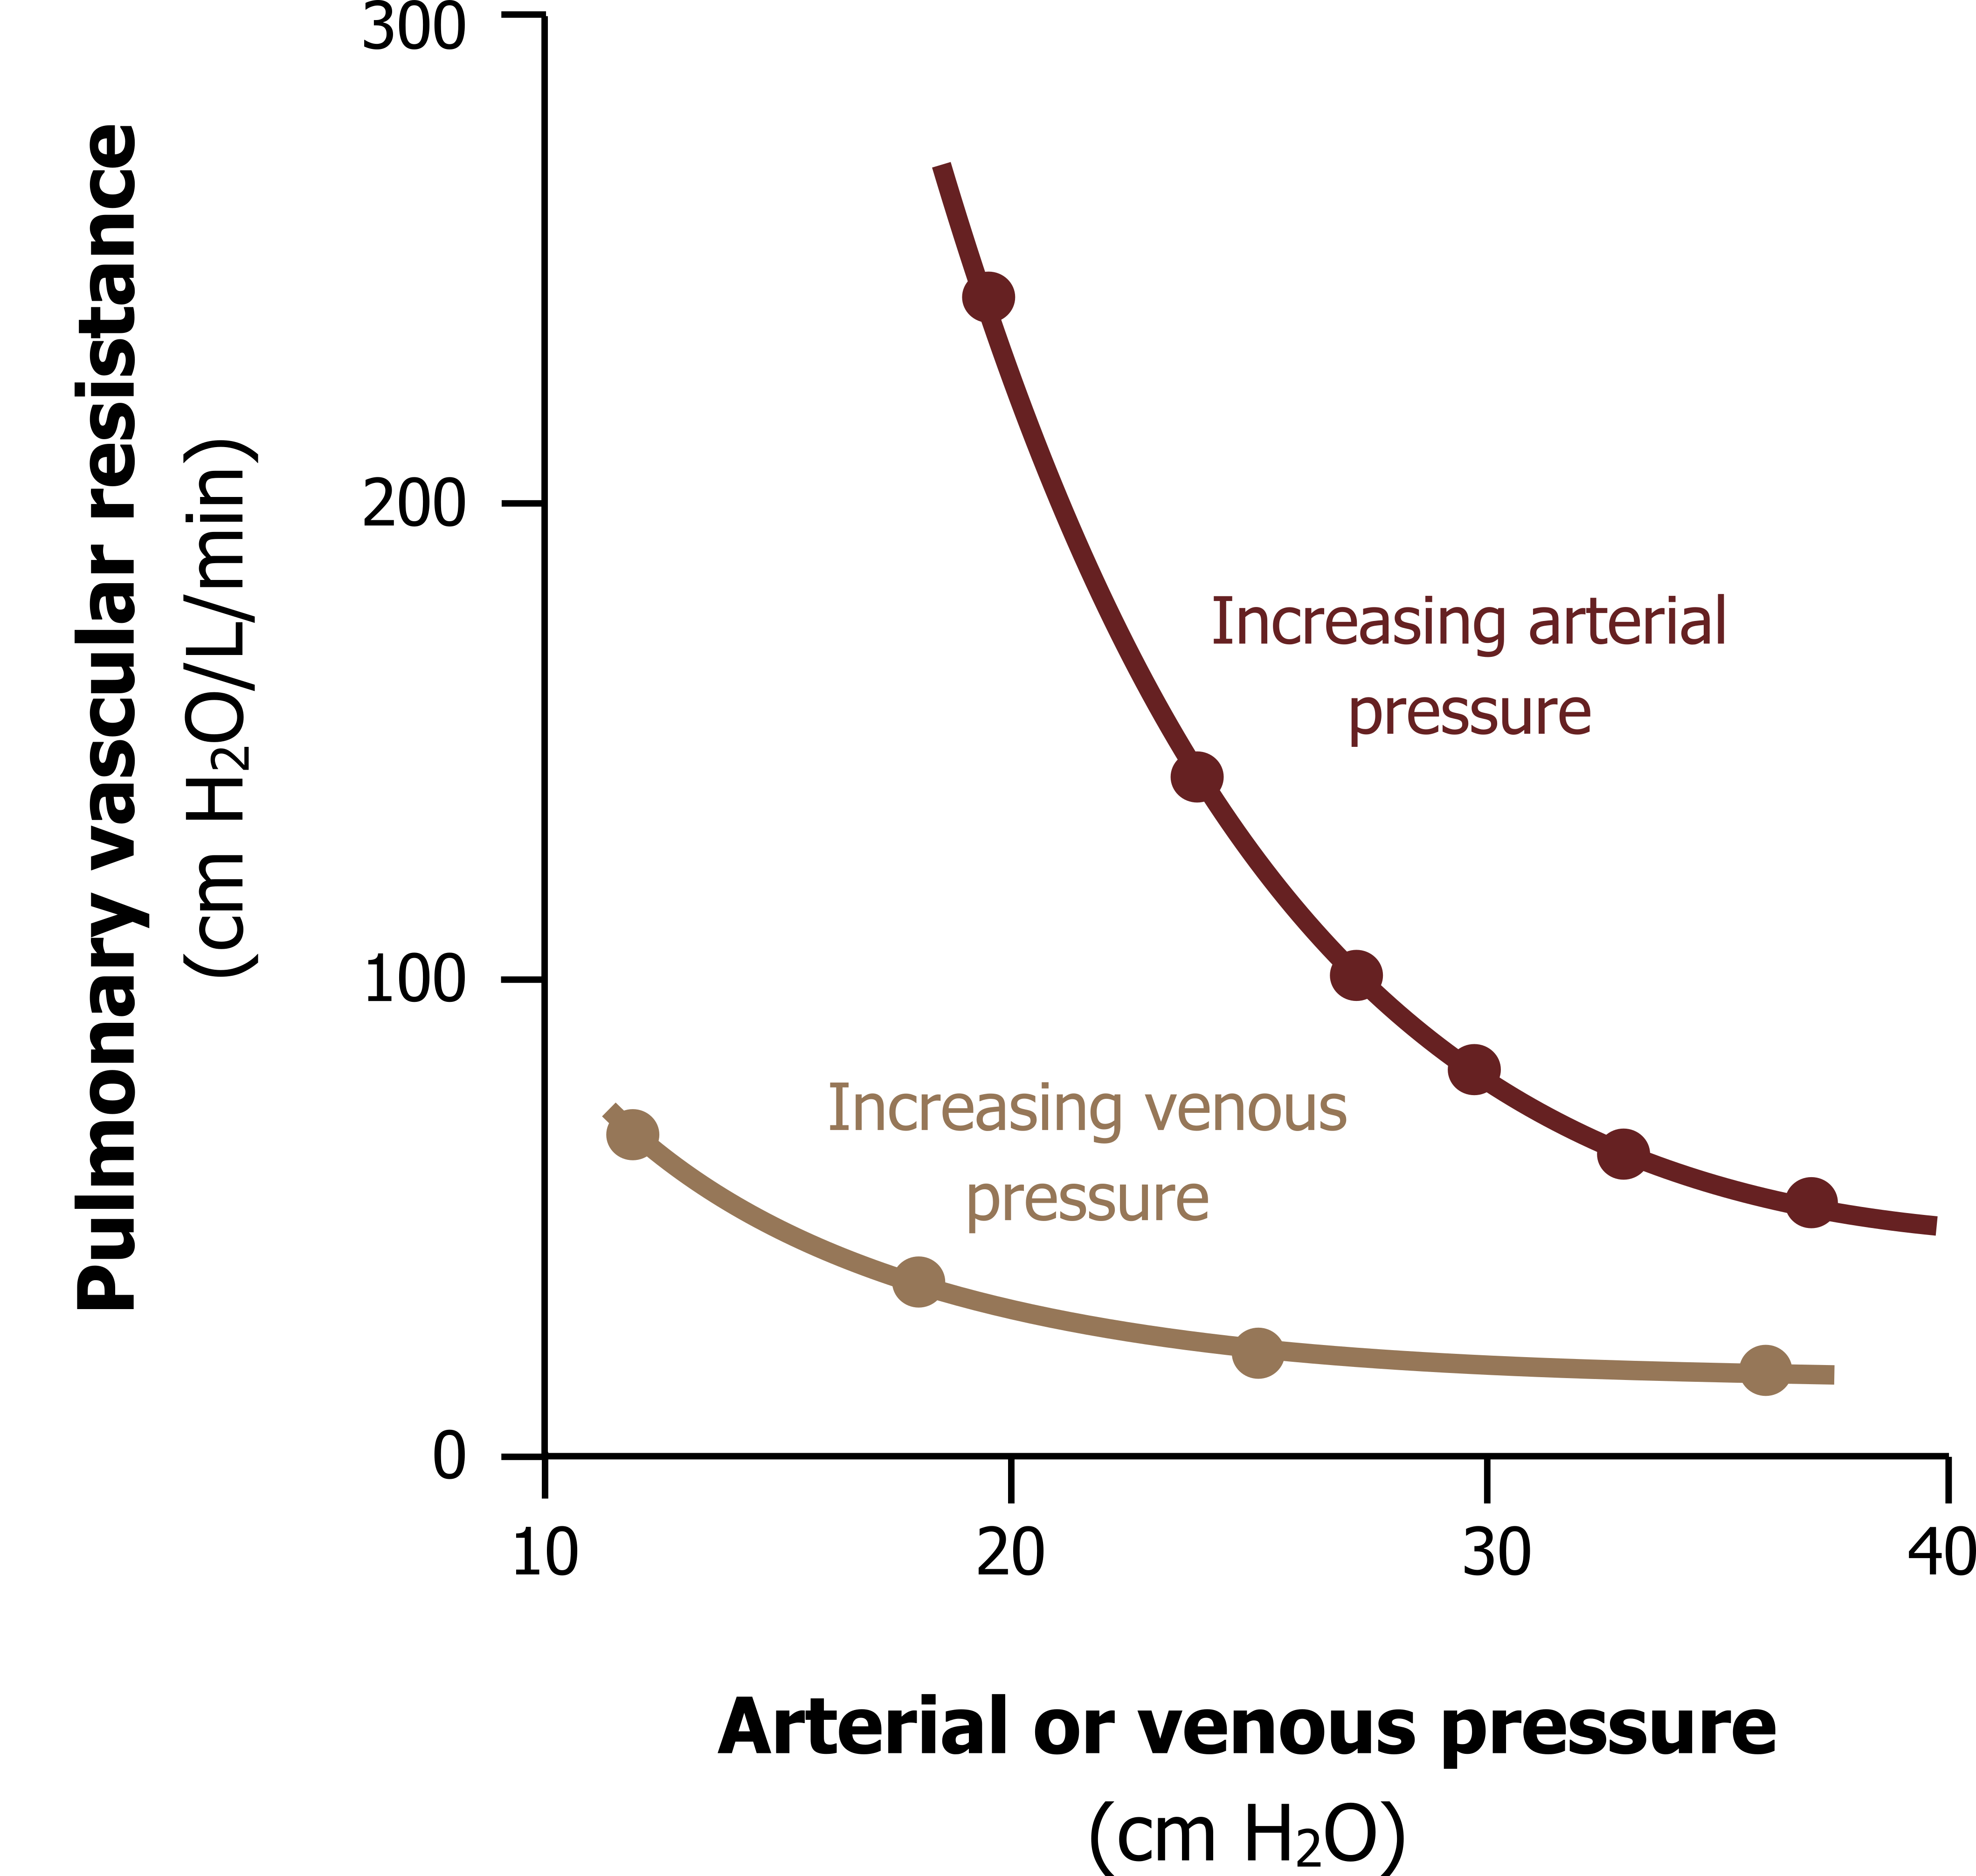
As we have just seen, with little smooth muscle and a compliant wall, the arterioles act more like veins. As pulmonary arterial pressure rises, the resistance of the pulmonary circulation falls, as seen in figure 9.4, and this occurs for several reasons.
Unlike systemic arterioles there is little autoregulation by the pulmonary arterioles, so the pulmonary arterioles do not actively vasoconstrict when stretched by high pressure. Instead, they passively distend, thereby reducing their resistance with increasing resistance.
A rise in pulmonary pressure not only distends vessels but initiates flow through otherwise unused, or dormant, vessels, particularly those closer to the apex of the lung (we will see why later on). With more vessels recruited, the total cross-sectional area of used vessels increases and total resistance falls.
But there are other and more complex peculiarities of the pulmonary circulation that determine its resistance…
Pulmonary Vascular Resistance and Radial Traction
Another unique characteristic of the pulmonary circulation is that it is exposed to the changing pressures in the airways and alveoli. It is also involved in the fiber network that generates radial traction. Consequently pulmonary vessels can be expanded or compressed in a way no other circulation is.
To explain these phenomena we have to divide the pulmonary circulation into two subdivisions, the alveolar vessels and the extra-alveolar vessels (figure 9.5). These two vessel types behave differently, so we will deal with them separately.
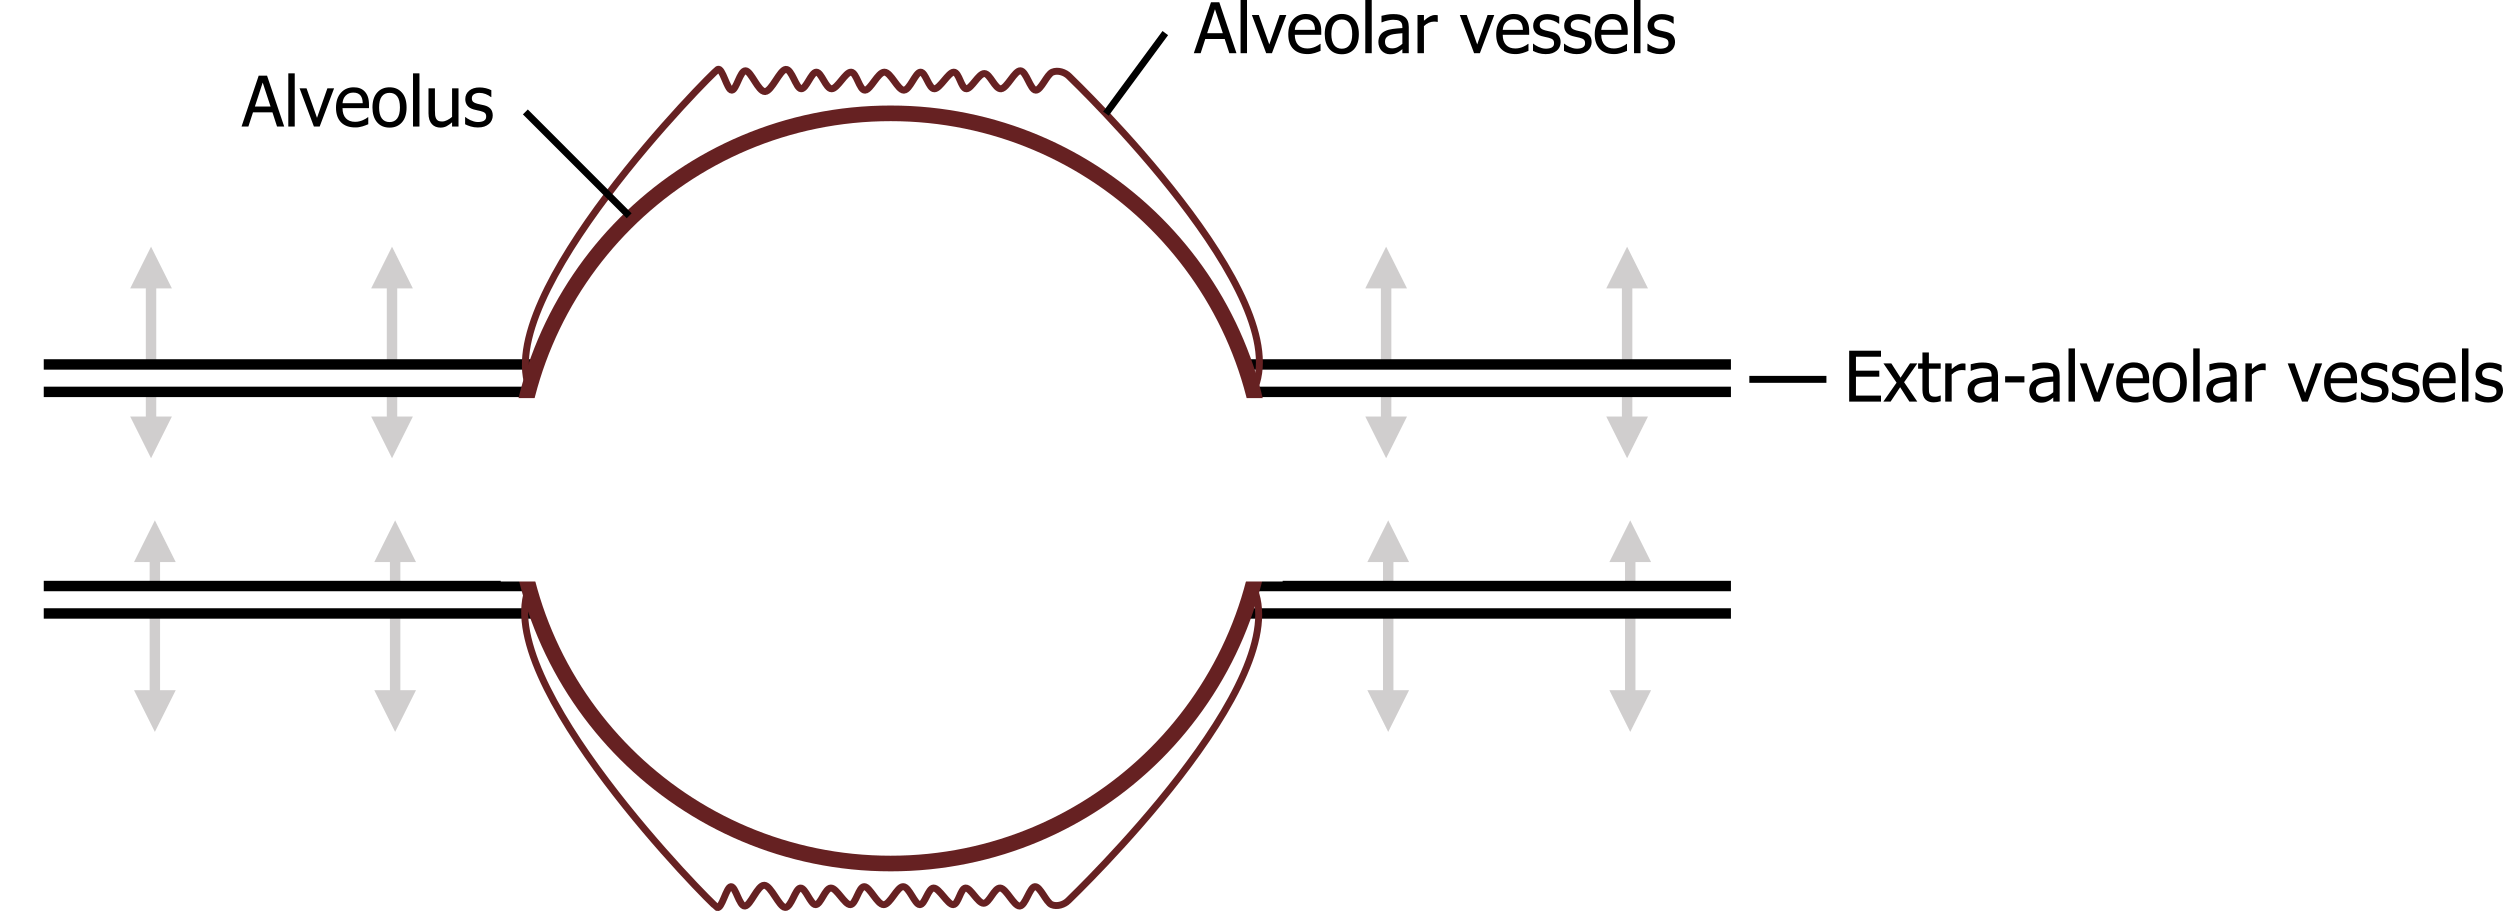
Alveolar vessels: These are primarily the capillaries and small vessels in close contact with the alveoli. Consequently they are exposed to the alveolar pressures. First, the surface tension within the alveolus that is tending to pull the alveolus closed also pulls on the vessels between alveoli, tending to pull it open as neighboring alveoli pull inward on themselves, and play tug-of-war with the vessel walls in between, extending them and causing a decrease in vascular resistance.
Alternatively, when alveolar pressure increases (e.g., at high lung volumes), the raised alveolar pressure can compress the vessels running over its surface, causing an increase in vascular resistance.
Extra-alveolar vessels: By definition these vessels are not in contact with the alveoli, so they are not exposed to the same alveolar forces. These are exposed to the intrapleural forces, however, so as we saw airways opening during inspiration when intra-pleural pressure falls, these extra-alveolar vessels are also pulled open during inspiration by radial traction, and their resistance consequently falls as lung volume increases.
The summation of these forces (alveolar pressure, surface tension, and radial traction) means that pulmonary vasculature resistance has a complex relationship with lung volume.
Pulmonary Vascular Resistance and Lung Volume
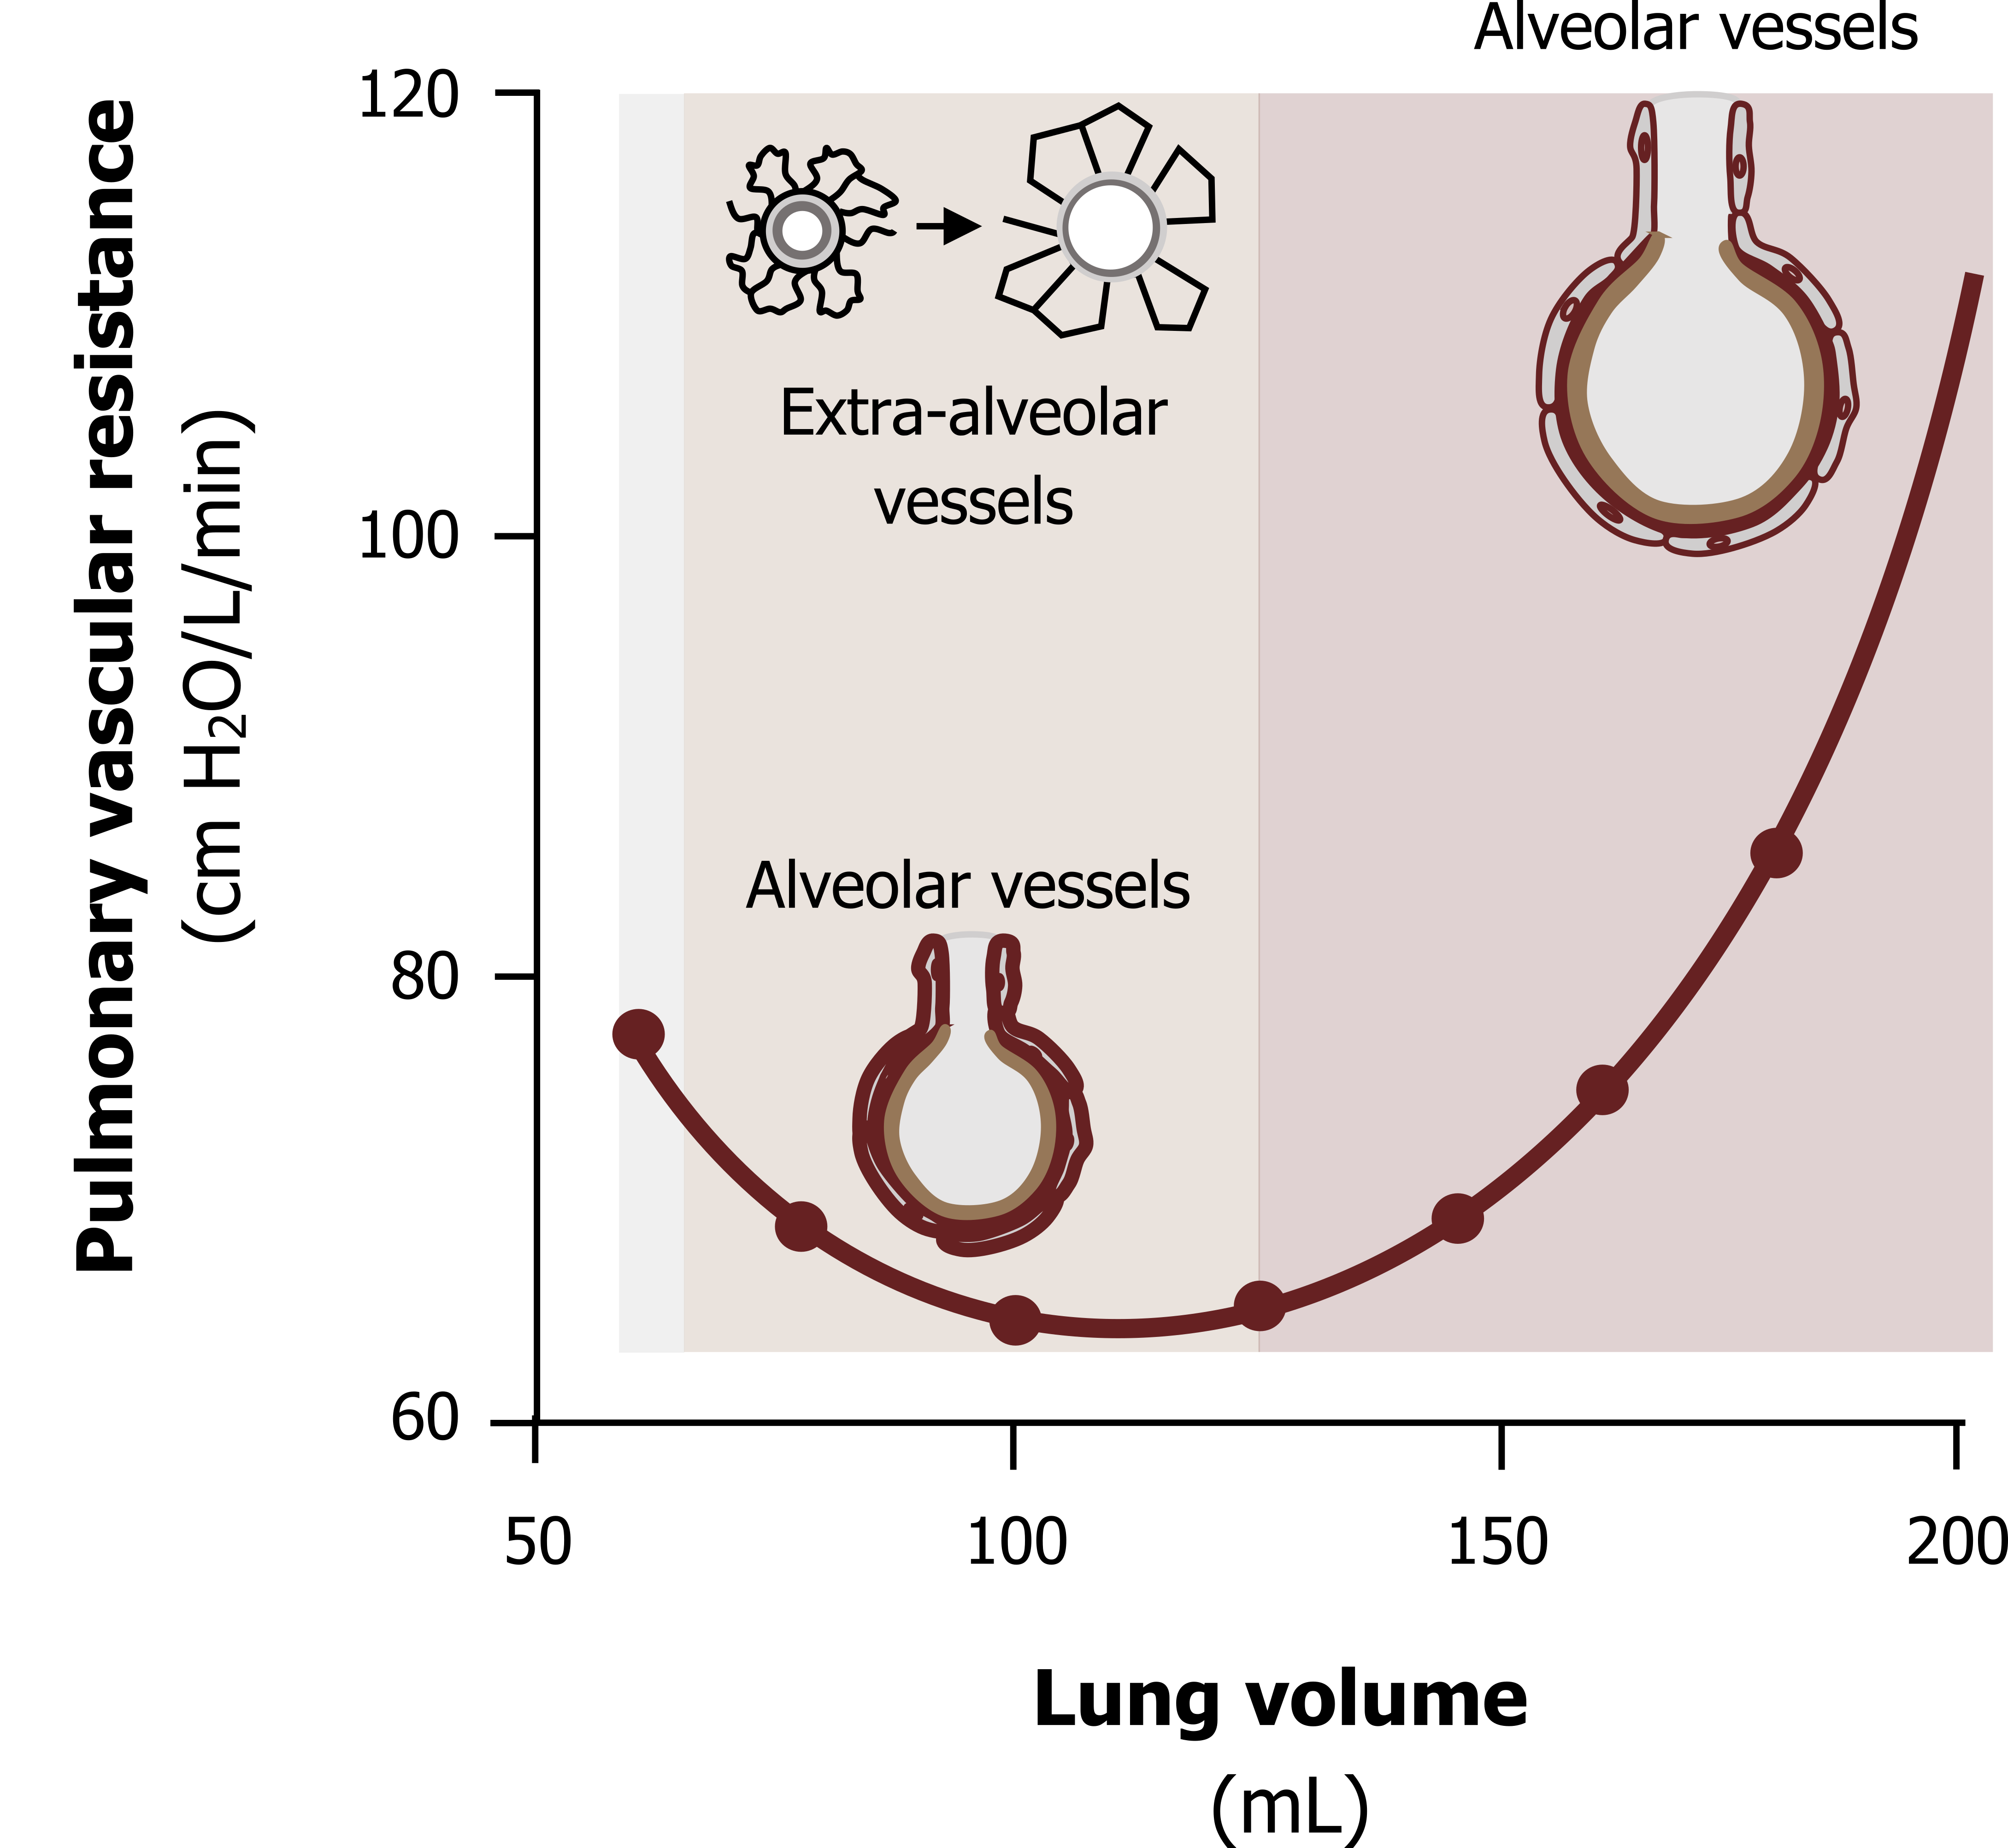
Figure 9.6 shows vascular resistance changing with increasing lung volume. At low and high lung volumes vascular resistance is increased, while it is lower at medium lung volumes. Several forces are at play here, so let us take low lung volumes first.
Vascular resistance at low lung volumes: At low lung volumes (figure 9.6, gray zone on the left), you should know that intra-pleural pressure is less negative because the lung recoil is less. With less negative pressure to hold open the extra-alveolar vessels via radial traction, these tend to narrow and vasculature resistance becomes relatively high.
Vascular resistance at medium lung volumes: As lung volume increases (figure 9.6, tan zone in the middle), the intrapleural pressure becomes more negative. Radial or parenchymal traction now begins to pull the extra-alveolar vessels open, and as they become wider, vascular resistance falls. Common sense would tell you that this effect would increase with continually larger lung volumes, and one might expect that vascular resistance would continue to decrease as lung volume increased. But this is evidently not the case.
Vascular resistance at high lung volumes: With further increases in lung volume (figure 9.6, pink zone on the right), vascular resistance rises. At high lung volumes the alveoli are enlarging, and this causes the capillaries running around them to stretch. As the capillaries stretch, they narrow—a little like how a piece of latex tubing narrows when it is stretched. This narrowing of a large number of capillaries overcomes the radial traction effect on the extra-alveolar vessels, and there is a net increase in vascular resistance.
So vascular resistance and lung volume are related with an inverted bell-shaped relationship. Now let us look at the forces that determine the distribution of blood flow across the lung structure.
Pulmonary Blood Flow and Gravity
You may recall that gravity affected the distribution of ventilation by generating the gradient of intrapleural pressures down the lung—most negative at the apex, less negative at the base.
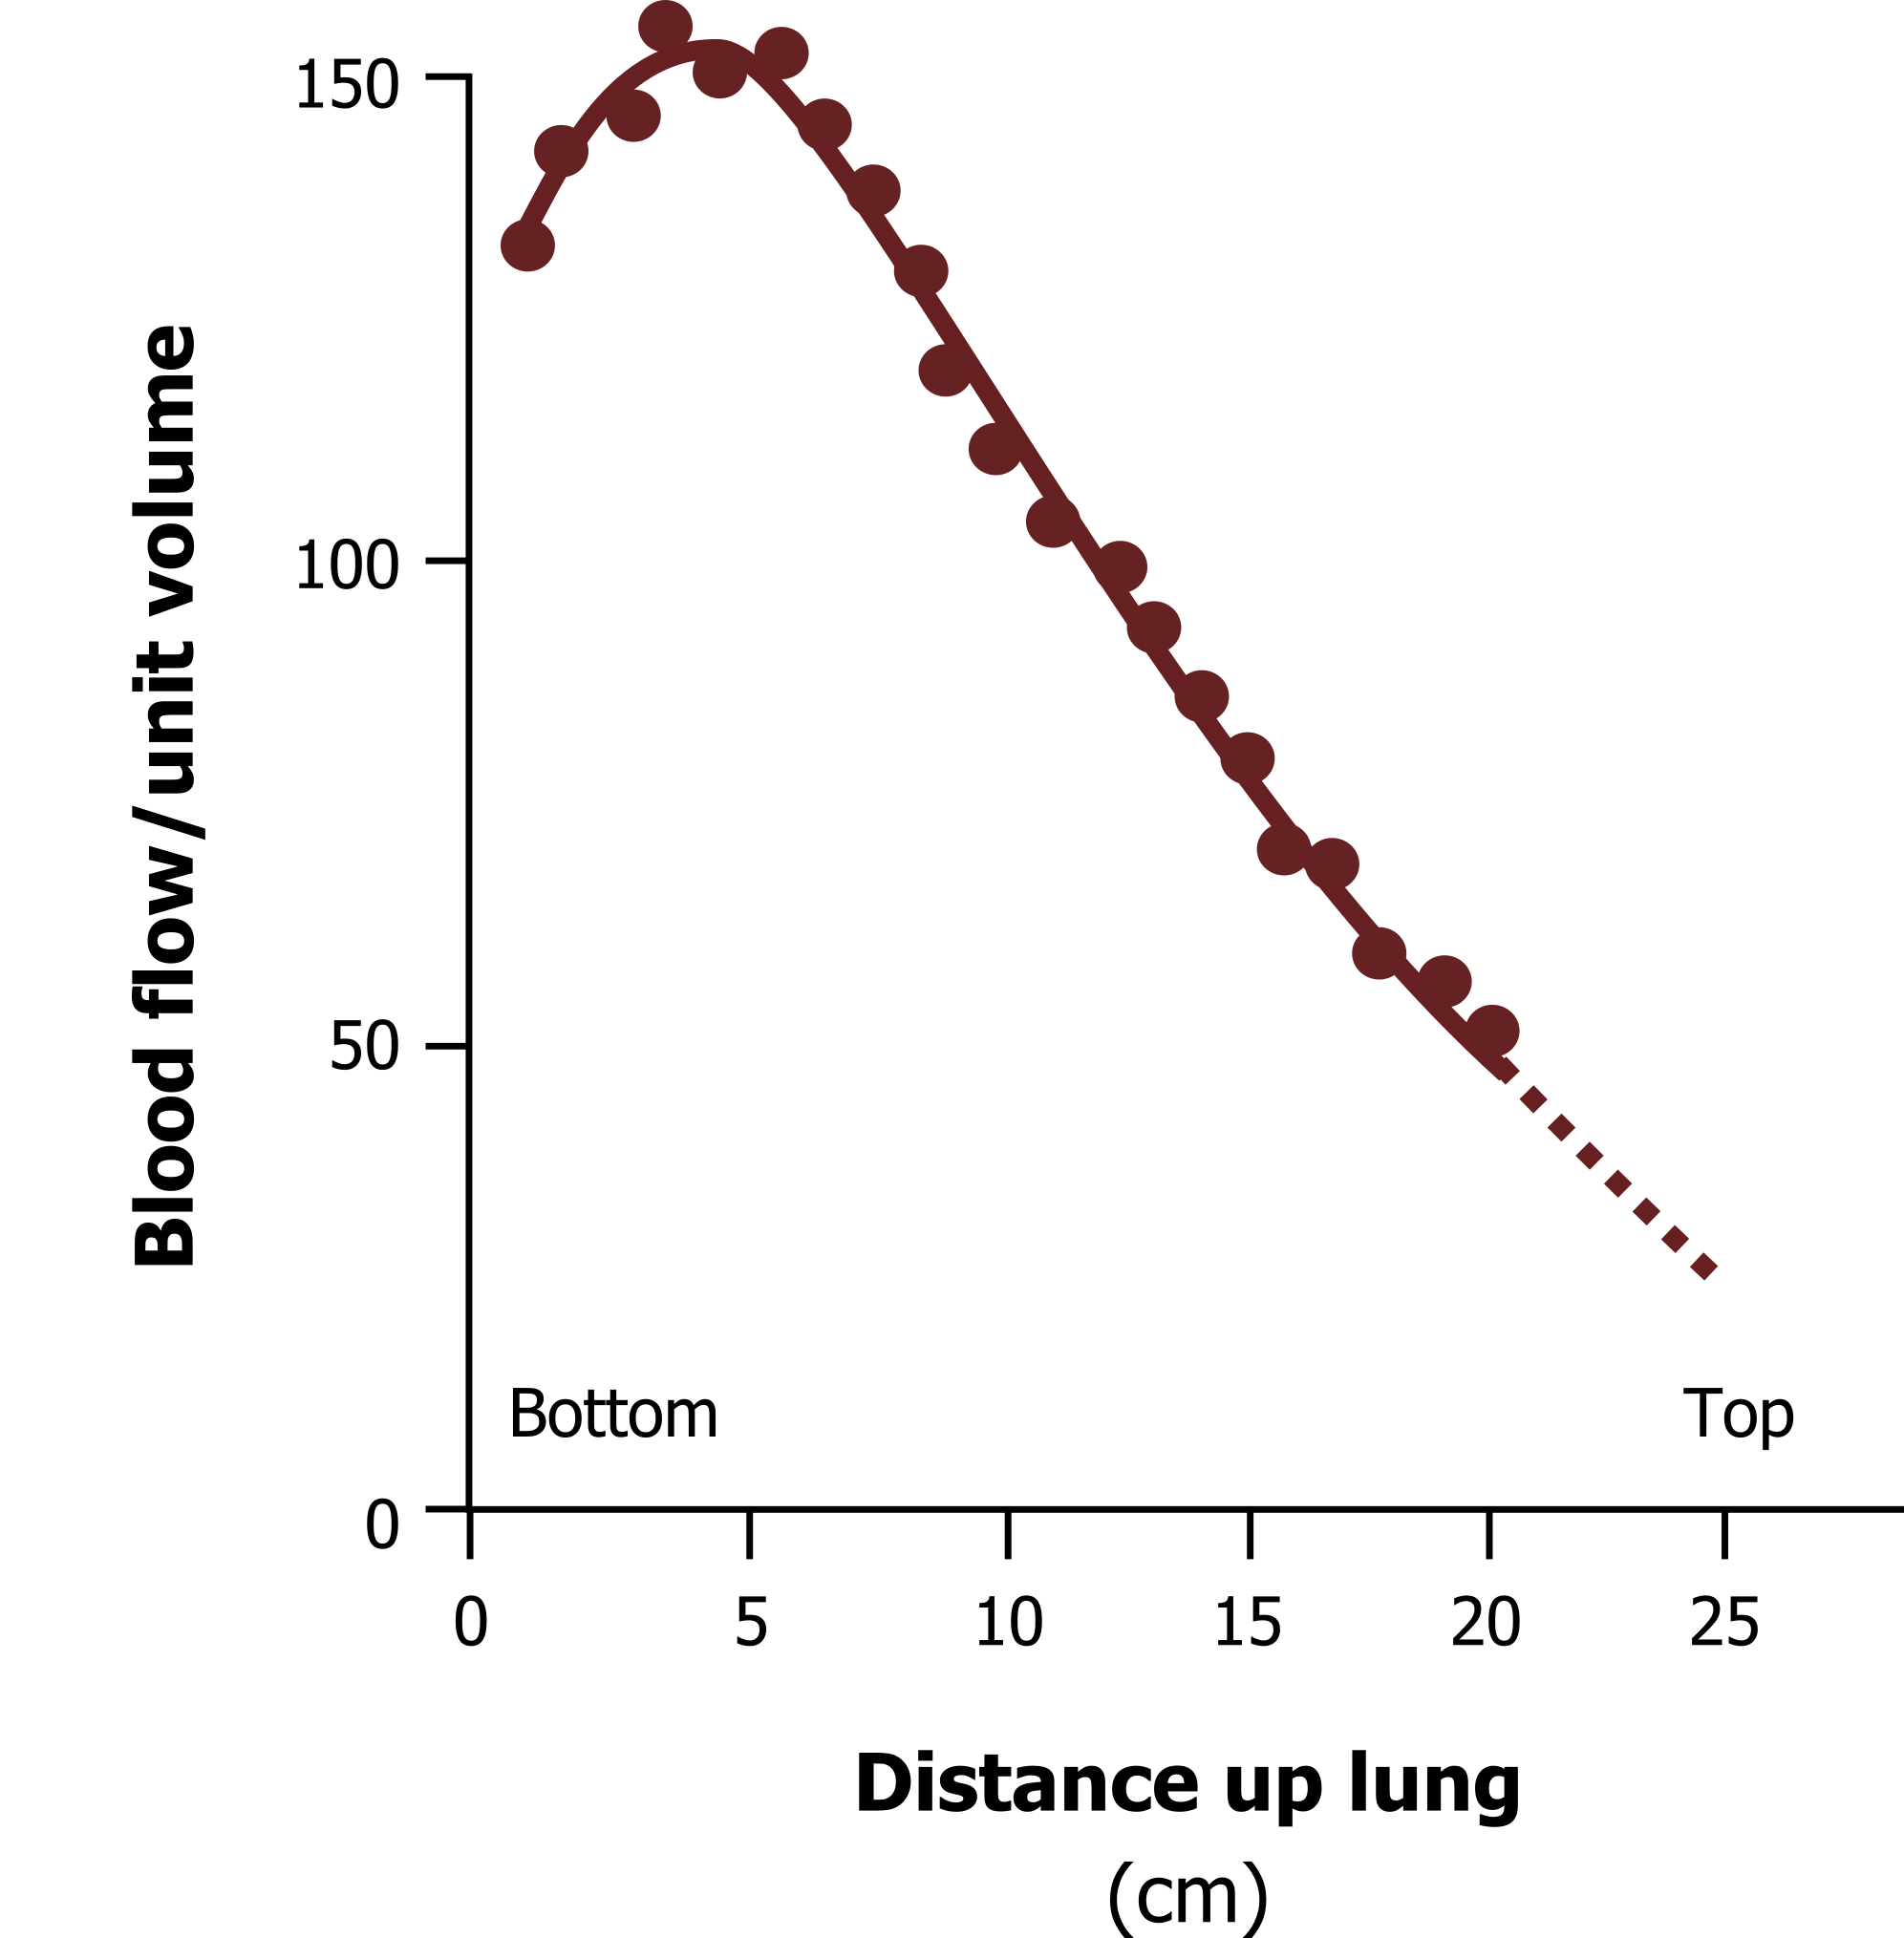
We see a similar distribution of blood flow in the lung as well, as figure 9.7 shows with blood flow being greater at the base of the lung than it is at the apex. Again this is simply due to gravity. Gravity pushes against the blood rising from heart level, hence the base is better perfused than the apex. Because of this, gravity is responsible for matching the level of perfusion and ventilation up the lung; both are high at the bottom, and both are low at the apex. This is advantageous, as well ventilated areas need more perfusion for efficient gas exchange, and likewise there is little point in sending large amounts of pulmonary blood to poorly ventilated areas. The relationship between ventilation and perfusion (known as the V/Q ratio) that gravity establishes is not quite ideal, however, and we will see the ramifications of this less-than-perfect relationship later on. There are also other forces affecting the distribution of perfusion as well, and we can look at them now.
Zones of Perfusion
We now have to consider the relationship of the pressures in these three systems, arterial, alveolar and venous, at different heights of the lung. Many of the following principles have already been dealt with, but we can put them together to look at how they affect perfusion distribution.
Figure 9.8 shows a schematic of the lung as the arterial vessels (tan, as they carry deoxygenated blood, of course) pass alveoli at different heights in the lung. The venous system (maroon) carries oxygenated blood away. For convenience we divide the lung into zones where the relationship between these pressures changes. So we will start at the apex of the lung in zone 1.
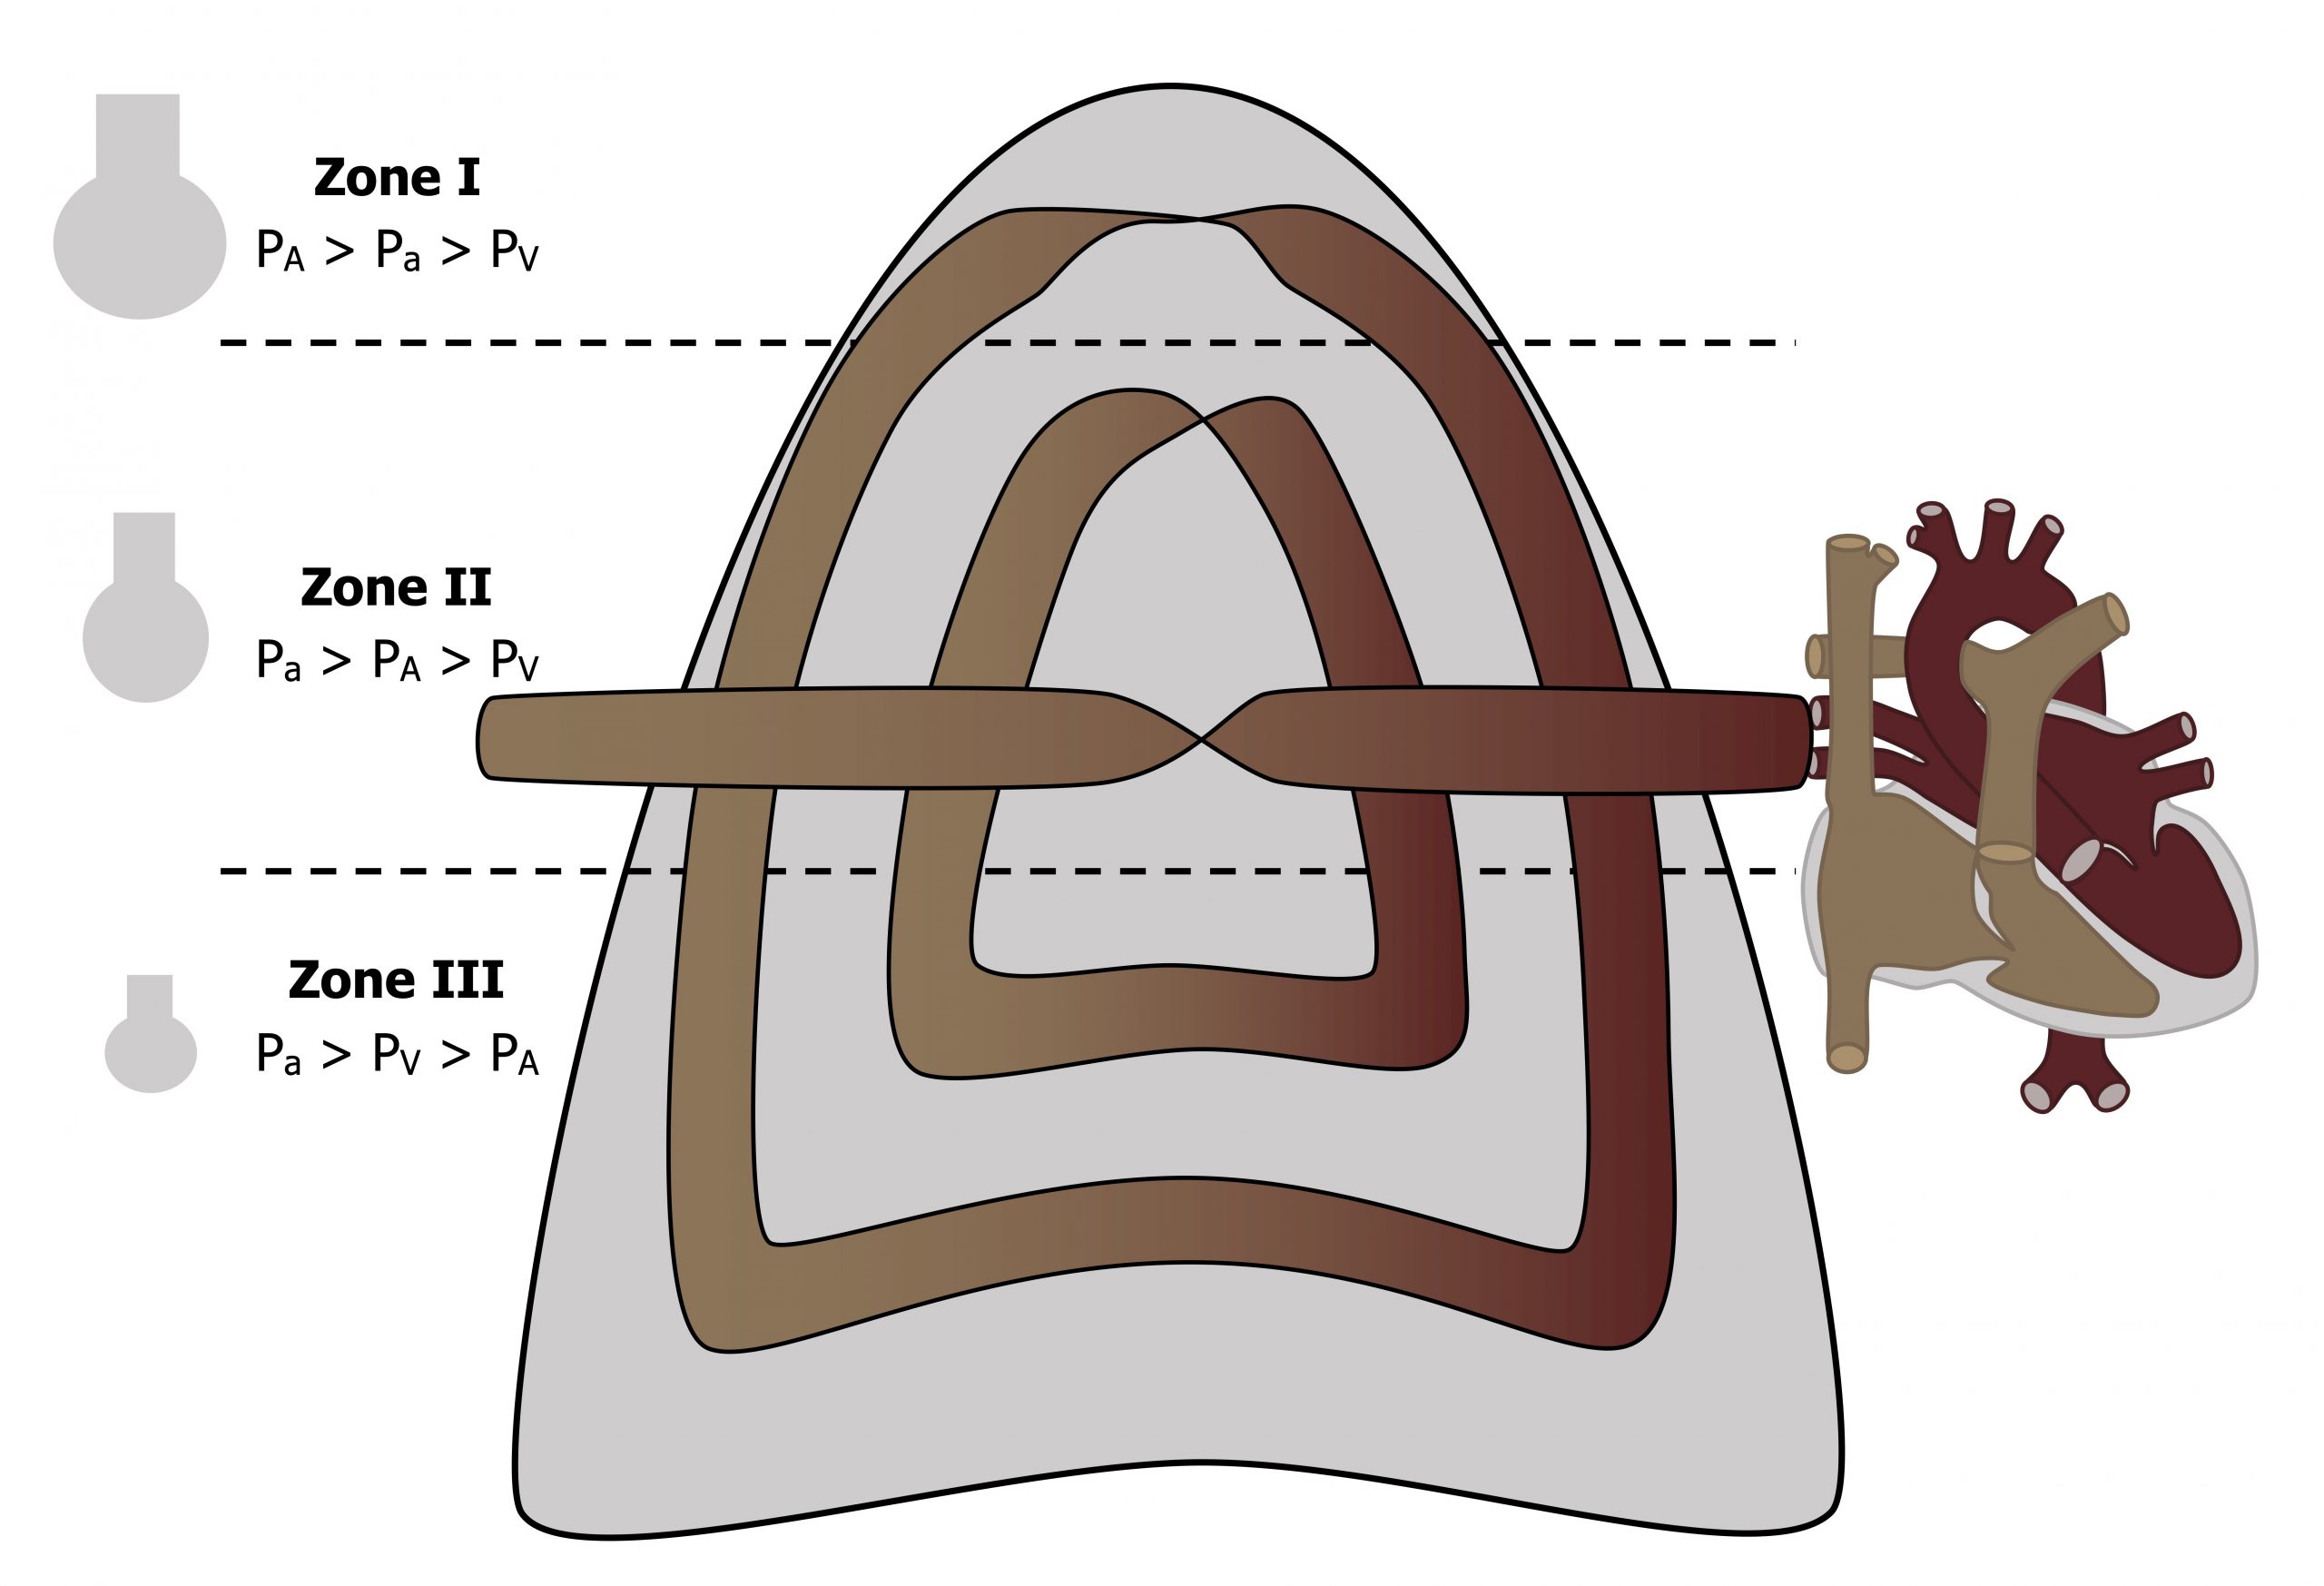
Zone 1: At the top of the lung the arterial pressure is relatively low because this is the furthest vertical distance from the heart. In the same zone, as you know, the alveoli here are extended by the low (more negative) intrapleural pressure at the apex. These extended alveoli tend to compress the surrounding capillaries, and the lack of arterial pressure to push past the extended alveolus means blood flow through capillary beds in zone 1 may be relatively low. It is certainly a pronounced effect in patients undergoing positive pressure ventilation where alveolar pressure may exceed arterial pressure and stop blood flow at the apex altogether. This phenomenon of ventilated but underperfused alveoli is referred to as alveolar dead space, as without adequate perfusion, gas exchange is compromised.
Zone 2: In zone 2 we are lower down the lung, and at this point arterial pressure is higher (closer proximity to the heart) and the alveoli are less extended, but venous pressure remains less than alveolar pressure. So flow in zone 2 is determined by the difference between arterial and alveolar pressures.
Zone 3: Dropping further down the lung to the base, the arterial and venous pressure have both risen as the column of fluid (blood) above them is greater at this point, and now both are above the now smaller alveolar pressure (near the base the intrapleural pressure is less negative). Consequently the flow through the capillary bed in zone 3 is determined by the arterial–venous pressure difference, just as it is in the systemic circulation.
(There can at times be a fourth zone, which appears only at low lung volumes. At low lung volumes tissue at the base of the lung can be compressed, and this compression can collapse the extra-alveolar vessels.)
Summary
So when considering flow through a systemic capillary bed we only have to think about the arterial and venous pressures, the pulmonary circulation throws us a curve ball by adding alveolar pressures into the mix that produce these perfusion zones.
Pulmonary Vasculature’s Response to Hypoxia

If systemic tissue becomes hypoxic then local arterioles open to allow more blood flow and increase oxygen delivery. The opposite is true for the pulmonary circulation where the response to local hypoxia is vasoconstriction.
First, remember that the bronchial circulation provides oxygen and nutrients to the pulmonary itself, and this behaves as all other systemic circulations. But the pulmonary circulation is for gas exchange. So if an area of the lung has become hypoxic (i.e., has a low oxygen partial pressure), this is indicative of that area having insufficient ventilation.
If there is little ventilation going to that area then there is little point sending perfusion to it. So the little smooth muscle there is in the pulmonary vasculature contracts to constrict the vessel when hypoxia is present. The blood follows the path of least resistance and thereby goes to vessels that are open (i.e., to areas where ventilation is maintaining a higher PO2).
Figure 9.9 shows that blood flow increases with increasing alveolar PO2, or more pertinently it decreases with decreasing alveolar PO2. This shunting of pulmonary blood away from unventilated (or hypoxic) areas helps maintain matching of ventilation and perfusion (or V/Q) and efficient gas exchange.
Summary
Because of its unique role in gas exchange, rather than supplying local tissue, and the pressures that are present in the lung beyond vasculature pressure, plus the different vasculature structure, the pulmonary circulation has some unusual characteristics. These produce unique blood flow patterns in response to lung volume, gravity, and the need to match ventilated areas with adequate perfusion.
References, Resources, and Further Reading
Text
Levitsky, Michael G. “Chapter 4: Blood Flow to the Lung.” In Pulmonary Physiology, 9th ed. New York: McGraw Hill Education, 2018.
West, John B. “Chapter 4: Blood Flow and Metabolism—How the Pulmonary Circulation Removes Gas from the Lung and Alters Some Metabolites.” In Respiratory Physiology: The Essentials, 9th ed. Philadelphia: Wolters Kluwer Health/Lippincott Williams and Wilkins, 2012.
Widdicombe, John G., and Andrew S. Davis. “Chapter 5.” In Respiratory Physiology. Baltimore: University Park Press, 1983.
Figures
Figure 9.1: The pulmonary circulation. Image courtesy of Dr Wei Liao, Imaging Solutions, Bayer AG Engineering & Technology, Computer Vision Innovation. 2020. Fair use. https://www.mdpi.com/2075-4418/10/12/1004/htm
Figure 9.2: A parking lot—a bit like pulmonary capillary structure. Leung, Enoch. 2018. CC BY-SA 2.0. https://flic.kr/p/28ci9r1
Figure 9.3: Schematic of the pulmonary and systemic circulations, comparing capillary densities and pressures. Grey, Kindred. 2022. CC BY 4.0. https://archive.org/details/9.4_20220125
Figure 9.4: Pulmonary vascular resistance decreases as pressure increases. Grey, Kindred. 2022. CC BY 4.0. https://archive.org/details/9.6_20220125
Figure 9.5: Pulmonary vessels can be categorized as alveolar or extra-alveolar. Grey, Kindred. 2022. CC BY 4.0. https://archive.org/details/9.7_20220125
Figure 9.6: The relationship between lung volume and pulmonary vascular resistance. Grey, Kindred. 2022. CC BY 4.0. https://archive.org/details/9.8_20220125
Figure 9.7: Perfusion distribution up the lung. Grey, Kindred. 2022. CC BY 4.0. https://archive.org/details/9.9_20220125
Figure 9.8: Relationships of alveolar, arterial, and venous pressures down the lung. Grey, Kindred. 2022. CC BY 4.0. https://archive.org/details/9.10_20220125
Figure 9.9: Changes in blood flow caused by vasoconstriction in response to pulmonary hypoxia. Grey, Kindred. 2022. CC BY 4.0. https://archive.org/details/9.11_20220125
