5 Airflow and Airway Resistance
Learning objectives
- Describe the factors that contribute to airway resistance.
- Describe the changes in airway resistance down the bronchial tree, with expanding lung volumes and induced by autonomic reflexes.
Fundamentals of Airflow
To generate flow in the airways, so far we have looked at how the pressure differential is generated and the factors affecting the compliance of the lung. Now we will look at the factors that cause resistance to airflow and how mechanical and neural influences affect it.
The first factor we must consider when thinking about airflow is the type of flow that is occurring.
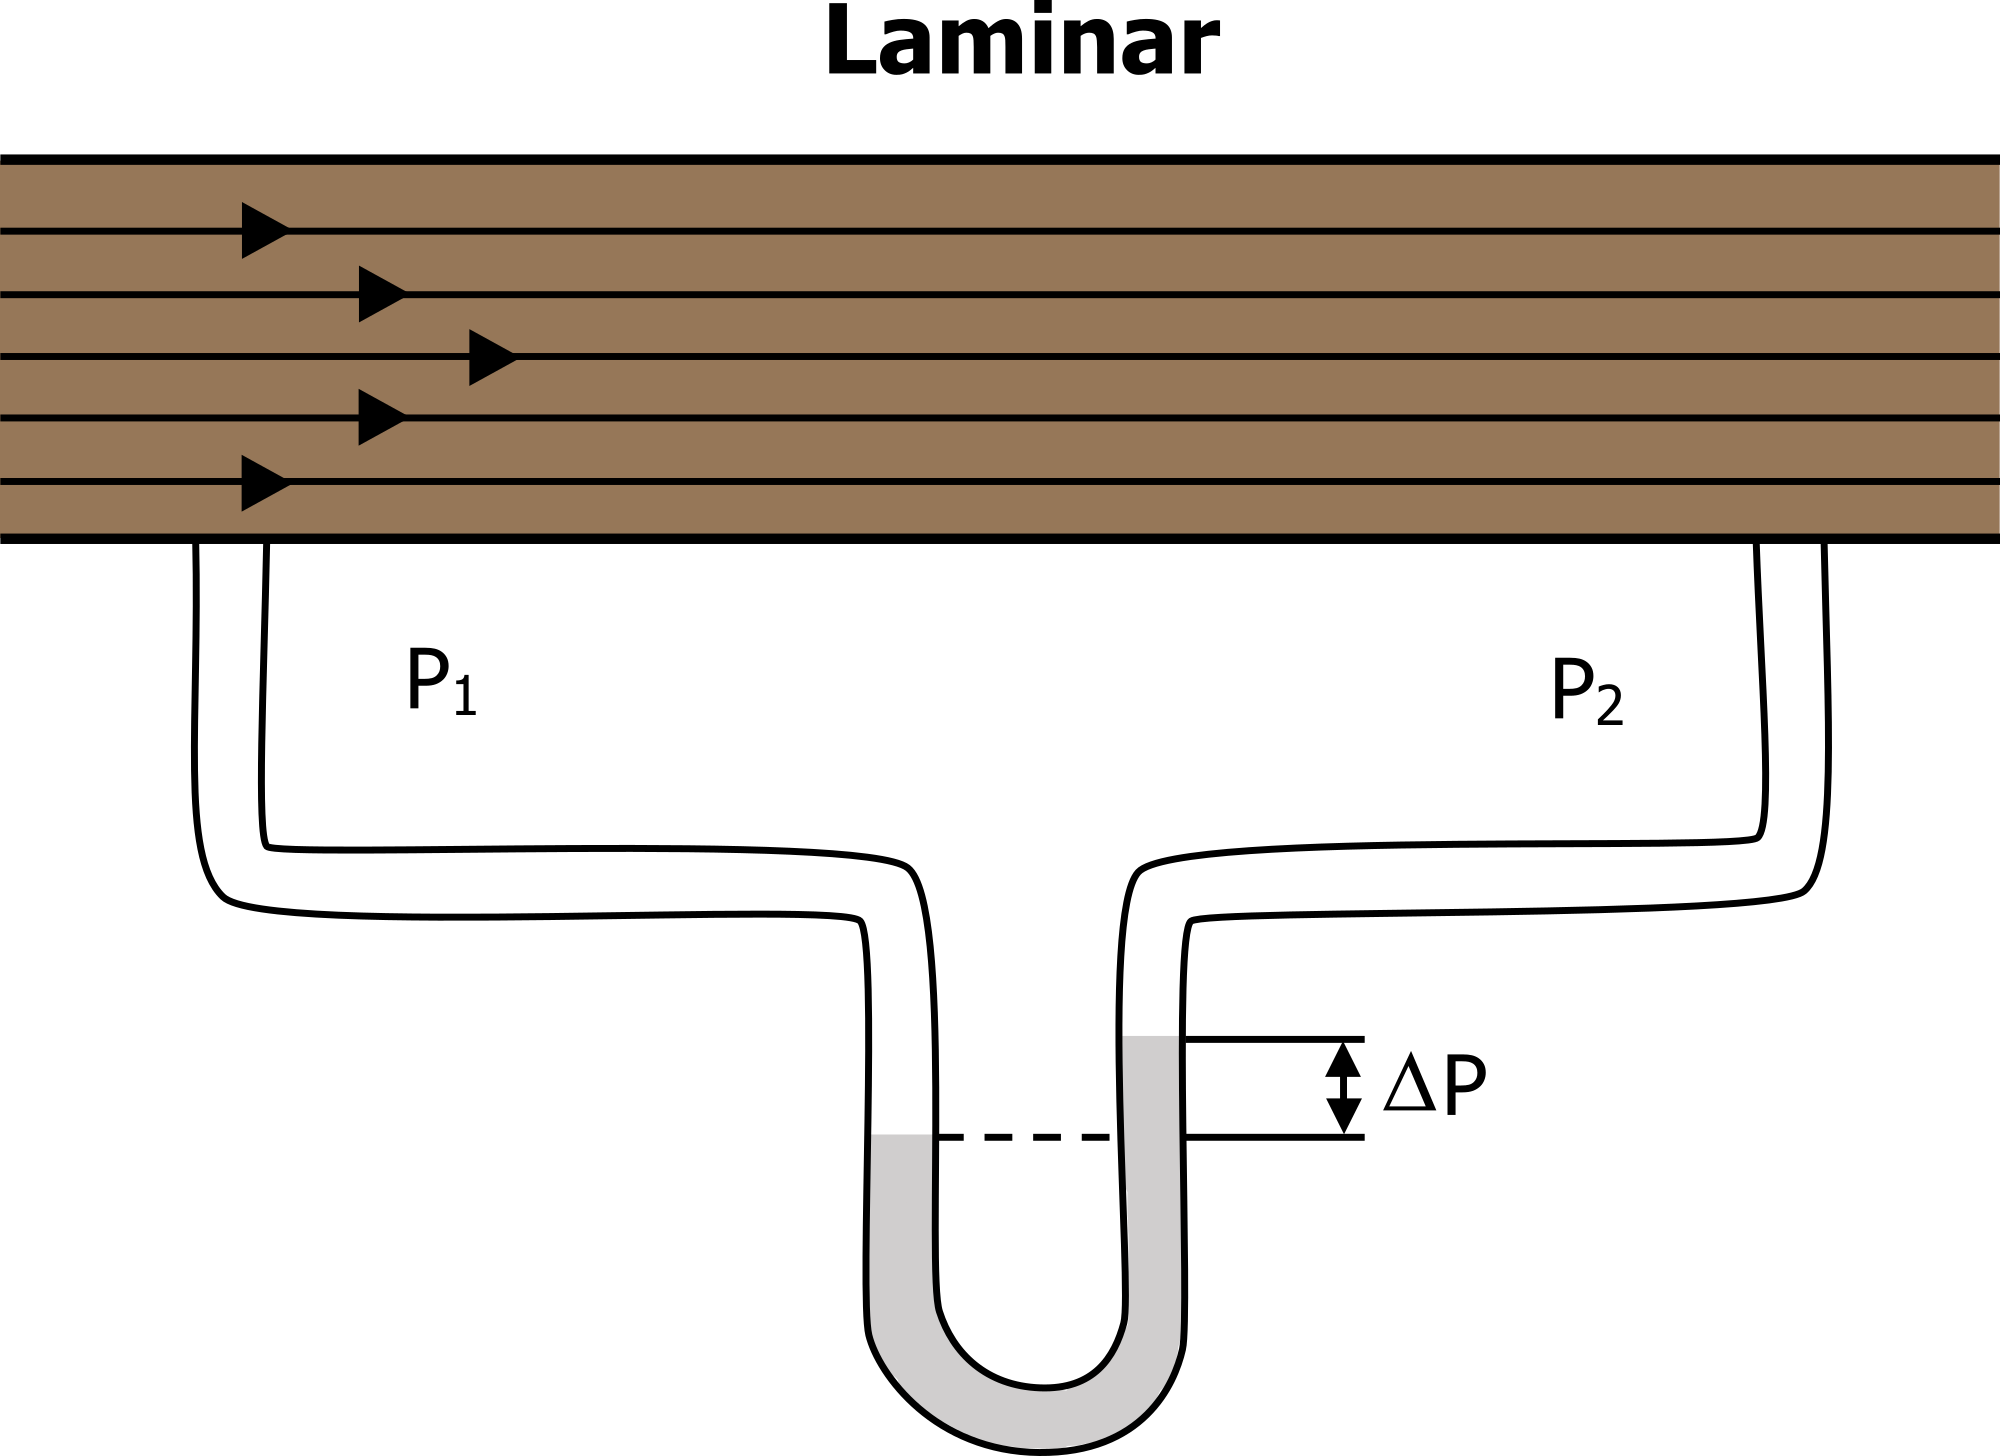
The most efficient form of flow is laminar (i.e., laminar flow takes the lowest pressure differential for flow to occur). In laminar flow the molecules are moving in an orderly manner, those at the side of the tube moving a little slower due to contact with tube walls and those in the middle moving fastest (figure 5.1).
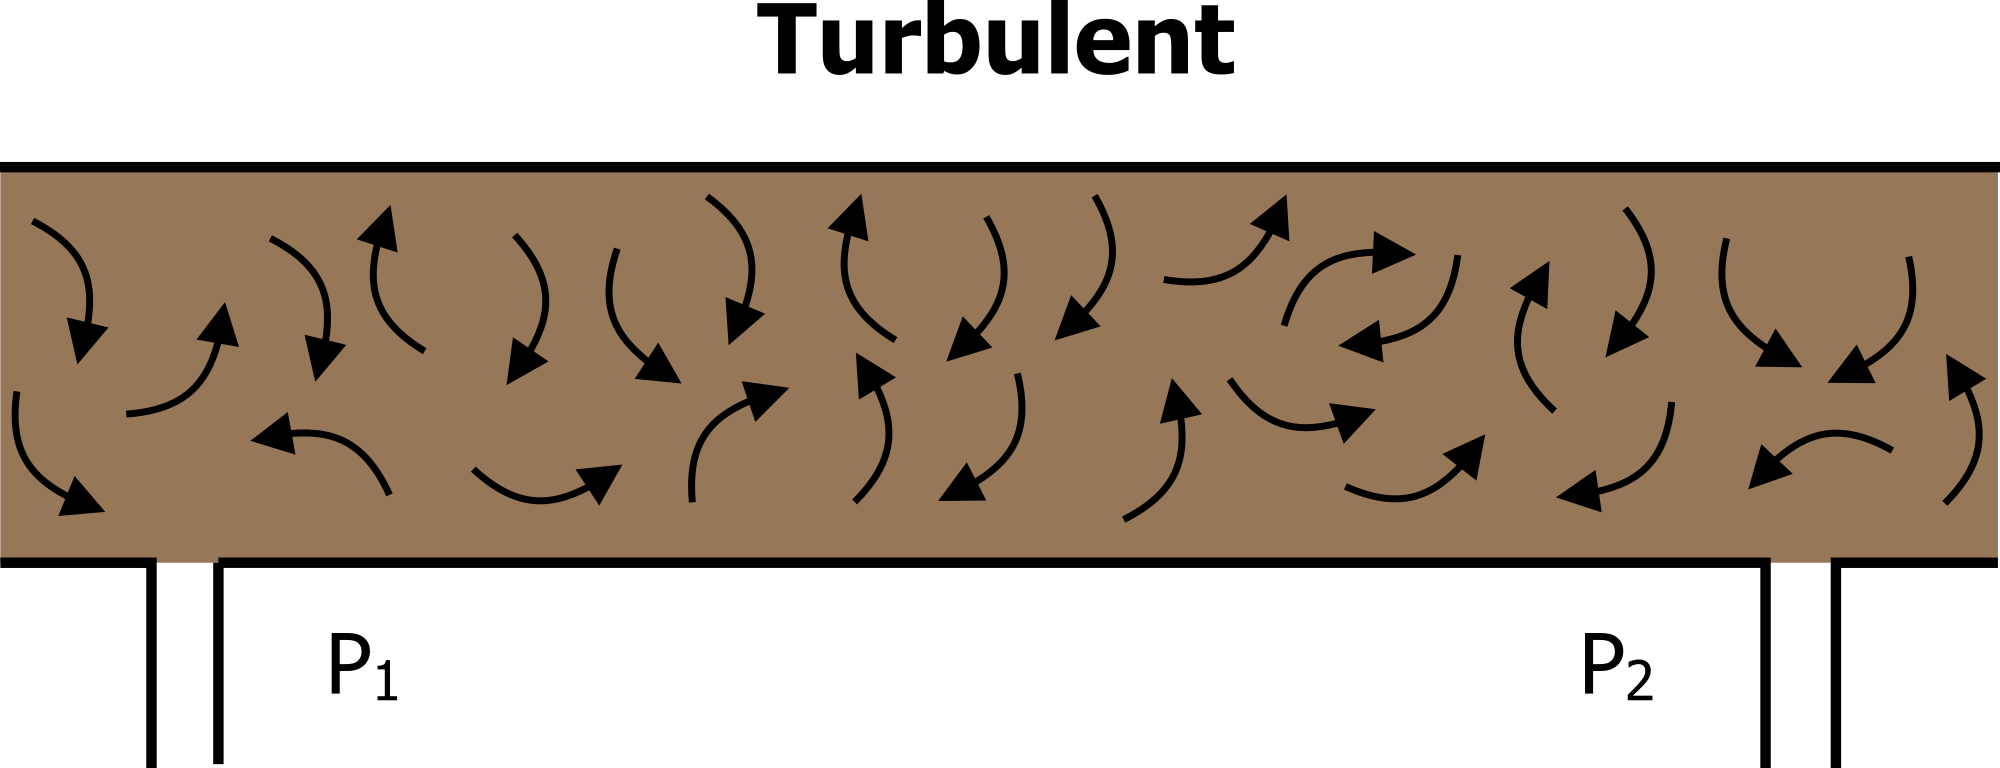
When velocity increases or tube radius decreases then this organization is lost. Collisions between molecules and with the tube wall are now more frequent and movement is more chaotic, and the flow becomes turbulent (figure 5.2). At this point some molecules are at times moving against the pressure gradient due to these collisions. Consequently, to generate the same amount of molecule movement (i.e., flow) from one end of the tube to another, a greater pressure differential is needed when flow becomes turbulent. Turbulent flow is more common in the large airways where velocity and airway radius are high.
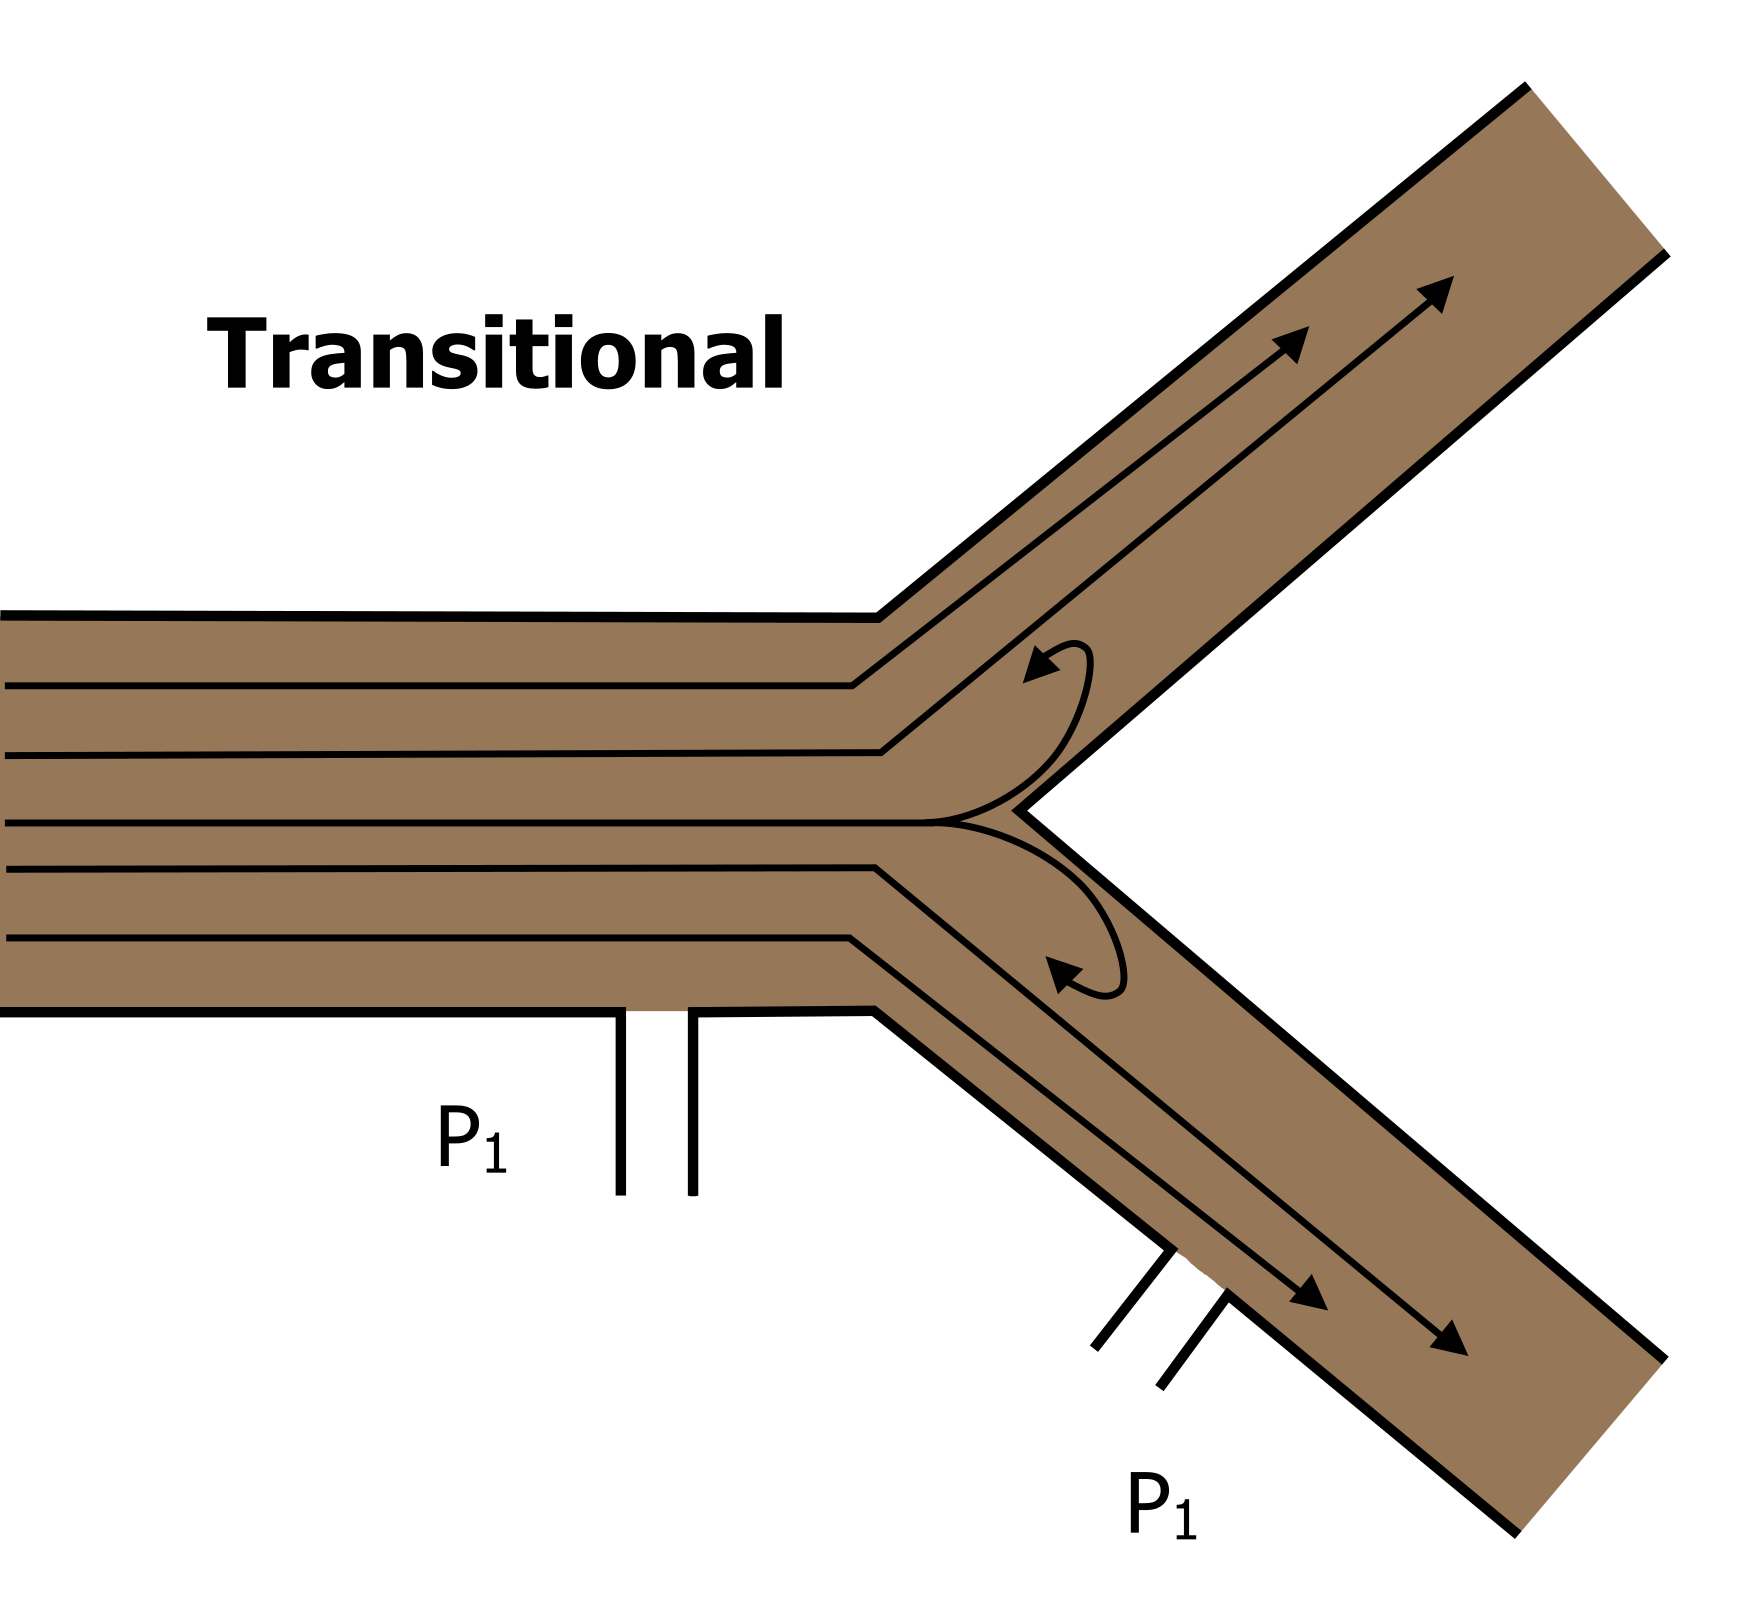
In reality, the vast majority of the airways are branching small tubes, so we see a mixture of the two above—mostly laminar flow but some turbulence generated at the branch (or transitional) points (figure 5.3).
For our purposes though we are going to look at the factors that affect flow when it is laminar—the dominant form of flow in the majority of airways. These factors are described by Poiselle’s equation. We will now break down Poiselle’s equation in relation to flow of air down airways. Although initially an intimidating equation, there are some things we can generally ignore.
Equation 5.1
[latex]\dot{V} = \displaystyle\frac{\Delta P \times \pi \times r^4}{8n \times L}[/latex]
First, Poiselle says that flow decreases when length of the tube increases; because the airways have constant length, we do not have to worry about it.
Then there is the viscosity of the gas. This is not usually a concern either when breathing humidified air at a constant biological temperature. It does become important when breathing other gas mixtures, however, such as a helium/oxygen blend that has a lower viscosity and is given to respiratory patients or deep water divers to increase flow. But we will assume it is another constant. Pi (π) is also a constant.
So the two remaining variables are the important ones to understand. The pressure differential created by expansion and relaxation of the lung generates a proportional flow, and we have dealt with this in previous chapters.
What we will look at more closely now is airway radius as this has a profound effect on flow. Radius is critical for two main reasons. First it is variable, as the caliber of an airway changes with lung volume and by the action of airway smooth muscle. Second, it has a very powerful effect on flow; as you can see in Poiselle’s equation, radius is to the fourth power. This means a small increase in radius has a large effect on flow. For example, if the radius of an airway is doubled from 1 mm to 2 mm, the flow rate through the tube increases sixteenfold, which of course is two to the fourth power (i.e., 2x2x2x2). The inverse is of course true—halve the radius and flow reduces sixteenfold.
So far we have couched everything in terms of flow, but really we need to look at airway resistance. Because resistance is simply the reciprocal (or opposite) of flow, we can flip Poiselle’s equation upside down to describe resistance, and we now see that a reduction in radius (r) causes a large increase in resistance (R).
Equation 5.2
[latex]R = \displaystyle\frac{8n \times L}{\Delta P \times \pi \times r^4}[/latex]
Airway Resistance
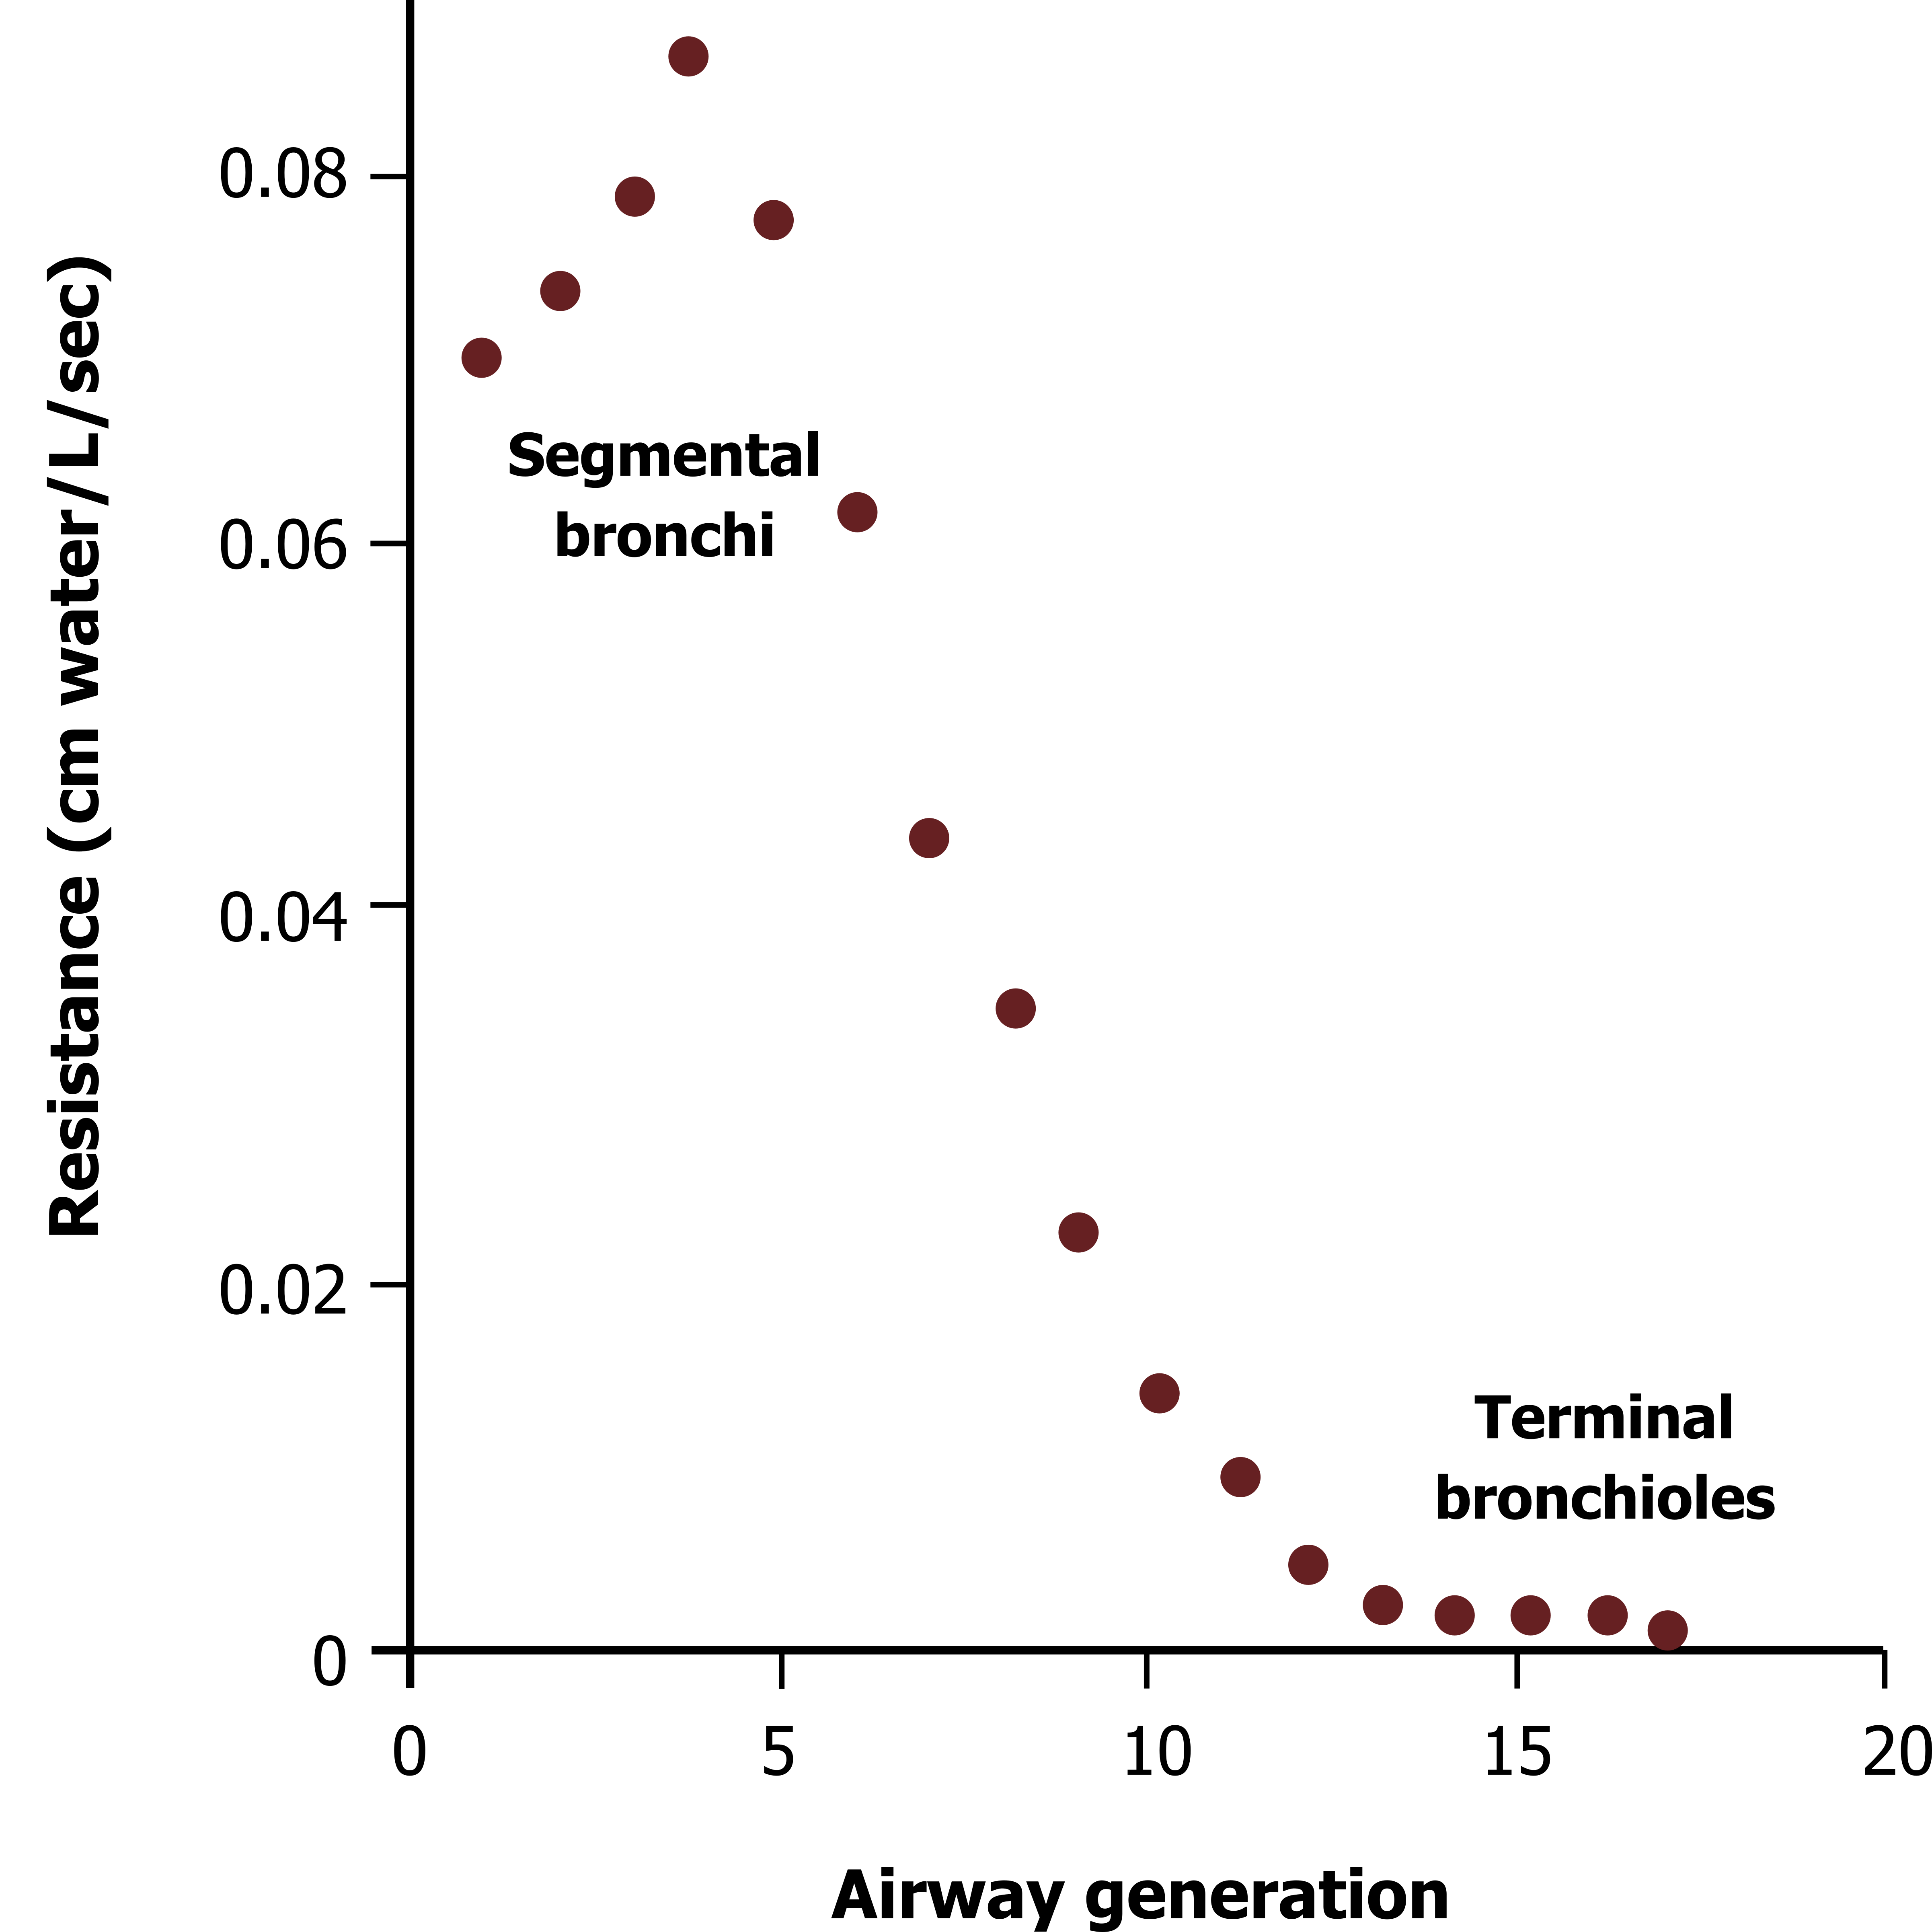
So with radius having such a powerful effect on airway resistance we would expect that the early and larger generations of airways would offer the least resistance to flow, and resistance would increase as we descended deeper into the lung to the smaller and later airway generations. Figure 5.4 shows the opposite is true—that airway resistance decreases as the airway generations are descended. This is because the total cross-sectional area increases with each generation—while the early and large airways are wide, they are few. The lower and smaller airways are much more numerous, and so collectively they have a greater cross-sectional area and therefore offer less resistance.
The highest point of resistance is actually the midsize bronchioles. There are a couple of clinically important points to make here:
- If radius is reduced by disease, such as during inflammation of the airway wall or contraction of airway smooth muscle causing bronchoconstriction, then resistance is markedly increased, and to maintain flow, the pressure differential must be increased. Increasing this pressure differential means increasing the work of breathing.
- The vast total cross-sectional area of the lower airways means that a significant amount of damage can be done before symptoms arise. This “silent zone” means that a disease may be significantly established and be in a relatively late stage before the patient becomes symptomatic and goes to the physician.
Airway Resistance and Lung Volume

The airways without cartilaginous support significantly change their radius when the lung expands due to the radial traction. In brief, parenchymal fibers tethered to the alveoli and exterior of the airways allow the airways to be pulled open by the expanding alveoli when lung volume increases (illustrated in figure 5.5).
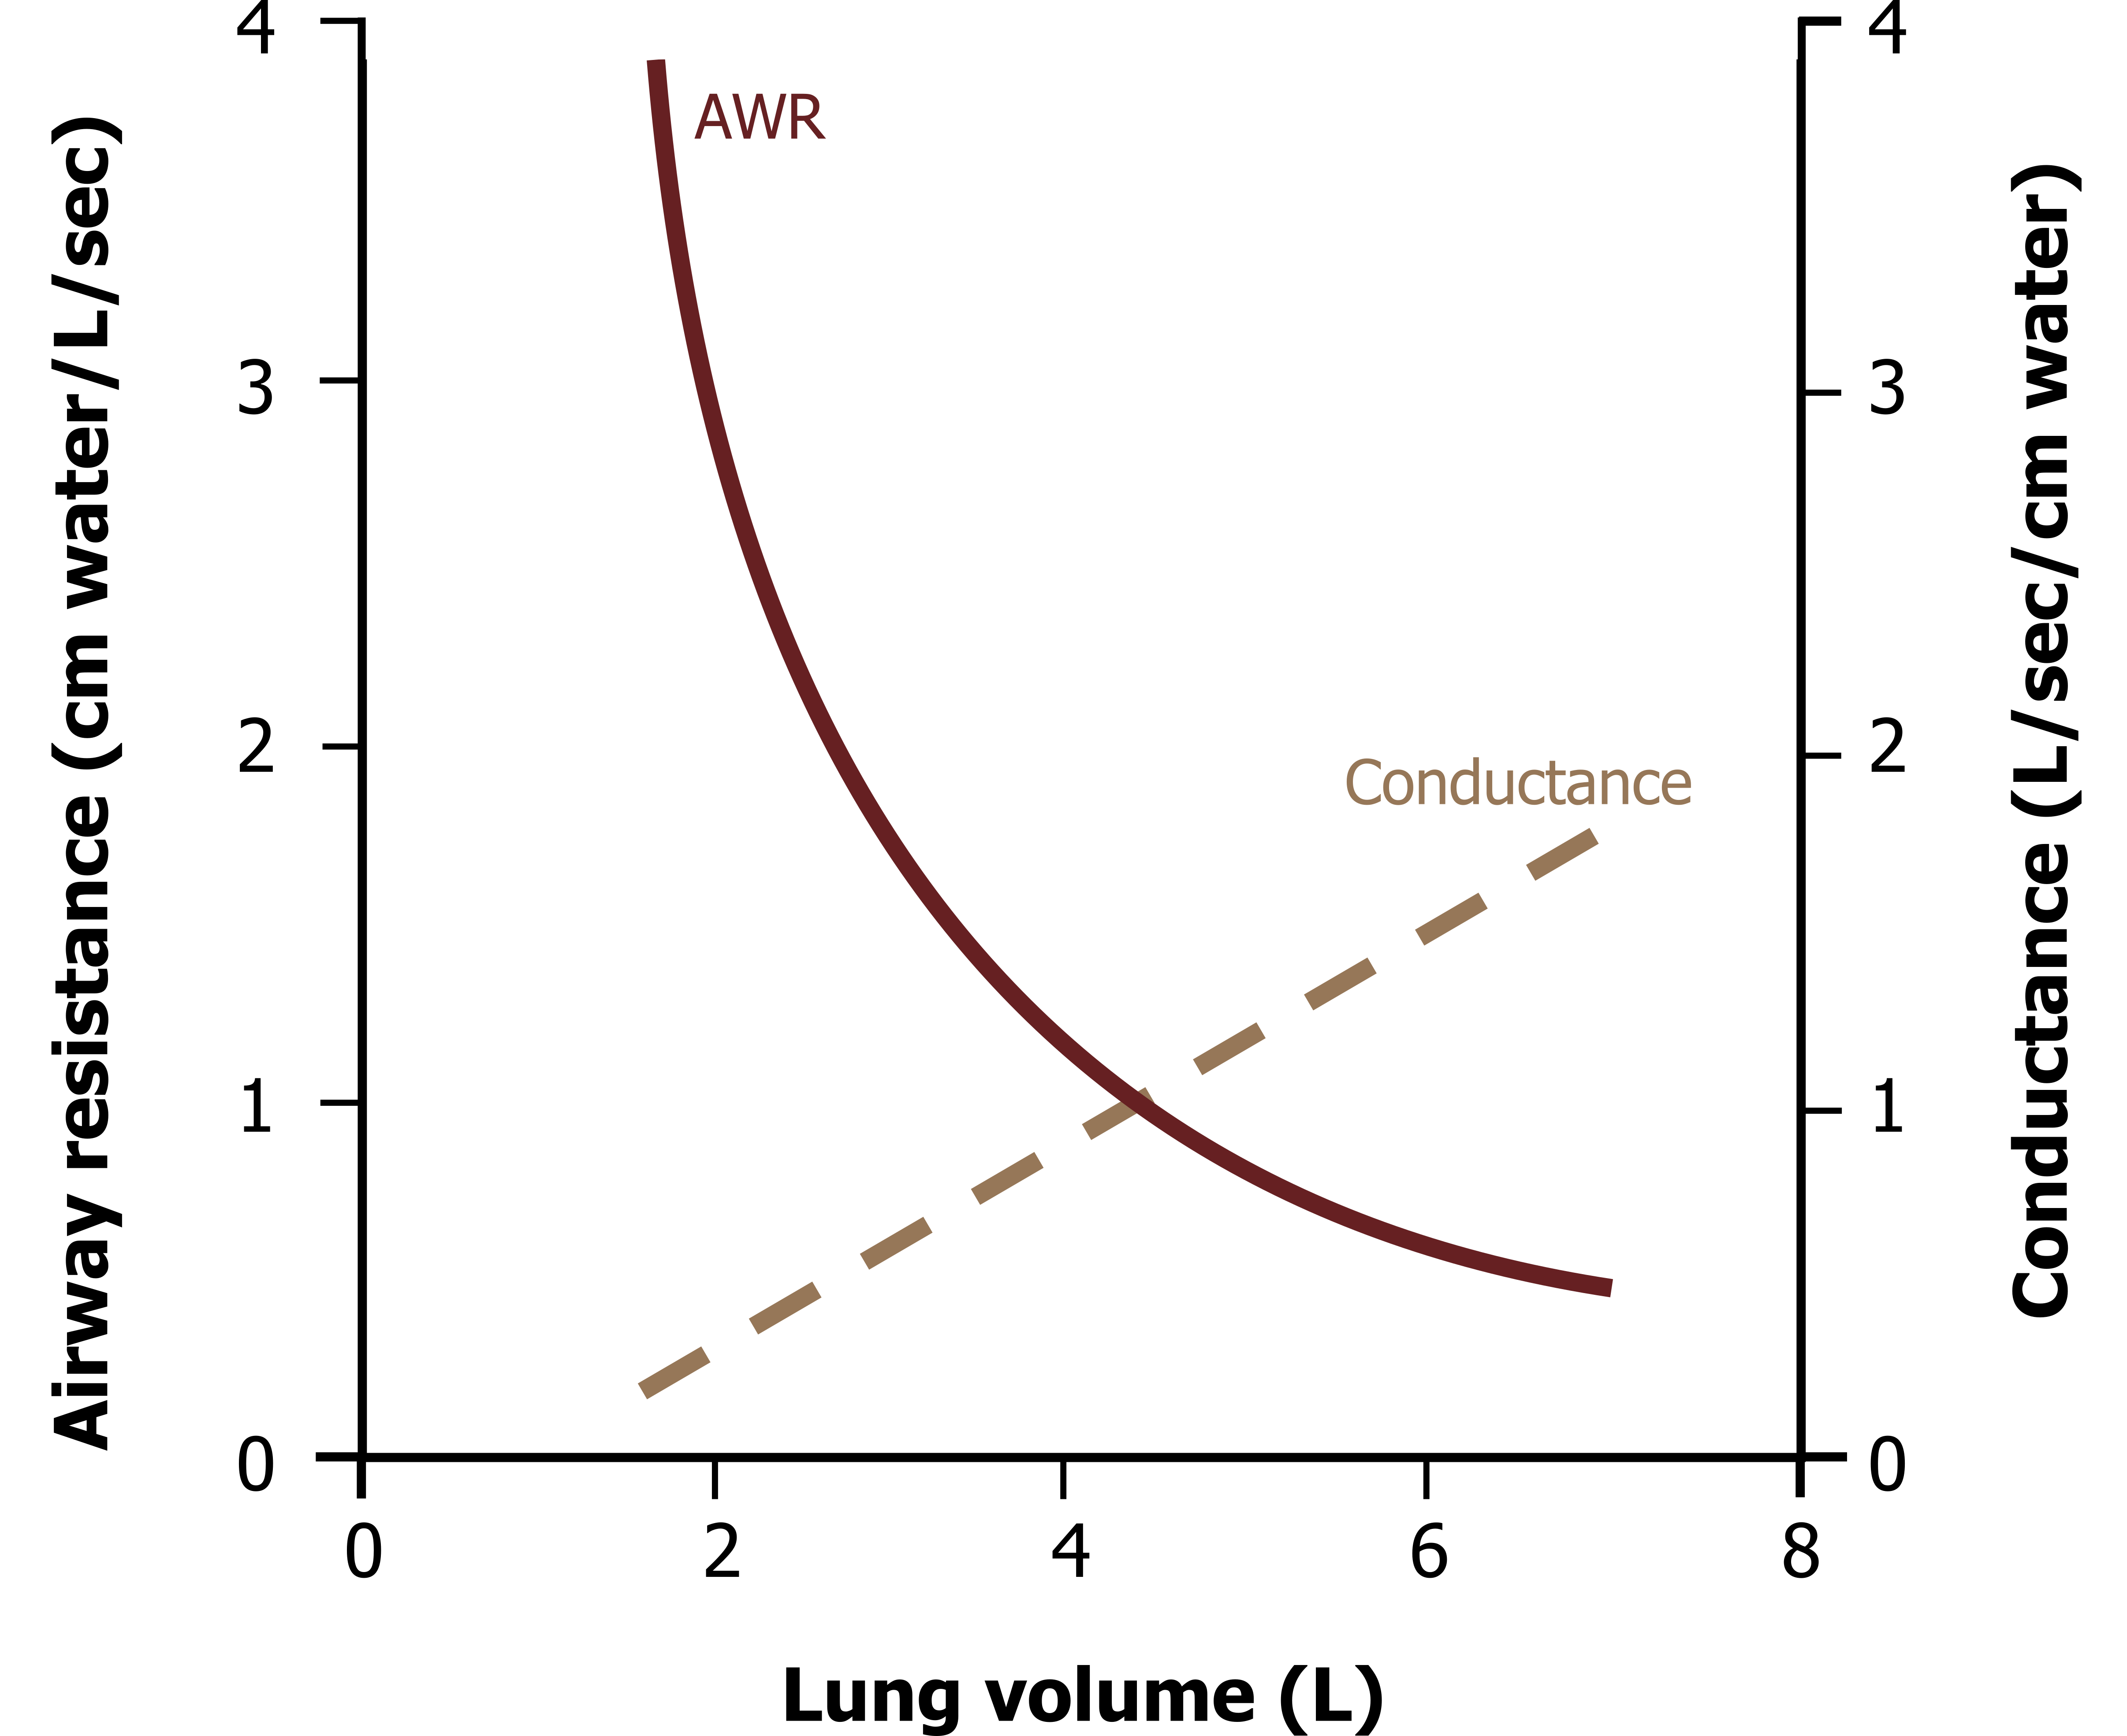
This increase in airway diameter means that airway resistance falls as lung volume increases. This is demonstrated by figure 5.6; as lung volume increases, then airway resistance falls exponentially.
The inverse is also true, that as lung volume decreases, airway radius declines. This may happen to a sufficient extent to allow small airways to collapse. It is worth noting here that respiratory patients frequently breathe at higher lung volumes. While there are mechanical reasons for this that we will discover in the next chapter, the higher lung volume may at least improve airway conductance (although it carries many other disadvantages).
Airway Resistance and Neural Control
As well as the lung volume effect, the tone of airway smooth muscle is also a powerful determinant of airway radius and therefore resistance. The muscle is arranged in a ring pattern around the airway circumference. Contraction of the smooth muscle causes bronchoconstriction, decreasing the airway radius. Relaxation of the smooth muscle allows bronchodilation.
Airway smooth muscle is under the control of the autonomic nervous system. Parasympathetic release of acetylcholine causes activation of muscarinic receptors. This causes a rise in intracellular calcium that activates the smooth muscle. Muscle is relaxed by sympathetic stimulation of β2 adrenergic receptors. These β2 receptors are the target of bronchodilator drugs, such as albuterol, that resolve the inappropriate contraction of smooth muscle seen in the hypersensitive airways of asthmatics.
The bronchoconstrictive pathway is utilized by the irritant reflex that is initiated by airway wall receptors detecting the arrival of inspired particulates. This defensive reflex results in bronchoconstriction, presumably to limit the entry of more particulates.
A number of inflammatory mediators also cause bronchoconstriction and probably play a significant role in the bronchoconstriction of asthma (which frequently also involves airway inflammation).
Low airway PCO2 also has a direct stimulatory effect on airway smooth muscle and a bronchoconstrictive effect. This is presumably to shunt air to other regions of the lung and away from regions where overventilation caused the low PCO2.
Summary
So now you should be able to understand how the type of flow, airway radius, lung volume, and autonomic nervous system all influence airway resistance and so can either oppose or promote the flow of air in the lung.
References, Resources, and Further Reading
Text
Levitsky, Michael G. “Chapter 2: Mechanics of Breathing.” In Pulmonary Physiology, 9th ed. New York: McGraw Hill Education, 2018.
West, John B. “Chapter 7: Mechanics of Breathing—How the Lung Is Supported and Moved.” In Respiratory Physiology: The Essentials, 9th ed. Philadelphia: Wolters Kluwer Health/Lippincott Williams and Wilkins, 2012.
Widdicombe, John G., and Andrew S. Davis. “Chapter 3.” In Respiratory Physiology. Baltimore: University Park Press, 1983.
Figures
Figure 5.1: Laminar flow. Grey, Kindred. 2022. CC BY 4.0. https://archive.org/details/5.1_20220125/mode/1up
Figure 5.2: Turbulent flow. Grey, Kindred. 2022. CC BY 4.0. https://archive.org/details/5.2_20220125/mode/1up
Figure 5.3: Transitional flow. Grey, Kindred. 2022. CC BY 4.0. https://archive.org/details/5.3_20220125/mode/1up
Figure 5.4: Airway resistance down the bronchial tree. Grey, Kindred. 2022. CC BY 4.0. https://archive.org/details/5.6_20220125/mode/1up
Figure 5.5: Radial traction decreases airway resistance as lung volume increases. Grey, Kindred. 2022. CC BY 4.0. https://archive.org/details/5.7_20220125/mode/1up
Figure 5.6: Airway resistance and lung volume. Grey, Kindred. 2022. CC BY 4.0. https://archive.org/details/5.8_20220125/mode/1up
