17 Control of Breathing
Learning objectives
- Identify the roles of the peripheral and central chemoreceptors in the regulation of minute ventilation.
- Describe the mechanisms that are thought to be responsible for the generation of a rhythmic pattern of breathing.
- Describe nonchemical, cortical influences on breathing.
Central Control Mechanisms
Introduction
Although control of breathing is fundamentally reflexive to maintain blood gases and pH, there are underlying complexities that, despite decades of research, are still not clear. At the foundation of ventilatory control is an underlying respiratory rhythm that can be modulated by chemoreflexes to maintain blood homeostasis, overridden by emotion or other higher brain functions, be ignored while we finish speaking a sentence (but for only so long), or be trusted to control breathing throughout the night as the rest of the brain sleeps.
In this chapter we will have a look at the regions of the nervous system that control breathing and how they interact or override each other.
The Role of the Brainstem
It has long been known that the brainstem contains critical centers for the control of breathing. These regions produce what is often referred to as the reflex drive to breathe, or brainstem drive to breathe. Despite its critical nature for survival, this involuntary motor drive that operates the respiratory muscles is barely understood.
What we will do here is summarize some basic information to create a coherent and accurate overview.
The reflex drive to breathe is a typical reflex arch, with receptors in the vasculature and lung reporting to a central controller in the brainstem that implements its effects via the respiratory muscles. What is different from most simple reflexes is that the controller is rather complex and can be thought of as a central hub that integrates inputs from multiple sources.
Many visceral sensors supplying the controller in the brainstem send their afferent signals via the glossopharyngeal and vagus nerves to the nucleus tractus solitaries, or NTS. This input station is part of an anatomically indistinct region on the dorsal surface of the medulla, called the dorsal respiratory group or DRG. The DRG connects to motor neurons that lead to the inspiratory muscles.
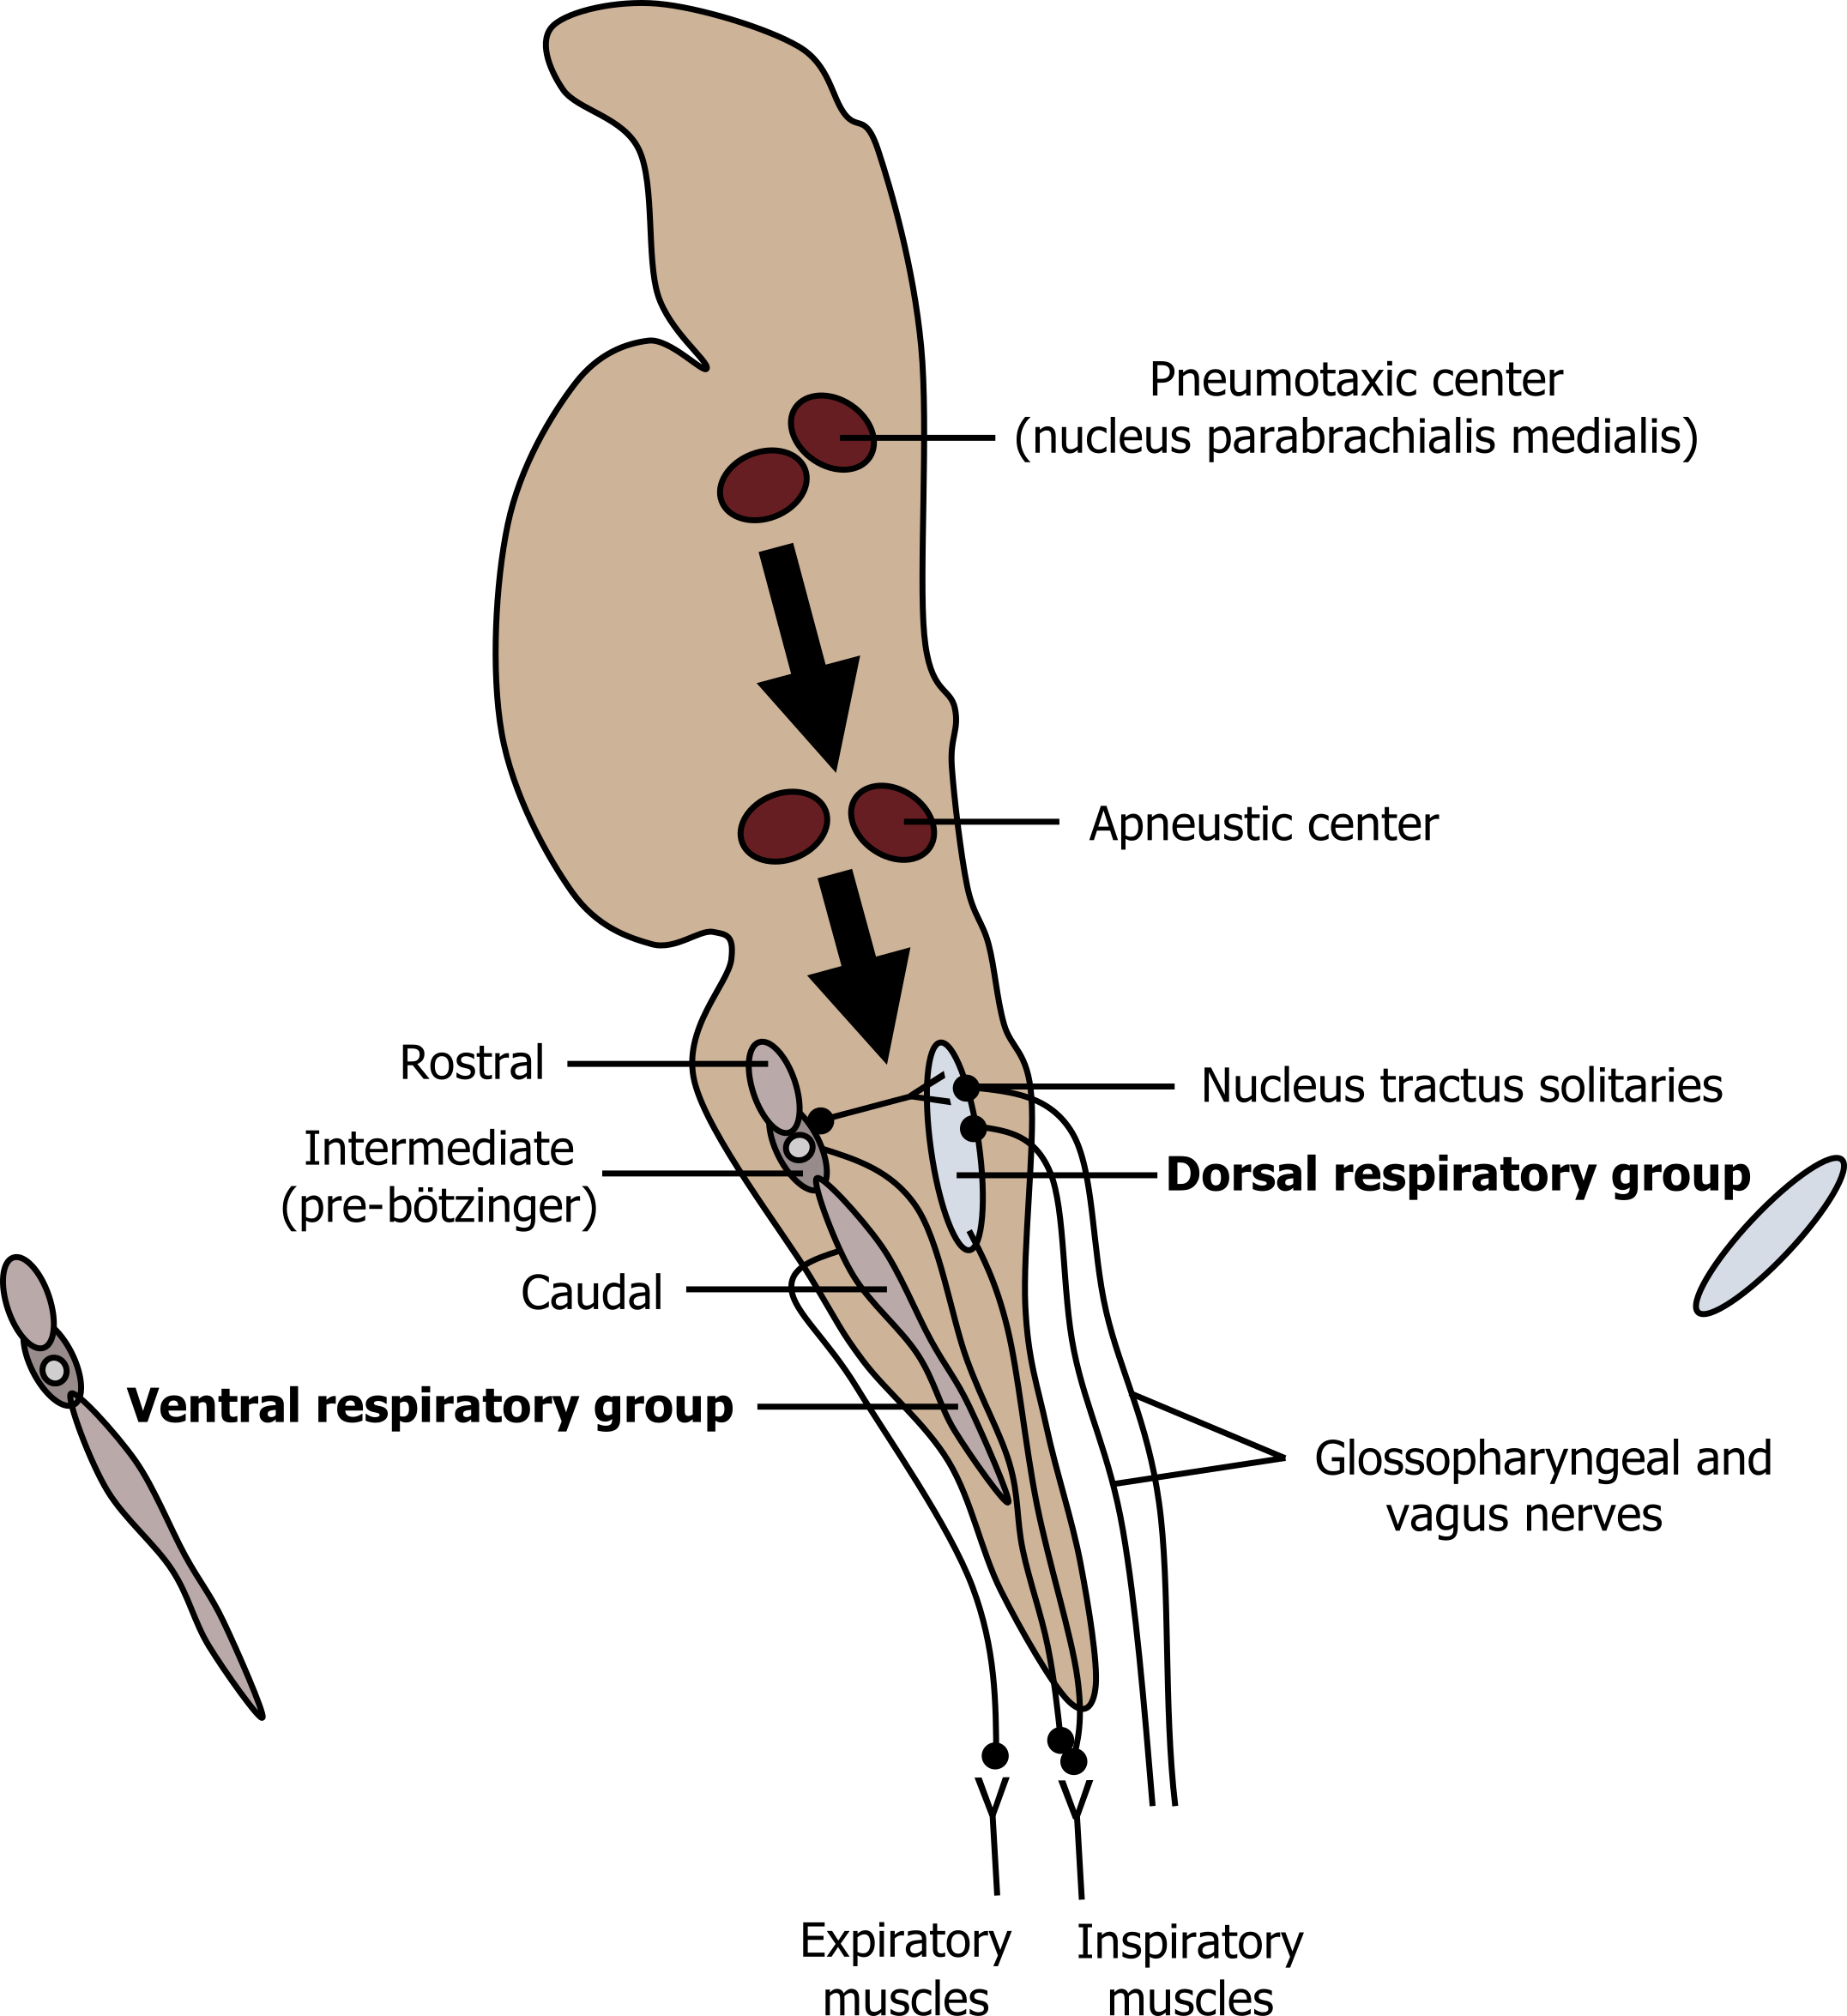
These DRG (figure 17.1) neurons show ramp-like bursts of activity that cause inspiratory muscle contraction to induce inspiration, then stop, allowing the inspiratory muscles to relax and passive exhalation to begin. This intermittent ramp of activity can be modulated by input from the sensors or other regions of the central nervous system, but it is not spontaneous; rather this activity is initiated by another respiratory pacemaker. It was this pacemaker that eluded physiologists for decades.
On the other side of medulla is the ventral respiratory group (figure 17.1), which has been known for a long time to contain circuits that contribute to the control of breathing within its rostral, intermediate, and caudal regions. Within the intermediate region a cluster of neurons called the pre-Bötzinger complex (figure 17.1) with apparently spontaneous activity is currently thought to be the respiratory pacemaker. The pre-bötzinger complex is likely responsible for the activity of the DRG inspiratory neurons to produce the ramping activity.
The ventral respiratory group also contains neurons with inspiratory-related activity and connections to the inspiratory motor neurons. It is better known for its expiratory neurons, however, which are capable of activating the expiratory muscles when expiration must become active rather than remain passive. During quiet resting breathing, these expiratory neurons remain dormant.
This medullary circuitry can be influenced by other brainstem centers thought to be responsible for fine-tuning the breathing rhythm.
The Apneustic center in the lower pons (figure 17.1) excites the inspiratory neurons and prolongs the ramp activity they produce; this inevitably produces a prolonged inspiratory period. Higher up in the pons is the Pneumotaxic center (figure 17.1), which acts as an off switch for inspiratory neurons; thus it regulates inspiratory volume and indirectly influences the rate of breathing, tending to increase it. This is a very basic overview of the breathing circuitry that is capable of generating inspiration and active expiration when needed. But these centers take information and direction from other neural influences, including chemoreceptors, receptors in the lung, and higher brain centers. We will look at the latter two now.
Pulmonary and Higher Brain Influences
The brainstem drive to breathe can be modulated from above and from below. The literature about whether these influences increase or decrease the drive to breathe is often confused, perhaps because of the wide range of experiments performed and the different species used. We will have a look at some of the most consistent and clinically pertinent aspects here, starting in the lung and three populations of intrapulmonary neural receptors.

Pulmonary stretch receptors are mechanoreceptors found in airway walls and smooth muscle. As their name suggests, they respond to expansion of the lung, and their afferent activity to the brainstem increases with lung volume, as figure 17.2 shows. Upon arrival at the NTS the PSR activity tends to inhibit inspiratory neurons and can stop inspiratory activity completely in other species (the Hering–Breuer reflex). However, their influence on the control of breathing in humans is weak, and while they might not contribute to the control of breathing in man, they likely influence respiratory sensations, such as shortness of breath.
Irritant receptors are found in the airway epithelium and are ideally placed to perform their role of detecting harmful substances entering the lungs, such as noxious gases, particulates, and even cold air. They generally have an inhibitory influence on the drive to breathe, perhaps as an attempt to limit the amount of noxious substance entering the lung. Other components to their defensive strategies are bronchoconstriction and induction of the cough reflex. Their response to inflammatory mediators also suggests they may play a role in asthma.
J-receptors, or Juxtacapillary receptors, are found at the junction of the pulmonary capillaries and alveoli. These receptors respond to increases in interstitial pressure so are likely to play a role in the response to pulmonary edema. Their effect on the drive to breathe can be regarded as excitatory as they cause an increase in breathing rate as part of the J-reflex, which includes cardiac components and is intended to prevent over-exercising and cardiopulmonary collapse. As such the J-receptors may also contribute to generating the sensation of shortness of breath.
These three pulmonary receptor groups are the three that usually appear in textbooks, perhaps because of their clinical pertinence, but perhaps because we know most about these. Others exist, and details can be found in other sources. We will now focus briefly on the influence of higher centers on breathing, and these are generally all positive (i.e., cause an increase in breathing). Cortical influences are numerous and undefined, that collectively they produce what is referred to as the wakeful drive to breath. The extent of cortical influence is best illustrated by sleep, when the higher brain is unconscious and any wakeful drive is removed. During sleep breathing is significantly reduced—enough so that arterial PCO2 is several mmHg higher than during wakefulness. This suggests that cortical influences on breathing are enough to cause a lower PaCO2 than would be determined by chemoreflexes alone.
More specific influences from higher centers include emotions; anger, anxiety, sadness, happiness, and sexual arousal all influence the drive and pattern of breathing. This is perhaps best exemplified by emotionally driven sighs or the frankly bizarre activity of laughter. But the list of higher center influences does not stop there; indeed it is likely that we still yet do not know where it stops. Changes in light changes breathing, a sudden loud sound changes breathing, doing a mathematical problem changes breathing… and so on. And unfortunately for clinicians and pulmonary physiologists, the act of measuring breathing changes breathing. So it is likely that all those textbook numbers for normal respiratory rate and depth are all too high, as telling someone you are going to measure their breathing usually causes them to hyperventilate.
Breathing is also a rare incidence of being able to voluntarily control a normally reflex activity (e.g., we can willfully override reflex breathing to perform speech or a breath-hold). In fact, we have as precise control over our respiratory muscles as we have control over the muscles in our hands. Humans maybe be exclusive in this respect because of our elaborate speech, but again, this is another unknown. However, eventually reflex breathing will always reclaim its command over breathing—as anyone who has performed a prolonged breath-hold will know.
Summary
So we have seen that at the heart of the control of breathing there is a pacemaker establishing a basic rhythm and depth of breathing, but this is influenced by numerous other factors from both the lung and higher brain. These influences adjust breathing via the brainstem to produce respiratory responses to the environment and changes in emotional state, and contribute to efficient and appropriate levels of ventilation.
Chemical Control of Breathing
It perhaps comes as no surprise that the major influence on the reflex drive to breathe comes from the homeostatic need to match ventilation with metabolic demand and maintain blood O2, CO2, and pH within narrow ranges. The chemoreflexes are therefore capable of sensing changes in arterial oxygen, carbon dioxide, and pH, modifying the activity of the brainstem respiratory centers and affecting an appropriate change in alveolar ventilation. These reflexes all act as classical negative feedback circuits and are capable of maintaining despite large changes in O2 consumption and CO2 production by metabolizing tissue.
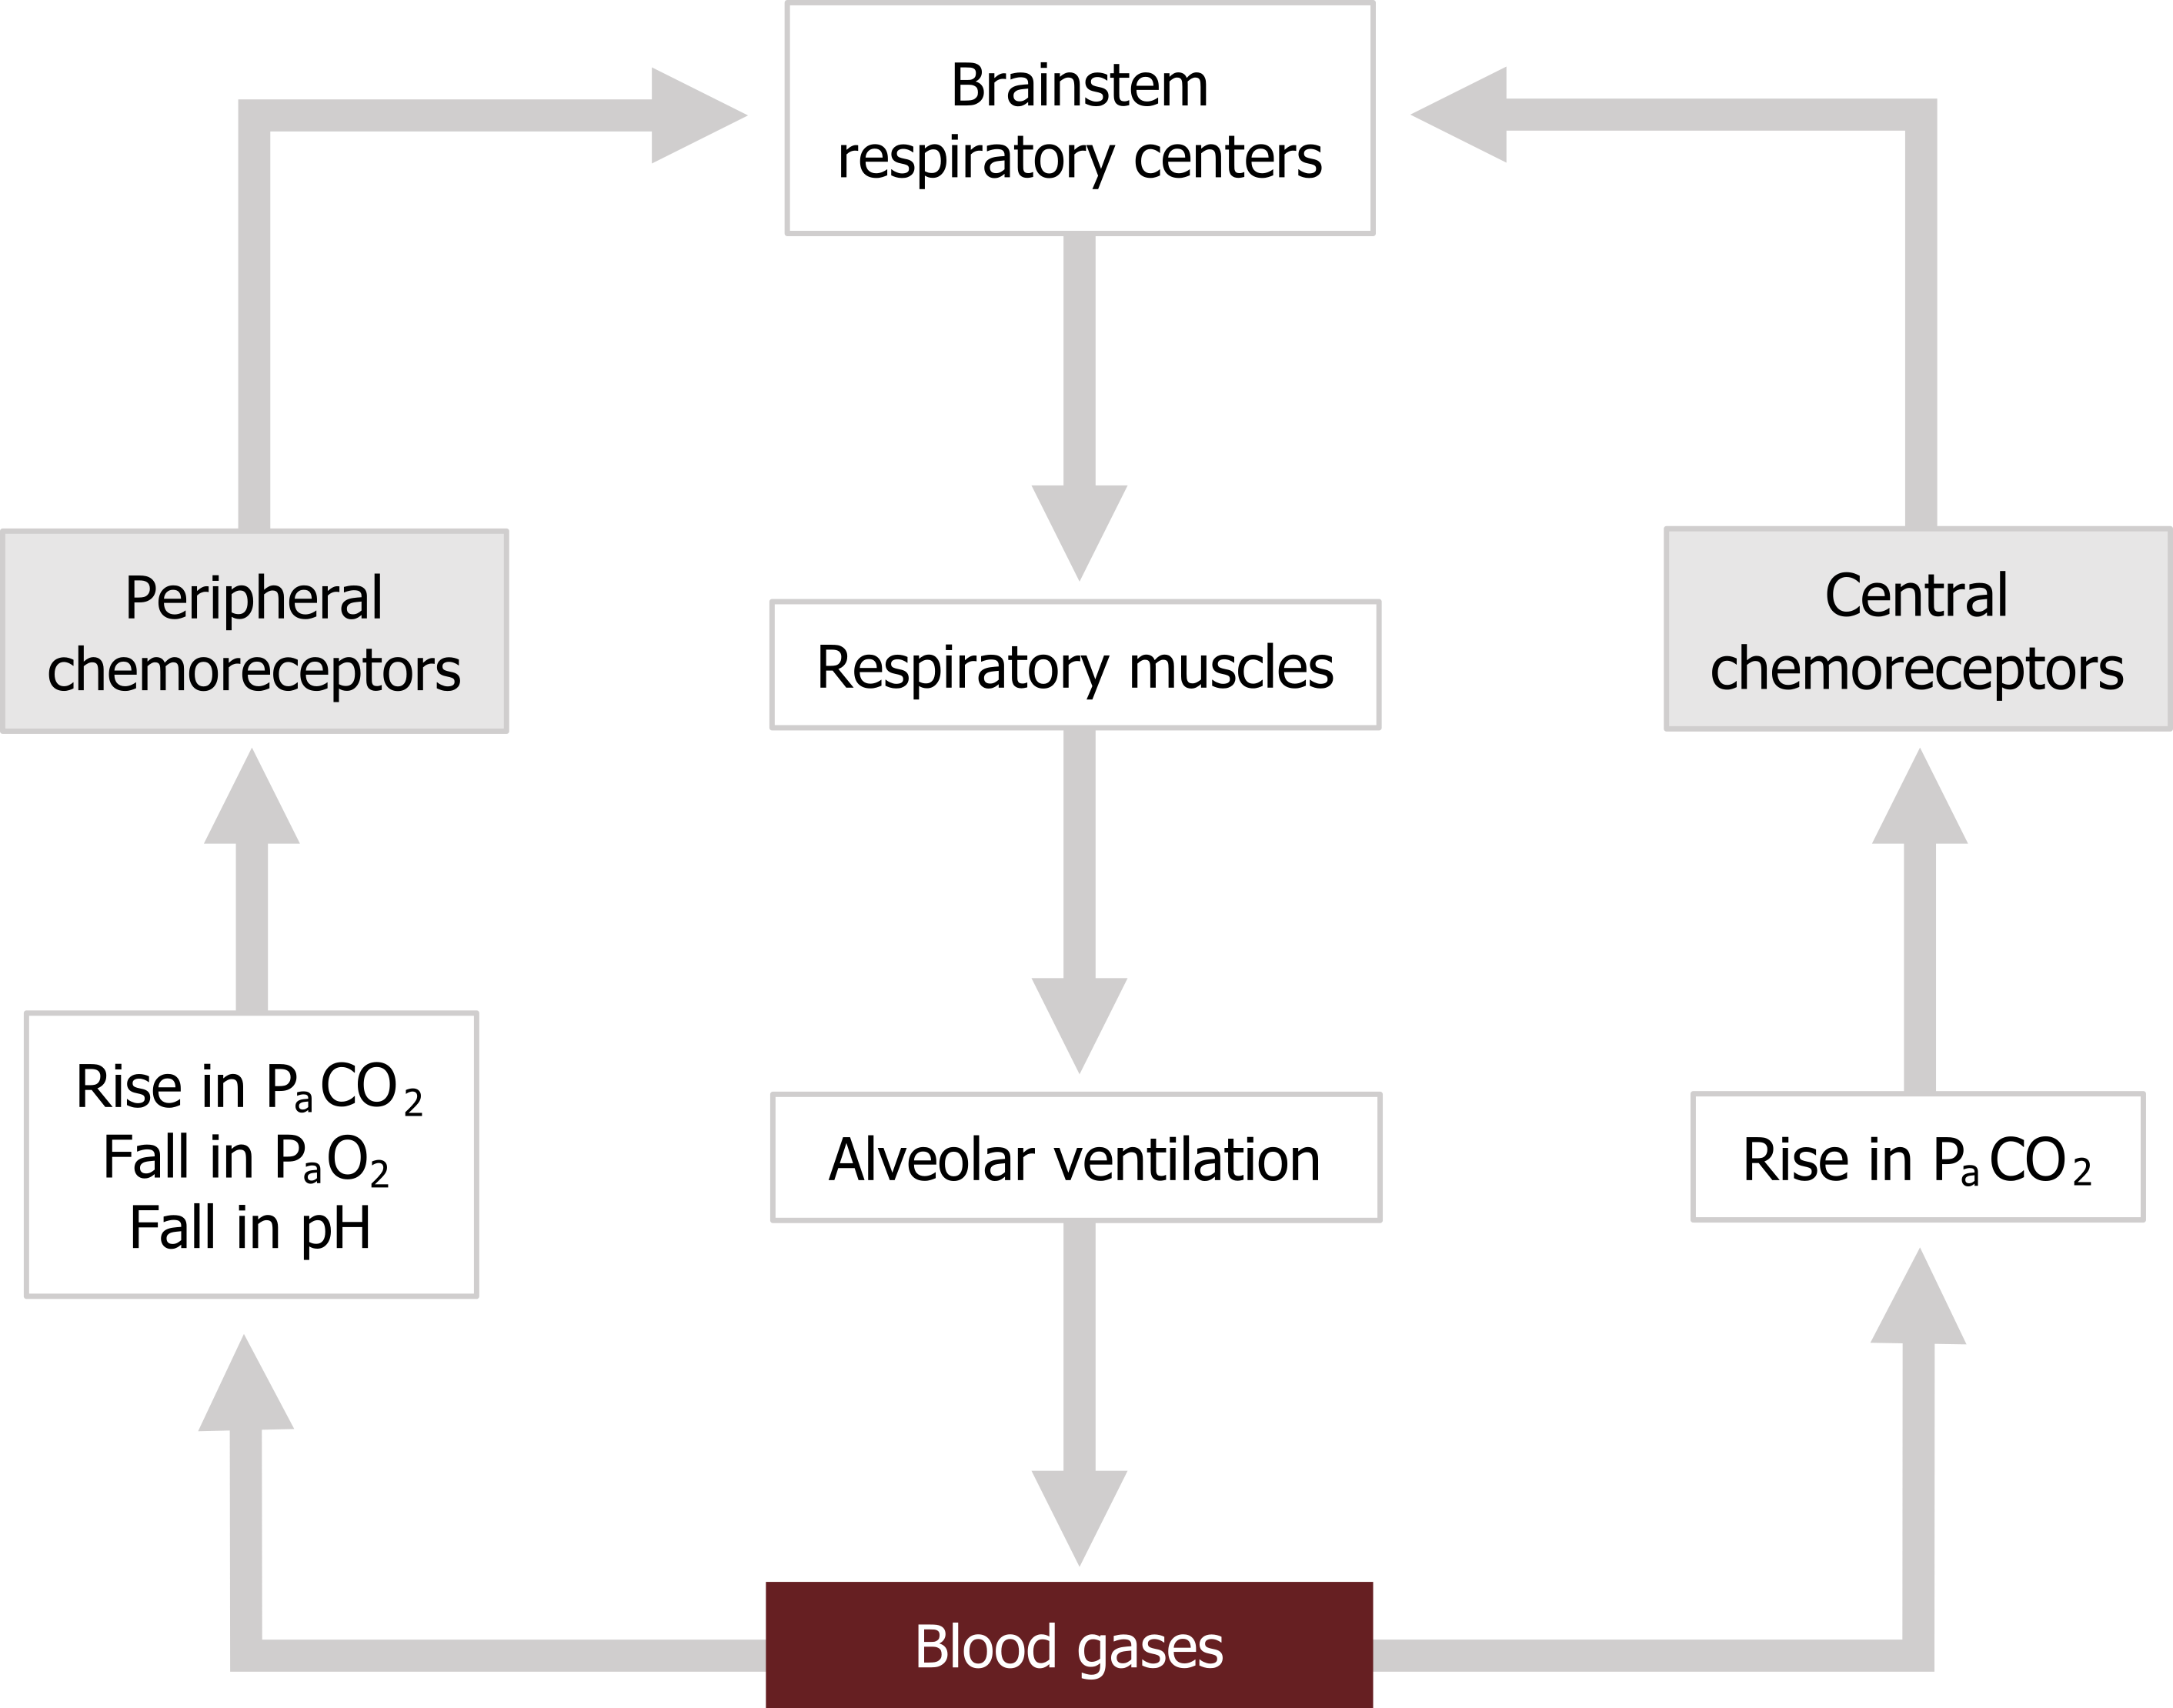
Before getting into the details of the chemoreceptors, let us take a quick overview of the basic circuitry of the chemoreflexes (figure 17.3). There are two sets of sensors in our circuit: the peripheral chemoreceptors that are in the vasculature, and the central chemoreceptors that are found on the surface of the brainstem. The central chemoreceptors are capable of detecting changes in arterial CO2, while the peripheral chemoreceptors respond to changes in CO2, O2, and arterial pH.
Upon excitation by changes in blood gas values, the receptors fire back to the reflex’s controller, the respiratory centers in the brainstem. This results in an increase in reflex ventilatory drive and a greater motor signal to the respiratory muscles. This produces an increase in alveolar ventilation that corrects the blood gas disturbances and stops the chemoreceptors from firing.
With that basic circuit in mind, let us now look more closely at the chemoreceptors and the ventilatory responses they can induce.
Central Chemoreceptors
We will start with the central chemoreceptors. The central chemoreceptors are comprised of chemosensitive neurons on the ventral surface of the medulla found close to the entry points of the glossopharyngeal and vagus nerves (coincidentally these are the nerves bringing in afferent information from the peripheral chemoreceptors and the pulmonary mechanoreceptors).
Although the central chemoreceptors do not respond to hypoxemia and only respond to rises in arterial CO2, their activity accounts for about 80 percent of the hypercapnic ventilatory response. Given the critical importance of maintaining a normal PaCO2, these are considered the most important chemoreceptors for minute-by-minute regulation of ventilation. Ironically they do not respond to CO2 directly, but rather to changes in pH of the cerebrospinal fluid (CSF).
This complication comes from the fact that the central chemoreceptors are not exposed to the blood, but rather are behind the blood brain barrier and bathed in CSF. Hydrogen ions and bicarbonate cannot pass through the blood brain barrier, but CO2 can. Once through the blood brain barrier, CO2 forms carbonic acid in the reaction that is very familiar to you. It is the hydrogen ion from the dissociated carbonic acid that stimulates the chemoreceptors. So the central chemoreceptors respond to a rise in arterial CO2 via a change in CSF pH. Because there is little protein in the CSF, there is little buffering capability, and pH changes here tend to be greater than in the blood where plasma proteins are plentiful. This makes the central chemoreceptors quite sensitive and partly explains their substantial role in CO2 control.
Prolonged exposure to high CO2, such as in chronic lung disease, can lead to a rise in CSF bicarbonate. This bicarbonate buffers hydrogen ions and reduces the sensitivity of the central chemoreceptors. This partly explains why the hypercapnic ventilatory response diminishes over time in chronic lung patients, such as those with COPD.
Peripheral Chemoreceptors
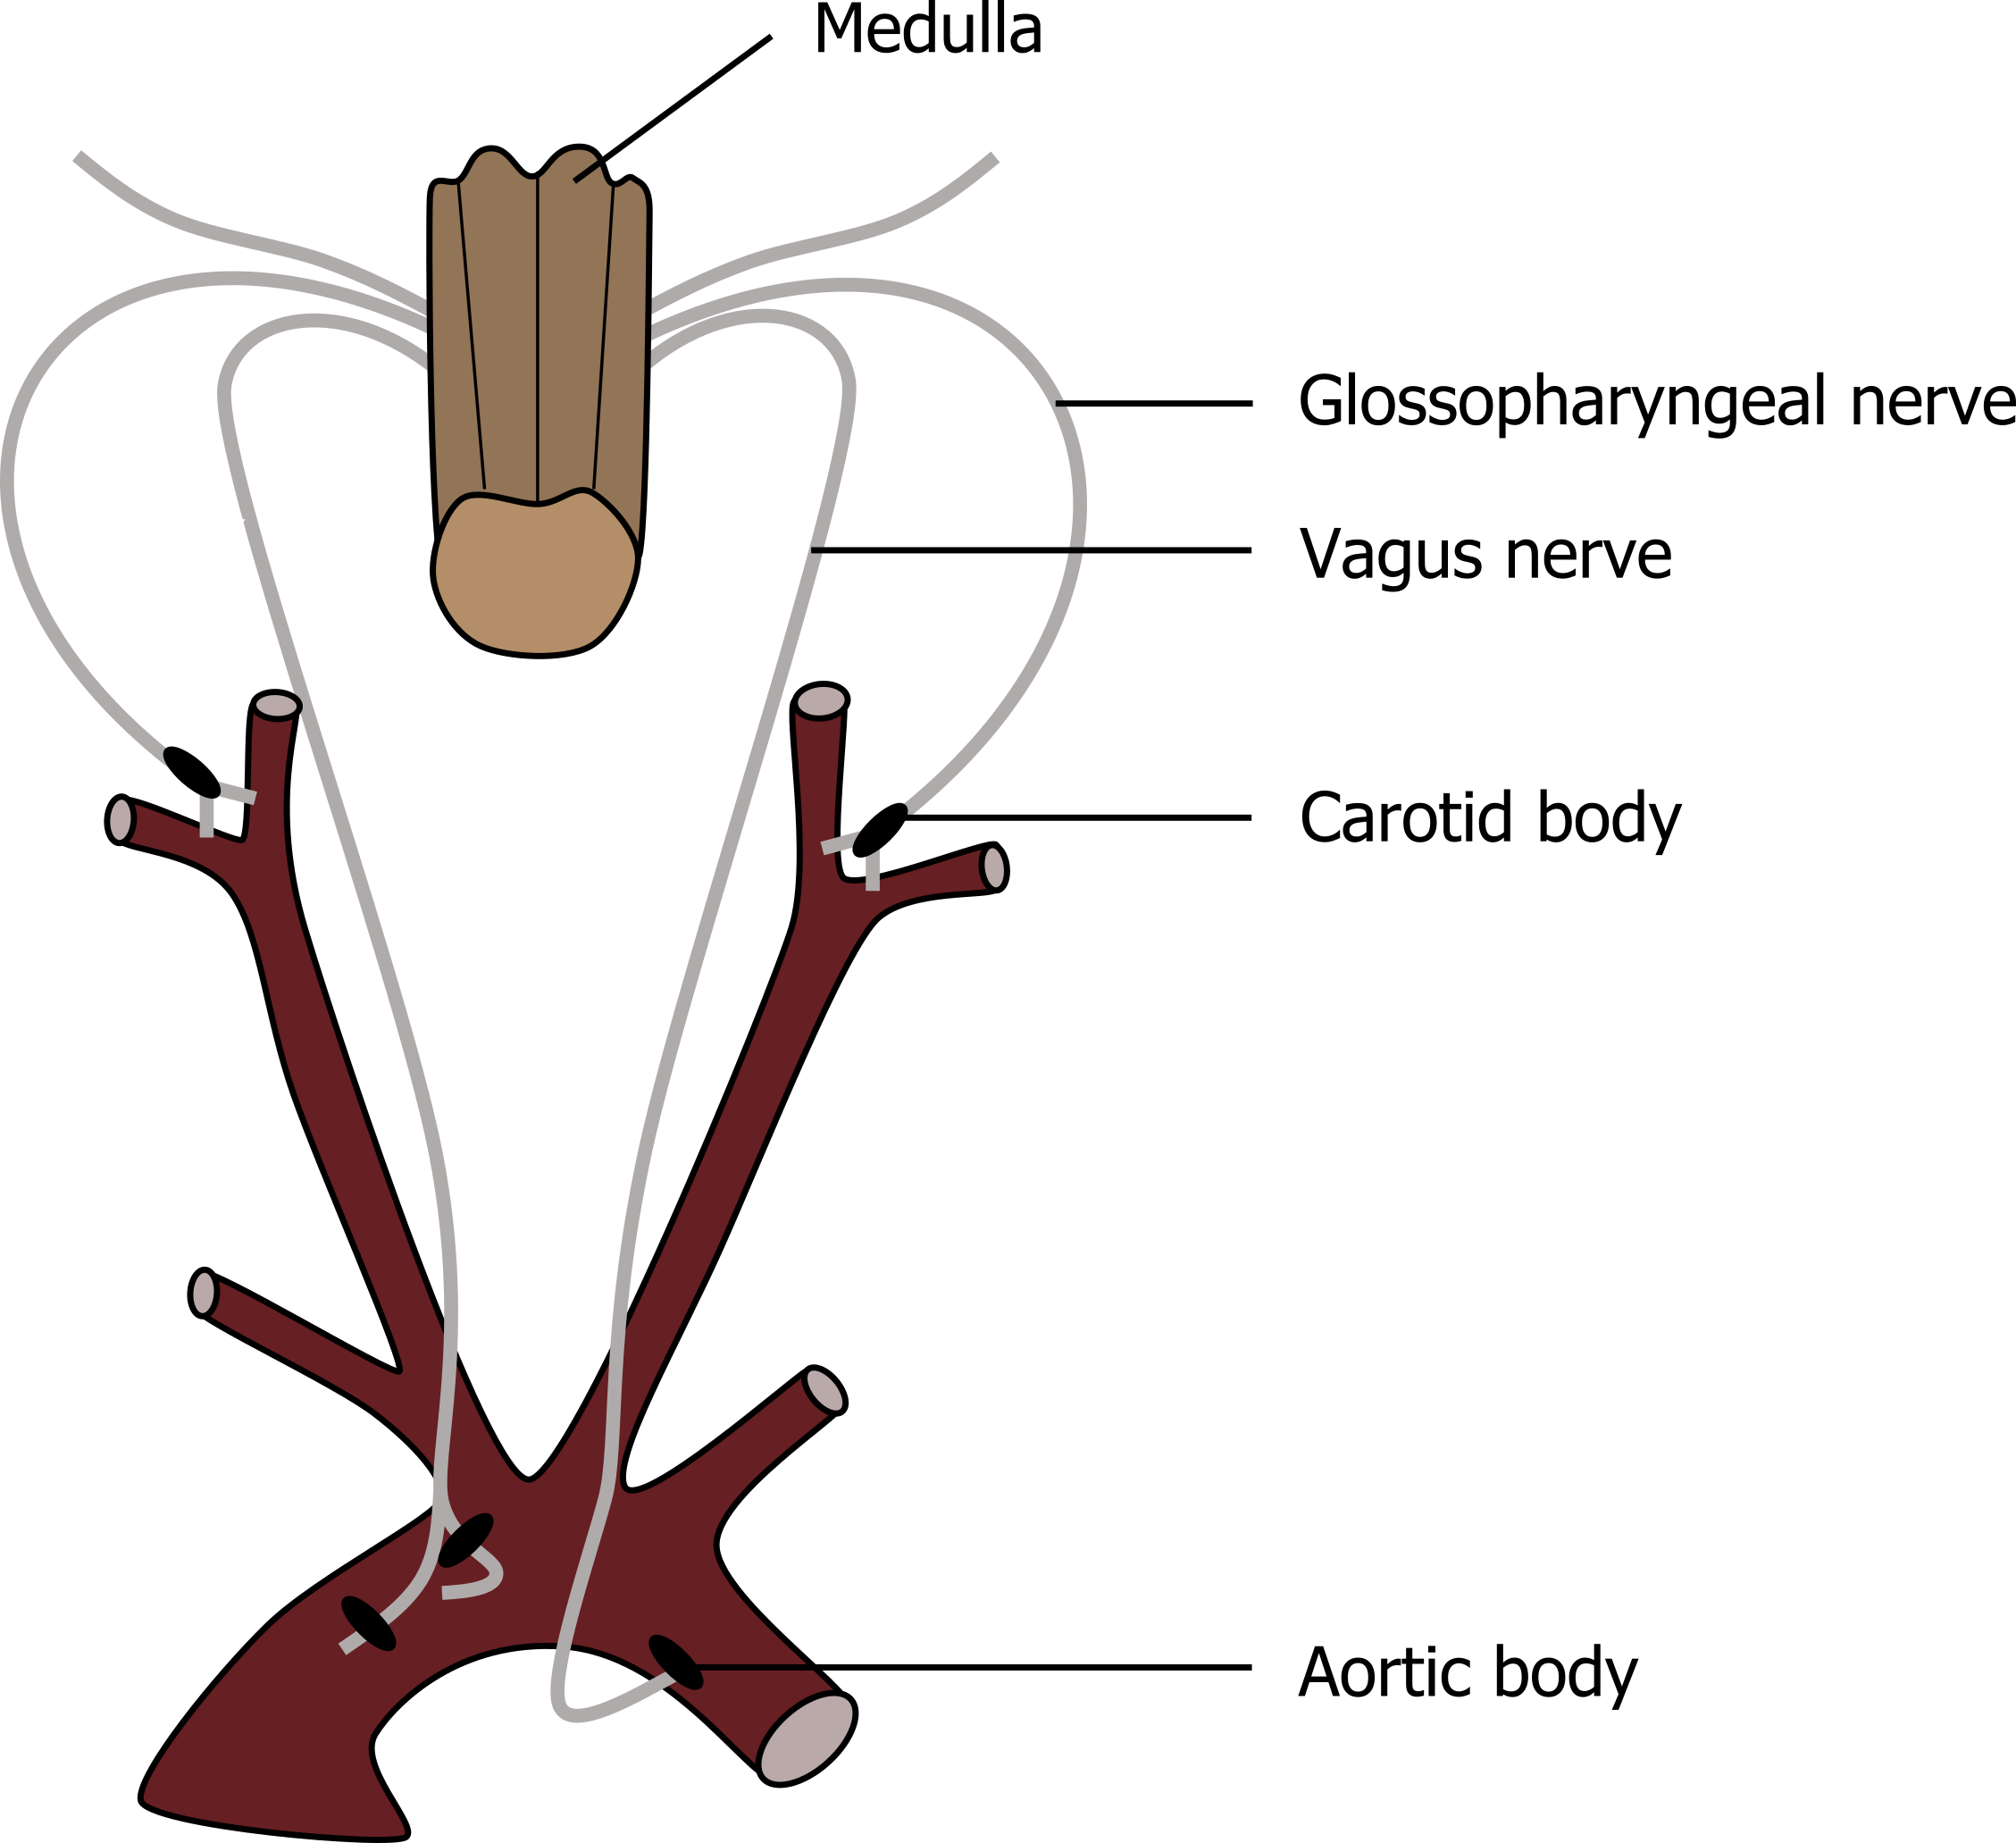
The peripheral chemoreceptors are directly exposed to arterial blood and are capable of responding to changes in CO2, O2, and pH. There are two populations of chemoreceptive cells in the vasculature (see figure 17.4). One population is found in the aortic arch and is referred to as the aortic bodies. These are wired into the brainstem through afferent fibers that project to and join the vagus nerve. The other chemoreceptor is comprised of the carotid bodies, found in the bifurcation of the common carotid arteries. These connect to the brainstem through the carotid sinus and the glossopharyngeal nerves. The carotid bodies are by far the most important in humans, with the aortic bodies contributing very little to any ventilatory response.
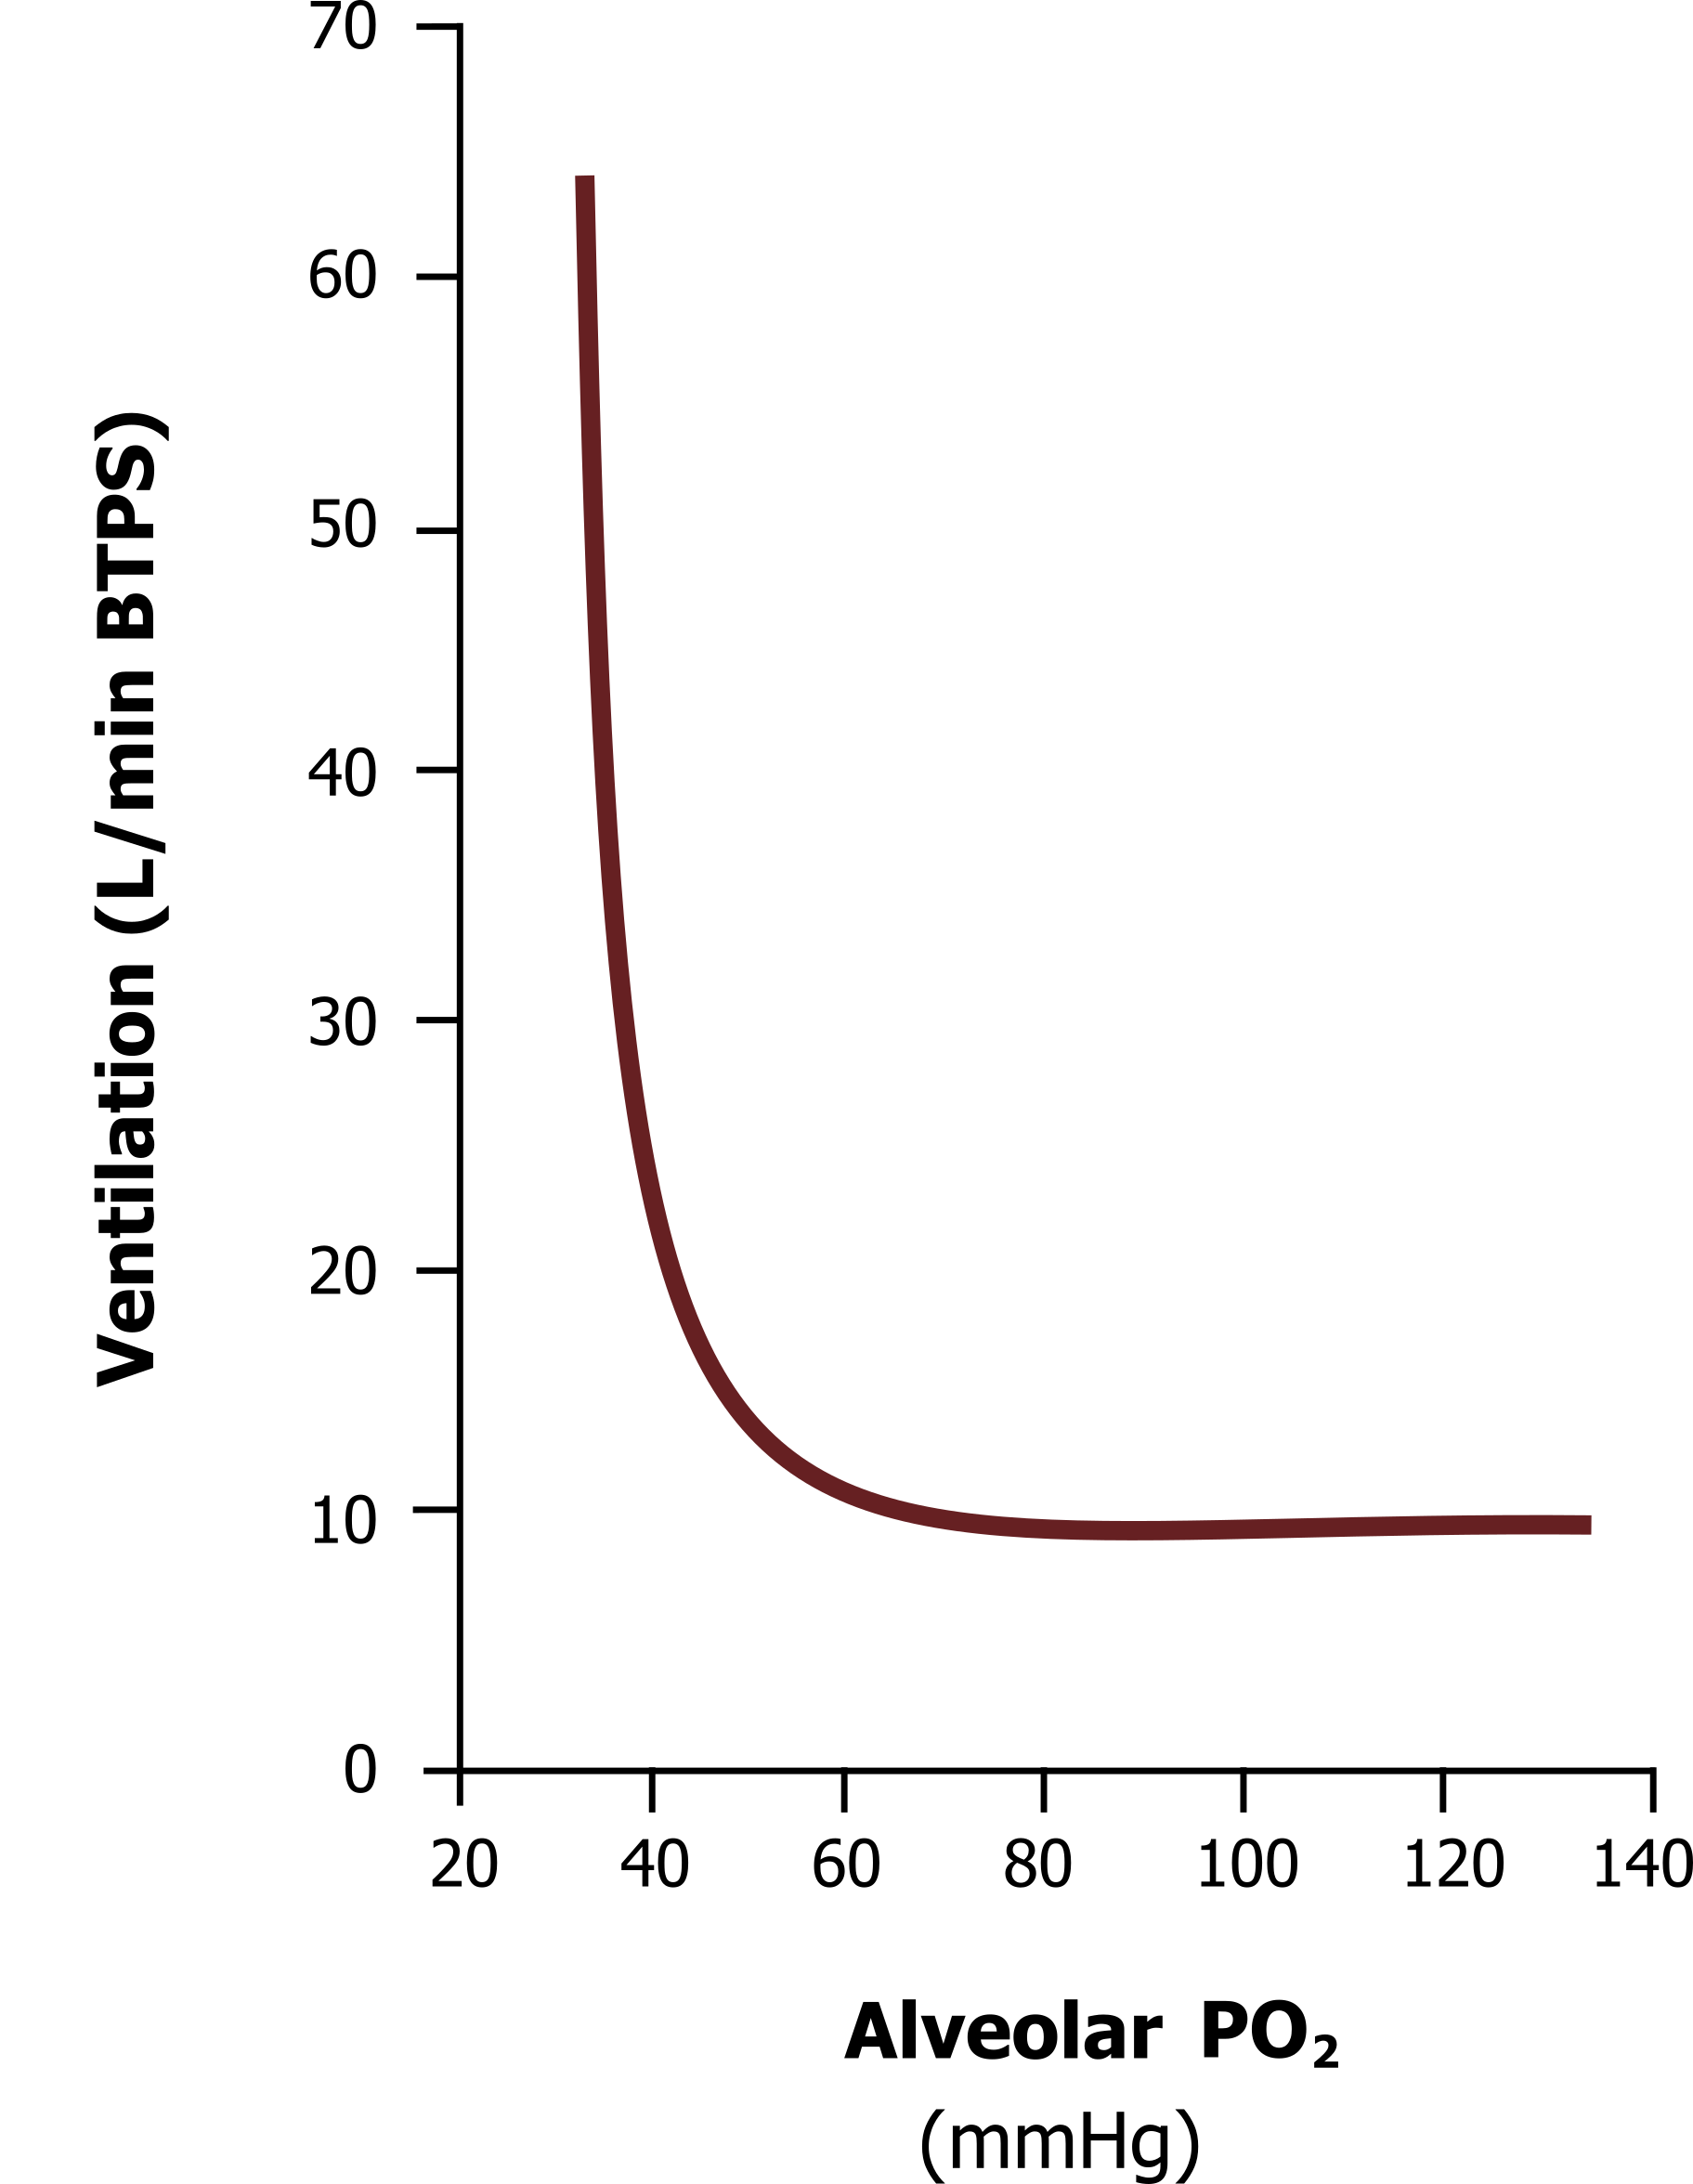
Although the carotid bodies play little role in reflex response to CO2, their response to hypercapnia is more rapid than the central chemoreceptors and so they are capable of breath-by-breath regulation and responding to abrupt changes in arterial PCO2. More importantly the peripheral chemoreceptors are entirely responsible for the response to hypoxia. The mechanism as to how these receptors work is unclear, but cells within the carotid bodies have very high metabolic rates and receive a proportionately high blood flow. It is likely that a decline in oxygen interrupts their metabolism and reduces their inhibitory interaction on neurotransmitter-filled neighboring cells, allowing excitation of the carotid sinus nerve. Their response to a decline in blood oxygen is far from linear. A decline in PO2 below 100 mmHg causes little change in action potential firing, but the rate of firing rapidly increases at PO2s below 50. This is reflected in the hypoxic ventilatory response illustrated in the graph in figure 17.5.
Figure 17.5 shows the hypoxic ventilatory response across a range of alveolar PO2s at normal PCO2. You can see that there is little increase in ventilation until alveolar PO2 is below 55 mmHg, and then ventilation increases very rapidly. This is likely a reflection of the peripheral chemoreceptors, firing rate, which increases rapidly below PO2 of 50 mmHg.
Because of this, the hypoxic ventilatory response normally plays little role in the control of breathing in humans. The hypoxic ventilatory response becomes more significant at altitude when inspired PO2 is low, or more pertinently in lung disease, where alveolar ventilation or gas exchange is compromised.

The hypercapnic ventilatory response (figure 17.6) is much more influential on breathing in humans on a normal day-to-day basis. The response is very linear, with a rise in PCO2 producing a proportionate rise in ventilation, driven of course primarily by the central chemoreceptors, but also contributed to by the afferent activity of the peripheral receptors.
The central and peripheral chemoreceptors keep arterial PCO2 within very fine limits, primarily because of CO2‘s effect on pH. Alveolar ventilation rapidly increases with even a moderate rise in arterial CO2, but can completely stop (apnea) if arterial CO2 falls below normal (~40 mmHg). The wakeful drive to breathe tends to keep CO2 a little lower than the set-point of the chemoreceptors—a point illustrated during sleep, when the brainstem has complete control of breathing and PaCO2 is seen to rise a few mmHg.
The hypercapnic ventilatory response adapts to chronically elevated arterial CO2, such as in severe lung disease. Here we not only see the CSF increase its buffering capacity with increased bicarbonate, but we also see the chemoreceptors change their set-point. It is not uncommon to see COPD patients with arterial PCO2s above 60.
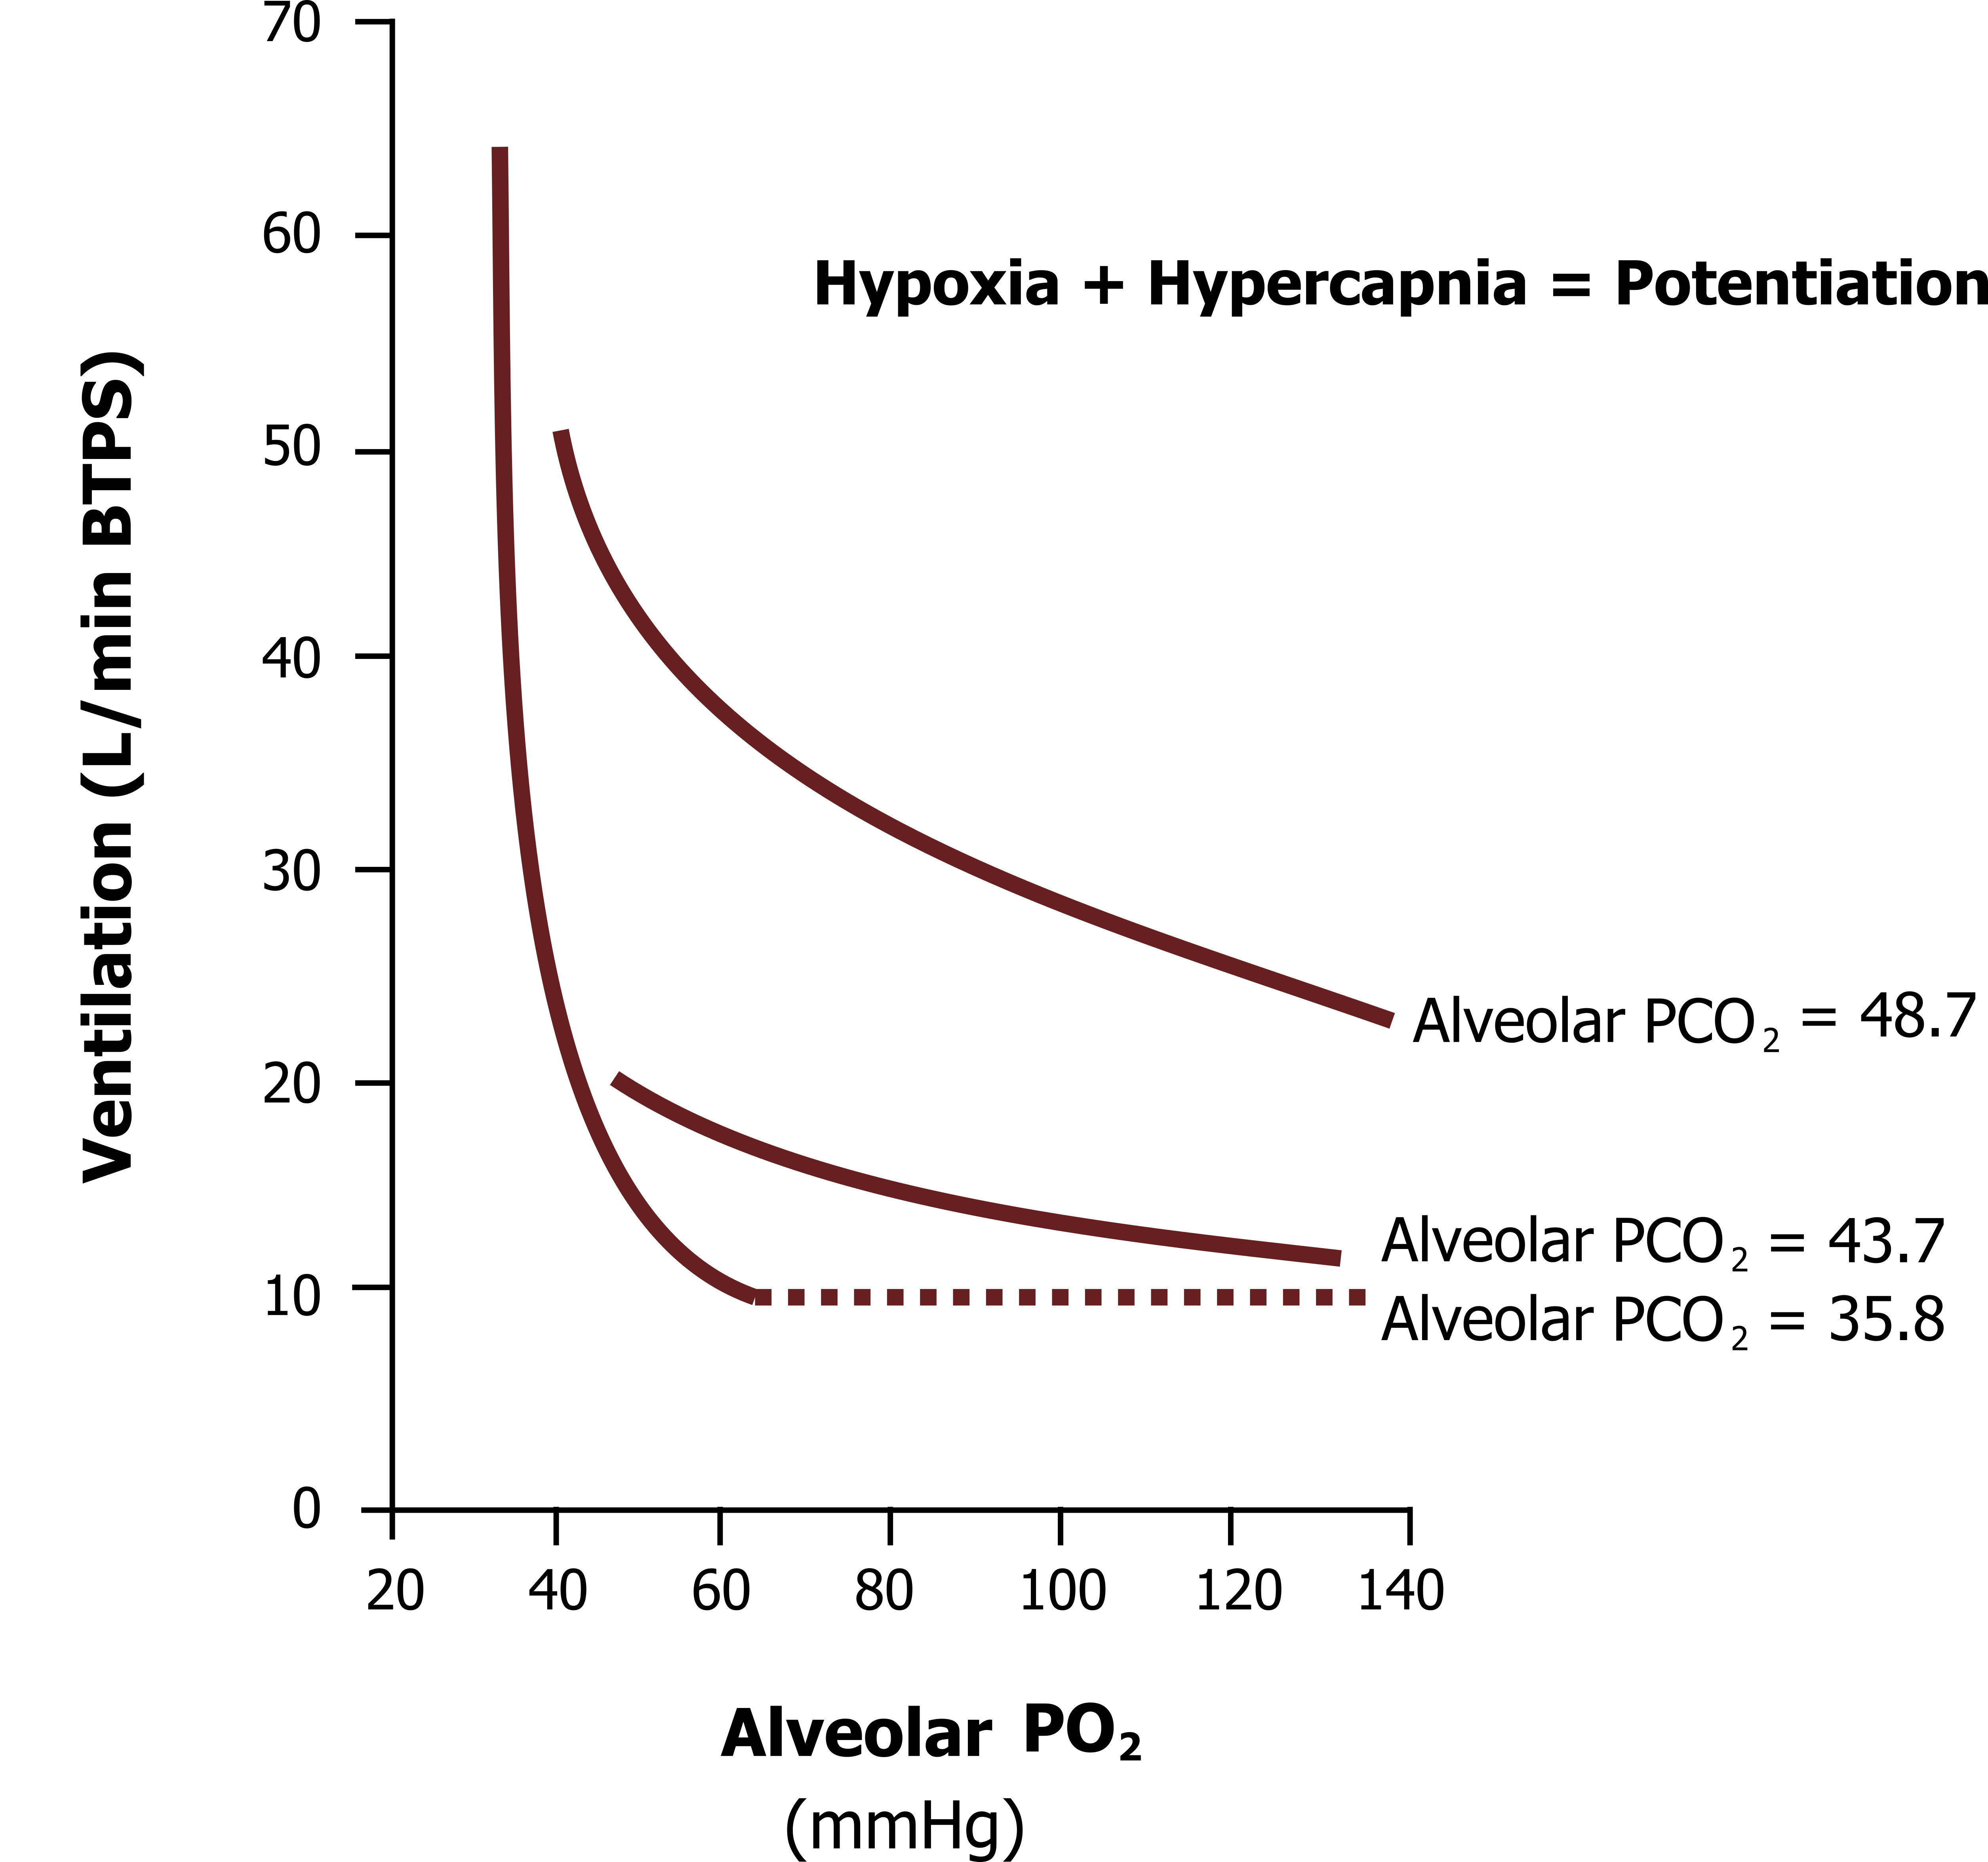
Finally, the hypoxic and hypercapnic ventilatory responses are not independent, and when they are both present at the same time a potentiation is seen (i.e., the response to hypoxic and hypercapnia is greater than the sum of the two individual responses).
The hypoxic ventilatory response we have just looked at was measured at an alveolar PCO2 of 35.8 mmHg. If the same test is performed at higher PCO2s (figure 17.7), then the hypoxic ventilatory response is much greater, as shown by these upwardly shifted lines when alveolar PCO2 is set to 43.7 mmHg and 48.7 mmHg.
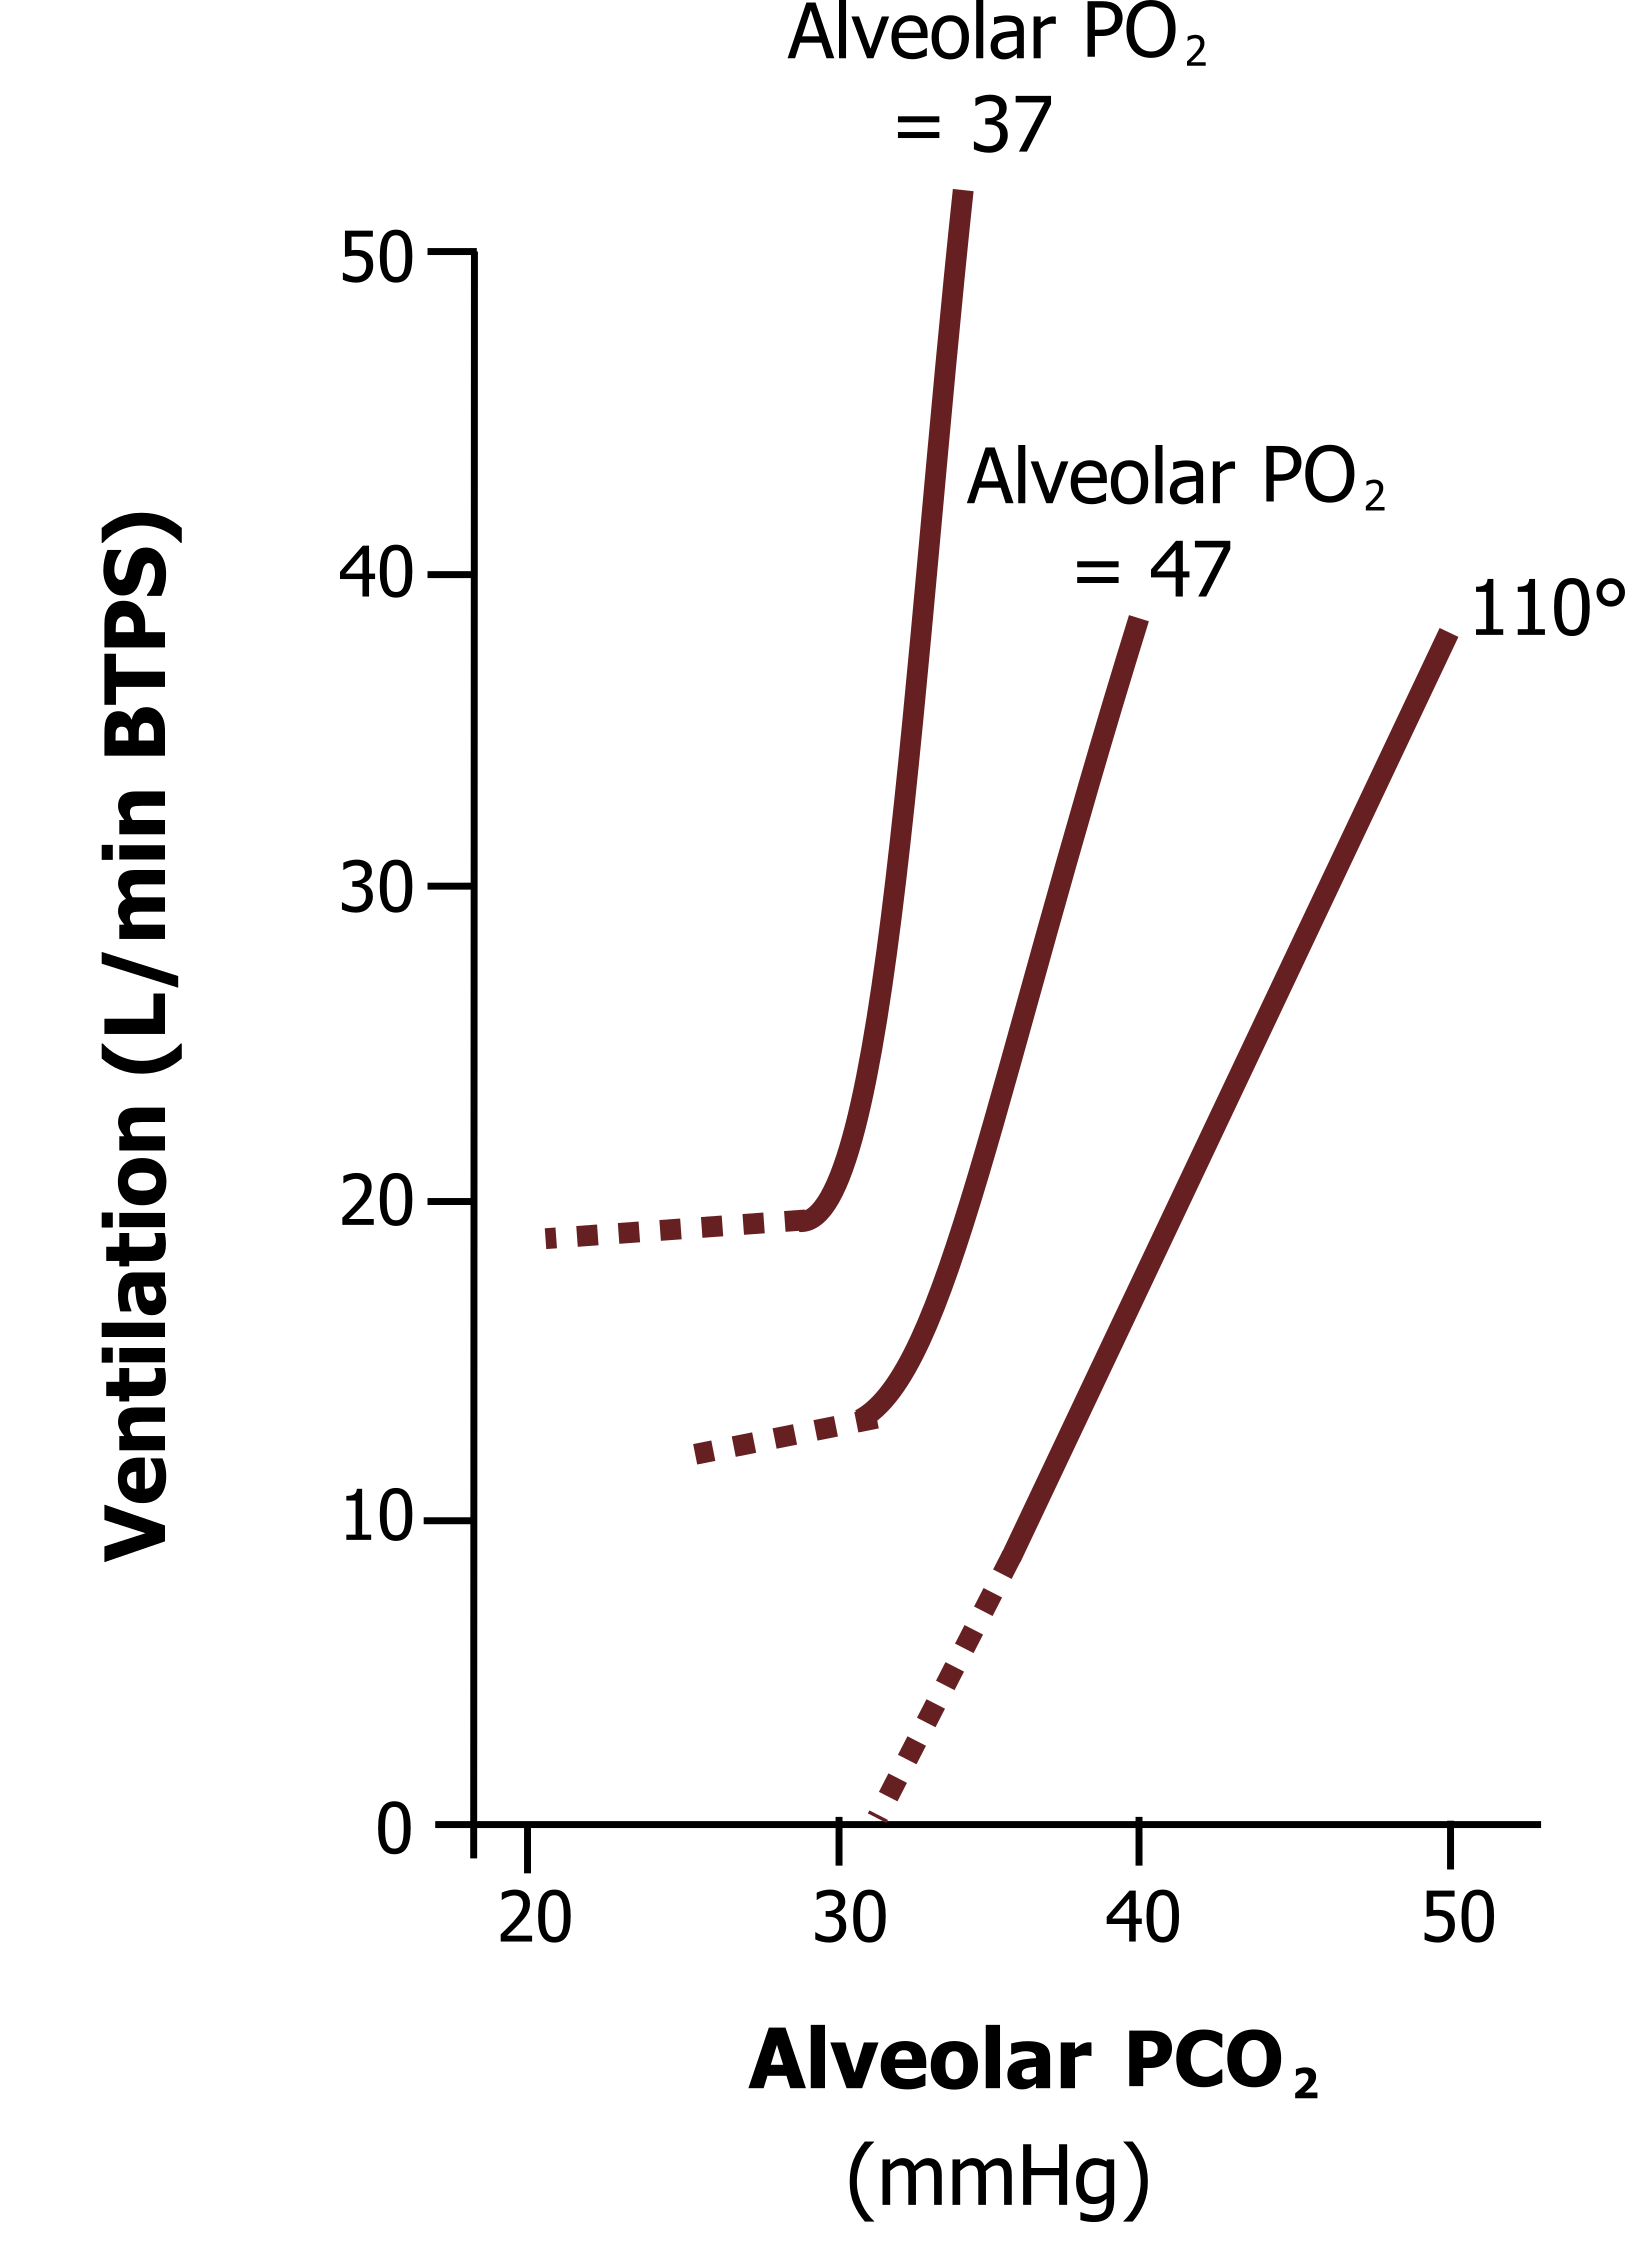
Likewise, the hypercapnic ventilatory response is exaggerated in the presence of hypoxia (see figure 17.8). The hypercapnic ventilatory response we have just looked at was measured at a “normal” alveolar PO2 of 110 mmHg. If the hypercapnic response is measured in the presence of hypoxia, then the curve shifts upward, as shown by the upper lines when alveolar PO2 is reduced to 47 mmHg and 37 mmHg. This potentiation likely comes from the peripheral chemoreceptors, whose firing rate is potentiated in the presence of both stimuli. Consequently, when a patient is both hypoxic and hypercapnic, then they are likely to have a very high drive to breathe, and when this occurs they are likely to feel very short of breath—the topic of the last chapter.
Summary
The chemoreflexes modulate breathing to maintain constant arterial blood gases and pH. These reflexes are initiated by central sensors that respond to hypoxia and peripheral sensors that respond to hypercapnia, hypoxia, and changes in arterial pH. Together these sensors can maintain arterial blood gases within narrow ranges despite large changes in oxygen consumption and CO2 production associated with changes in metabolic rate.
References, Resources, and Further Reading
Text
Levitsky, Michael G. “Chapter 9: Control of Breathing.” In Pulmonary Physiology, 9th ed. New York: McGraw Hill Education, 2018.
West, John B. “Chapter 8: Control of Ventilation—How Gas Exchange Is Regulated.” In Respiratory Physiology: The Essentials, 9th ed. Philadelphia: Wolters Kluwer Health/Lippincott Williams and Wilkins, 2012.
Widdicombe, John G., and Andrew S. Davis. “Chapter 8” and “Chapter 9.” In Respiratory Physiology. Baltimore: University Park Press, 1983.
Figures
Figure 17.1: Brain stem respiratory network. Grey, Kindred. 2022. CC BY 4.0. https://archive.org/details/17.1_20220125
Figure 17.2: Lung volume and pulmonary stretch receptor firing. Grey, Kindred. 2022. CC BY 4.0. https://archive.org/details/17.2_20220125
Figure 17.3: Chemoreflex circuit. Grey, Kindred. 2022. CC BY 4.0. https://archive.org/details/17.3_20220125
Figure 17.4: Peripheral chemoreceptors. Grey, Kindred. 2022. CC BY 4.0. https://archive.org/details/17.4_20220125
Figure 17.5: Hypoxic ventilatory response. Grey, Kindred. 2022. CC BY 4.0. https://archive.org/details/17.5_20220125
Figure 17.6: Hypercapnic ventilatory response. Grey, Kindred. 2022. CC BY 4.0. https://archive.org/details/17.6_20220125
Figure 17.7: Hypoxic ventilatory responses with varying degrees of hypercapnia. Grey, Kindred. 2022. CC BY 4.0. https://archive.org/details/17.7_20220125
Figure 17.8: Hypercapnic ventilatory responses with varying degrees of hypoxia. Grey, Kindred. 2022. CC BY 4.0. https://archive.org/details/17.8_20220125
