14 The Alveolar Gas Equation and Alveolar–Arterial PO2 Difference
Learning objectives
- Use the alveolar gas equation to calculate the alveolar–arterial gradient of oxygen.
- Use alveolar–arterial PO2 differences to distinguish between alveolar hypoventilation and diffusion or V/Q abnormalities.
Calculating alveolar PO₂
Introduction
The difference in PO2 in the arterial system and the alveoli of the normal lung is minimal (i.e., there is usually no substantial alveolar–arterial PO2 difference). A fall in arterial PO2 is indicative of a problem arising with gas exchange, but knowing whether this fall is accompanied by a growing alveolar–arterial PO2 difference or not is a quick, cheap, and powerful diagnostic tool that can hone you in on the source of the arterial desaturation.
This chapter will describe how the alveolar–arterial PO2 difference is calculated and what assumptions can be made from it.
Note
Before you start, a quick reminder that an uppercase A refers to alveolar and lowercase to arterial.
Calculating Alveolar PO₂
Obviously to measure the alveolar–arterial PO2 difference, we need to know both the alveolar and arterial PO2s. The arterial PO2 is routinely measured as part of a blood gas panel, along with arterial PCO2. However, from your understanding of V/Q distribution across the lung, you might appreciate that the measurement of a “typical” alveolar PO2 is difficult, and it must be calculated as an estimate of the whole lung. This is the role of the alveolar gas equation, and we will look at it now, not just because it may appear on your board exams, but primarily because of its clinical importance. As there are several forms of the equation, we will take the easy way out and use the simplest one (figure 14.1), which is accurate for the vast majority of cases you will ever see.
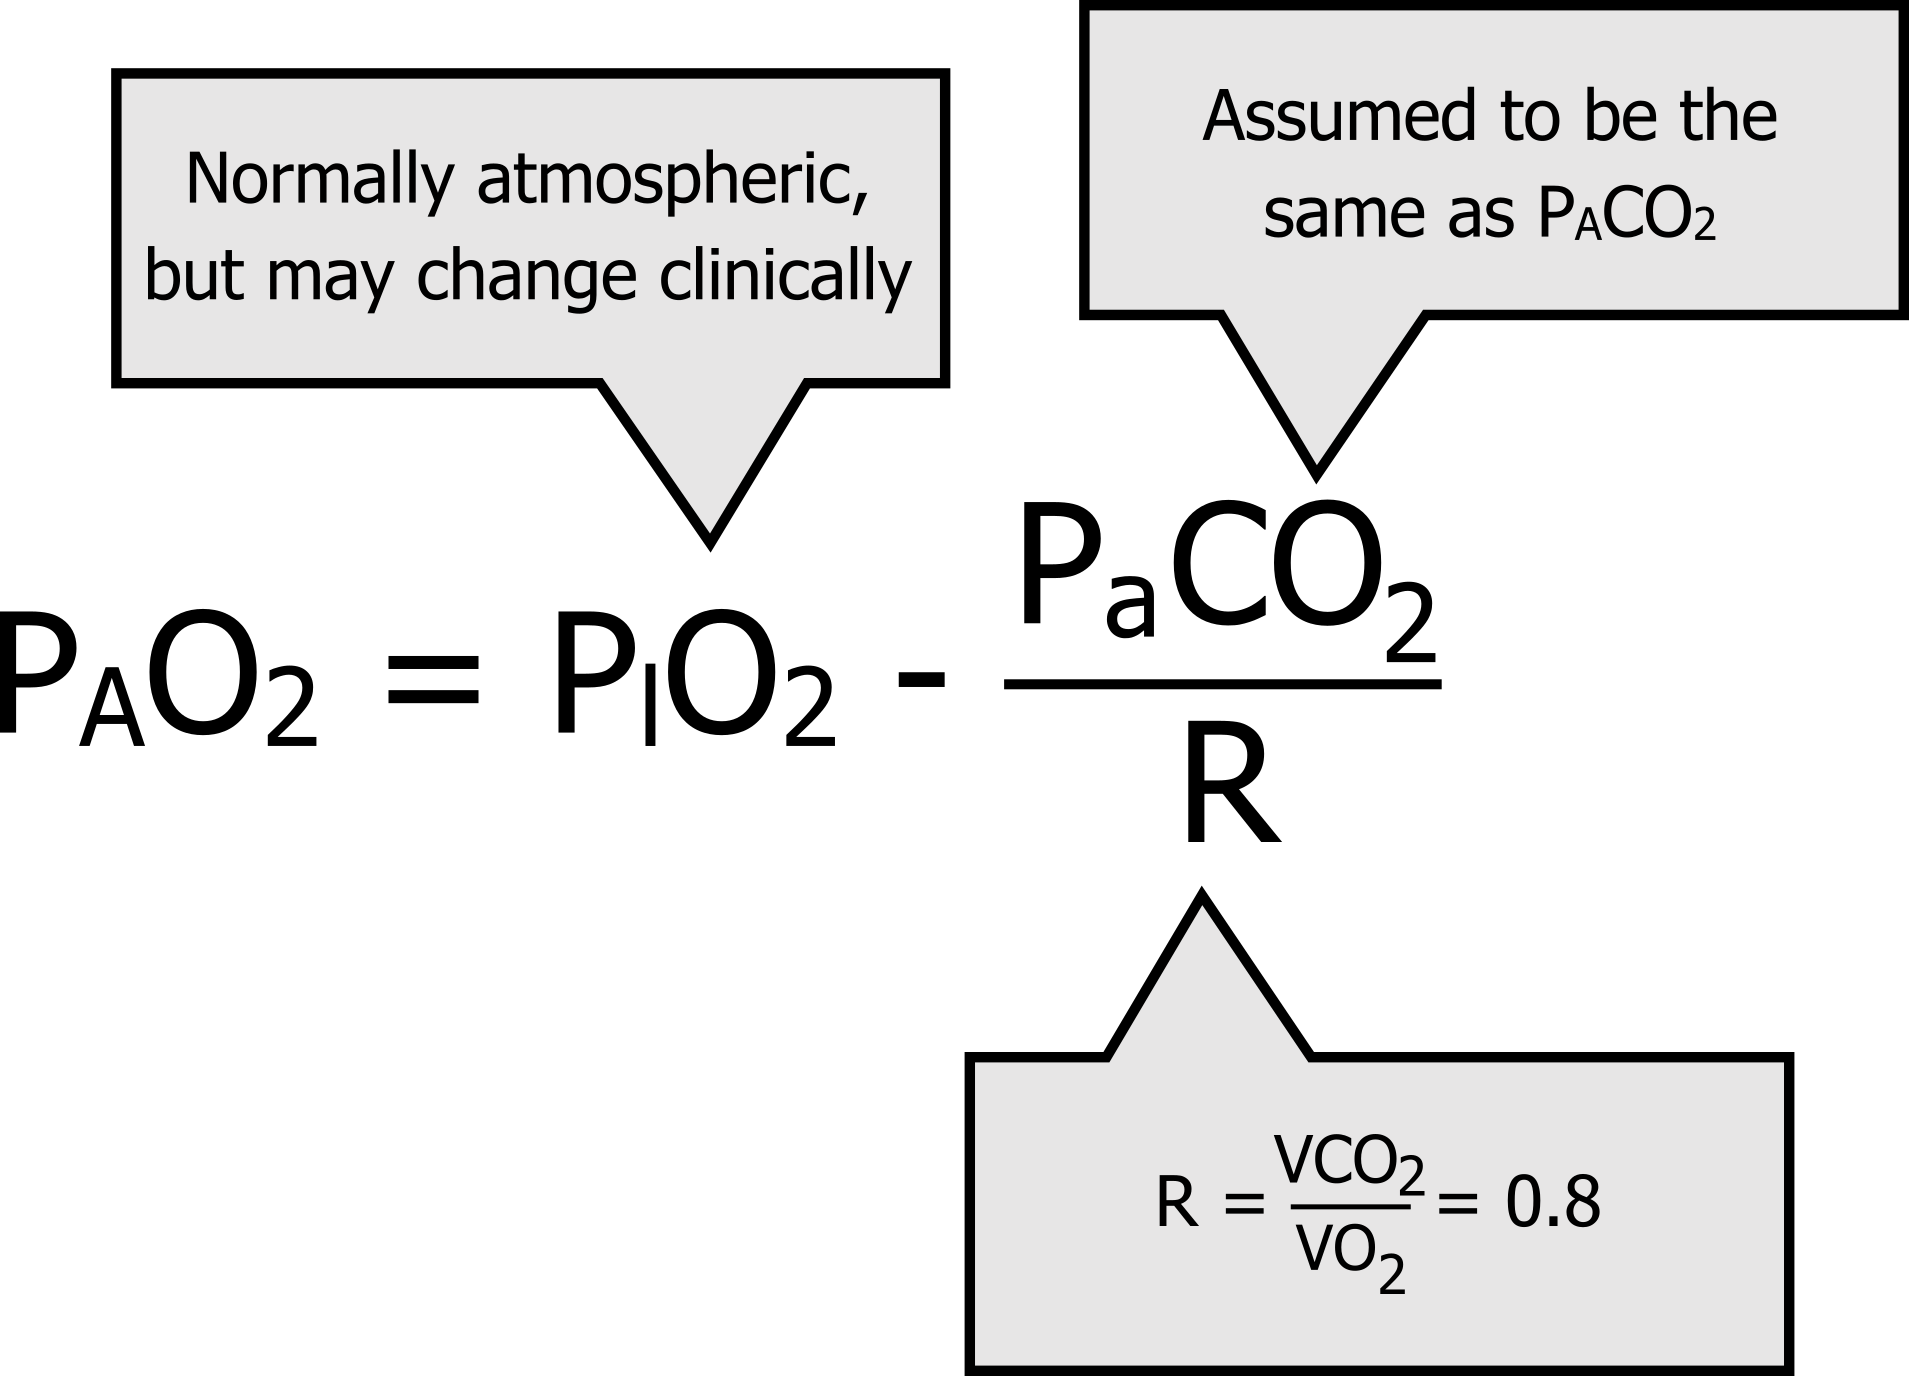
The alveolar gas equation estimates whole lung alveolar PO2 as the inspired PO2 minus the arterial PO2 divided by the respiratory exchange ratio. For those interested in the derivation of the equation, more detailed sources are available. But here, we will just look at the factors involved and try and make this simpler to commit to memory (which I suggest you do).
First let us look at arterial PCO2; this measurement is included in a blood gas panel so will be readily available to you. The alveolar gas equation really needs the alveolar PCO2, but since CO2 is so soluble then we assume that equilibration has taken place and PaCO2 and PACO2 are the same, and we use the number we have at the bedside.
Now let us look at R, or the respiratory exchange ratio. The respiratory exchange ratio describes how much CO2 is produced per unit of oxygen consumed. (Perhaps you can see why we are using this in conjunction with the arterial PCO2; we are relating CO2 production as a proxy measurement of oxygen consumption.) When utilizing carbohydrate as a fuel (the most common situation) there are eight CO2 molecules produced for every ten oxygen molecules burnt, so R is generally 0.8. Lastly, there is the inspired PO2. Generally, breathing room air at sea level this will be ~150 mmHg. But it is important to note that this might change in the clinic if the patient is given oxygen therapy.
So this simple form of the alveolar gas equation really has two basic halves: the amount of oxygen taken into the alveoli (PIO2), and a reflection of the amount that is taken out (PaCO2/R) to supply metabolism.
You will find more complex and accurate forms of this equation, but for the vast majority of situations this one is perfectly adequate and is considerably easier to remember, particularly when some of the numbers we plug in are frequently the same. If we look at normal values (equation 14.1), we see that our equation gets us close to what we have learned to be a normal alveolar PO2. Inspired PO2 at sea level and room air is 150 mmHg, we will assume R is 0.8, and a normal arterial PCO2 is 40 mmHg. Here is the alveolar gas equation with normal values:
Equation 14.1
[latex]P_AO_2 = 150 - \frac{40}{0.8} = 100[/latex]
Now let us see the clinical use of being able to determine alveolar PO2 and thus calculate any alveolar–arterial PO2 difference.
Alveolar–Arterial PO₂ Difference and its Diagnostic Value
Not only knowing what the alveolar and arterial PO2s are, but by how much they differ can tell us where a problem in the process of gas exchange might be occurring. So the PAO2–PaO2 difference has great diagnostic value. Let us return to our schematic of a lung with a ventilated and perfused lung unit and look at a few scenarios, starting with the normal state.
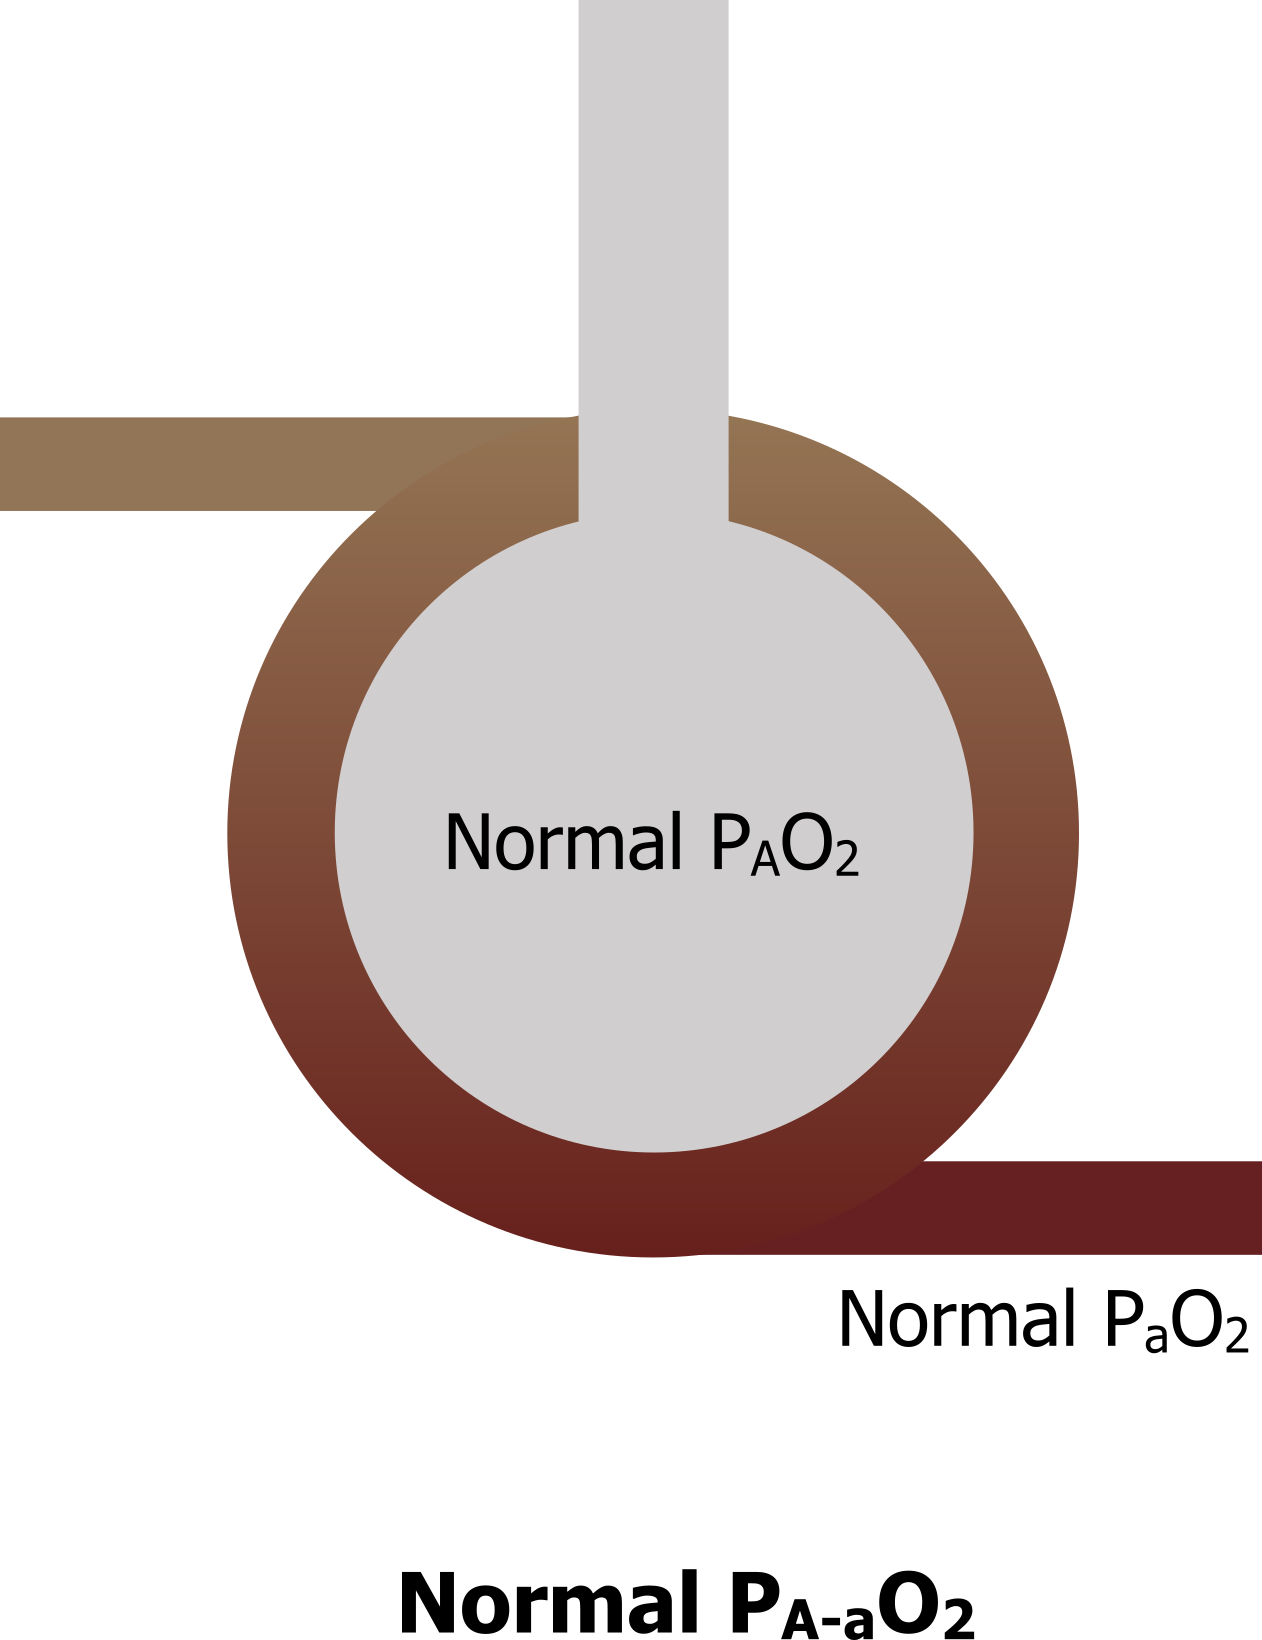
Normal lung: With a well-ventilated and perfused lung (figure 14.2), alveolar PO2 is normal, and when there are no problems with diffusion across the membrane into an adequately perfused blood vessel, arterial PO2 is normal as well. Thus the difference between alveolar and arterial PO2 is minimal and normal, and in reality for a young healthy person is no more than 5–10 mmHg (note, however, this difference increases with age).
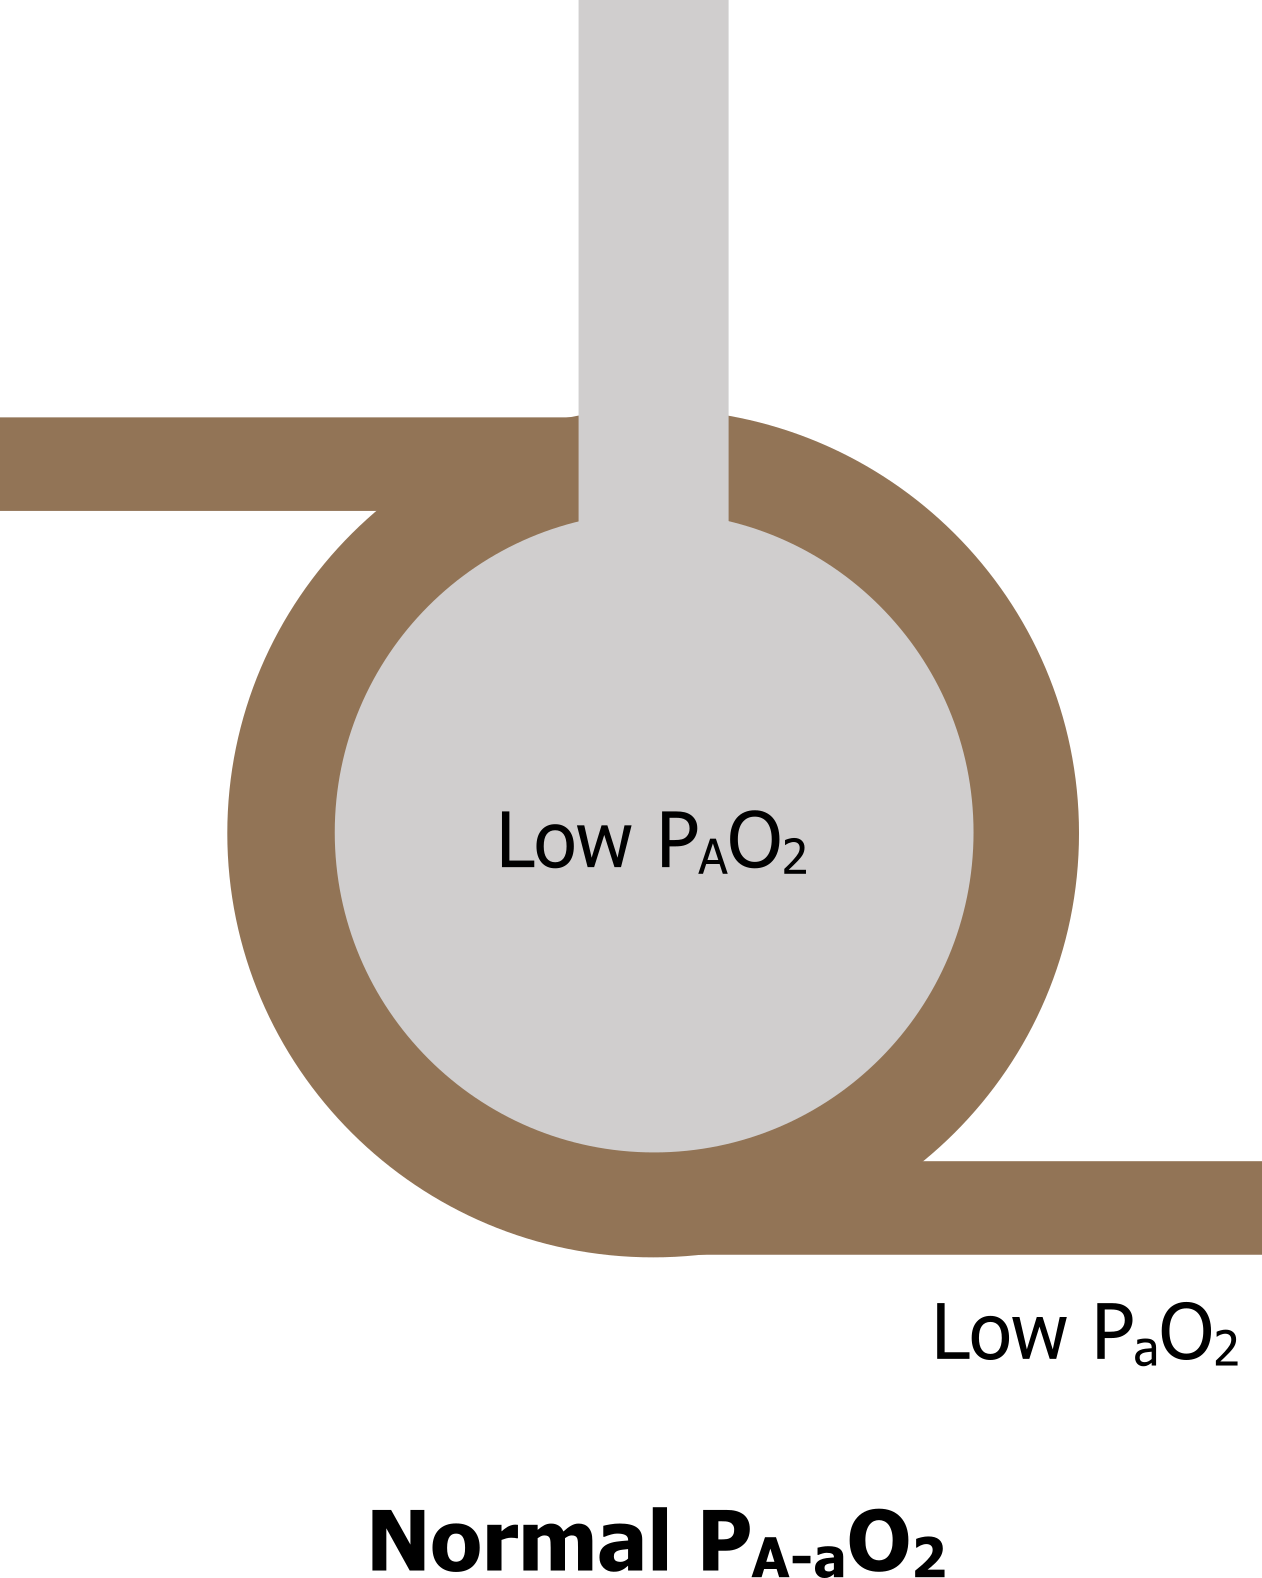
Hypoventilation: Now let us look at a case of where the alveolus is inadequately ventilated (figure 14.3): perhaps a patient has been given a high enough dose of opioid for pain relief and it has caused respiratory depression, so the patient no longer breathes enough to achieve sufficient gas exchange. This will lead to a decline in alveolar PO2 and consequently a fall in arterial PO2 as well. However, because the alveolar and arterial PO2s have both decreased, then the difference between the two of them remains the same. So we see low alveolar PO2, low arterial PO2, but a normal A–a PO2 difference.
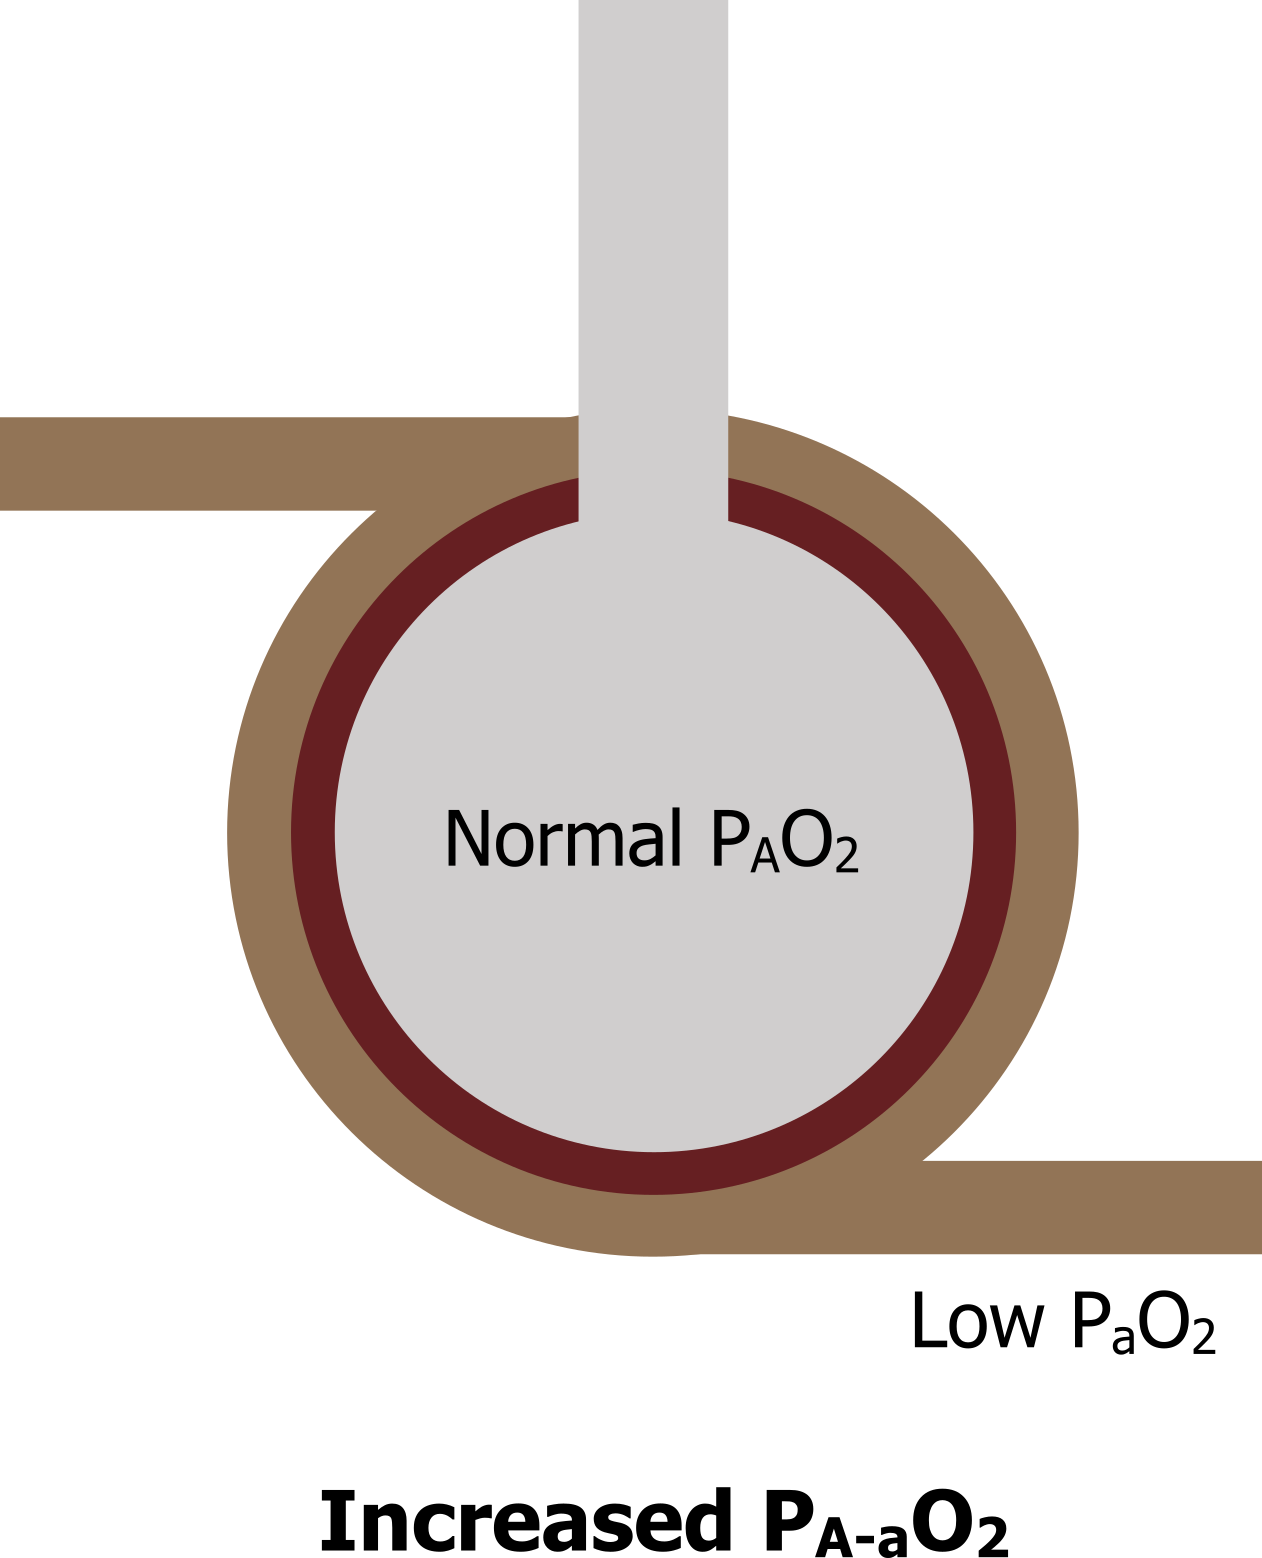
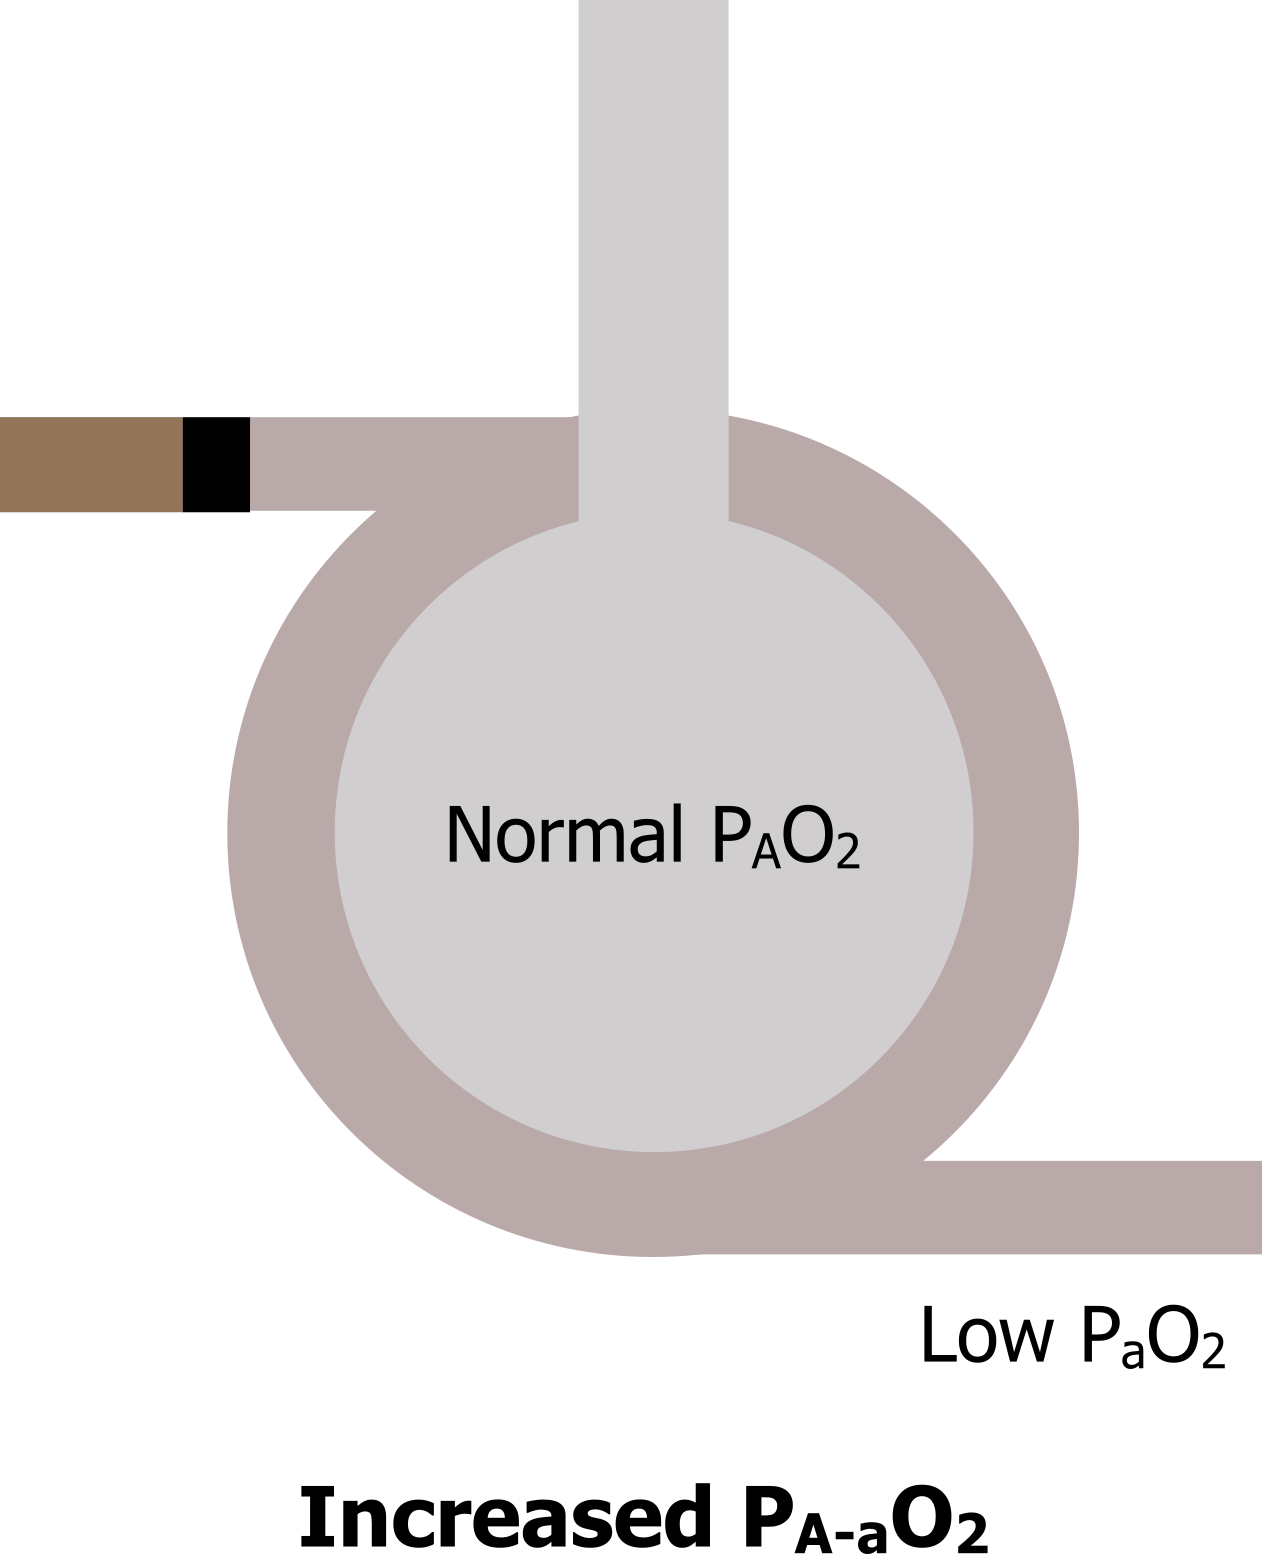
Impaired diffusion: Now let us look at a patient with a diffusion abnormality—perhaps some pathological process has caused thickening of the alveolar membranes. Here the alveolus is still adequately ventilated, so alveolar PO2 remains high or at least the same (figure 14.4). But although blood is passing the ventilated region, the thickened membranes prevent diffusion of oxygen into the blood, and arterial PO2 does not equilibrate and so is lower. As a consequence, the A–a difference increases. So this scenario results in a normal alveolar PO2, a low arterial PO2, and an increased difference between the two.
Inadequate perfusion: Now let us look at a last scenario where perfusion has been stopped, perhaps by a pulmonary embolus (figure 14.5). Ventilation still reaches the region, but there is no perfusion; this is a form of V/Q mismatch. Alveolar PO2 remains normal because air still reaches the region, but with no perfusion and therefore no gas exchange arterial PO2 will fall. This, again, results in an increased A–a PO2 difference.
So what you should see from the summary in table 14.1 is that all three abnormalities cause a decrease in arterial PO2, so all three patients are likely to present with low arterial saturations. But when blood gases are taken and the alveolar–arterial PO2 difference is calculated, then one or more of our abnormalities could be ruled out. If there is an increased difference, you know it is not hypoventilation. If there is no increase in A–a difference, you know it is neither a diffusion problem nor a V/Q mismatch.
Summary
These examples to illustrate the point are rather specific, but generally knowing the alveolar and arterial PO2s and calculating A–a PO2 difference allows you to distinguish whether a decline in arterial PO2 is due to a problem getting oxygen down into the lung, or a problem getting oxygen from lung to blood. So the alveolar equation is a simple equation, but it forms a powerful tool.
| State | Effect on PAO2 | Effect on PaO2 | Effect on A–a PO2 |
|---|---|---|---|
| Normal | Normal | Normal | Normal (5–10 mmHg) |
| Hypoventilation | Decrease | Decrease | No change |
| Diffusion abnormality | Normal | Decrease | Increase |
| Lack of perfusion | Normal | Decrease | Increase |
Table 14.1: Summary of Alveolar-arterial PO2 difference.
References, Resources, and Further Reading
Text
Levitsky, Michael G. “Chapter 3: Alveolar Ventilation.” In Pulmonary Physiology, 9th ed. New York: McGraw Hill Education, 2018.
West, John B. “Chapter 5: Ventilation–Perfusion Relationships—How Matching of Gas and Blood Determines Gas Exchange.” In Respiratory Physiology: The Essentials, 9th ed. Philadelphia: Wolters Kluwer Health/Lippincott Williams and Wilkins, 2012.
Figures
Figure 14.1: The alveolar gas equation. Grey, Kindred. 2022. CC BY 4.0. https://archive.org/details/14.1_20220125
Figure 14.2: Alveolar and arterial oxygen tensions in the normal state lead to a normal alveolar–arterial PO2 difference. Grey, Kindred. 2022. CC BY 4.0. https://archive.org/details/14.2_20220125
Figure 14.3: Alveolar and arterial oxygen tensions during hypoventilation result in a normal alveolar–arterial PO2 difference. Grey, Kindred. 2022. CC BY 4.0. https://archive.org/details/14.3_20220125
Figure 14.4: Diffusion abnormalities lead to an increased alveolar–arterial PO2 difference. Grey, Kindred. 2022. CC BY 4.0. https://archive.org/details/14.4_20220125
Figure 14.5: Perfusion abnormalities lead to an increased alveolar–arterial PO2 difference. Grey, Kindred. 2022. CC BY 4.0. https://archive.org/details/14.5_20220125
