8 Earth History
Learning Objectives
By the end of this chapter, students should be able to:
- Describe the turbulent beginning of Earth during the Hadean and Archean Eons.
- Identify the transition to modern atmosphere, plate tectonics, and evolution that occurred in the Proterozoic Eon.
- Describe the Paleozoic evolution and extinction of invertebrates with hard parts, fish, amphibians, reptiles, tetrapods, and land plants; and tectonics and sedimentation associated with the supercontinent Pangea.
- Describe the Mesozoic evolution and extinction of birds, dinosaurs, and mammmals; and tectonics and sedimentation associated with the breakup of Pangea.
- Describe the Cenozoic evolution of mammals and birds, paleoclimate, and tectonics that shaped the modern world.
Entire courses and careers have been based on the wide-ranging topics covering Earth’s history. Throughout the long history of Earth, change has been the norm. Looking back in time, an untrained eye would see many unfamiliar life forms and terrains. The main topics studied in Earth history are paleogeography, paleontology, and paleoecology and paleoclimatology—respectively, past landscapes, past organisms, past ecosystems, and past environments. This chapter will cover briefly the origin of the universe and the 4.6 billion year history of Earth. This Earth history will focus on the major physical and biological events in each Eons and Era.
8.1 Hadean Eon
Geoscientists use the geological time scale to assign relative age names to events and rocks, separating major events in Earth’s history based on significant changes as recorded in rocks and fossils. This section summarizes the most notable events of each major time interval. For a breakdown on how these time intervals are chosen and organized, see chapter 7.
The Hadean Eon, named after the Greek god and ruler of the underworld Hades, is the oldest eon and dates from 4.5–4.0 billion years ago.
This time represents Earth’s earliest history, during which the planet was characterized by a partially molten surface, volcanism, and asteroid impacts. Several mechanisms made the newly forming Earth incredibly hot: gravitational compression, radioactive decay, and asteroid impacts. Most of this initial heat still exists inside the Earth. The Hadean was originally defined as the birth of the planet occurring 4.0 billion years ago and preceding the existence of many rocks and life forms. However, geologists have dated minerals at 4.4 billion years, with evidence that liquid water was present. There is possibly even evidence of life existing over 4.0 billion years ago. However, the most reliable record for early life, the microfossil record, starts at 3.5 billion years ago.
8.1.1 Origin of Earth’s Crust
As Earth cooled from its molten state, minerals started to crystallize and settle resulting in a separation of minerals based on density and the creation of the crust, mantle, and core. The earliest Earth was chiefly molten material and would have been rounded by gravitational forces so it resembled a ball of lava floating in space. As the outer part of the Earth slowly cooled, the high melting-point minerals (see Bowen’s Reaction Series in chapter 4) formed solid slabs of early crust. These slabs were probably unstable and easily reabsorbed into the liquid magma until the Earth cooled enough to allow numerous larger fragments to form a thin primitive crust. Scientists generally assume this crust was oceanic and mafic in composition, and littered with impacts, much like the Moon’s current crust. There is still some debate over when plate tectonics started, which would have led to the formation of continental and felsic crust. Regardless of this, as Earth cooled and solidified, less dense felsic minerals floated to the surface of the Earth to form the crust, while the denser mafic and ultramafic materials sank to form the mantle and the highest-density iron and nickel sank into the core. This differentiated the Earth from a homogenous planet into a heterogeneous one with layers of felsic crust, mafic crust, ultramafic mantle, and iron and nickel core.
8.1.2 Origin of the Moon
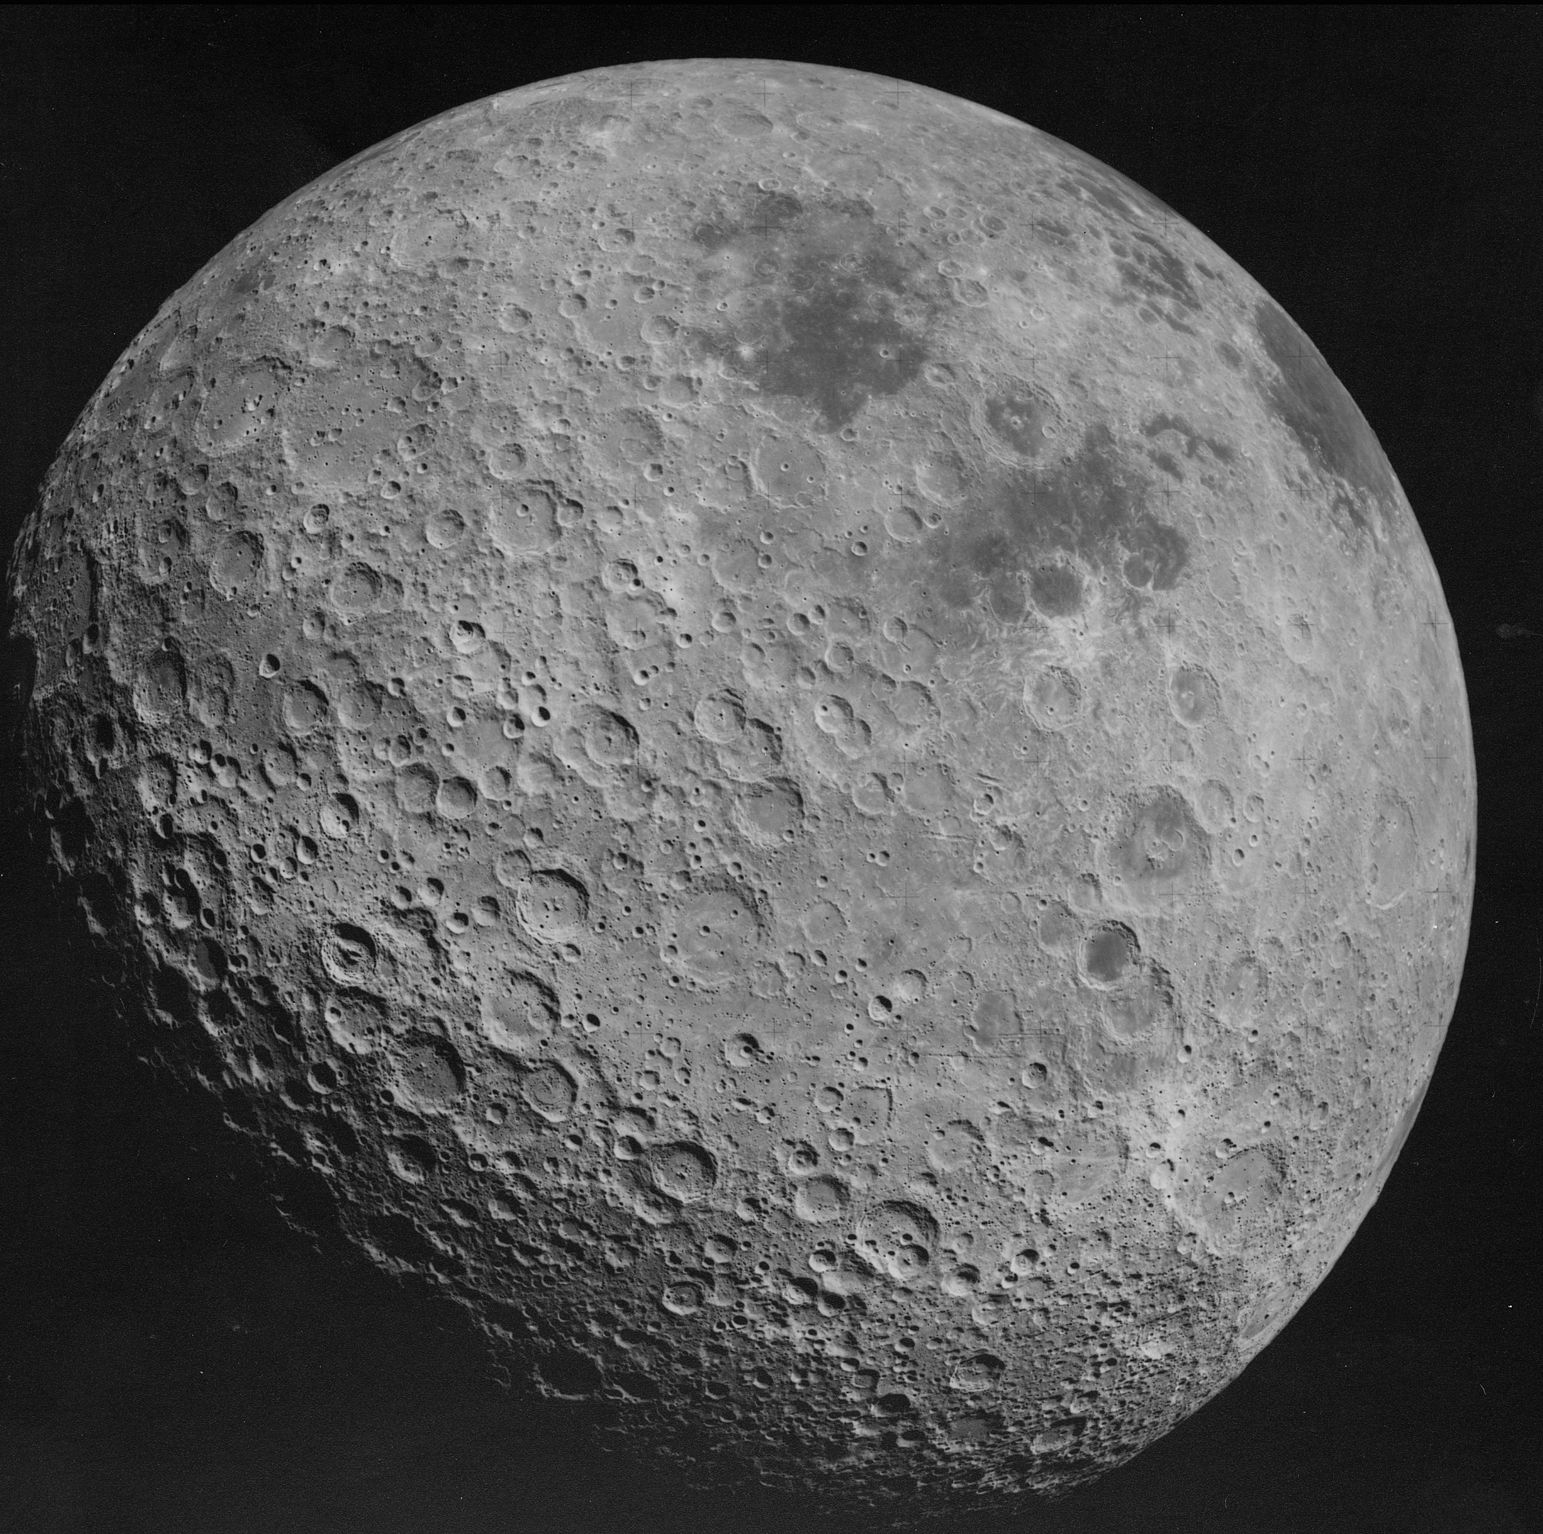
Several unique features of Earth’s Moon have prompted scientists to develop the current hypothesis about its formation. The Earth and Moon are tidally locked, meaning that as the Moon orbits, one side always faces the Earth and the opposite side is not visible to us. Also and most importantly, the chemical compositions of the Earth and Moon show nearly identical isotope ratios and volatile content. Apollo missions returned from the Moon with rocks that allowed scientists to conduct very precise comparisons between Moon and Earth rocks. Other bodies in the solar system and meteorites do not share the same degree of similarity and show much higher variability. If the Moon and Earth formed together, this would explain why they are so chemically similar.
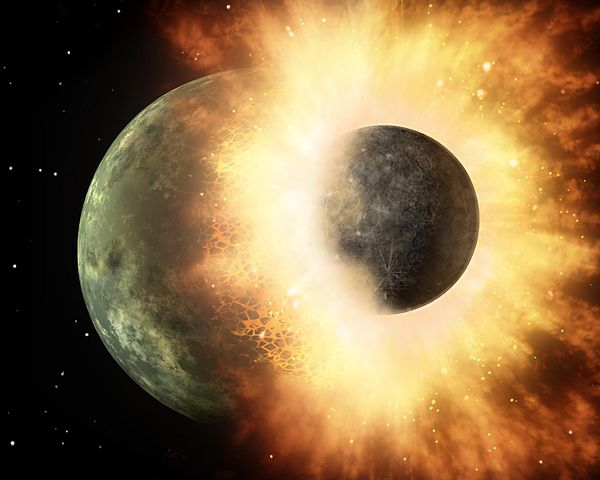
Many ideas have been proposed for the origin of the Moon: The Moon could have been captured from another part of the solar system and formed in place together with the Earth, or the Moon could have been ripped out of the early Earth. None of proposed explanations can account for all the evidence. The currently prevailing hypothesis is the giant-impact hypothesis. It proposes a body about half of Earth’s size must have shared at least parts of Earth’s orbit and collided with it, resulting in a violent mixing and scattering of material from both objects. Both bodies would be composed of a combination of materials, with more of the lower density splatter coalescing into the Moon. This may explain why the Earth has a higher density and thicker core than the Moon.

Video 8.1: Evolution of the Moon.
If you are using an offline version of this text, access this YouTube video via the QR code.
8.1.3 Origin of Earth’s Water
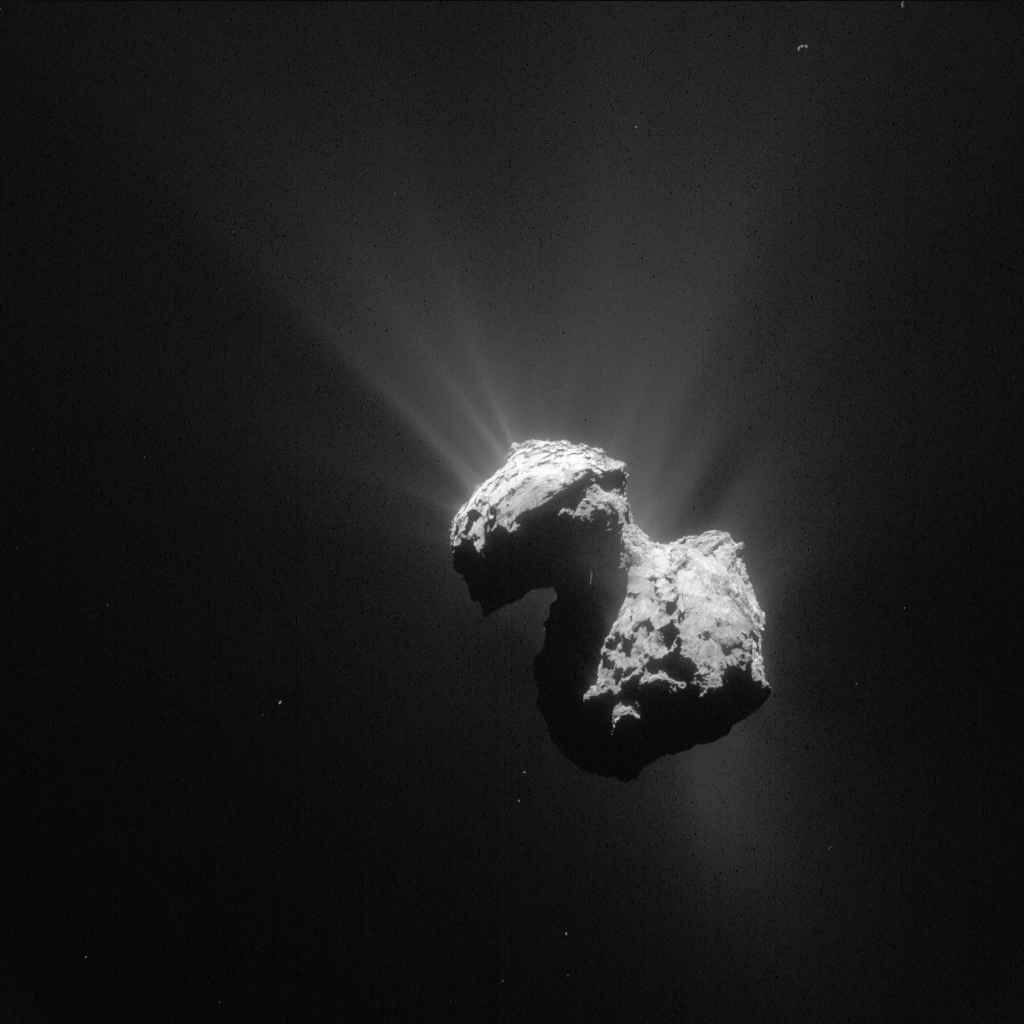
Explanations for the origin of Earth’s water include volcanic outgassing, comets, and meteorites. The volcanic outgassing hypothesis for the origin of Earth’s water is that it originated from inside the planet, and emerged via tectonic processes as vapor associated with volcanic eruptions. Since all volcanic eruptions contain some water vapor, at times more than 1% of the volume, these alone could have created Earth’s surface water. Another likely source of water was from space. Comets are a mixture of dust and ice, with some or most of that ice being frozen water. Seemingly dry meteors can contain small but measurable amounts of water, usually trapped in their mineral structures. During heavy bombardment periods later in Earth’s history, its cooled surface was pummeled by comets and meteorites, which could be why so much water exists above ground. There isn’t a definitive answer for what process is the source of ocean water. Earth’s water isotopically matches water found in meteorites much better than that of comets. However, it is hard to know if Earth processes could have changed the water’s isotopic signature over the last 4-plus billion years. It is possible that all three sources contributed to the origin of Earth’s water.

Take this quiz to check your comprehension of this section.
If you are using an offline version of this text, access the quiz for section 8.1 via the QR code.
8.2 Archean Eon
The Archean Eon, which lasted from 4.0–2.5 billion years ago, is named after the Greek word for beginning. This eon represents the beginning of the rock record. Although there is current evidence that rocks and minerals existed during the Hadean Eon, the Archean has a much more robust rock and fossil record.
8.2.1 Late Heavy Bombardment
Objects were chaotically flying around at the start of the solar system, building the planets and moons. There is evidence that after the planets formed, about 4.1–3.8 billion years ago, a second large spike of asteroid and comet impacted the Earth and Moon in an event called late heavy bombardment. Meteorites and comets in stable or semi-stable orbits became unstable and started impacting objects throughout the solar system. In addition, this event is called the lunar cataclysm because most of the Moons craters are from this event. During late heavy bombardment, the Earth, Moon, and all planets in the solar system were pummeled by material from the asteroid and Kuiper belts. Evidence of this bombardment was found within samples collected from the Moon.
It is universally accepted that the solar system experienced extensive asteroid and comet bombardment at its start; however, some other process must have caused the second increase in impacts hundreds of millions of years later. A leading theory blames gravitational resonance between Jupiter and Saturn for disturbing orbits within the asteroid and Kuiper belts based on a similar process observed in the Eta Corvi star system.
8.2.2 Origin of the Continents
In order for plate tectonics to work as it does currently, it necessarily must have continents. However, the easiest way to create continental material is via assimilation and differentiation of existing continents (see chapter 4). This chicken-and-egg quandary over how continents were made in the first place is not easily answered because of the great age of continental material and how much evidence has been lost during tectonics and erosion. While the timing and specific processes are still debated, volcanic action must have brought the first continental material to the Earth’s surface during the Hadean, 4.4 billion years ago. This model does not solve the problem of continent formation, since magmatic differentiation seems to need thicker crust. Nevertheless, the continents formed by some incremental process during the early history of Earth. The best idea is that density differences allowed lighter felsic materials to float upward and heavier ultramafic materials and metallic iron to sink. These density differences led to the layering of the Earth, the layers that are now detected by seismic studies. Early protocontinents accumulated felsic materials as developing plate–tectonic processes brought lighter material from the mantle to the surface.
The first solid evidence of modern plate tectonics is found at the end of the Archean, indicating at least some continental lithosphere must have been in place. This evidence does not necessarily mark the starting point of plate tectonics; remnants of earlier tectonic activity could have been erased by the rock cycle.
The stable interiors of the current continents are called cratons and were mostly formed in the Archean Eon. A craton has two main parts: the shield, which is crystalline basement rock near the surface, and the platform made of sedimentary rocks covering the shield. Most cratons have remained relatively unchanged with most tectonic activity having occurred around cratons instead of within them. Whether they were created by plate tectonics or another process, Archean continents gave rise to the Proterozoic continents that now dominate our planet.
The general guideline as to what constitutes a continent and differentiates oceanic from continental crust is under some debate. At passive margins, continental crust grades into oceanic crust at passive margins, making a distinction difficult. Even island-arc and hot-spot material can seem more closely related to continental crust than oceanic. Continents usually have a craton in the middle with felsic igneous rocks. There is evidence that submerged masses like Zealandia, that includes present-day New Zealand, would be considered a continent. Continental crust that does not contain a craton is called a continental fragment, such as the island of Madagascar off the east coast of Africa.
8.2.3 First Life on Earth
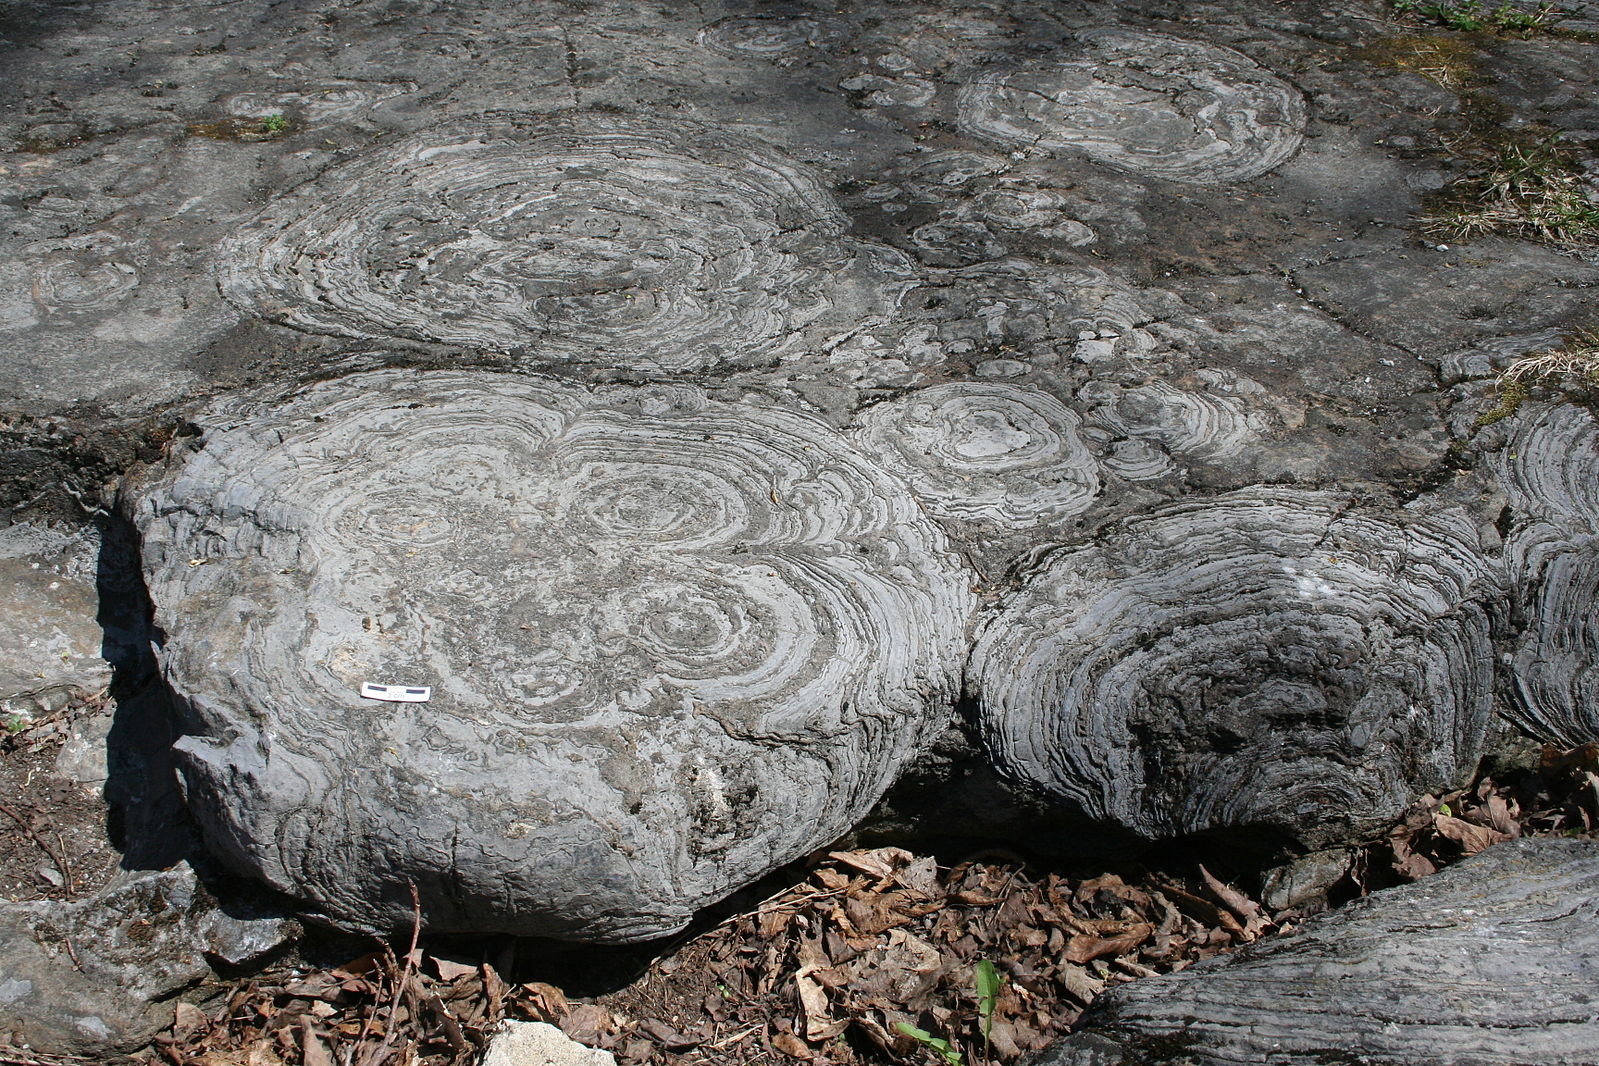
Life most likely started during the late Hadean or early Archean Eons. The earliest evidence of life are chemical signatures, microscopic filaments, and microbial mats. Carbon found in 4.1 billion year old zircon grains have a chemical signature suggesting an organic origin. Other evidence of early life are 3.8–4.3 billion-year-old microscopic filaments from a hydrothermal vent deposit in Quebec, Canada. While the chemical and microscopic filaments evidence is not as robust as fossils, there is significant fossil evidence for life at 3.5 billion years ago. These first well-preserved fossils are photosynthetic microbial mats, called stromatolites, found in Australia.
Although the origin of life on Earth is unknown, hypotheses include a chemical origin in the early atmosphere and ocean, deep-sea hydrothermal vents, and delivery to Earth by comets or other objects. One hypothesis is that life arose from the chemical environment of the Earth’s early atmosphere and oceans, which was very different than today. The oxygen-free atmosphere produced a reducing environment with abundant methane, carbon dioxide, sulfur, and nitrogen compounds. This is what the atmosphere is like on other bodies in the solar system. In the famous Miller-Urey experiment, researchers simulated early Earth’s atmosphere and lightning within a sealed vessel. After igniting sparks within the vessel, they discovered the formation of amino acids, the fundamental building blocks of proteins. In 1977, when scientists discovered an isolated ecosystem around hydrothermal vents on a deep-sea mid-ocean ridge (see chapter 4), it opened the door for another explanation of the origin of life. The hydrothermal vents have a unique ecosystem of critters with chemosynthesis as the foundation of the food chain instead of photosynthesis. The ecosystem is deriving its energy from hot chemical-rich waters pouring out of underground towers. This suggests that life could have started on the deep ocean floor and derived energy from the heat from the Earth’s interior via chemosynthesis. Scientists have since expanded the search for life to more unconventional places, like Jupiter’s icy moon Europa.

Video 8.2: Animation of the original Miller-Urey 1959 experiment that simulated the early atmosphere and created amino acids from simple elements and compounds.
If you are using an offline version of this text, access this YouTube video via the QR code.
Another possibility is that life or its building blocks came to Earth from space, carried aboard comets or other objects. Amino acids, for example, have been found within comets and meteorites. This intriguing possibility also implies a high likelihood of life existing elsewhere in the cosmos.

Take this quiz to check your comprehension of this section.
If you are using an offline version of this text, access the quiz for section 8.2 via the QR code.
8.3 Proterozoic Eon
The Proterozoic Eon, meaning “earlier life,” comes after the Archean Eon and ranges from 2.5 billion to 541 million years old. During this time, most of the central parts of the continents had formed and plate tectonic processes had started. Photosynthesis by microbial organisms, such as single-celled cyanobacteria, had been slowly adding oxygen to the oceans. As cyanobacteria evolved into multicellular organisms, they completely transformed the oceans and later the atmosphere by adding massive amounts of free oxygen gas (O2) and initiated what is called the Great Oxygenation Event (GOE). This drastic environmental change decimated the anaerobic bacteria, which could not survive in the presence of free oxygen. On the other hand, aerobic organisms could thrive in ways they could not earlier.
An oxygenated world also changed the chemistry of the planet in significant ways. For example, iron remained in solution in the non-oxygenated environment of the earlier Archean Eon. In chemistry, this is known as a reducing environment. Once the environment was oxygenated, iron combined with free oxygen to form solid precipitates of iron oxide, such as the mineral hematite or magnetite. These precipitates accumulated into large mineral deposits with red chert known as banded-iron formations, which are dated at about 2 billion years.
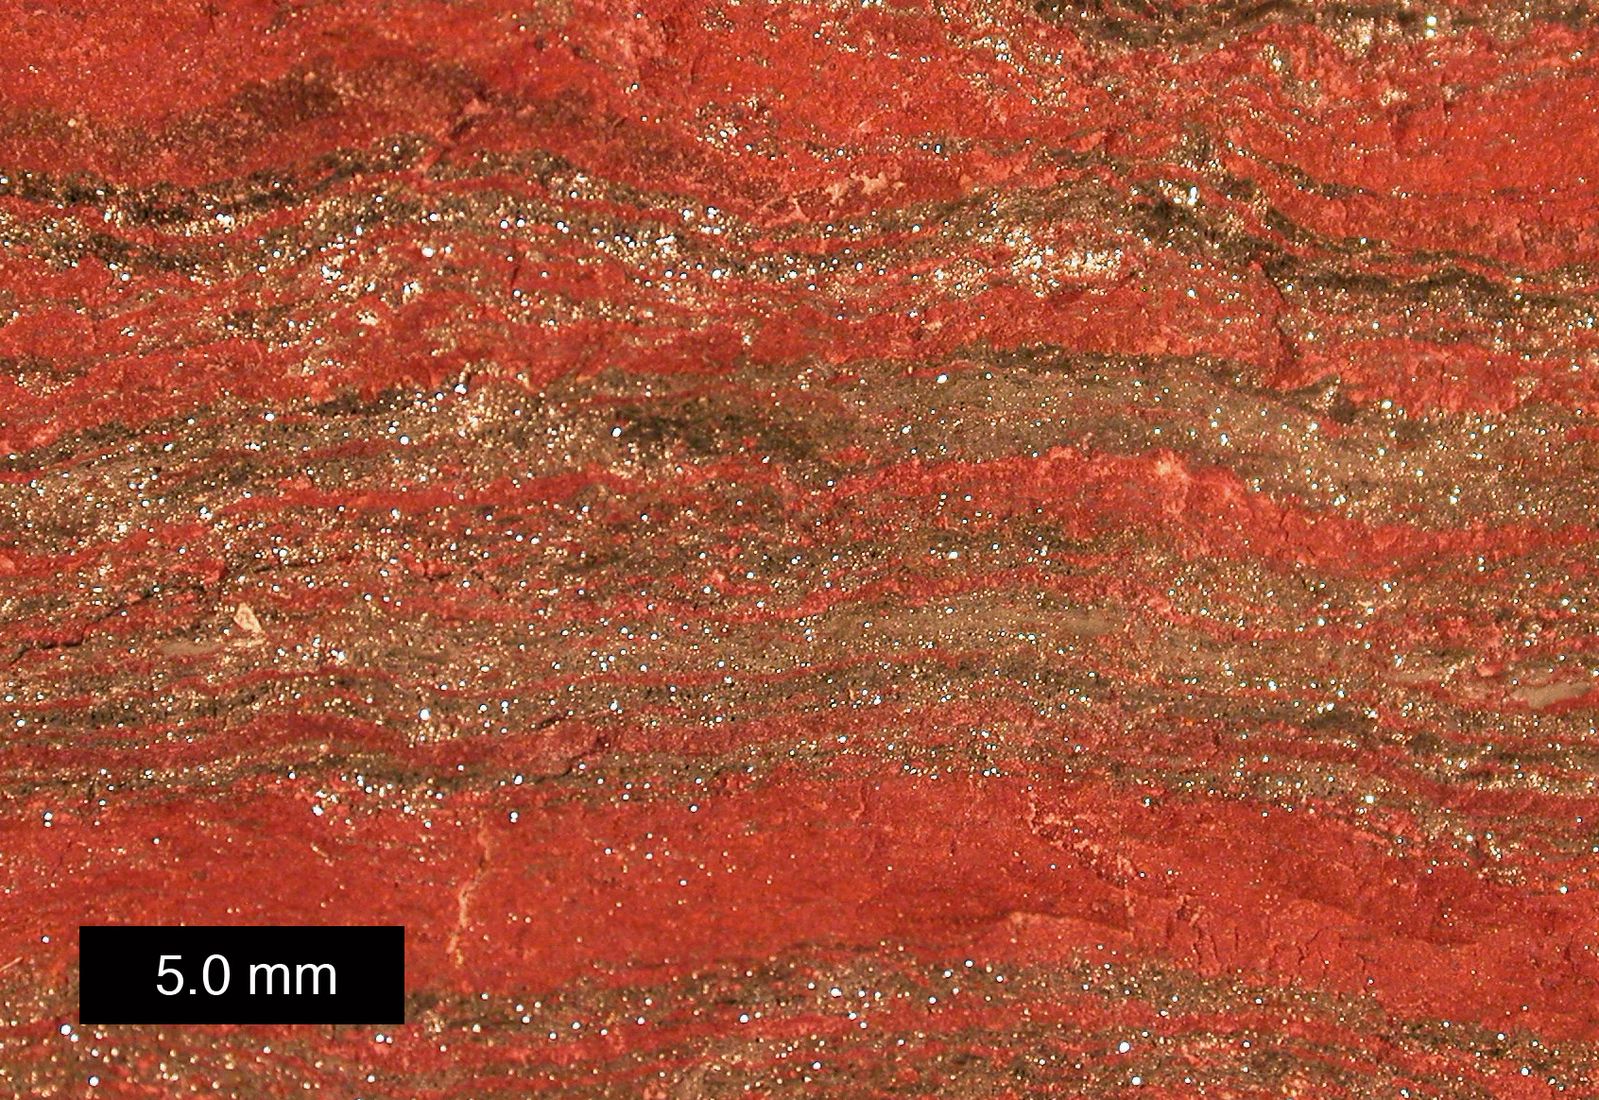
The formation of iron oxide minerals and red chert (see figure 8.18) in the oceans lasted a long time and prevented oxygen levels from increasing significantly, since precipitation took the oxygen out of the water and deposited it into the rock strata. As oxygen continued to be produced and mineral precipitation leveled off, dissolved oxygen gas eventually saturated the oceans and started bubbling out into the atmosphere. Oxygenation of the atmosphere is the single biggest event that distinguishes the Archean and Proterozoic environments. In addition to changing mineral and ocean chemistry, the GOE is also tabbed as triggering Earth’s first glaciation event around 2.1 billion years ago, the Huron Glaciation. Free oxygen reacted with methane in the atmosphere to produce carbon dioxide. Carbon dioxide and methane are called greenhouse gases because they trap heat within the Earth’s atmosphere, like the insulated glass of a greenhouse. Methane is a more effective insulator than carbon dioxide, so as the proportion of carbon dioxide in the atmosphere increased, the greenhouse effect decreased, and the planet cooled.
8.3.1 Rodinia
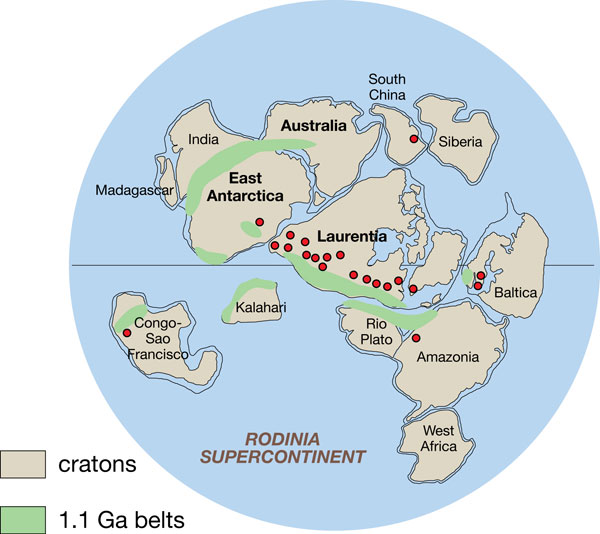
By the Proterozoic Eon, lithospheric plates had formed and were moving according to plate tectonic forces that were similar to current times. As the moving plates collided, the ocean basins closed to form a supercontinent called Rodinia. The supercontinent formed about 1 billion years ago and broke up about 750 to 600 million years ago, at the end of the Proterozoic. One of the resulting fragments was a continental mass called Laurentia that would later become North America. Geologists have reconstructed Rodinia by matching and aligning ancient mountain chains, assembling the pieces like a jigsaw puzzle, and using paleomagnetics to orient to magnetic north.
The disagreements over these complex reconstructions is exemplified by geologists proposing at least six different models for the breakup of Rodinia to create Australia, Antarctica, parts of China, the Tarim craton north of the Himalaya, Siberia, or the Kalahari craton of eastern Africa. This breakup created lots of shallow-water, biologically favorable environments that fostered the evolutionary breakthroughs marking the start of the next eon, the Phanerozoic.
8.3.2 Life Evolves
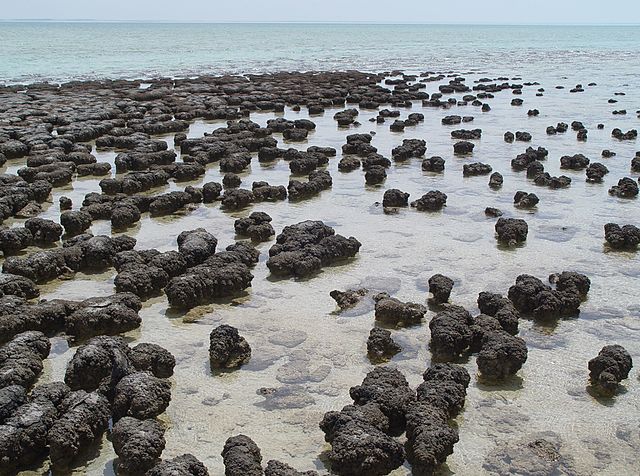
Early life in the Archean and earlier is poorly documented in the fossil record. Based on chemical evidence and evolutionary theory, scientists propose this life would have been single-celled photosynthetic organisms, such as the cyanobacteria that created stromatolites. Cyanobacteria produced free oxygen in the atmosphere through photosynthesis. Cyanobacteria, archaea, and bacteria are prokaryotes—primitive organisms made of single cells that lack cell nuclei and other organelles.
A large evolutionary step occurred during the Proterozoic Eon with the appearance of eukaryotes around 2.1 to 1.6 billion years ago. Eukaryotic cells are more complex, having nuclei and organelles. The nuclear DNA is capable of more complex replication and regulation than that of prokaryotic cells. The organelles include mitochondria for producing energy and chloroplasts for photosynthesis. The eukaryote branch in the tree of life gave rise to fungi, plants, and animals.
Another important event in Earth’s biological history occurred about 1.2 billion years ago when eukaryotes invented sexual reproduction. Sharing genetic material from two reproducing individuals, male and female, greatly increased genetic variability in their offspring. This genetic mixing accelerated evolutionary change, contributing to more complexity among individual organisms and within ecosystems (see chapter 7).
Proterozoic land surfaces were barren of plants and animals and geologic processes actively shaped the environment differently because land surfaces were not protected by leafy and woody vegetation. For example, rain and rivers would have caused erosion at much higher rates on land surfaces devoid of plants. This resulted in thick accumulations of pure quartz sandstone from the Proterozoic Eon such as the extensive quartzite formations in the core of the Uinta Mountains in Utah.
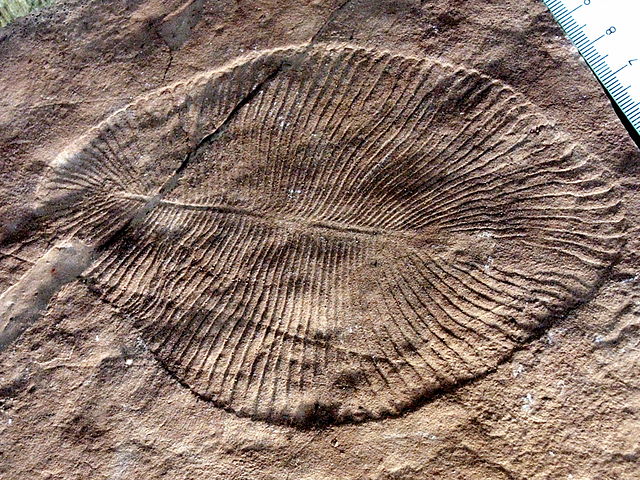
Fauna during the Ediacaran Period, 635.5 to 541 million years ago are known as the Ediacaran fauna, and offer a first glimpse at the diversity of ecosystems that evolved near the end of the Proterozoic. These soft-bodied organisms were among the first multicellular life forms and probably were similar to jellyfish or worm-like. Ediacaran fauna did not have hard parts like shells and were not well preserved in the rock records. However, studies suggest they were widespread in the Earth’s oceans. Scientists still debate how many species were evolutionary dead-ends that became extinct and how many were ancestors of modern groupings. The transition of soft-bodied Ediacaran life to life forms with hard body parts occurred at the end of the Proterozoic and beginning of the Phanerozoic Eons. This evolutionary explosion of biological diversity made a dramatic difference in scientists’ ability to understand the history of life on Earth.

Take this quiz to check your comprehension of this section.
If you are using an offline version of this text, access the quiz for section 8.3 via the QR code.
8.4 Phanerozoic Eon: Paleozoic Era
The Phanerozoic Eon is the most recent, 541 million years ago to today, and means “visible life” because the Phanerozoic rock record is marked by an abundance of fossils. Phanerozoic organisms had hard body parts like claws, scales, shells, and bones that were more easily preserved as fossils. Rocks from the older Precambrian time are less commonly found and rarely include fossils because these organisms had soft body parts. Phanerozoic rocks are younger, more common, and contain the majority of extant fossils. The study of rocks from this eon yields much greater detail. The Phanerozoic is subdivided into three eras, from oldest to youngest they are Paleozoic (“ancient life”), Mesozoic (“middle life”), and Cenozoic (“recent life”) and the remaining three chapter headings are on these three important eras.
Life in the early Paleozoic Era was dominated by marine organisms but by the middle of the era plants and animals evolved to live and reproduce on land. Fish evolved jaws and fins evolved into jointed limbs. The development of lungs allowed animals to emerge from the sea and become the first air-breathing tetrapods (four-legged animals) such as amphibians. From amphibians evolved reptiles with the amniotic egg. From reptiles evolved an early ancestor to birds and mammals and their scales became feathers and fur. Near the end of the Paleozoic Era, the Carboniferous Period had some of the most extensive forests in Earth’s history. Their fossilized remains became the coal that powered the industrial revolution
8.4.1 Paleozoic Tectonics and Paleogeography
During the Paleozoic Era, sea-levels rose and fell four times. With each sea-level rise, the majority of North America was covered by a shallow tropical ocean. Evidence of these submersions are the abundant marine sedimentary rocks such as limestone with fossils corals and ooids. Extensive sea-level falls are documented by widespread unconformities. Today, the midcontinent has extensive marine sedimentary rocks from the Paleozoic and western North America has thick layers of marine limestone on block faulted mountain ranges such as Mt. Timpanogos near Provo, Utah.
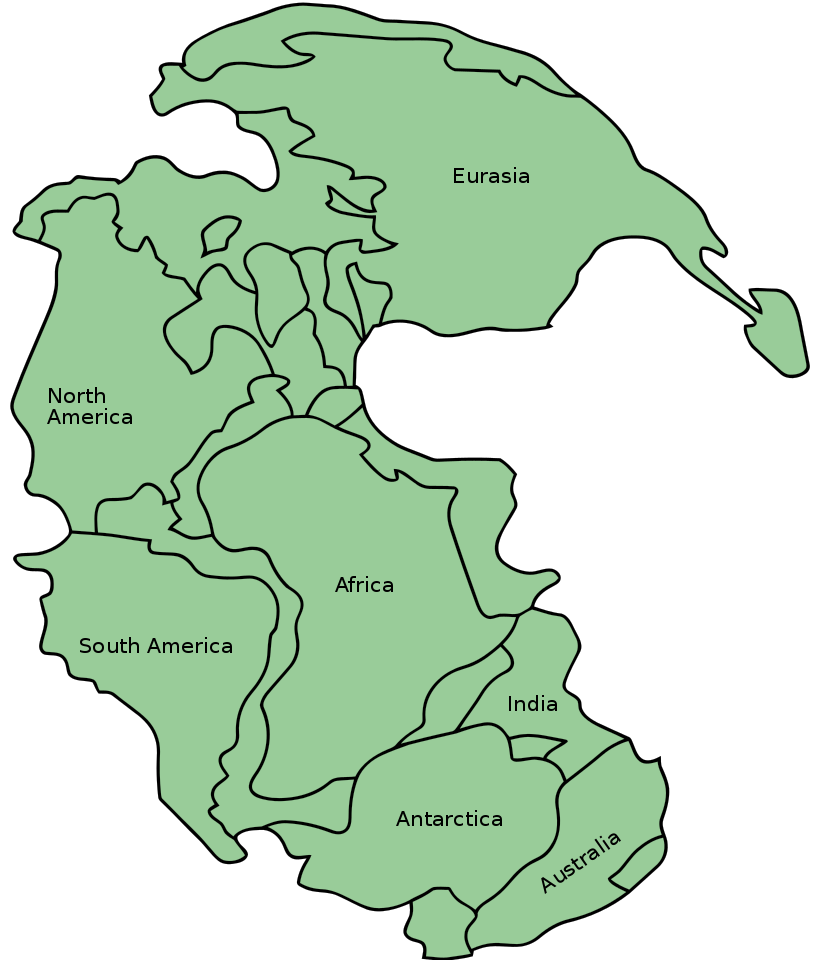
The assembly of supercontinent Pangea, sometimes spelled Pangaea, was completed by the late Paleozoic Era. The name Pangea was originally coined by Alfred Wegener and means “all land.” Pangea is the when all of the major continents were grouped together as one by a series of tectonic events including subduction island-arc accretion, and continental collisions, and ocean-basin closures. In North America, these tectonic events occurred on the east coast and are known as the Taconic, Acadian, Caledonian, and Alleghanian orogenies. The Appalachian Mountains are the erosional remnants of these mountain building events in North America. Surrounding Pangea was a global ocean basin known as the Panthalassa. Continued plate movement extended the ocean into Pangea, forming a large bay called the Tethys Sea that eventually divided the land mass into two smaller supercontinents, Laurasia and Gondwana. Laurasia consisted of Laurentia and Eurasia, and Gondwana consisted of the remaining continents of South America, Africa, India, Australia, and Antarctica.

Video 8.3: Animation of plate movement the last 3.3 billion years. Pangea occurs at the 4:40 mark.
If you are using an offline version of this text, access this YouTube video via the QR code.
While the east coast of North America was tectonically active during the Paleozoic Era, the west coast remained mostly inactive as a passive margin during the early Paleozoic. The western edge of North American continent was near the present-day Nevada-Utah border and was an expansive shallow continental shelf near the paleoequator. However, by the Devonian Period, the Antler orogeny started on the west coast and lasted until the Pennsylvanian Period. The Antler orogeny was a volcanic island arc that was accreted onto western North America with the subduction direction away from North America. This created a mountain range on the west coast of North American called the Antler highlands and was the first part of building the land in the west that would eventually make most of California, Oregon, and Washington states. By the late Paleozoic, the Sonoma orogeny began on the west coast and was another collision of an island arc. The Sonoma orogeny marks the change in subduction direction to be toward North America with a volcanic arc along the entire west coast of North America by late Paleozoic to early Mesozoic Eras.
By the end of the Paleozoic Era, the east coast of North America had a very high mountain range due to continental collision and the creation of Pangea. The west coast of North America had smaller and isolated volcanic highlands associated with island arc accretion. During the Mesozoic Era, the size of the mountains on either side of North America would flip, with the west coast being a more tectonically active plate boundary and the east coast changing into a passive margin after the breakup of Pangea.
8.4.2 Paleozoic Evolution
The beginning of the Paleozoic Era is marked by the first appearance of hard body parts like shells, spikes, teeth, and scales; and the appearance in the rock record of most animal phyla known today. That is, most basic animal body plans appeared in the rock record during the Cambrian Period. This sudden appearance of biological diversity is called the Cambrian Explosion. Scientists debate whether this sudden appearance is more from a rapid evolutionary diversification as a result of a warmer climate following the late Proterozoic glacial environments, better preservation and fossilization of hard parts, or artifacts of a more complete and recent rock record. For example, fauna may have been diverse during the Ediacaran Period, setting the state for the Cambrian Explosion, but they lacked hard body parts and would have left few fossils behind. Regardless, during the Cambrian Period 541–485 million years ago marked the appearance of most animal phyla.
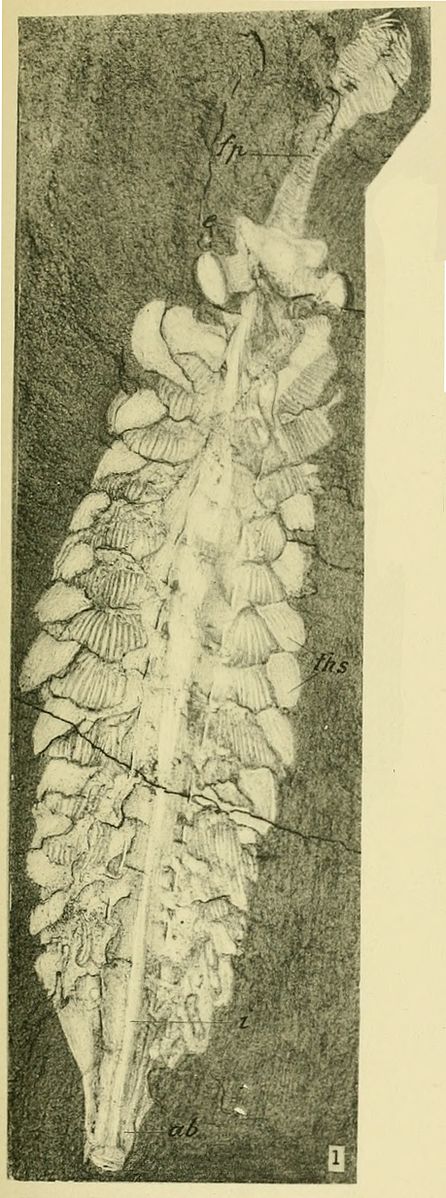
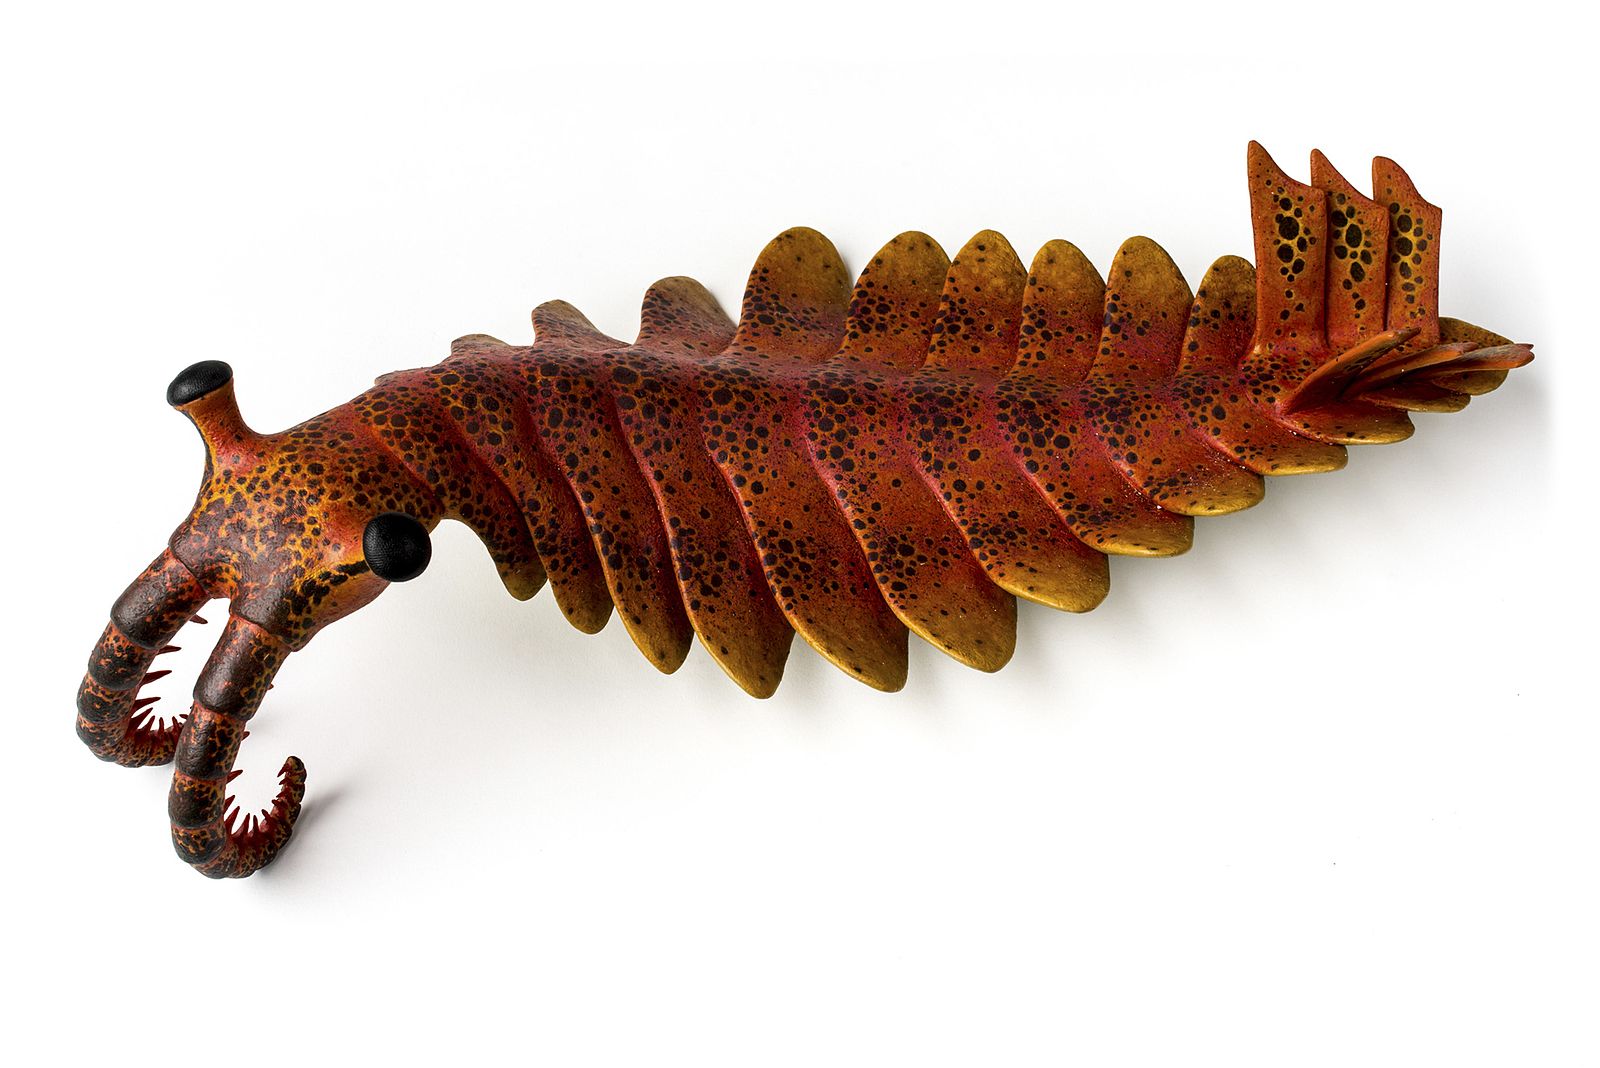
One of the best fossil sites for the Cambrian Explosion was discovered in 1909 by Charles Walcott (1850–1927) in the Burgess Shale in western Canada. The Burgess Shale is a Lagerstätte, a site of exceptional fossil preservation that includes impressions of soft body parts. This discovery allowed scientists to study Cambrian animals in immense detail because soft body parts are not normally preserved and fossilized. Other Lagerstätte sites of similar age in China and Utah have allowed scientist to form a detailed picture of Cambrian biodiversity. The biggest mystery surrounds animals that do not fit existing lineages and are unique to that time. This includes many famous fossilized creatures: the first compound-eyed trilobites; Wiwaxia, a creature covered in spiny plates; Hallucigenia, a walking worm with spikes; Opabinia, a five-eyed arthropod with a grappling claw; and Anomalocaris, the alpha predator of its time, complete with grasping appendages and circular mouth with sharp plates. Most notably appearing during the Cambrian is an important ancestor to humans. A segmented worm called Pikaia is thought to be the earliest ancestor of the Chordata phylum that includes vertebrates, animals with backbones.
By the end of the Cambrian, mollusks, brachiopods, nautiloids, gastropods, graptolites, echinoderms, and trilobites covered the sea floor. Although most animal phyla appeared by the Cambrian, the biodiversity at the family, genus, and species level was low until the Ordovician Period. During the Great Ordovician Biodiversification Event, vertebrates and invertebrates (animals without backbone) became more diverse and complex at family, genus, and species level. The cause of the rapid speciation event is still debated but some likely causes are a combination of warm temperatures, expansive continental shelves near the equator, and more volcanism along the mid-ocean ridges. Some have shown evidence that an asteroid breakup event and consequent heavy meteorite impacts correlate with this diversification event. The additional volcanism added nutrients to ocean water helping support a robust ecosystem. Many life forms and ecosystems that would be recognizable in current times appeared at this time. Mollusks, corals, and arthropods in particular multiplied to dominate the oceans.
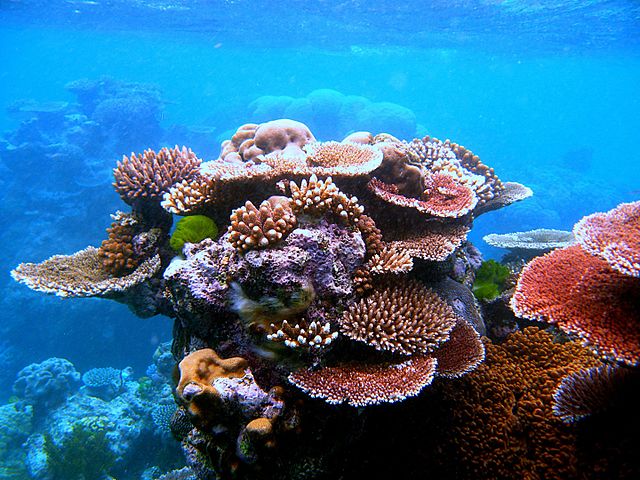
One important evolutionary advancement during the Ordovician Period was reef-building organisms, mostly colonial coral. Corals took advantage of the ocean chemistry, using calcite to build large structures that resembled modern reefs like the Great Barrier Reef off the coast of Australia. These reefs housed thriving ecosystems of organisms that swam around, hid in, and crawled over them. Reefs are important to paleontologists because of their preservation potential, massive size, and in-place ecosystems. Few other fossils offer more diversity and complexity than reef assemblages.
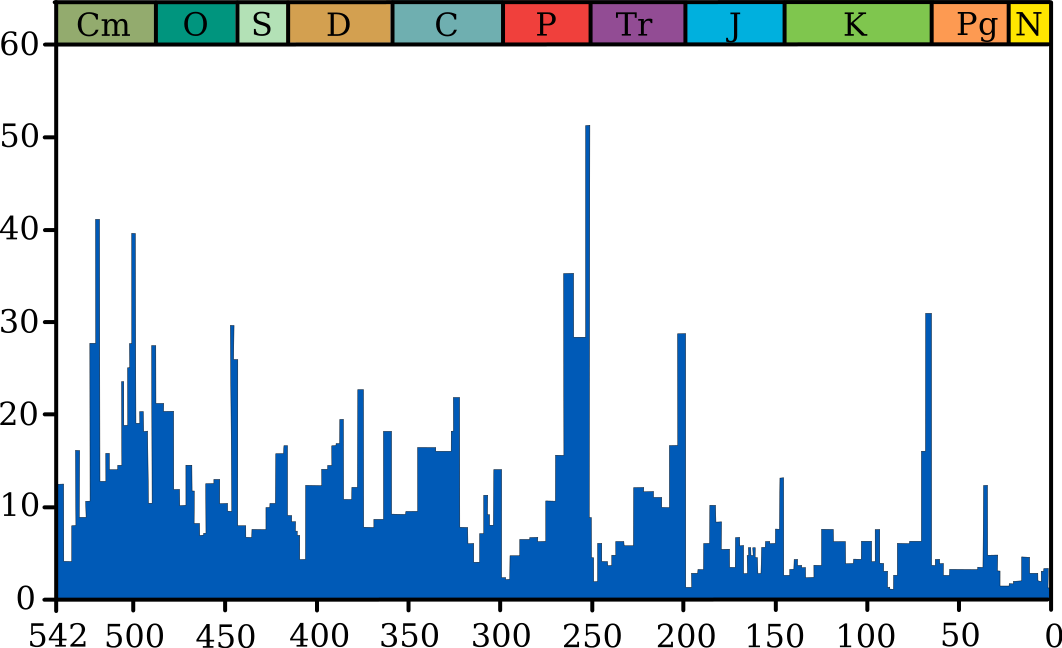
According to evidence from glacial deposits, a small ice age caused sea-levels to drop and led to a major mass extinction by the end of the Ordovician. This is the earliest of five mass extinction events documented in the fossil record. During this mass extinction, an unusually large number of species abruptly disappear in the fossil record (see video below).

Video 8.4: 3-minute video describing mass extinctions and how they are defined.
If you are using an offline version of this text, access this YouTube video via the QR code.
Life bounced back during the Silurian period. The period’s major evolutionary event was the development of jaws from the forward pair of gill arches in bony fishes and sharks. Hinged jaws allowed fish to exploit new food sources and ecological niches. This period also included the start of armored fishes, known as the placoderms. In addition to fish and jaws, Silurian rocks provide the first evidence of terrestrial or land-dwelling plants and animals. The first vascular plant, Cooksonia, had woody tissues, pores for gas exchange, and veins for water and food transport. Insects, spiders, scorpions, and crustaceans began to inhabit moist, freshwater terrestrial environments.
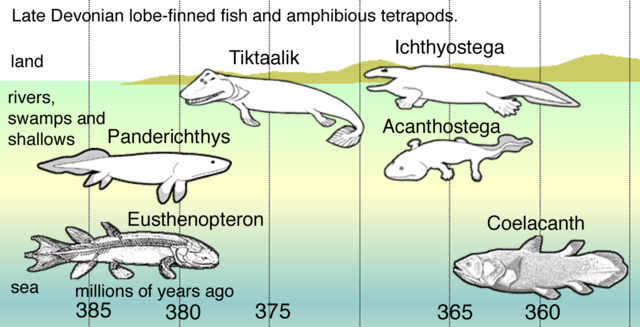
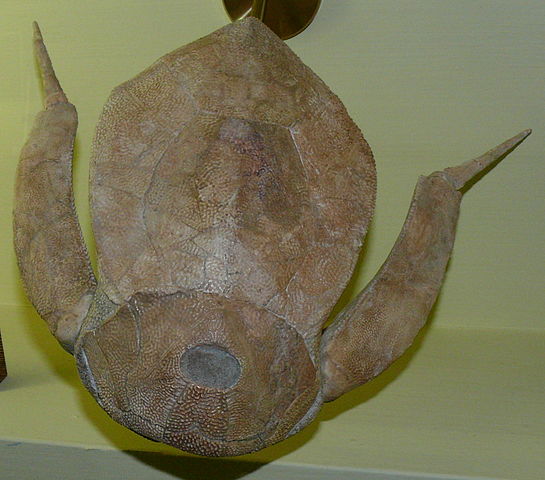
The Devonian Period is called the Age of Fishes due to the rise in plated, jawed, and lobe-finned fishes. The lobe-finned fishes, which were related to the modern lungfish and coelacanth, are important for their eventual evolution into tetrapods, four-limbed vertebrate animals that can walk on land. The first lobe-finned land-walking fish, named Tiktaalik, appeared about 385 million years ago and serves as a transition fossil between fish and early tetrapods. Though Tiktaalik was clearly a fish, it had some tetrapod structures as well. Several fossils from the Devonian are more tetrapod like than fish like but these weren’t fully terrestrial. The first fully terrestrial tetrapod arrived in the Mississippian (early Carboniferous) period. By the Mississippian (early Carboniferous) period, tetrapods had evolved into two main groups, amphibians and amniotes, from a common tetrapod ancestor. The amphibians were able to breathe air and live on land but still needed water to nurture their soft eggs. The first reptile (an amniote) could live and reproduce entirely on land with hard-shelled eggs that wouldn’t dry out.
Land plants had also evolved into the first trees and forests. Toward the end of the Devonian, another mass extinction event occurred. This extinction, while severe, is the least temporally defined, with wide variations in the timing of the event or events. Reef building organisms were the hardest hit, leading to dramatic changes in marine ecosystems.
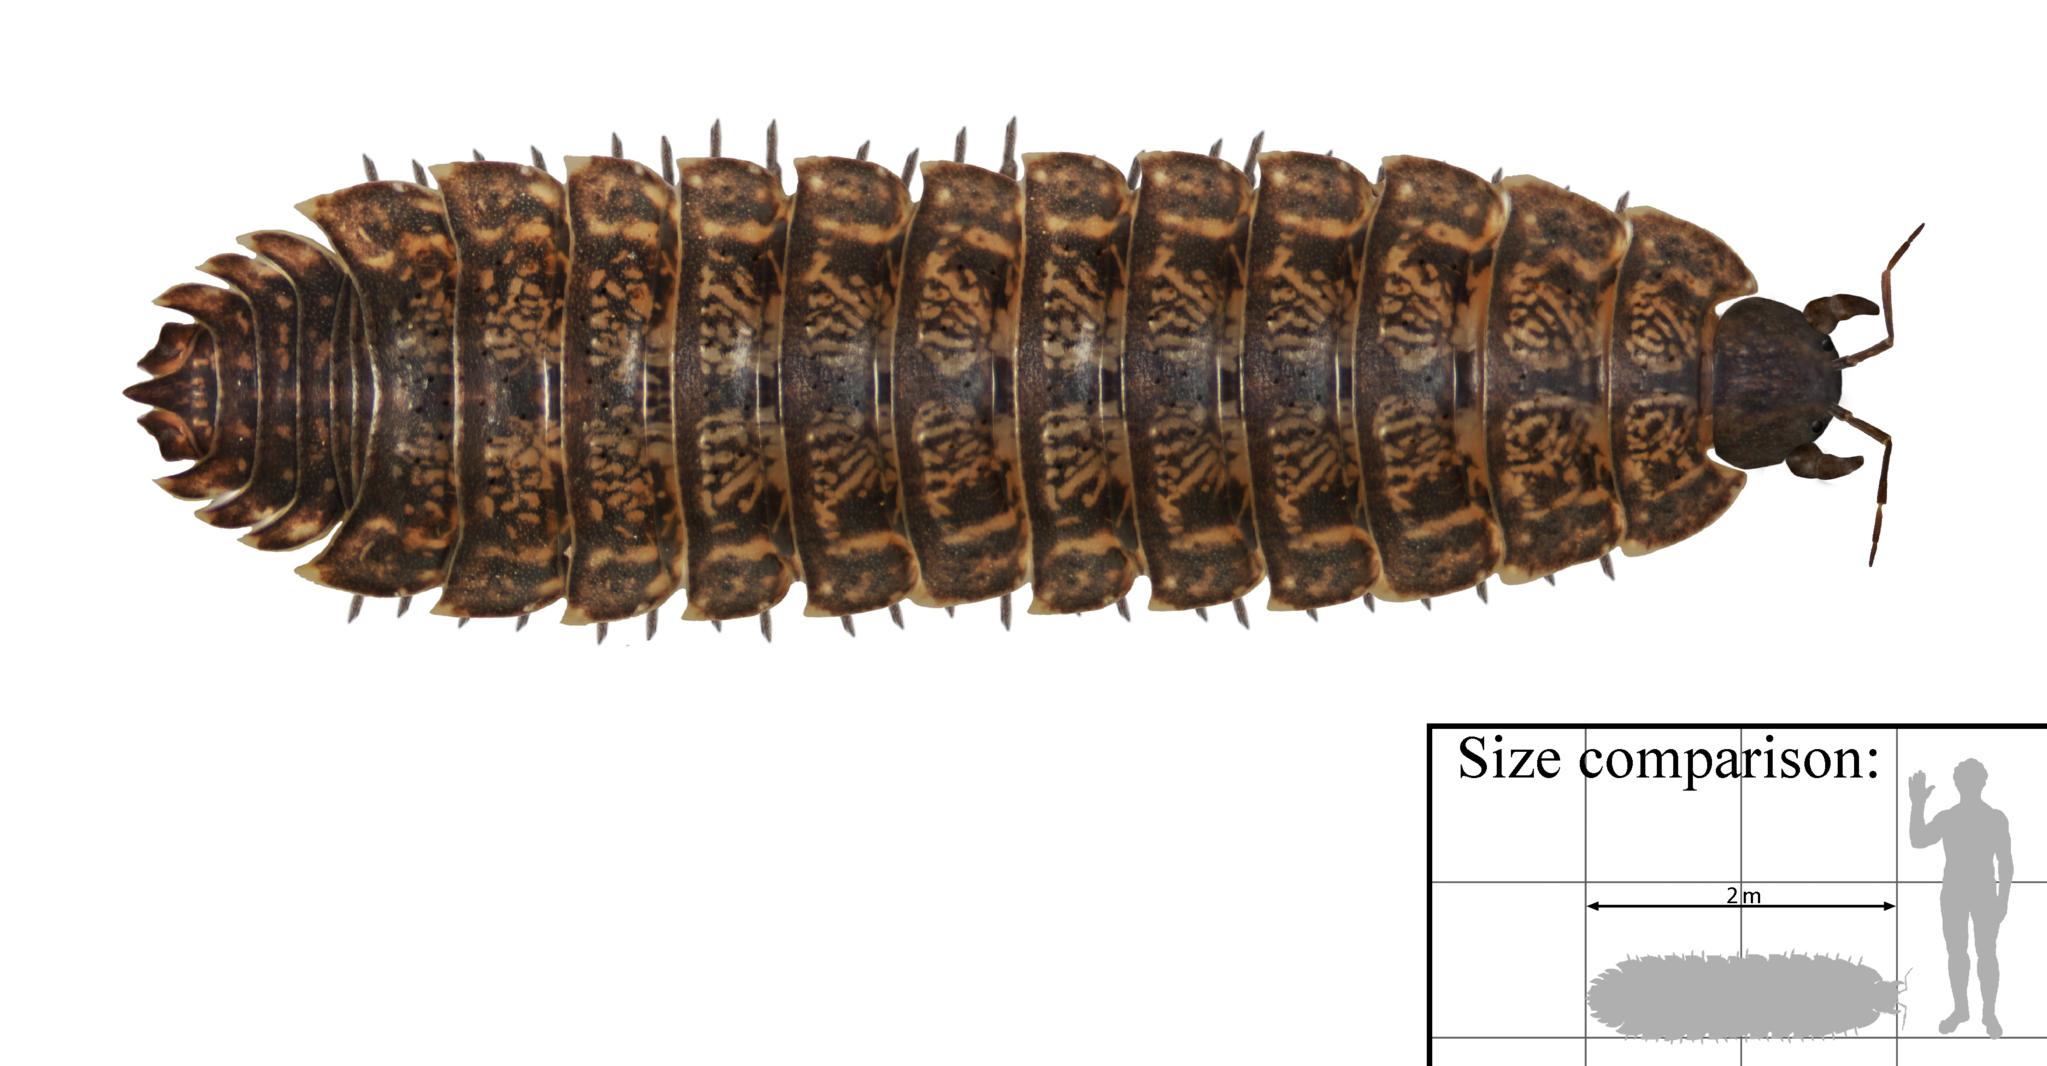
The next time period, called the Carboniferous (North American geologists have subdivided this into the Mississippian and Pennsylvanian periods), saw the highest levels of oxygen ever known, with forests (e.g., ferns, club mosses) and swamps dominating the landscape. This helped cause the largest arthropods ever, like the millipede Arthropleura, at 2.5 meters (6.4 feet) long! It also saw the rise of a new group of animals, the reptiles. The evolutionary advantage that reptiles have over amphibians is the amniote egg (egg with a protective shell), which allows them to rely on non-aquatic environments for reproduction. This widened the terrestrial reach of reptiles compared to amphibians. This booming life, especially plant life, created cooling temperatures as carbon dioxide was removed from the atmosphere. By the middle Carboniferous, these cooler temperatures led to an ice age (called the Karoo Glaciation) and less-productive forests. The reptiles fared much better than the amphibians, leading to their diversification. This glacial event lasted into the early Permian.
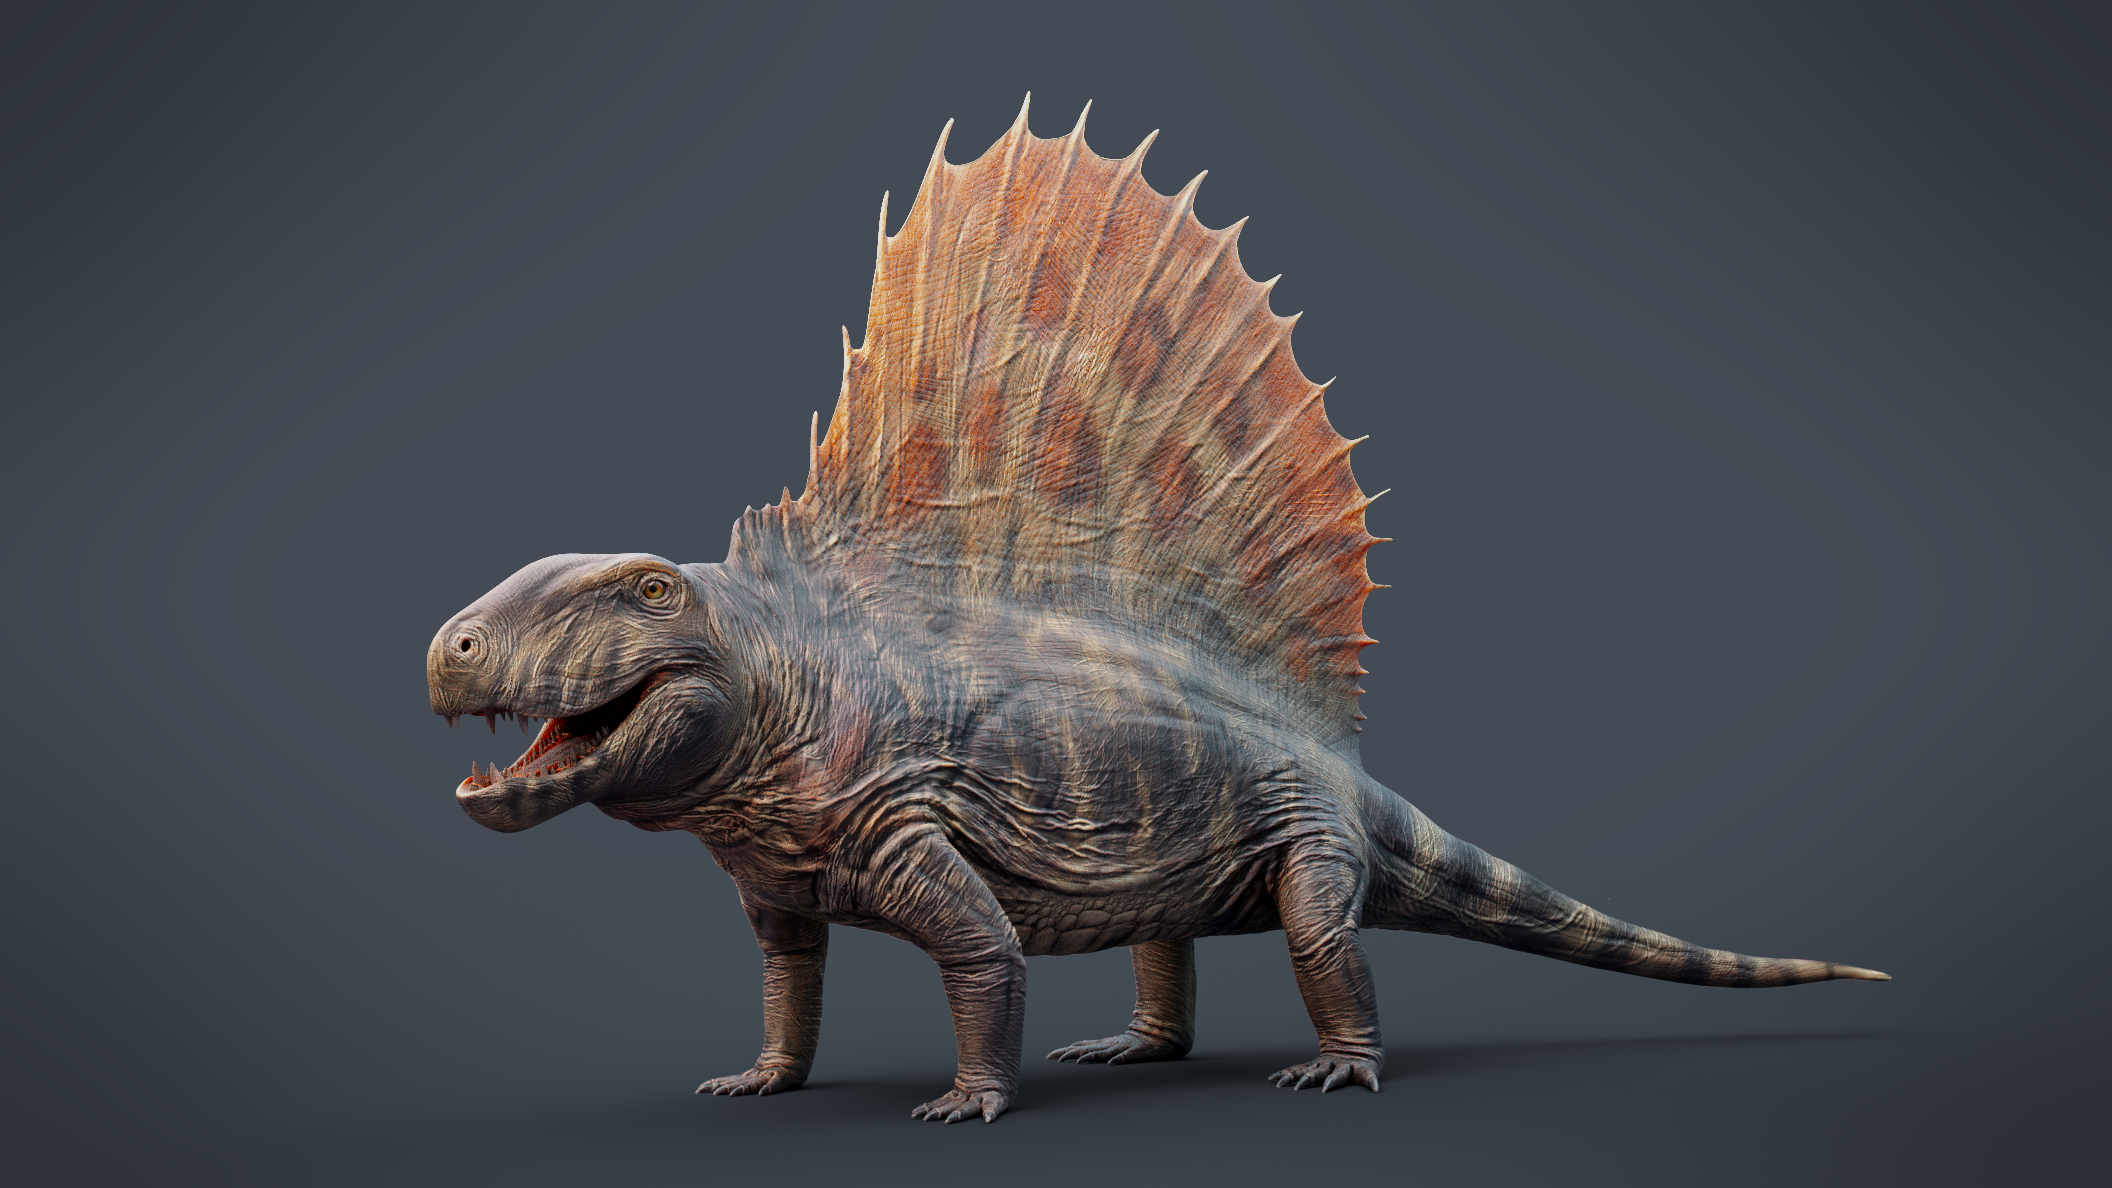
By the Permian, with Pangea assembled, the supercontinent led to a dryer climate, and even more diversification and domination by the reptiles. The groups that developed in this warm climate eventually radiated into dinosaurs. Another group, known as the synapsids, eventually evolved into mammals. Synapsids, including the famous sail-backed Dimetrodon are commonly confused with dinosaurs. Pelycosaurs (of the Pennsylvanian to early Permian like Dimetrodon) are the first group of synapsids that exhibit the beginnings of mammalian characteristics such as well-differentiated dentition: incisors, highly developed canines in lower and upper jaws and cheek teeth, premolars and molars. Starting in the late Permian, a second group of synapsids, called the therapsids (or mammal-like reptiles) evolve, and become the ancestors to mammals.
Permian Mass Extinction
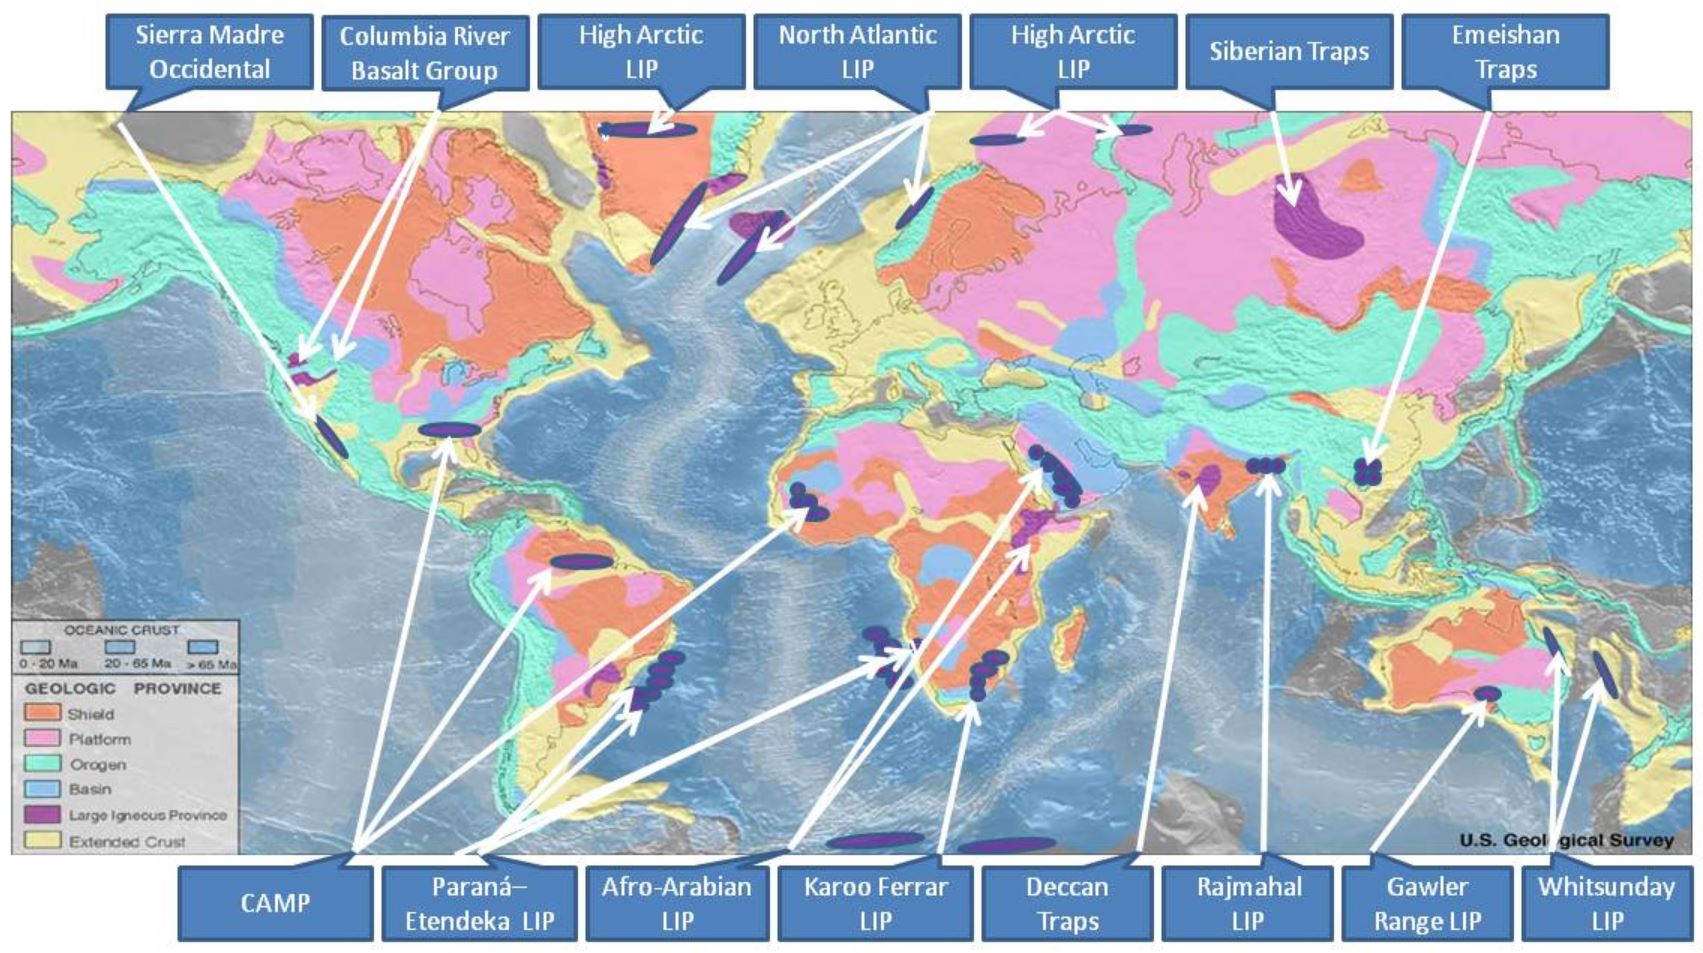
The end of the Paleozoic era is marked by the largest mass extinction in earth history. The Paleozoic era had two smaller mass extinctions, but these were not as large as the Permian Mass Extinction, also known as the Permian-Triassic Extinction Event. It is estimated that up to 96% of marine species and 70% of land-dwelling (terrestrial) vertebrates went extinct. Many famous organisms, like sea scorpions and trilobites, were never seen again in the fossil record. What caused such a widespread extinction event? The exact cause is still debated, though the leading idea relates to extensive volcanism associated with the Siberian Traps, which are one of the largest deposits of flood basalts known on Earth, dating to the time of the extinction event. The eruption size is estimated at over 3 million cubic kilometers that is approximately 4,000,000 times larger than the famous 1980 Mt. St. Helens eruption in Washington. The unusually large volcanic eruption would have contributed a large amount of toxic gases, aerosols, and greenhouse gasses into the atmosphere. Further, some evidence suggests that the volcanism burned vast coal deposits releasing methane (a greenhouse gas) into the atmosphere. As discussed in chapter 15, greenhouse gases cause the climate to warm. This extensive addition of greenhouse gases from the Siberian Traps may have caused a runaway greenhouse effect that rapidly changed the climate, acidified the oceans, disrupted food chains, disrupted carbon cycling, and caused the largest mass extinction.

Take this quiz to check your comprehension of this section.
If you are using an offline version of this text, access the quiz for section 8.4 via the QR code.
8.5 Phanerozoic Eon: Mesozoic Era
Following the Permian Mass Extinction, the Mesozoic (“middle life”) was from 252 million years ago to 66 million years ago. As Pangea started to break apart, mammals, birds, and flowering plants developed. The Mesozoic is probably best known as the age of reptiles, most notably, the dinosaurs.
8.5.1 Mesozoic Tectonics and Paleogeography
Pangea started breaking up (in a region that would become eastern Canada and United States) around 210 million years ago in the Late Triassic. Clear evidence for this includes the age of the sediments in the Newark Supergroup rift basins and the Palisades sill of the eastern part of North America and the age of the Atlantic ocean floor. Due to sea-floor spreading, the oldest rocks on the Atlantic’s floor are along the coast of northern Africa and the east coast of North America, while the youngest are along the mid-ocean ridge.
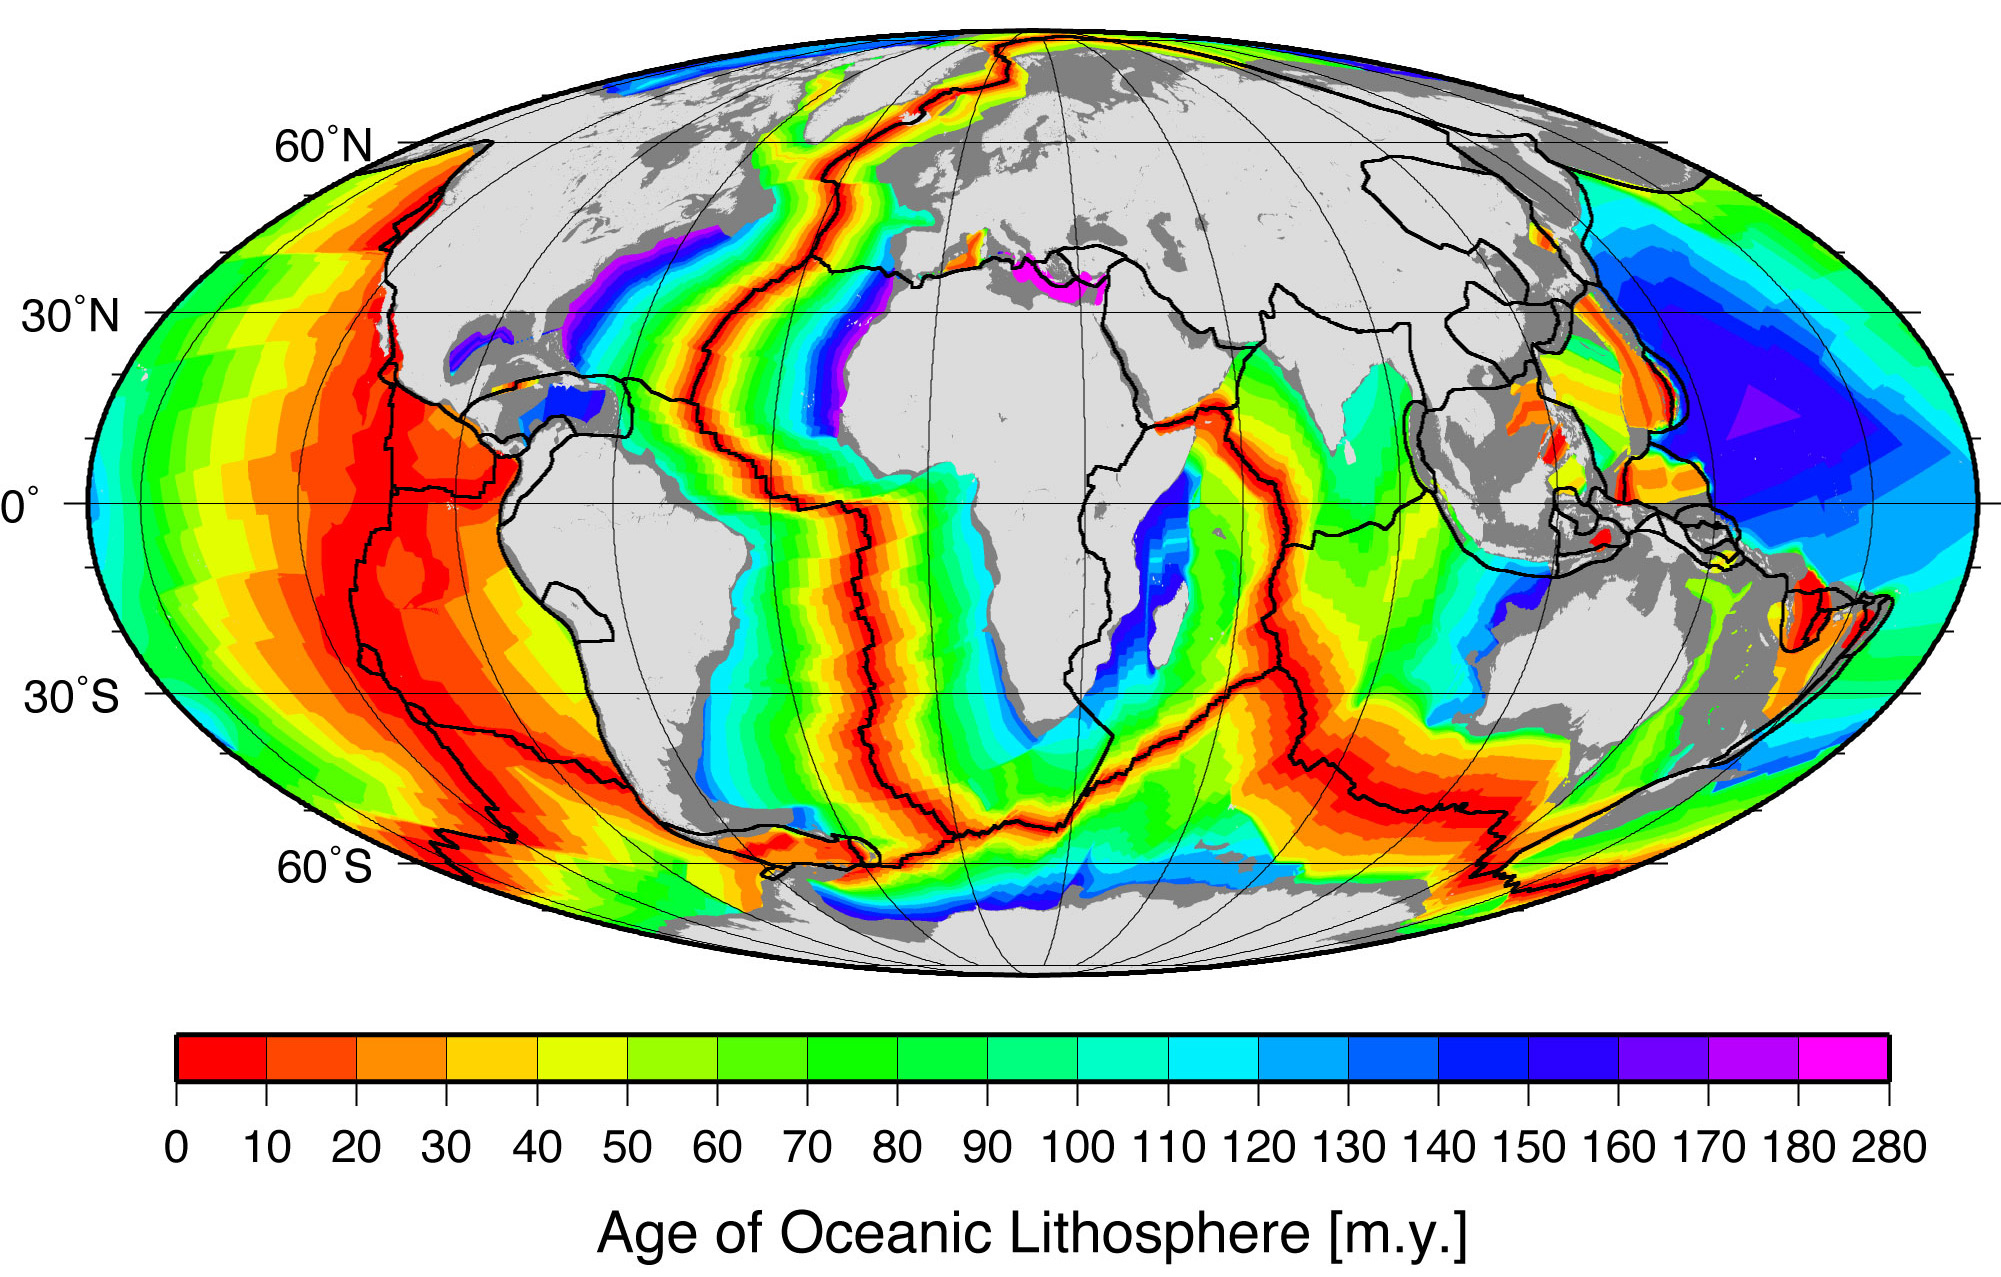
This age pattern shows how the Atlantic Ocean opened as the young Mid-Atlantic Ridge began to create the seafloor. This means the Atlantic ocean started opening and was first formed here. The southern Atlantic opened next, with South America separating from central and southern Africa. Last (happening after the Mesozoic ended) was the northernmost Atlantic, with Greenland and Scandinavia parting ways. The breaking points of each rifted plate margin eventually turned into the passive plate boundaries of the east coast of the Americas today.

Video 8.5: Video of Pangea breaking apart and plates moving to their present locations.
If you are using an offline version of this text, access this YouTube video via the QR code.
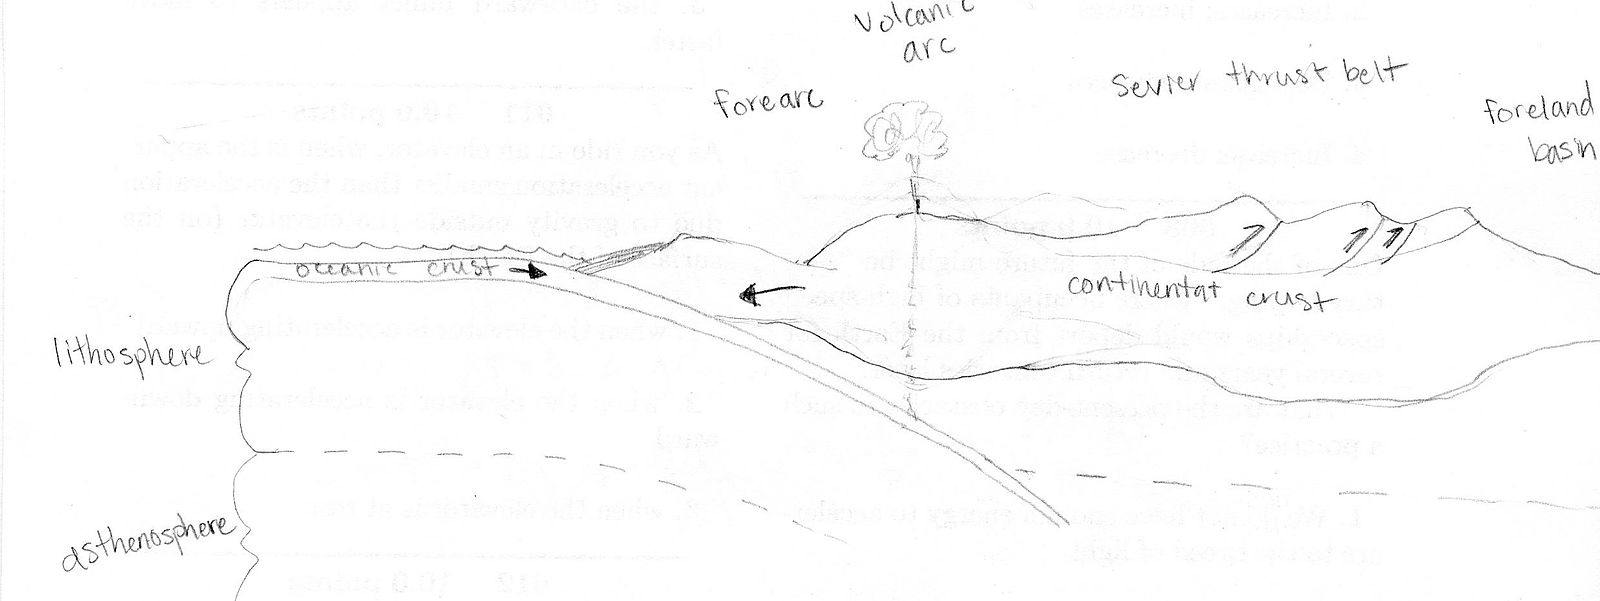
In western North America, an active plate margin had started with subduction, controlling most of the tectonics of that region in the Mesozoic. Another possible island-arc collision created the Sonoman Orogeny in Nevada during the latest Paleozoic to the Triassic. In the Jurassic, another island-arc collision caused the Nevadan Orogeny, a large Andean-style volcanic arc and thrust belt. The Sevier Orogeny followed in the Cretaceous, which was mainly a volcanic arc to the west and a thin-skinned fold and thrust belt to the east, meaning stacks of shallow faults and folds built up the topography. Many of the structures in the Rocky Mountains today date from this orogeny.
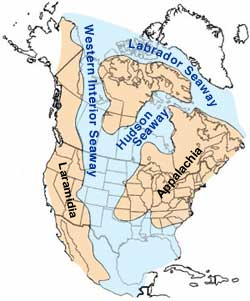
Tectonics had an influence in one more important geographic feature in North America: the Cretaceous Western Interior Foreland Basin, which flooded during high sea levels forming the Cretaceous Interior Seaway. Subduction from the west was the Farallon Plate, an oceanic plate connected to the Pacific Plate (seen today as remnants such as the Juan de Fuca Plate, off the coast of the Pacific Northwest). Subduction was shallow at this time because a very young, hot and less dense portion of the Farallon plate was subducted. This shallow subduction caused a downwarping in the central part of North America. High sea levels due to shallow subduction, and increasing rates of seafloor spreading and subduction, high temperatures, and melted ice also contributed to the high sea levels. These factors allowed a shallow epicontinental seaway that extended from the Gulf of Mexico to the Arctic Ocean to divide North America into two separate land masses, Laramidia to the west and Appalachia to the east, for 25 million years. Many of the coal deposits in Utah and Wyoming formed from swamps along the shores of this seaway. By the end of the Cretaceous, cooling temperatures caused the seaway to regress.
8.5.2 Mesozoic Evolution
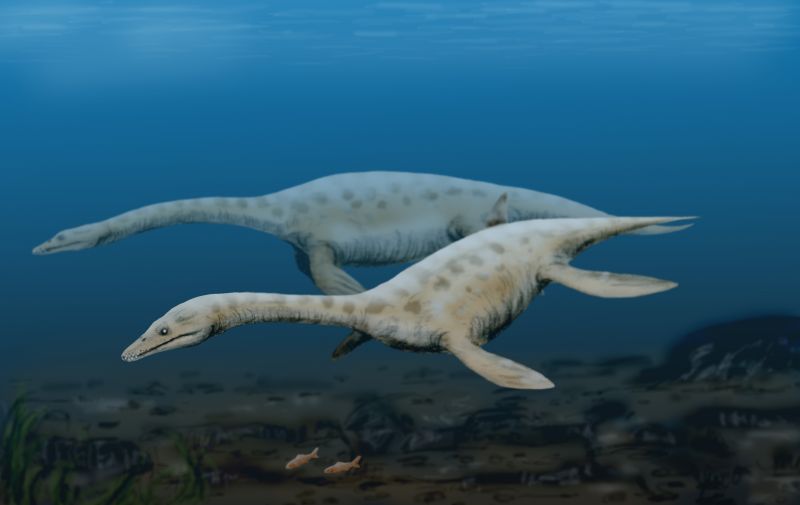
The Mesozoic era is dominated by reptiles, and more specifically, the dinosaurs. The Triassic saw devastated ecosystems that took over 30 million years to fully re-emerge after the Permian Mass Extinction. The first appearance of many modern groups of animals that would later flourish occurred at this time. This includes frogs (amphibians), turtles (reptiles), marine ichthyosaurs and plesiosaurs (marine reptiles), mammals, and the archosaurs. The archosaurs (“ruling reptiles”) include ancestral groups that went extinct at the end of the Triassic, as well as the flying pterosaurs, crocodilians, and the dinosaurs. Archosaurs, like the placental mammals after them, occupied all major environments: terrestrial (dinosaurs), in the air (pterosaurs), aquatic (crocodilians) and even fully marine habitats (marine crocodiles). The pterosaurs, the first vertebrate group to take flight, like the dinosaurs and mammals, start small in the Triassic.
At the end of the Triassic, another mass extinction event occurred, the fourth major mass extinction in the geologic record. This was perhaps caused by the Central Atlantic Magmatic Province flood basalt. The end-Triassic extinction made certain lineages go extinct and helped spur the evolution of survivors like mammals, pterosaurs (flying reptiles), ichthyosaurs/plesiosaurs/mosasaurs (marine reptiles), and dinosaurs.
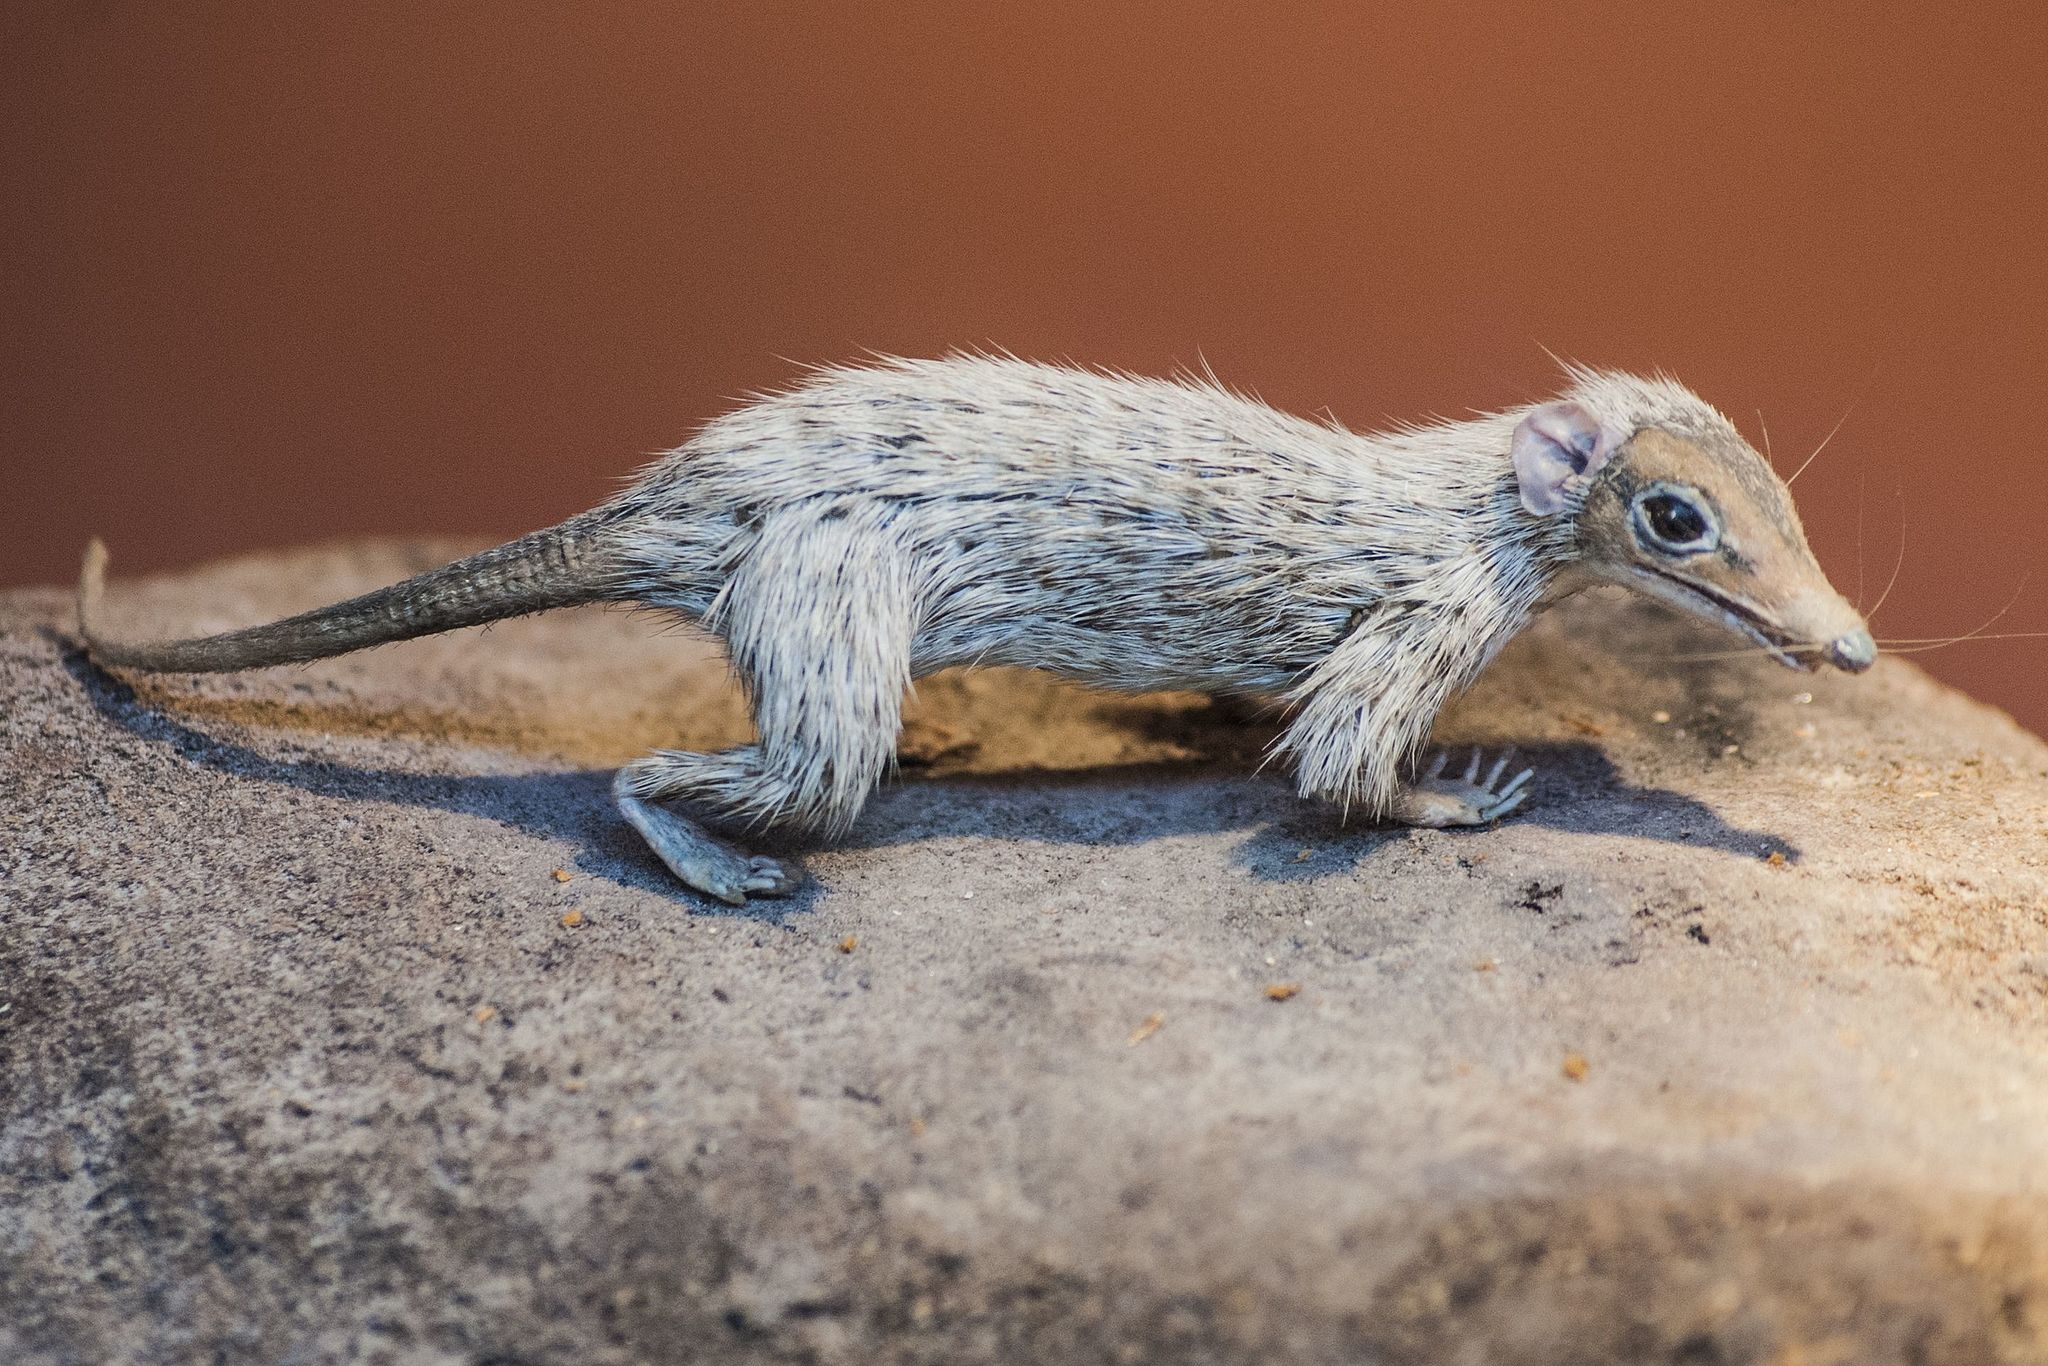
Mammals, as previously mentioned, got their start from a reptilian synapsid ancestor possibly in the late Paleozoic. Mammals stayed small, in mainly nocturnal niches, with insects being their largest prey. The development of warm-blooded circulation and fur may have been a response to this lifestyle.
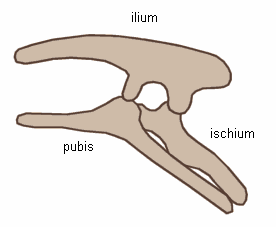
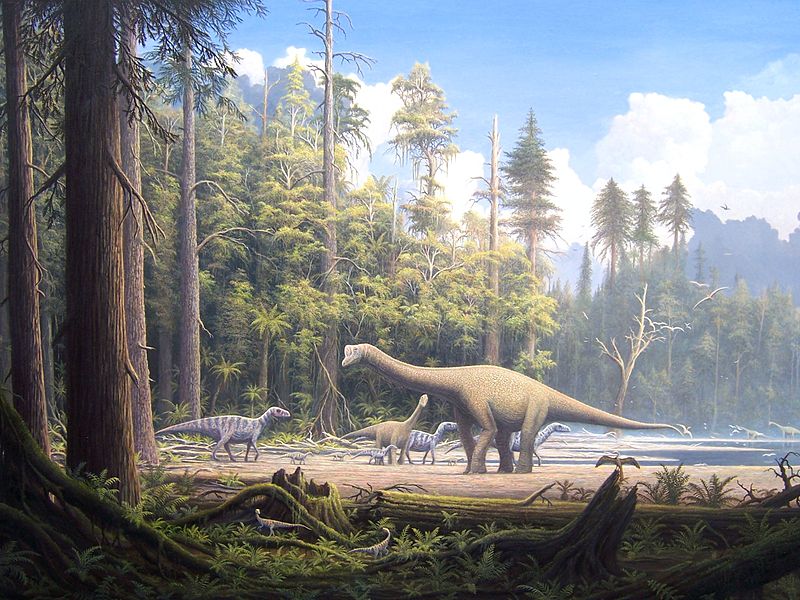
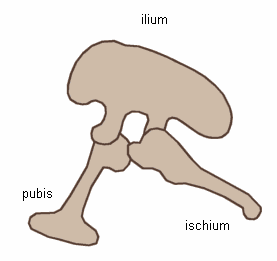
In the Jurassic, species that were previously common, flourished due to a warmer and more tropical climate. The dinosaurs were relatively small animals in the Triassic period of the Mesozoic, but became truly massive in the Jurassic. Dinosaurs are split into two groups based on their hip structure, i.e. orientation of the pubis and ischium bones in relationship to each other. This is referred to as the “reptile hipped” saurischians and the “bird hipped” ornithischians. This has recently been brought into question by a new idea for dinosaur lineage.
Most of the dinosaurs of the Triassic were saurischians, but all of them were bipedal. The major adaptive advantage dinosaurs had was changes in the hip and ankle bones, tucking the legs under the body for improved locomotion as opposed to the semi-erect gait of crocodiles or the sprawling posture of reptiles. In the Jurassic, limbs (or a lack thereof) were also important to another group of reptiles, leading to the evolution of Eophis, the oldest snake.
There is a paucity of dinosaur fossils from the Early and Middle Jurassic, but by the Late Jurassic they were dominating the planet. The saurischians diversified into the giant herbivorous (plant-eating) long-necked sauropods weighing up to 100 tons and bipedal carnivorous theropods, with the possible exception of the Therizinosaurs. All of the ornithischians (e.g Stegosaurus, Iguanodon, Triceratops, Ankylosaurus, Pachycephhlosaurus) were herbivorous with a strong tendency to have a “turtle-like” beak at the tips of their mouths.
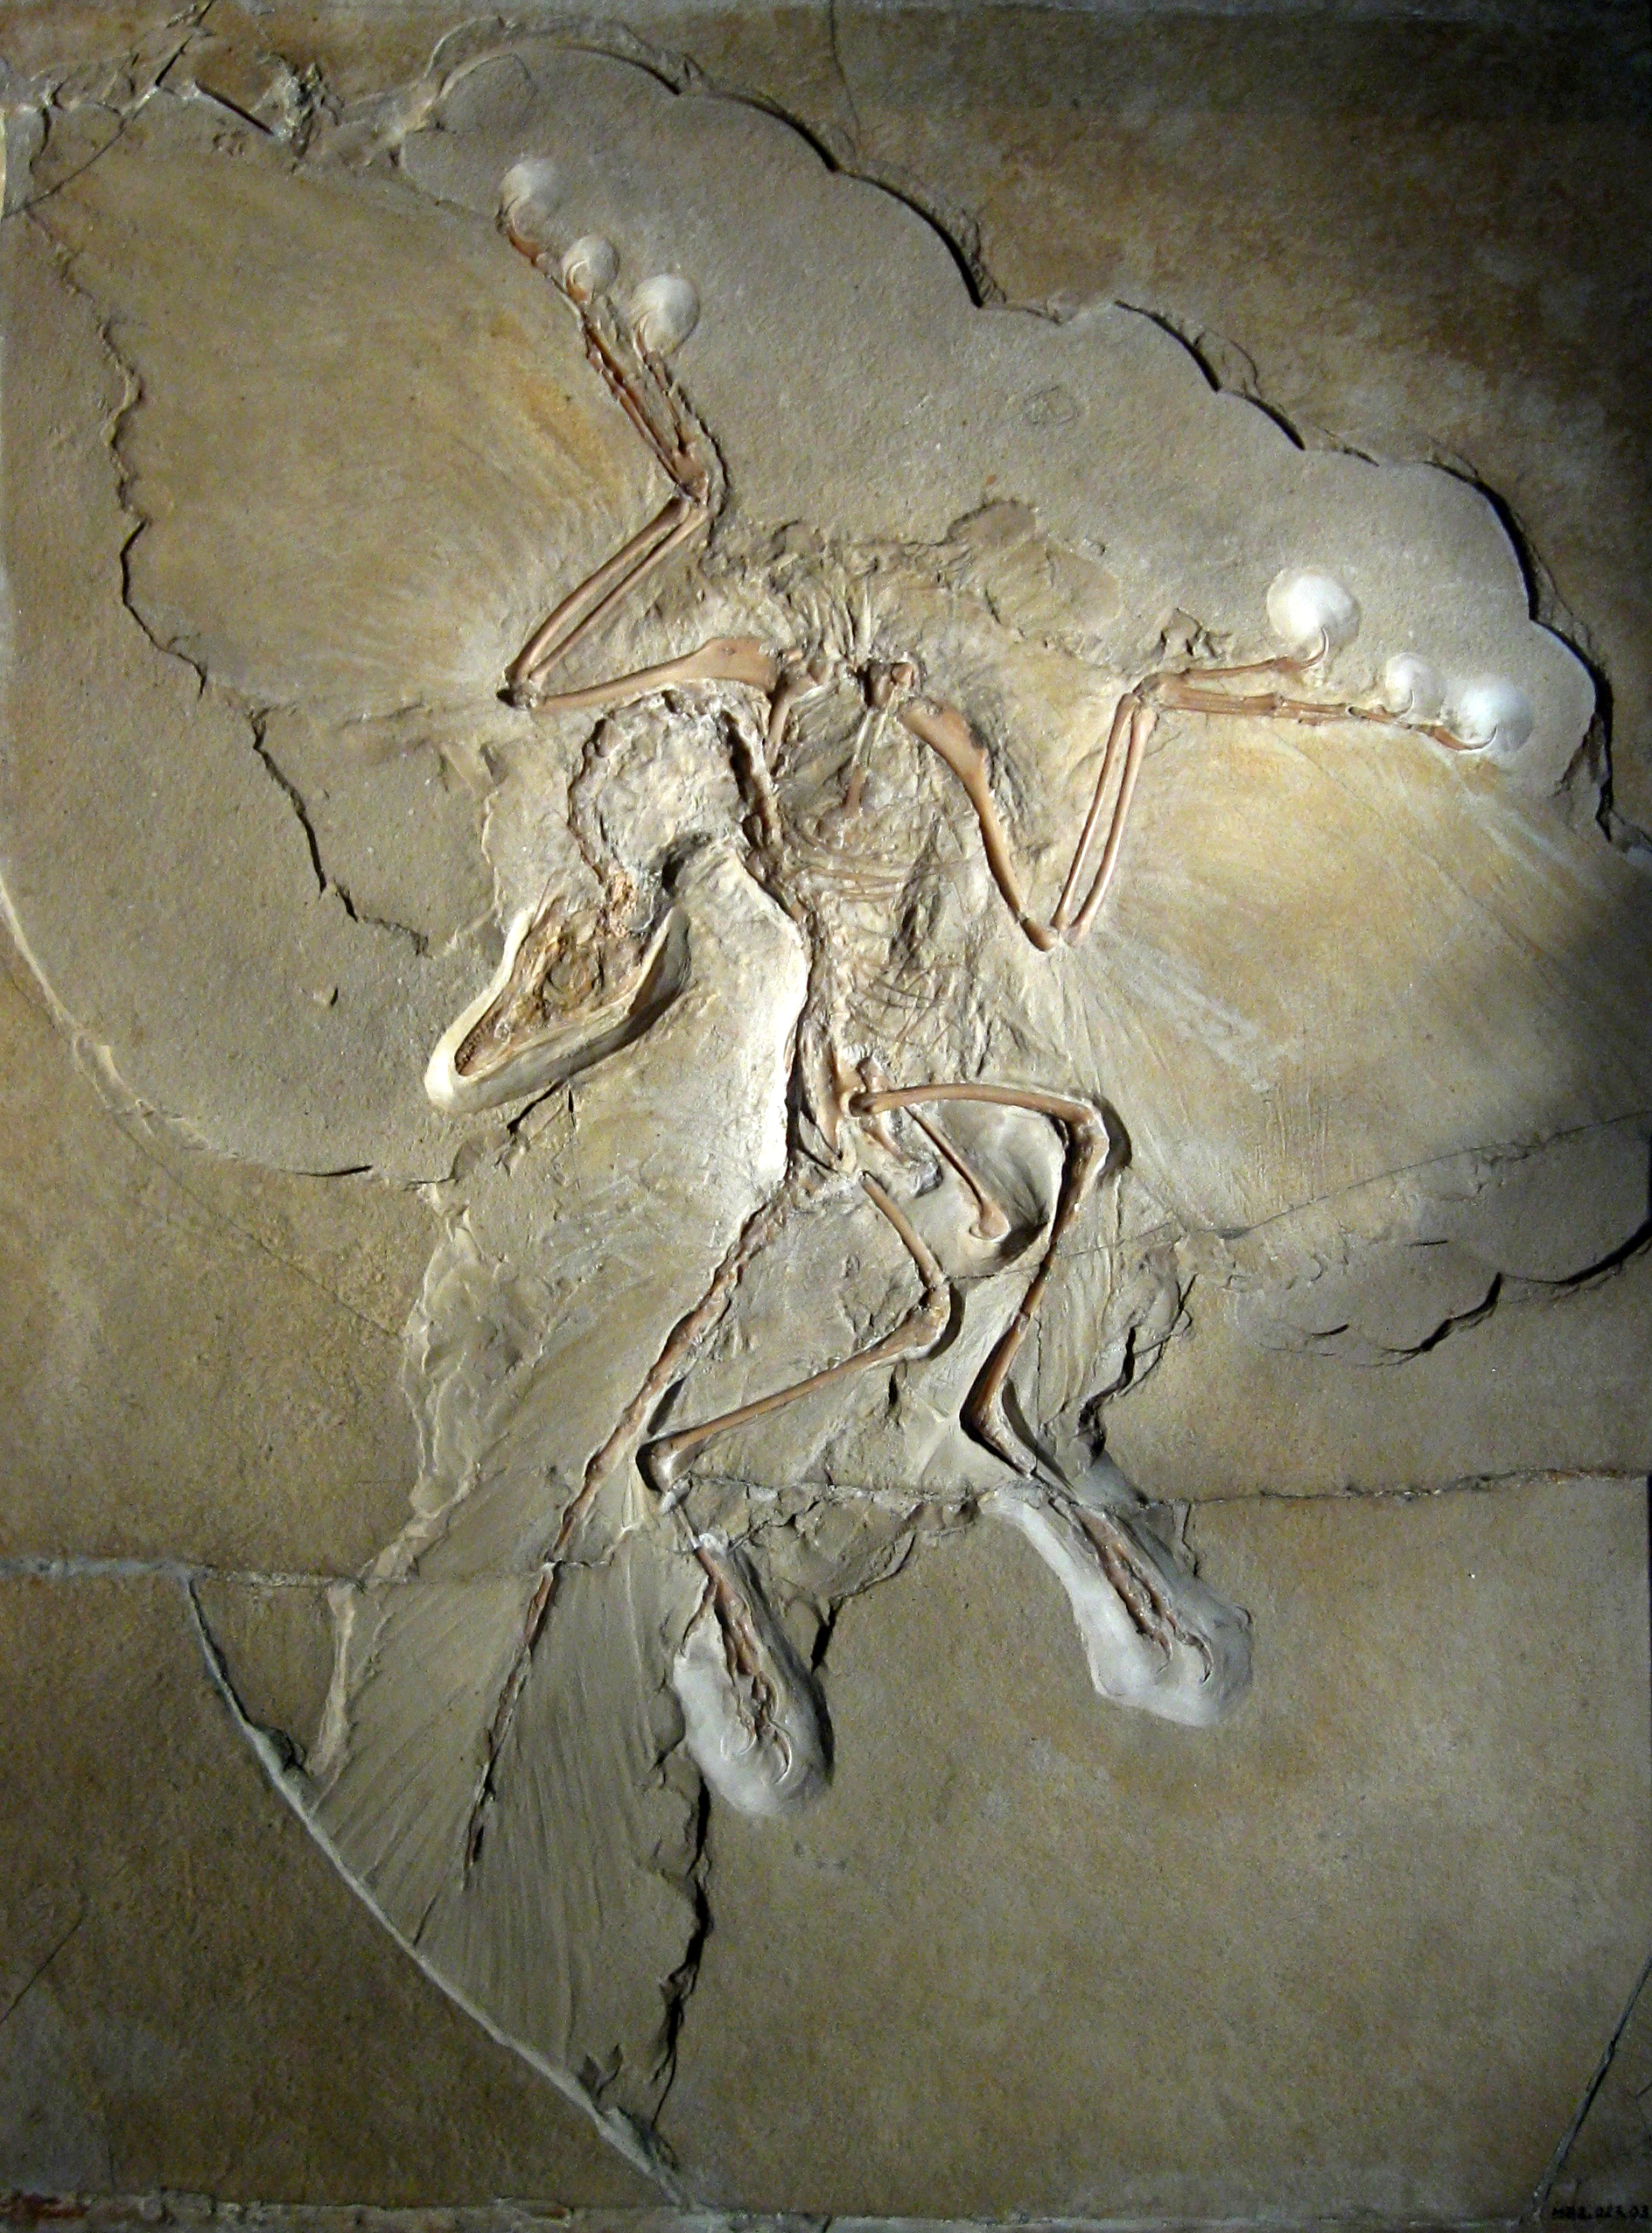
The pterosaurs grew and diversified in the Jurassic, and another notable arial organism developed and thrived in the Jurassic: birds. When Archeopteryx was found in the Solnhofen Lagerstätte of Germany, a seeming dinosaur-bird hybrid, it started the conversation on the origin of birds. The idea that birds evolved from dinosaurs occurred very early in the history of research into evolution, only a few years after Darwin’s On the Origin of Species. This study used a remarkable fossil of Archeopteryx from a transitional animal between dinosaurs and birds. Small meat-eating theropod dinosaurs were likely the branch that became birds due to their similar features. A significant debate still exists over how and when powered flight evolved. Some have stated a running-start model, while others have favored a tree-leaping gliding model or even a semi-combination: flapping to aid in climbing.
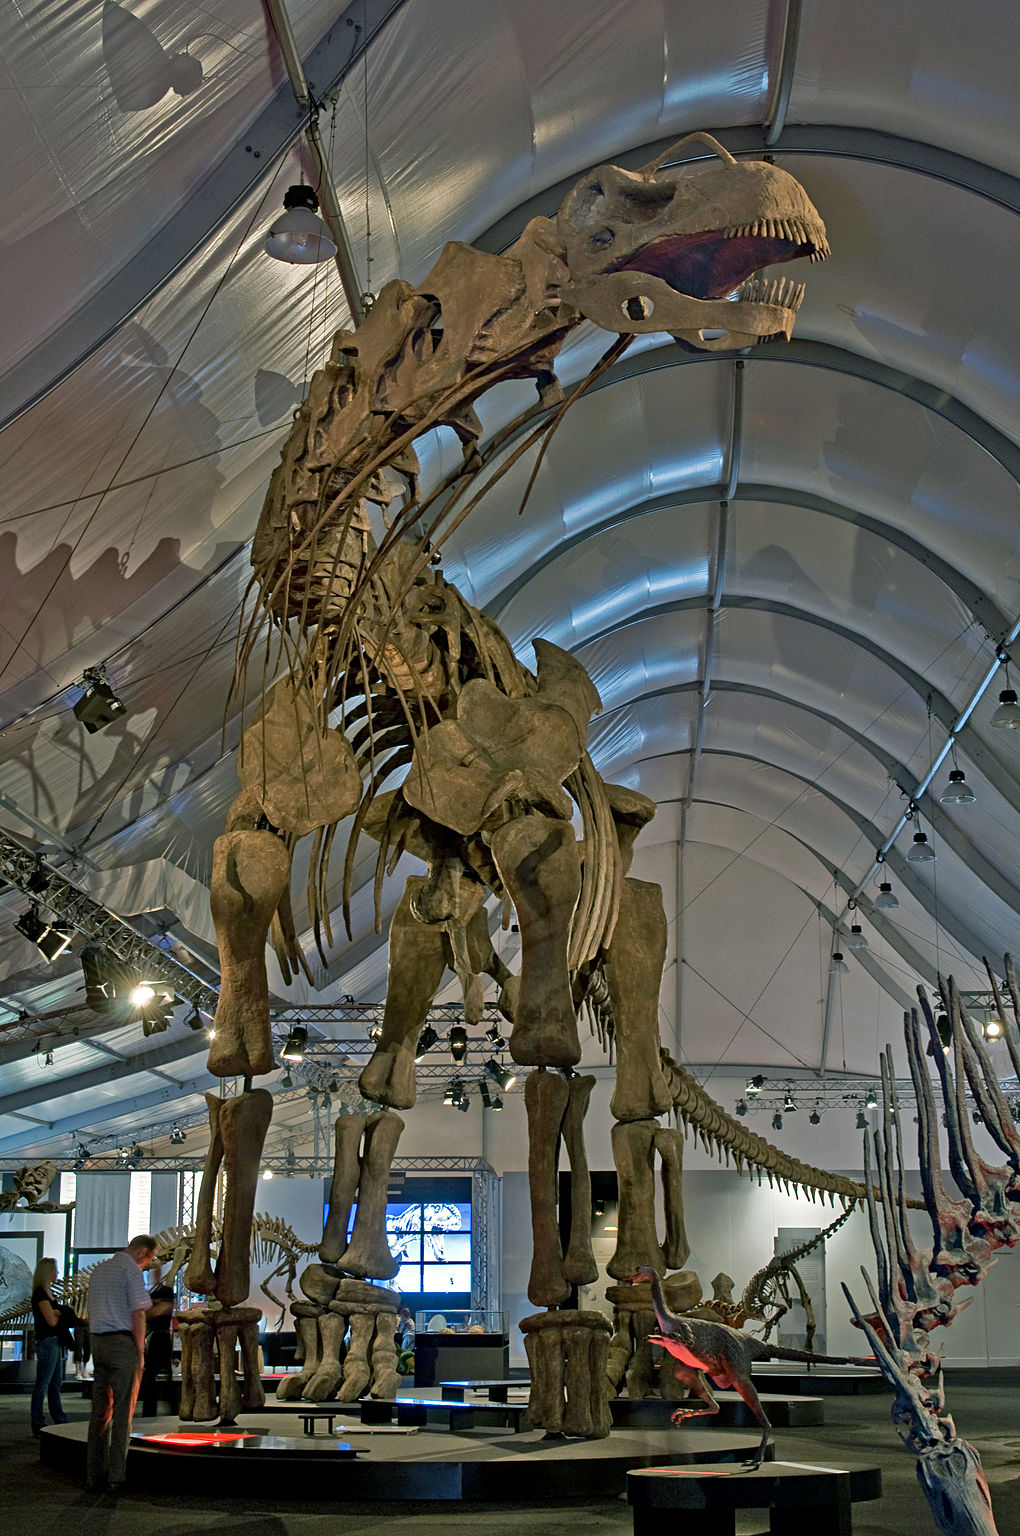
The Cretaceous saw a further diversification, specialization, and domination of the dinosaurs and other fauna. One of the biggest changes on land was the transition to angiosperm-dominated flora. Angiosperms, which are plants with flowers and seeds, had originated in the Cretaceous, switching many plains to grasslands by the end of the Mesozoic. By the end of the period, they had replaced gymnosperms (evergreen trees) and ferns as the dominant plant in the world’s forests. Haplodiploid eusocial insects (bees and ants) are descendants from Jurassic wasp-like ancestors that co-evolved with the flowering plants during this time period. The breakup of Pangea not only shaped our modern world’s geography, but biodiversity at the time as well. Throughout the Mesozoic, animals on the isolated, now separated island continents (formerly parts of Pangea), took strange evolutionary turns. This includes giant titanosaurian sauropods (Argentinosaurus) and theropods (Giganotosaurus) from South America.
K-T Extinction
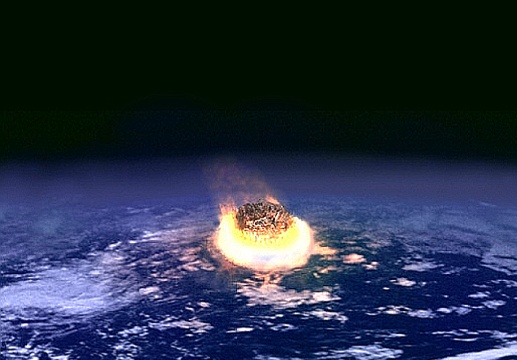
Similar to the end of the Paleozoic era, the Mesozoic Era ended with the K-Pg Mass Extinction (previously known as the K-T Extinction) 66 million years ago. This extinction event was likely caused by a large bolide (an extraterrestrial impactor such as an asteroid, meteoroid, or comet) that collided with earth. Ninety percent of plankton species, 75% of plant species, and all the dinosaurs went extinct at this time.
One of the strongest pieces of evidence comes from the element iridium. Quite rare on Earth, and more common in meteorites, it has been found all over the world in higher concentrations at a particular layer of rock that formed at the time of the K-T boundary. Soon other scientists started to find evidence to back up the claim. Melted rock spheres, a special type of “shocked” quartz called stishovite, that only is found at impact sites, was found in many places around the world. The huge impact created a strong thermal pulse that could be responsible for global forest fires, strong acid rains, a corresponding abundance of ferns, the first colonizing plants after a forest fire, enough debris thrown into the air to significantly cool temperatures afterward, and a 2-km high tsunami inferred from deposits found from Texas to Alabama.
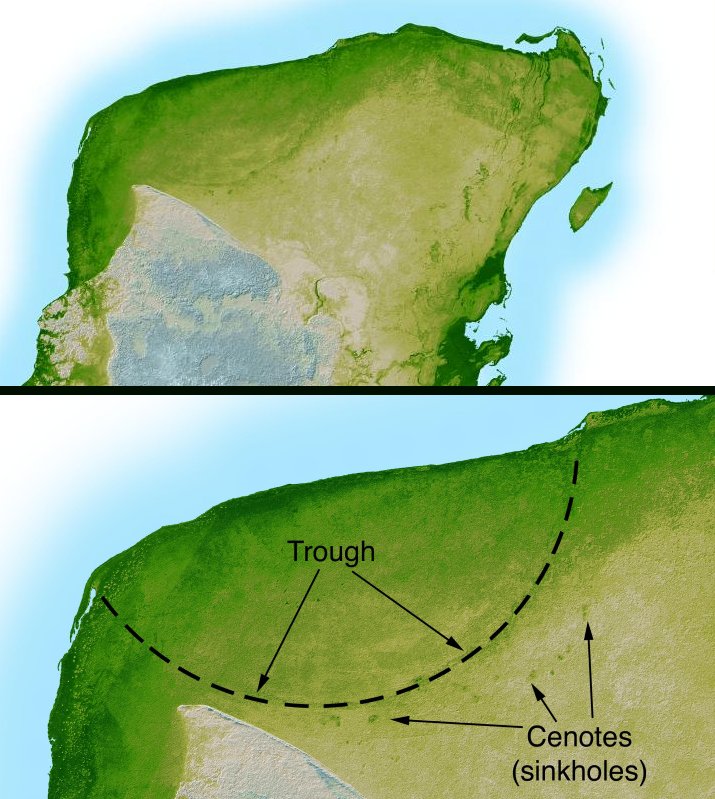
Still, with all this evidence, one large piece remained missing: the crater where the bolide impacted. It was not until 1991 that the crater was confirmed using petroleum company geophysical data. Even though it is the third largest confirmed crater on Earth at roughly 180 km wide, the Chicxulub Crater was hard to find due to being partially underwater and partially obscured by the dense forest canopy of the Yucatan Peninsula. Coring of the center of the impact called the peak ring contained granite, indicating the impact was so powerful that it lifted basement sediment from the crust several miles toward the surface. In 2010, an international team of scientists reviewed 20 years of research and blamed the impact for the extinction.
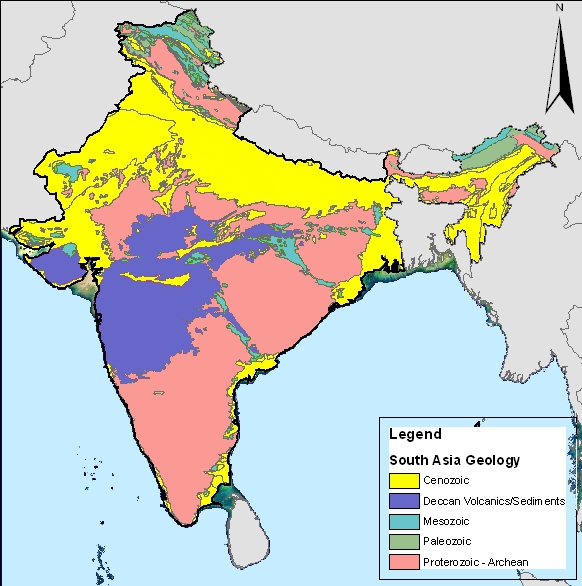
With all of this information, it seems like the case would be closed. However, there are other events at this time which could have partially aided the demise of so many organisms. For example, sea levels are known to be slowly decreasing at the time of the K-T event, which is tied to marine extinctions, though any study on gradual vs. sudden changes in the fossil record is flawed due to the incomplete nature of the fossil record. Another big event at this time was the Deccan Traps flood basalt volcanism in India. At over 1.3 million cubic kilometers of material, it was certainly a large source of material hazardous to ecosystems at the time, and it has been suggested as at least partially responsible for the extinction. Some have found the impact and eruptions too much of a coincidence, and have even linked the two together.

Take this quiz to check your comprehension of this section.
If you are using an offline version of this text, access the quiz for section 8.5 via the QR code.
8.6 Phanerozoic Eon: Cenozoic Era
The Cenozoic, meaning “new life,” is known as the age of mammals because it is in this era that mammals came to be a dominant and large life form, including human ancestors. Birds, as well, flourished in the open niches left by the dinosaur’s demise. Most of the Cenozoic has been relatively warm, with the main exception being the ice age that started about 2.558 million years ago and (despite recent warming) continues today. Tectonic shifts in the west caused volcanism, but eventually changed the long-standing subduction zone into a transform boundary.
8.6.1 Cenozoic Tectonics and Paleogeography

Video 8.6: Animation of the last 38 million years of movement in western North America. Note, that after the ridge is subducted, convergent turns to transform (with divergent inland).
If you are using an offline version of this text, access this YouTube video via the QR code.
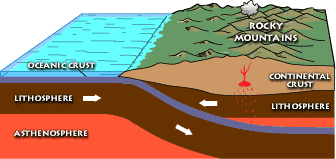
In the Cenozoic, the plates of the Earth moved into more familiar places, with the biggest change being the closing of the Tethys Sea with collisions such as the Alps, Zagros, and Himalaya, a collision that started about 57 million years ago, and continues today. Maybe the most significant tectonic feature that occurred in the Cenozoic of North America was the conversion of the west coast of California from a convergent boundary subduction zone to a transform boundary. Subduction off the coast of the western United States, which had occurred throughout the Mesozoic, had continued in the Cenozoic. After the Sevier Orogeny in the late Mesozoic, a subsequent orogeny called the Laramide Orogeny, occurred in the early Cenozoic. The Laramide was thick-skinned, different than the Sevier Orogeny. It involved deeper crustal rocks, and produced bulges that would become mountain ranges like the Rockies, Black Hills, Wind River Range, Uinta Mountains, and the San Rafael Swell. Instead of descending directly into the mantle, the subducting plate shallowed out and moved eastward beneath the continental plate affecting the overlying continent hundreds of miles east of the continental margin and building high mountains. This occurred because the subducting plate was so young and near the spreading center and the density of the plate was therefore low and subduction was hindered.
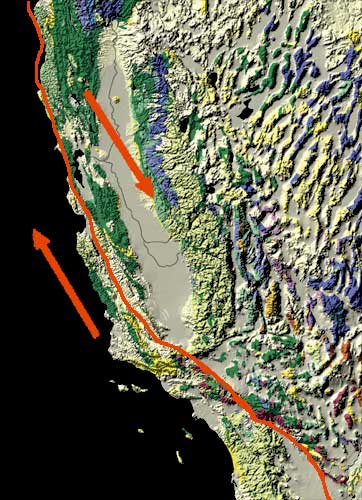
As the mid-ocean ridge itself started to subduct, the relative motion had changed. Subduction caused a relative convergence between the subducting Farallon plate and the North American plate. On the other side of the mid-ocean ridge from the Farallon plate was the Pacific plate, which was moving away from the North American plate. Thus, as the subduction zone consumed the mid-ocean ridge, the relative movement became transform instead of convergent, which went on to become the San Andreas Fault System. As the San Andreas grew, it caused east-west directed extensional forces to spread over the western United States, creating the Basin and Range province. The transform fault switched position over the last 18 million years, twisting the mountains around Los Angeles, and new faults in the southeastern California deserts may become a future San Andreas-style fault. During this switch from subduction to transform, the nearly horizontal Farallon slab began to sink into the mantle. This caused magmatism as the subducting slab sank, allowing asthenosphere material to rise around it. This event is called the Oligocene ignimbrite flare-up, which was one of the most significant periods of volcanism ever, including the largest single confirmed eruption, the 5000 cubic kilometer Fish Canyon Tuff.
8.6.2 Cenozoic Evolution

There are five groups of early mammals in the fossil record, based primarily on fossil teeth, the hardest bone in vertebrate skeletons. For the purpose of this text, the most important group are the Eupantotheres, that diverge into the two main groups of mammals, the marsupials (like Sinodelphys) and placentals or eutherians (like Eomaia) in the Cretaceous and then diversified in the Cenozoic. The marsupials dominated on the isolated island continents of South America and Australia, and many went extinct in South America with the introduction of placental mammals. Some well-known mammal groups have been highly studied with interesting evolutionary stories in the Cenozoic. For example, horses started small with four toes, ended up larger and having just one toe. Cetaceans (marine mammals like whales and dolphins) started on land from small bear-like (mesonychids) creatures in the early Cenozoic and gradually took to water. However, no study of evolution has been more studied than human evolution. Hominids, the name for human-like primates, started in eastern Africa several million years ago.
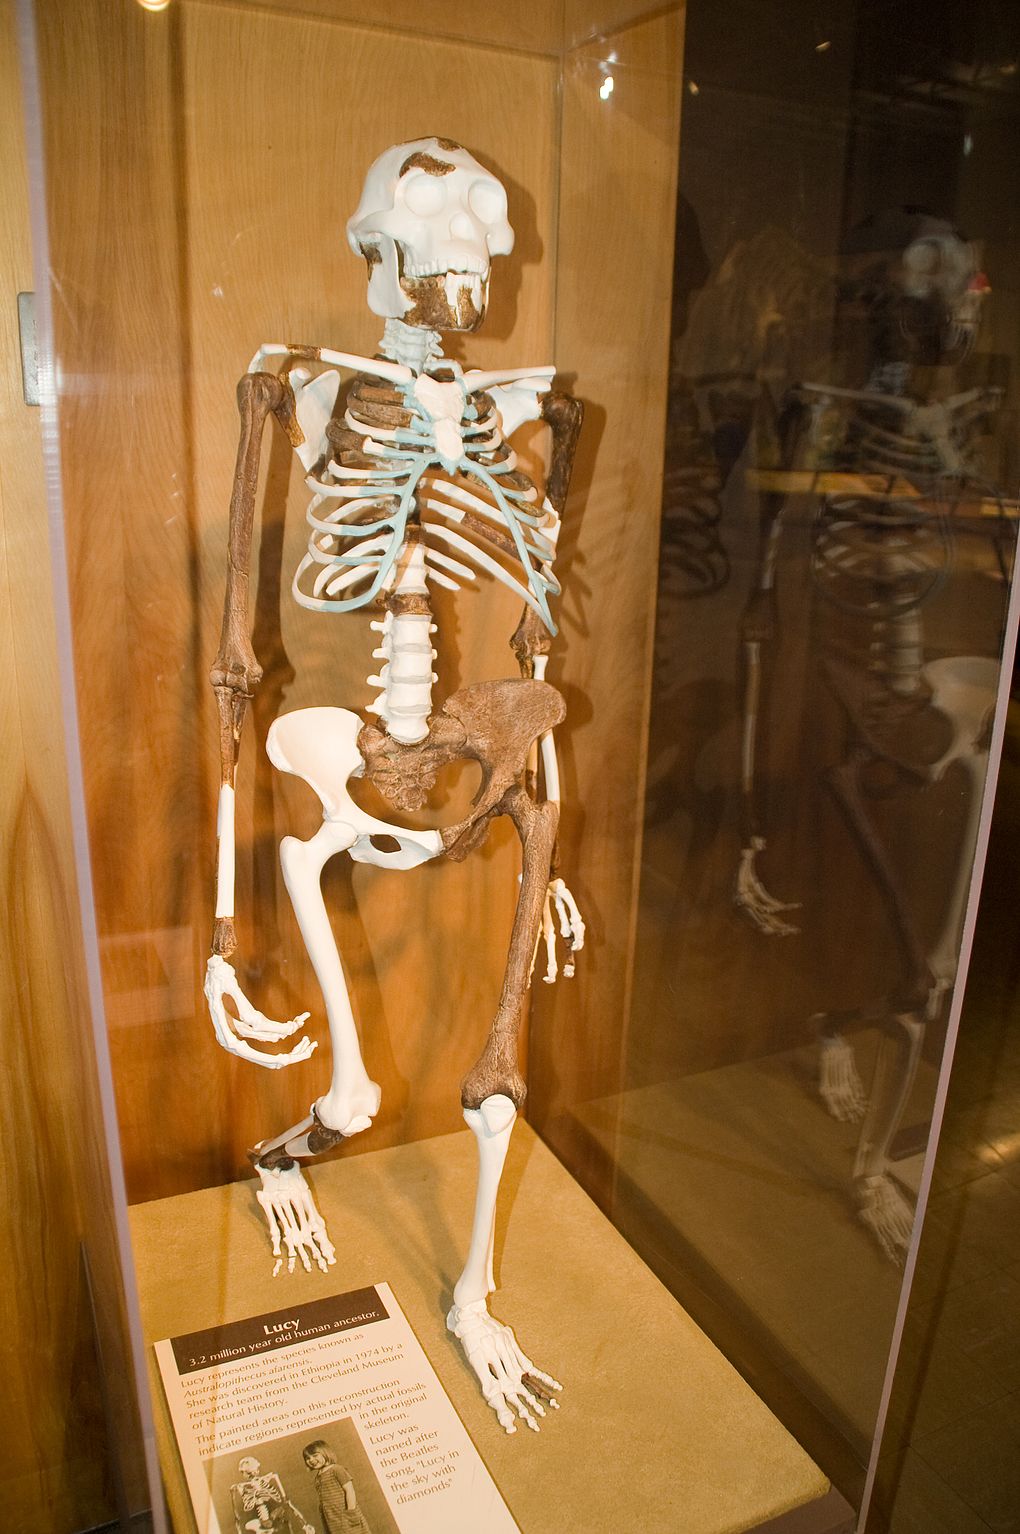
The first critical event in this story is an environmental change from jungle to more of a savanna, probably caused by changes in Indian Ocean circulation. While bipedalism is known to have evolved before this shift, it is generally believed that our bipedal ancestors (like Australopithecus) had an advantage by covering ground more easily in a more open environment compared to their non-bipedal evolutionary cousins. There is also a growing body of evidence, including the famous “Lucy” fossil of an Australopithecine, that our early ancestors lived in trees. Arboreal animals usually demand a high intelligence to navigate through a three-dimensional world. It is from this lineage that humans evolved, using endurance running as a means to acquire more resources and possibly even hunt. This can explain many uniquely human features, from our long legs, strong achilles, lack of lower gut protection, and our wide range of running efficiencies.
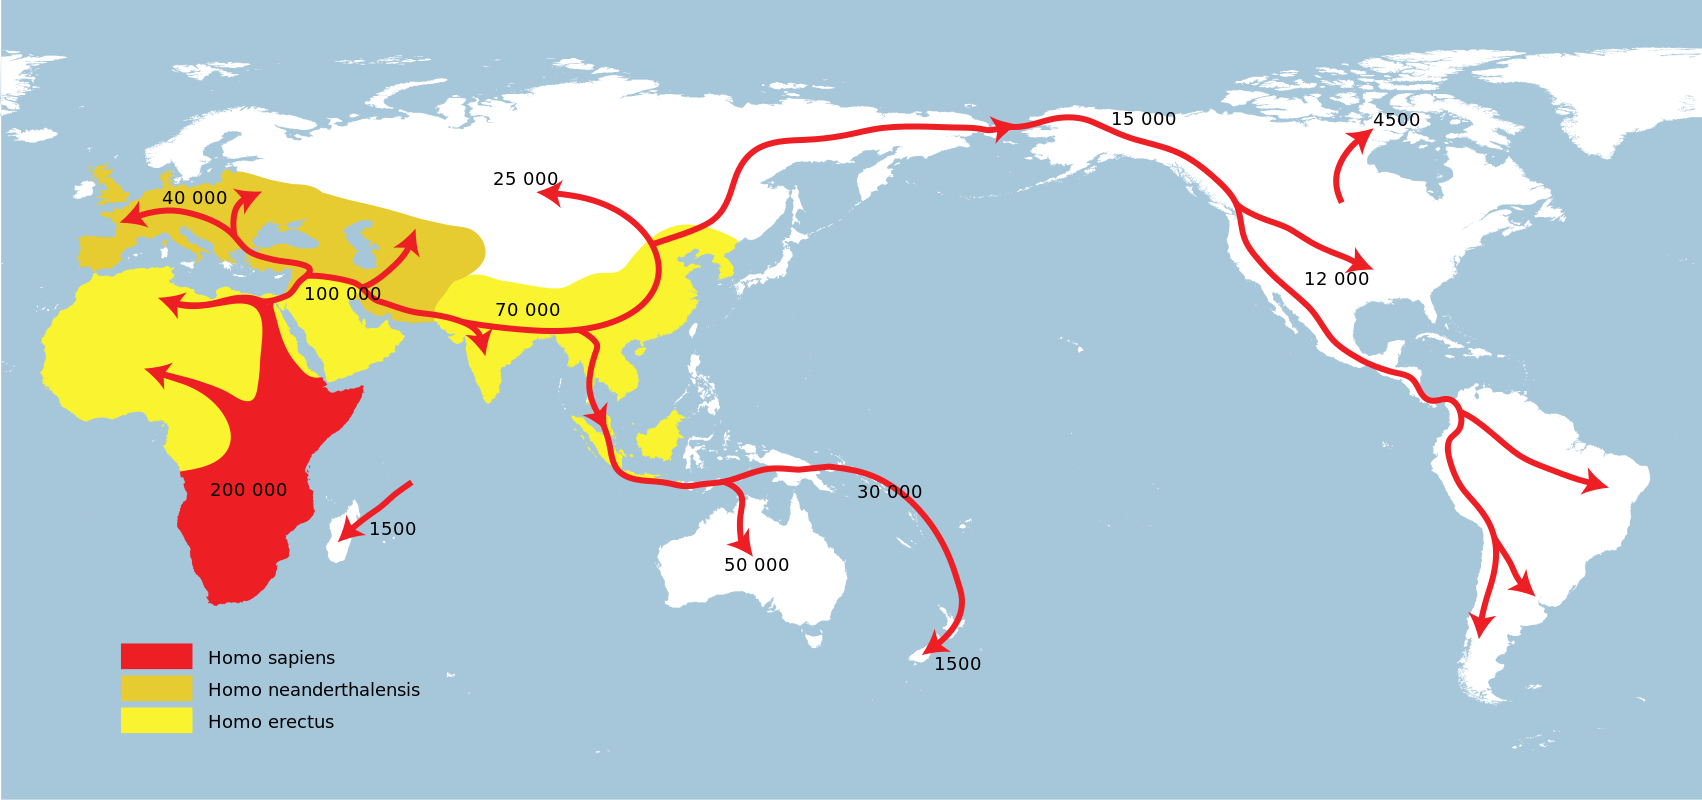
Now that the hands are freed up, the next big step is a large brain. There have been arguments from a switch to more meat eating, cooking with fire, tool use, and even the construct of society itself to explain this increase in brain size. Regardless of how, it was this increased cognitive power that allowed humans to reign as their ancestors moved out of Africa and explored the world, ultimately entering the Americas through land bridges like the Bering Land Bridge. The details of this worldwide migration and the different branches of the hominid evolutionary tree are very complex, and best reserved for its own course.
Anthropocene and Extinction
Humans have had an influence on the Earth, its ecosystems and climate. Yet, human activity can not explain all of the changes that have occurred in the recent past. The start of the Quaternary period, the last and current period of the Cenozoic, is marked by the start of our current ice age 2.58 million years ago. During this time period, ice sheets advanced and retreated, most likely due to Milankovitch cycles (see chapter 15). Also at this time, various cold-adapted megafauna emerged (like giant sloths, saber-tooth cats, and woolly mammoths), and most of them went extinct as the Earth warmed from the most recent glacial maximum. A long-standing debate is over the cause of these and other extinctions. Is climate warming to blame, or were they caused by humans? Certainly, we know of recent human extinctions of animals like the dodo or passenger pigeon. Can we connect modern extinctions to extinctions in the recent past? If so, there are several ideas as to how this happened. Possibly the most widely accepted and oldest is the hunting/overkill hypothesis. The idea behind this hypothesis is that humans hunted large herbivores for food, then carnivores could not find food, and human arrival times in locations has been shown to be tied to increased extinction rates in many cases.
Modern human impact on the environment and the Earth as a whole is unquestioned. In fact, many scientists are starting to suggest that the rise of human civilization ended and/or replaced the Holocene epoch and defines a new geologic time interval: the Anthropocene. Evidence for this change includes extinctions, increased tritium (hydrogen with two neutrons) due to nuclear testing, rising pollutants like carbon dioxide, more than 200 never-before seen mineral species that have occurred only in this epoch, materials such as plastic and metals which will be long lasting “fossils” in the geologic record, and large amounts of earthen material moved. The biggest scientific debate with this topic is the starting point. Some say that humans’ invention of agriculture would be recognized in geologic strata and that should be the starting point, around 12,000 years ago. Others link the start of the industrial revolution and the subsequent addition of vast amounts of carbon dioxide in the atmosphere. Either way, the idea is that alien geologists visiting Earth in the distant future would easily recognize the impact of humans on the Earth as the beginning of a new geologic period.

Take this quiz to check your comprehension of this section.
If you are using an offline version of this text, access the quiz for section 8.6 via the QR code.
Summary
The changes that have occurred since the inception of Earth are vast and significant. From the oxygenation of the atmosphere, the progression of life forms, the assembly and deconstruction of several supercontinents, to the extinction of more life forms than exist today, having a general understanding of these changes can put present change into a more rounded perspective.

Take this quiz to check your comprehension of this chapter.
If you are using an offline version of this text, access the quiz for chapter 8 via the QR code.
URLs Linked Within This Chapter
Charles Walcott (1850–1927): http://www.nasonline.org/member-directory/deceased-members/20000936.html
Text References
- Alvarez, L.W., Alvarez, W., Asaro, F., and Michel, H.V., 1980, Extraterrestrial cause for the cretaceous-tertiary extinction: Science, v. 208, no. 4448, p. 1095–1108.
- Beerling, D., 2008, The emerald planet: how plants changed Earth’s history: OUP Oxford.
- Boyce, J.W., Liu, Y., Rossman, G.R., Guan, Y., Eiler, J.M., Stolper, E.M., and Taylor, L.A., 2010, Lunar apatite with terrestrial volatile abundances: Nature, v. 466, no. 7305, p. 466–469.
- Brueckner, H.K., and Snyder, W.S., 1985, Structure of the Havallah sequence, Golconda allochthon, Nevada: Evidence for prolonged evolution in an accretionary prism: Geol. Soc. Am. Bull., v. 96, no. 9, p. 1113–1130.
- Brusatte, S.L., Benton, M.J., Ruta, M., and Lloyd, G.T., 2008, The first 50 Myr of dinosaur evolution: macroevolutionary pattern and morphological disparity: Biol. Lett., v. 4, no. 6, p. 733–736.
- Canup, R.M., and Asphaug, E., 2001, Origin of the Moon in a giant impact near the end of the Earth’s formation: Nature, v. 412, no. 6848, p. 708–712.
- Clack, J.A., 2009, The Fish–Tetrapod Transition: New Fossils and Interpretations: Evolution: Education and Outreach, v. 2, no. 2, p. 213–223., doi: 10/cz257q.
- Cohen, K.M., Finney, S.C., Gibbard, P.L., and Fan, J.-X., 2013, The ICS International Chronostratigraphic Chart: Episodes, v. 36, no. 3, p. 199–204.
- Colbert, E.H., and Morales, M.A., 1991, History of the Backboned Animals Through Time: New York: Wiley.
- De Laubenfels, M.W., 1956, Dinosaur extinction: one more hypothesis: J. Paleontol.
- Gomes, R., Levison, H.F., Tsiganis, K., and Morbidelli, A., 2005, Origin of the cataclysmic Late Heavy Bombardment period of the terrestrial planets: Nature, v. 435, no. 7041, p. 466–469.
- Hatcher, R.D., Jr, Thomas, W.A., and Viele, G.W., 1989, The Appalachian-Ouachita Orogen in the United States: Geological Society of America.
- Hosono, N., Karato, S., Makino, J., and Saitoh, T.R., 2019, Terrestrial magme ocean origin of the Moon: Nature Geoscience, p. 1., doi: 10.1038/s41561-019-0354-2.
- Hsiao, E., 2004, Possibility of life on Europa.
- Hubble, E., 1929, A relation between distance and radial velocity among extra-galactic nebulae: Proc. Natl. Acad. Sci. U. S. A., v. 15, no. 3, p. 168–173.
- Ingersoll, R.V., 1982, Triple-junction instability as cause for late Cenozoic extension and fragmentation of the western United States: Geology, v. 10, no. 12, p. 621–624.
- Johnson, C.M., 1991, Large-scale crust formation and lithosphere modification beneath Middle to Late Cenozoic calderas and volcanic fields, western North America: J. Geophys. Res. [Solid Earth], v. 96, no. B8, p. 13485–13507.
- Kass, M.S., 1999, Prognathodon stadtmani:(Mosasauridae) a new species from the Mancos Shale (lower Campanian) of western Colorado: Vertebrate Paleontology in Utah, Utah Geological.
- Livaccari, R.F., 1991, Role of crustal thickening and extensional collapse in the tectonic evolution of the Sevier-Laramide orogeny, western United States: Geology, v. 19, no. 11, p. 1104–1107.
- McMenamin, M.A., and Schulte McMenamin, D.L., 1990, The Emergence of Animals: The Cambrian Breakthrough: Columbia University Press.
- Mitrovica, J.X., Beaumont, C., and Jarvis, G.T., 1989, Tilting of continental interiors by the dynamical effects of subduction: Tectonics.
- Rücklin, M., Donoghue, P.C.J., Johanson, Z., Trinajstic, K., Marone, F., and Stampanoni, M., 2012, Development of teeth and jaws in the earliest jawed vertebrates: Nature, v. 491, no. 7426, p. 748–751.
- Sahney, S., and Benton, M.J., 2008, Recovery from the most profound mass extinction of all time: Proc. Biol. Sci., v. 275, no. 1636, p. 759–765.
- Salaris, M., and Cassisi, S., 2005, Evolution of stars and stellar populations: John Wiley & Sons.
- Schoch, R.R., 2012, Amphibian Evolution: The life of Early Land Vertebrates: Wiley-Blackwell.
- Sharp, B.J., 1958, MINERALIZATION IN THE INTRUSIVE ROCKS IN LITTLE COTTONWOOD CANYON, UTAH: GSA Bulletin, v. 69, no. 11, p. 1415–1430., doi: 10.1130/0016-7606(1958)69[1415:MITIRI]2.0.CO;2.
- Wiechert, U., Halliday, A.N., Lee, D.C., Snyder, G.A., Taylor, L.A., and Rumble, D., 2001, Oxygen isotopes and the moon-forming giant impact: Science, v. 294, no. 5541, p. 345–348.
- Wilde, S.A., Valley, J.W., Peck, W.H., and Graham, C.M., 2001, Evidence from detrital zircons for the existence of continental crust and oceans on the Earth 4.4 Gyr ago: Nature, v. 409, no. 6817, p. 175–178.
- Wood, R.A., 2019, The rise of Animals.: Scientific American, v. 320, no. 6, p. 24–31.
Figure References
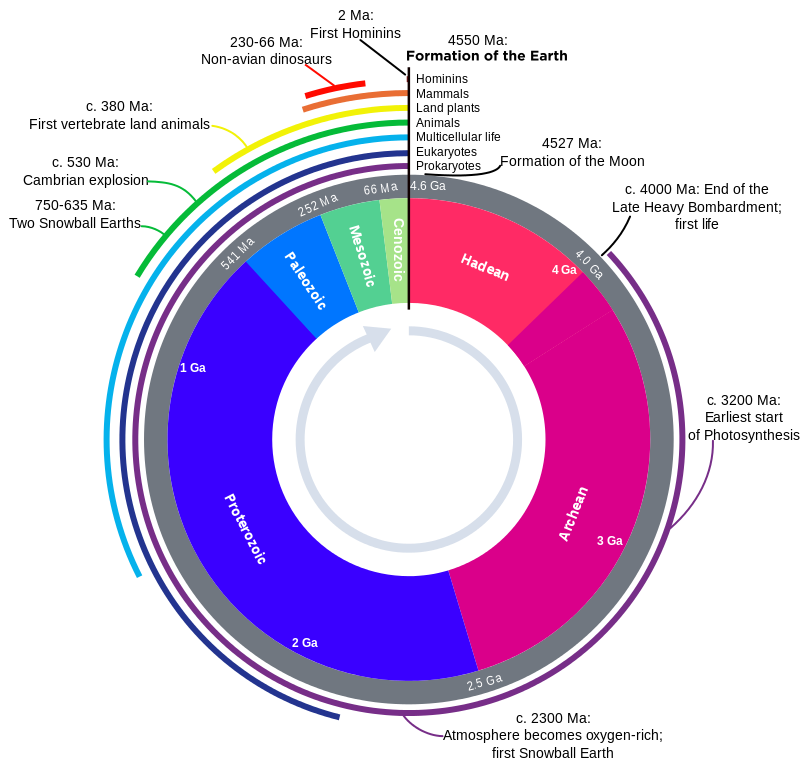
Figure 8.1: Geologic time on Earth, represented circularly, to show the individual time divisions and important events. Woudloper; adapted by Hardwigg. 2010. Public domain. https://commons.wikimedia.org/wiki/File:Geologic_Clock_with_events_and_periods.svg
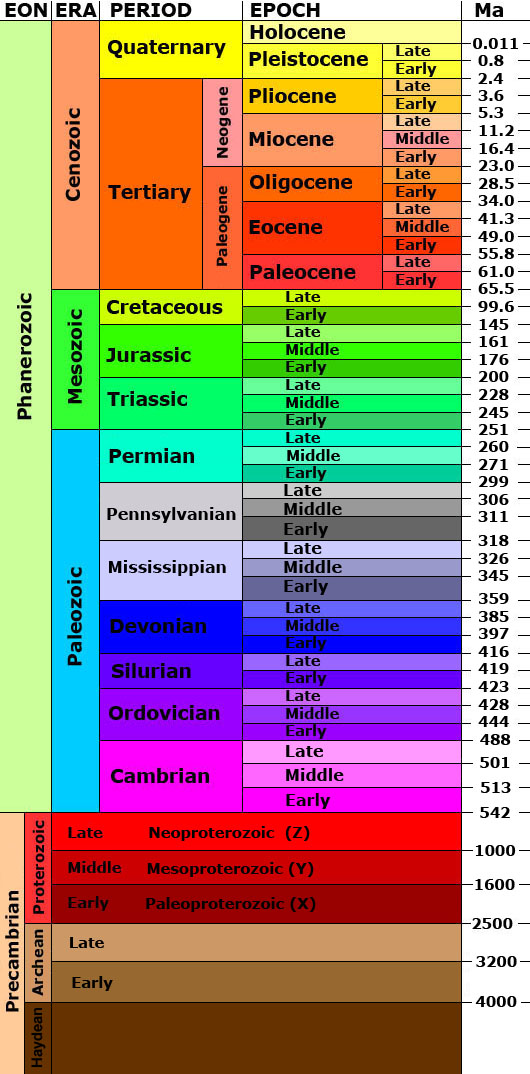
Figure 8.2: Geological time scale with ages shown. USGS. 2009. Public domain. https://commons.wikimedia.org/wiki/File:Geologic_time_scale.jpg
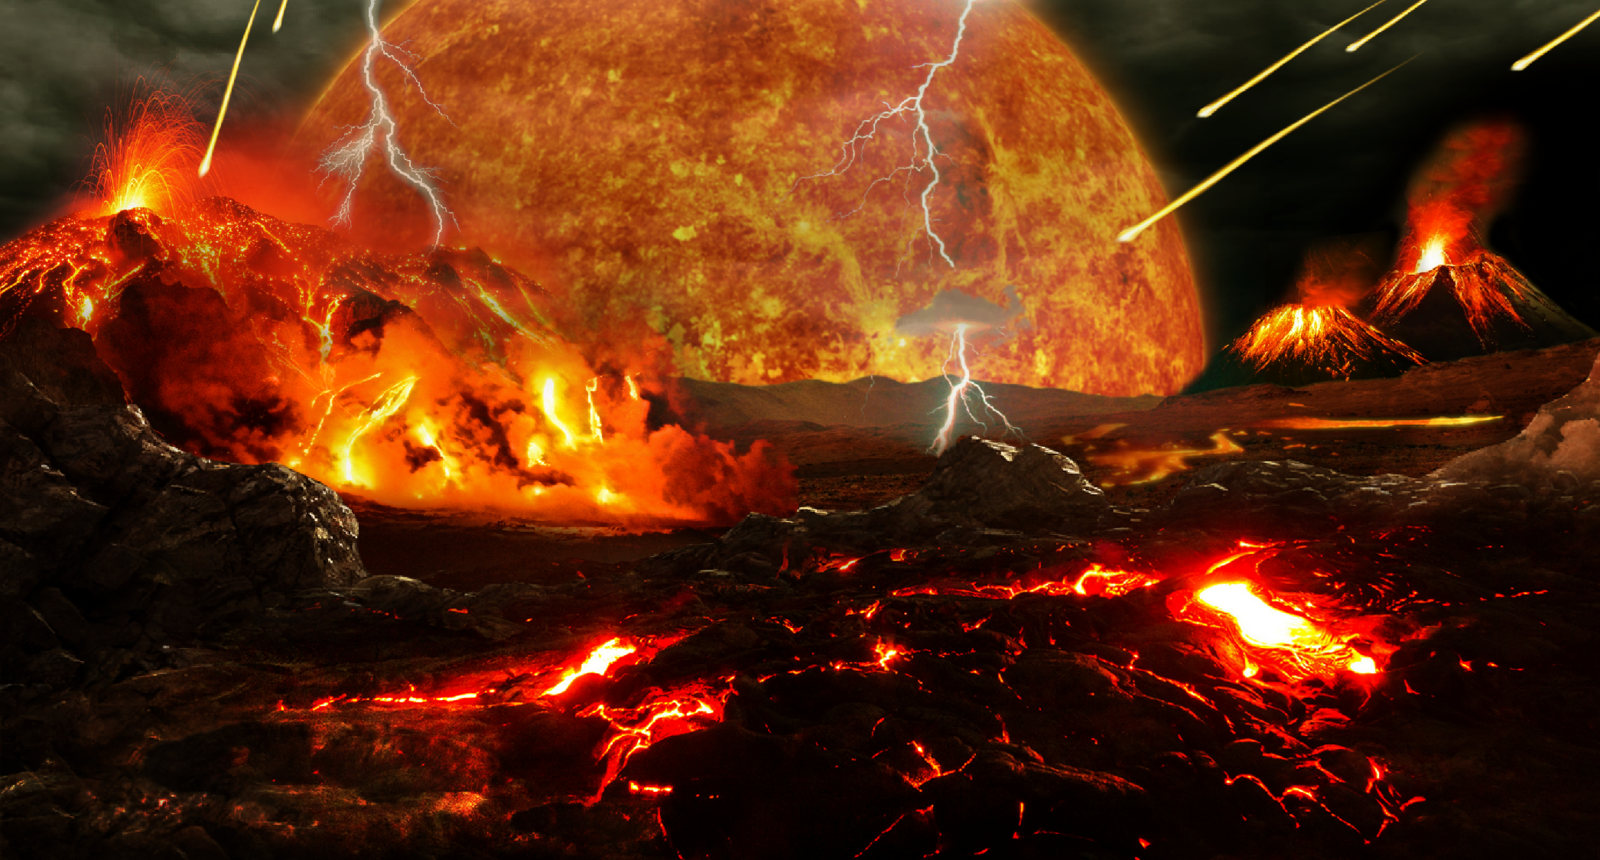
Figure 8.3: Artist’s impression of the Earth in the Hadean. Tim Bertelink. 2016. CC BY-SA 4.0. https://commons.wikimedia.org/wiki/File:Hadean.png
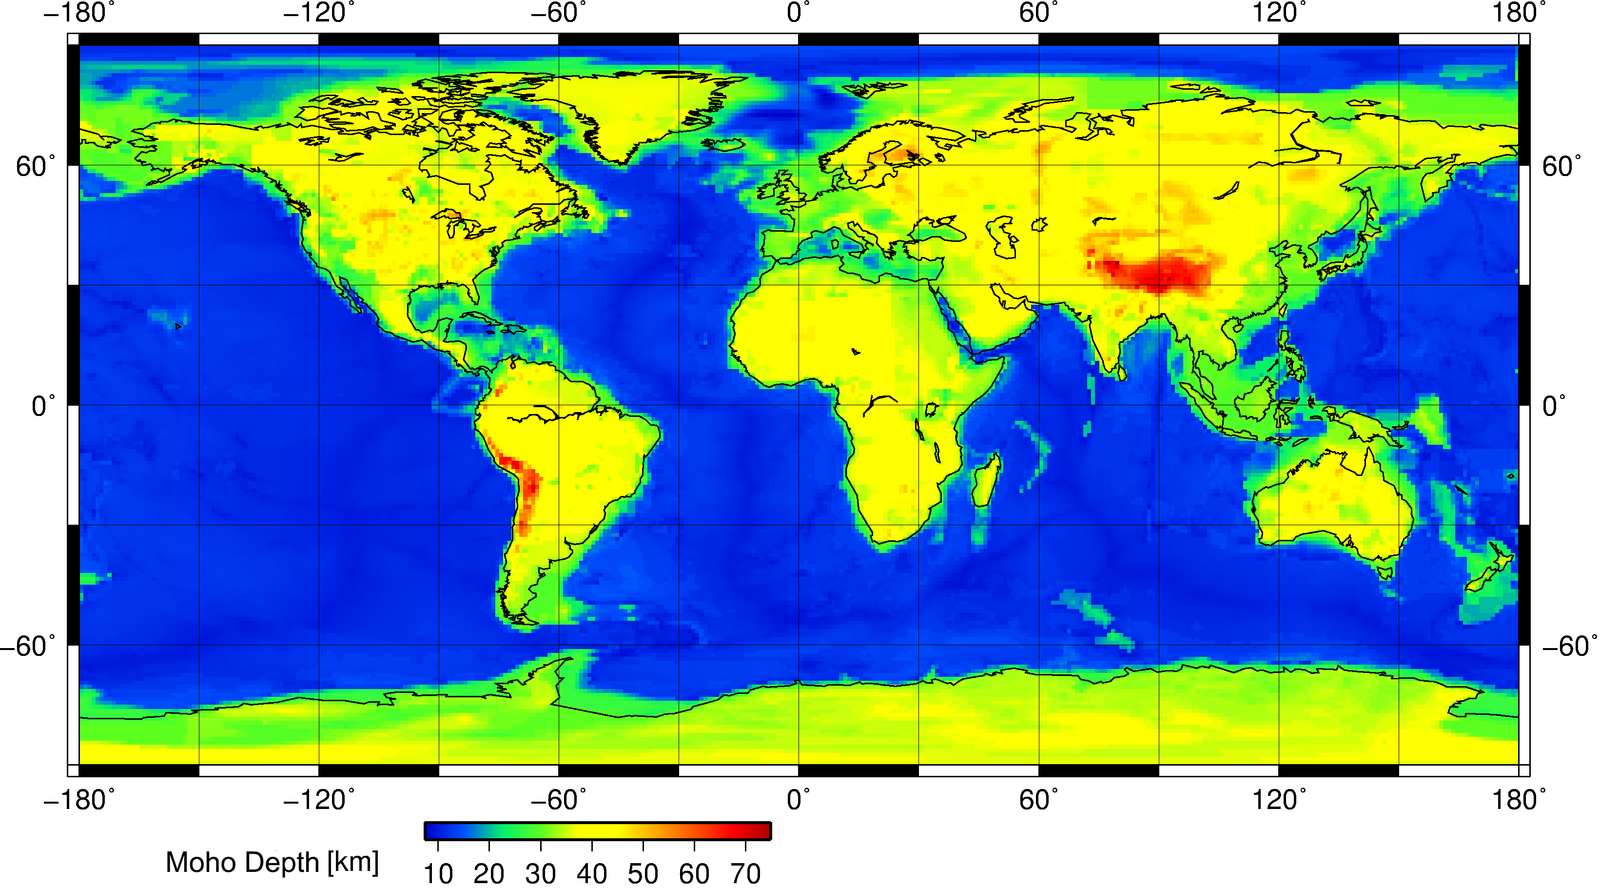
Figure 8.4: The global map of the depth of the moho. AllenMcC. 2013. CC BY-SA 3.0. https://commons.wikimedia.org/wiki/File:Mohomap.png
Figure 8.5: Dark side of the Moon. Apollo 16 astronauts via NASA. 1972. Public domain. https://en.wikipedia.org/wiki/File:Back_side_of_the_Moon_AS16-3021.jpg
Figure 8.6: Artist’s concept of the giant impact from a Mars-sized object that could have formed the moon. NASA/JPL-Caltech. 2017. Public domain. https://www.nasa.gov/multimedia/imagegallery/image_feature_1454.html
Figure 8.7: Water vapor leaves comet 67P/Churyumov–Gerasimenko. ESA/Rosetta/NAVCAM. 2015. CC BY-SA 3.0 IGO. https://commons.wikimedia.org/wiki/File:Comet_on_7_July_2015_NavCam.jpg
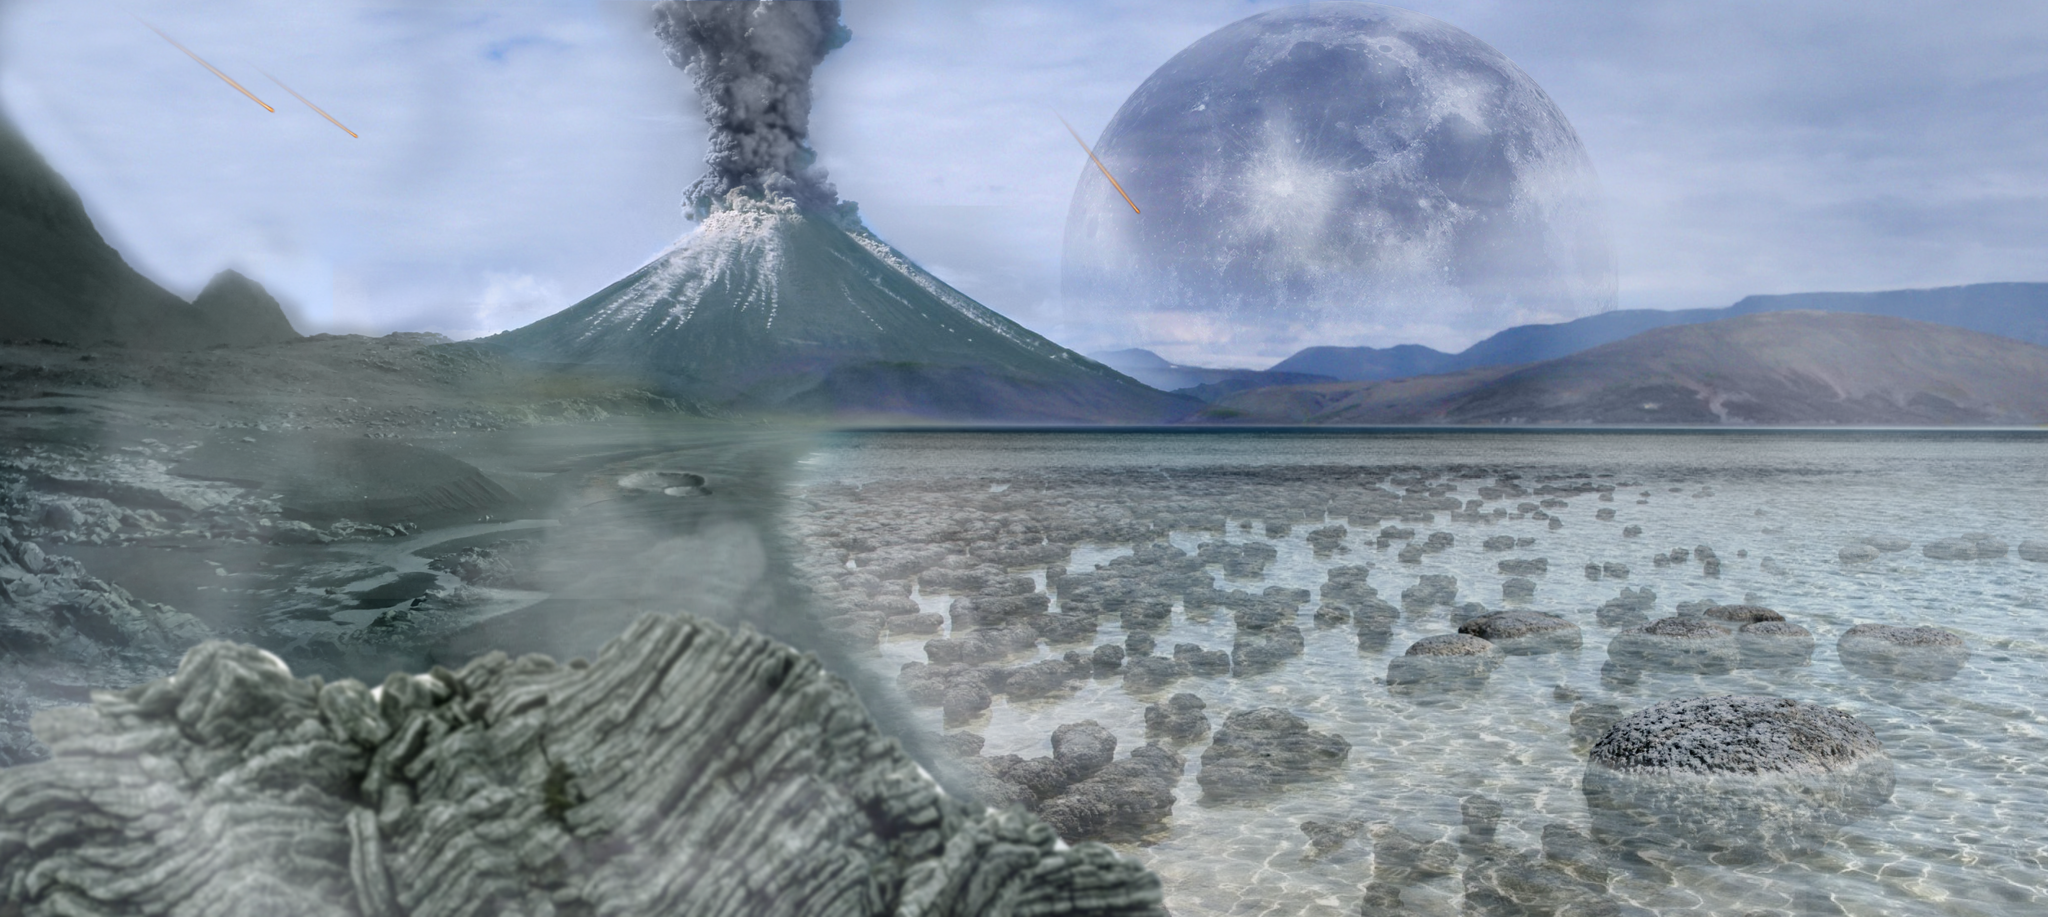
Figure 8.8: Artist’s impression of the Archean. Tim Bertelink. 2017. CC BY-SA 4.0. https://commons.wikimedia.org/wiki/File:Archean.png
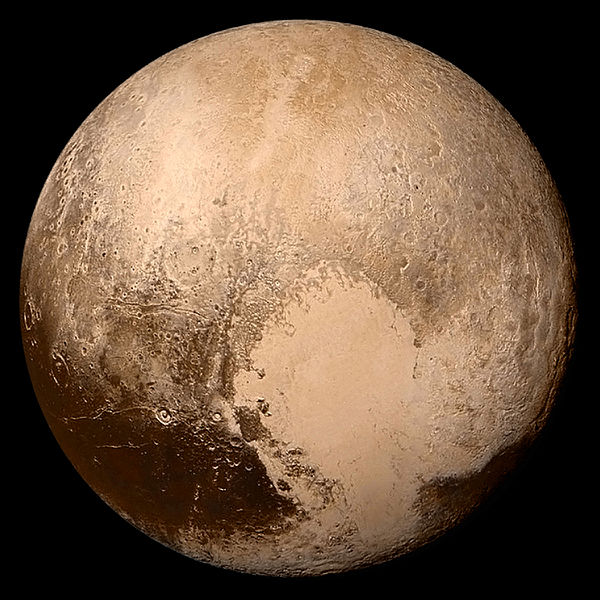
Figure 8.9: 2015 image from NASA’s New Horizons probe of Pluto. NASA / Johns Hopkins University Applied Physics Laboratory / Southwest Research Institute. 2015. Public domain. https://commons.wikimedia.org/wiki/File:Nh-pluto-in-true-color_2x_JPEG-edit-frame.jpg
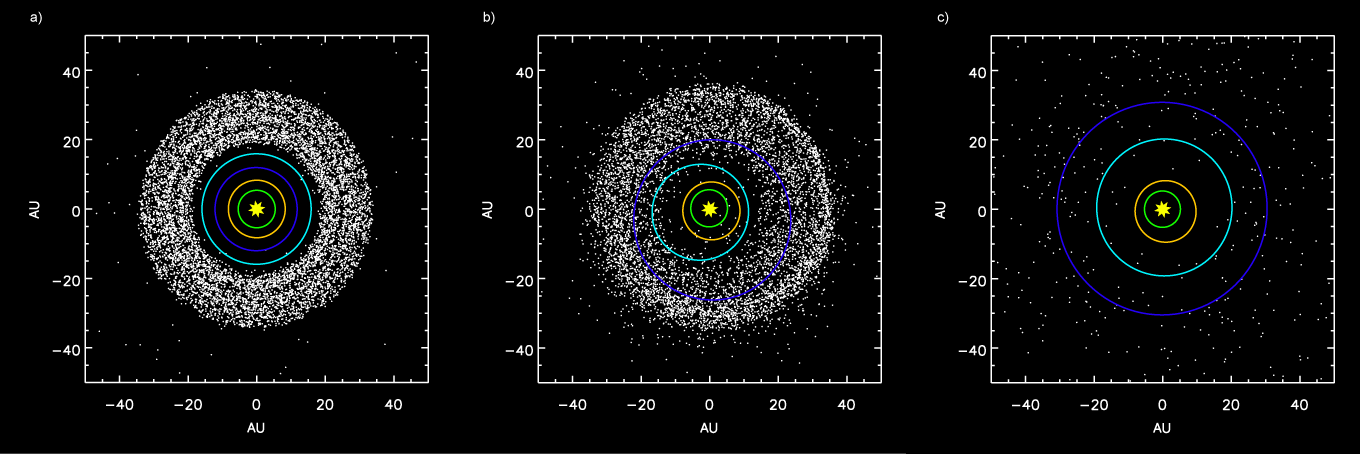
Figure 8.10: Simulation of before, during, and after the late heavy bombardment. Kesäperuna. 2019. CC BY-SA 3.0. https://commons.wikimedia.org/wiki/File:Lhborbits.png
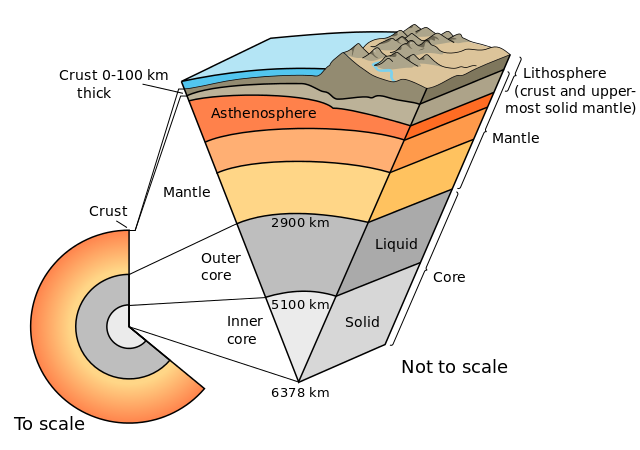
Figure 8.11: The layers of the Earth. Drlauraguertin. 2015. CC BY-SA 3.0. https://wiki.seg.org/wiki/File:Earthlayers.png
Figure 8.12: Subduction of an oceanic plate beneath another oceanic plate, forming a trench and an island arc. USGS. 1999. Public domain. https://commons.wikimedia.org/wiki/File:Oceanic-continental_convergence_Fig21oceancont.gif
Figure 8.13: Geologic provinces with the Shield (orange) and Platform (pink) comprising the Craton, the stable interior of continents. USGS. 2005. Public domain. https://commons.wikimedia.org/wiki/File:World_geologic_provinces.jpg
Figure 8.14: The continent of Zealandia. NOAA. 2006. Public domain. https://commons.wikimedia.org/wiki/File:Zealandia_topography.jpg
Figure 8.15: Fossils of microbial mats from Sweden. Smith609. 2008. CC BY-SA 3.0. https://commons.wikimedia.org/wiki/File:Runzelmarken.jpg
Figure 8.16: Greenhouse gases were more common in Earth’s early atmosphere. Kindred Grey. 2022. CC BY 4.0. Water molecule 3D by Dbc334, 2006 (Public domain, https://commons.wikimedia.org/wiki/File:Water_molecule_3D.svg). Nitrous-oxide-dimensions-3D-balls by Ben Mills, 2007 (Public domain, https://commons.wikimedia.org/wiki/File:Nitrous-oxide-dimensions-3D-balls.png). Methane-CRC-MW-3D-balls by Ben Mills, 2009 (Public domain, https://en.m.wikipedia.org/wiki/File:Methane-CRC-MW-3D-balls.png). Carbon dioxide 3D ball by Jynto, 2011 (Public domain, https://commons.wikimedia.org/wiki/File:Carbon_dioxide_3D_ball.png).
Figure 8.17: Diagram showing the main products and reactants in photosynthesis. At09kg. 2011. CC BY-SA 3.0. https://commons.wikimedia.org/wiki/File:Photosynthesis.gif
Figure 8.18: Alternating bands of iron-rich and silica-rich mud, formed as oxygen combined with dissolved iron. Wilson44691. 2008. Public domain. https://commons.wikimedia.org/wiki/File:MichiganBIF.jpg
Figure 8.19: One possible reconstruction of Rodinia 1.1 billion years ago. John Goodge. 2011. Public domain. https://commons.wikimedia.org/wiki/File:Rodinia_reconstruction.jpg
Figure 8.20: Modern cyanobacteria (as stromatolites) in Shark Bay, Australia. Paul Harrison. 2005. CC BY-SA 3.0. https://en.wikipedia.org/wiki/File:Stromatolites_in_Sharkbay.jpg
Figure 8.21: Fossil stromatolites in Saratoga Springs, New York. Rygel, M.C. 2005. CC BY-SA 3.0. https://commons.wikimedia.org/wiki/File:Stromatolites_hoyt_mcr1.JPG
Figure 8.22: Dickinsonia, a typical Ediacaran fossil. Verisimilus. 2007. CC BY-SA 3.0. https://commons.wikimedia.org/wiki/File:DickinsoniaCostata.jpg
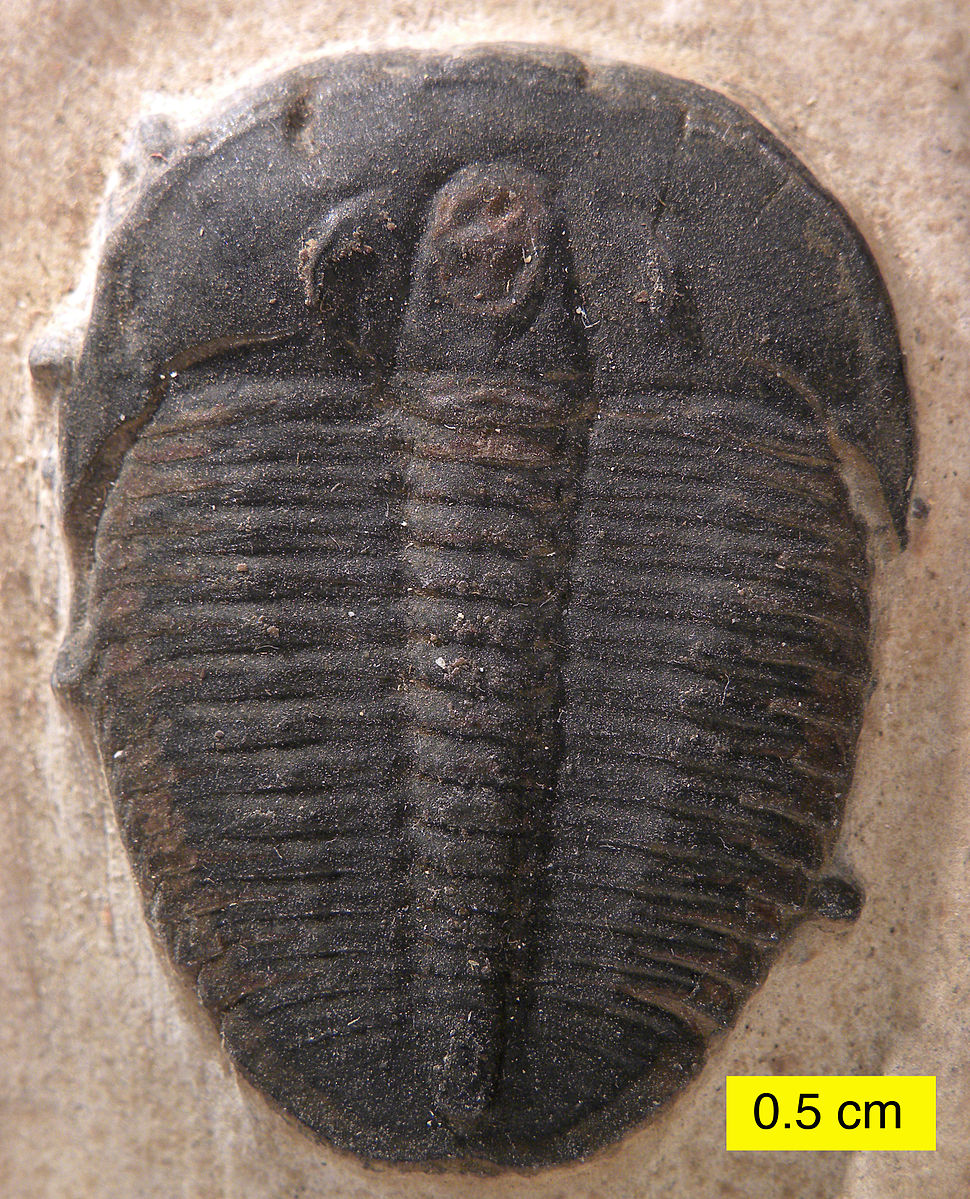
Figure 8.23: The trilobites had a hard exoskeleton, and is an early arthropod, the same group that includes modern insects, crustaceans, and arachnids. Wilson44691. 2010. Public domain. https://commons.wikimedia.org/wiki/File:ElrathiakingiUtahWheelerCambrian.jpg
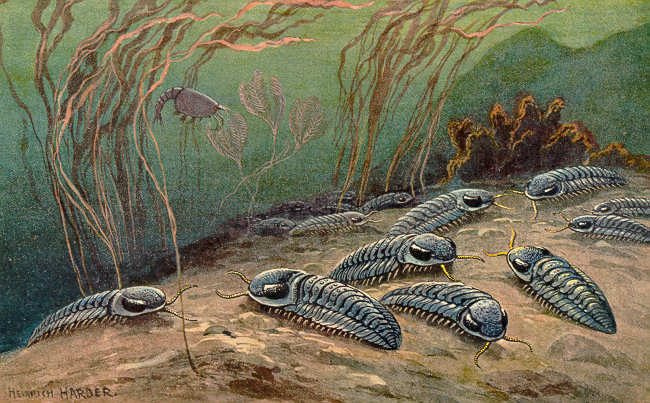
Figure 8.24: Trilobites, by Heinrich Harder, 1916. Heinrich Harder. 1916. Public domain. https://commons.wikimedia.org/wiki/File:Trilobite_Heinrich_Harder.jpg
Figure 8.25: Laurentia, which makes up the North American craton. USGS. 2005. Public domain. https://commons.wikimedia.org/wiki/File:North_america_craton_nps.gif
Figure 8.26: A reconstruction of Pangaea, showing approximate positions of modern continents. Kieff. 2009. CC BY-SA 3.0. https://commons.wikimedia.org/wiki/File:Pangaea_continents.svg
Figure 8.27: Anomalocaris reconstruction by the MUSE science museum in Italy. Matteo De Stefano/MUSE. 2016. CC BY-SA 3.0. https://commons.wikimedia.org/wiki/File:Anomalocaris_canadensis_-_reconstruction_-_MUSE.jpg
Figure 8.28: Original plate from Walcott’s 1912 description of Opabinia, with labels: fp = frontal appendage, e = eye, ths = thoracic somites, i = intestine, ab = abdominal segment. Charles Doolittle Walcott. 1912. Public domain. https://commons.wikimedia.org/wiki/File:Opabinia_regalis_-_Walcott_Cambrian_Geology_and_Paleontology_II_plate_28_.jpg
Figure 8.29: A modern coral reef. Toby Hudson. 2010. CC BY-SA 3.0. https://commons.wikimedia.org/wiki/File:Coral_Outcrop_Flynn_Reef.jpg
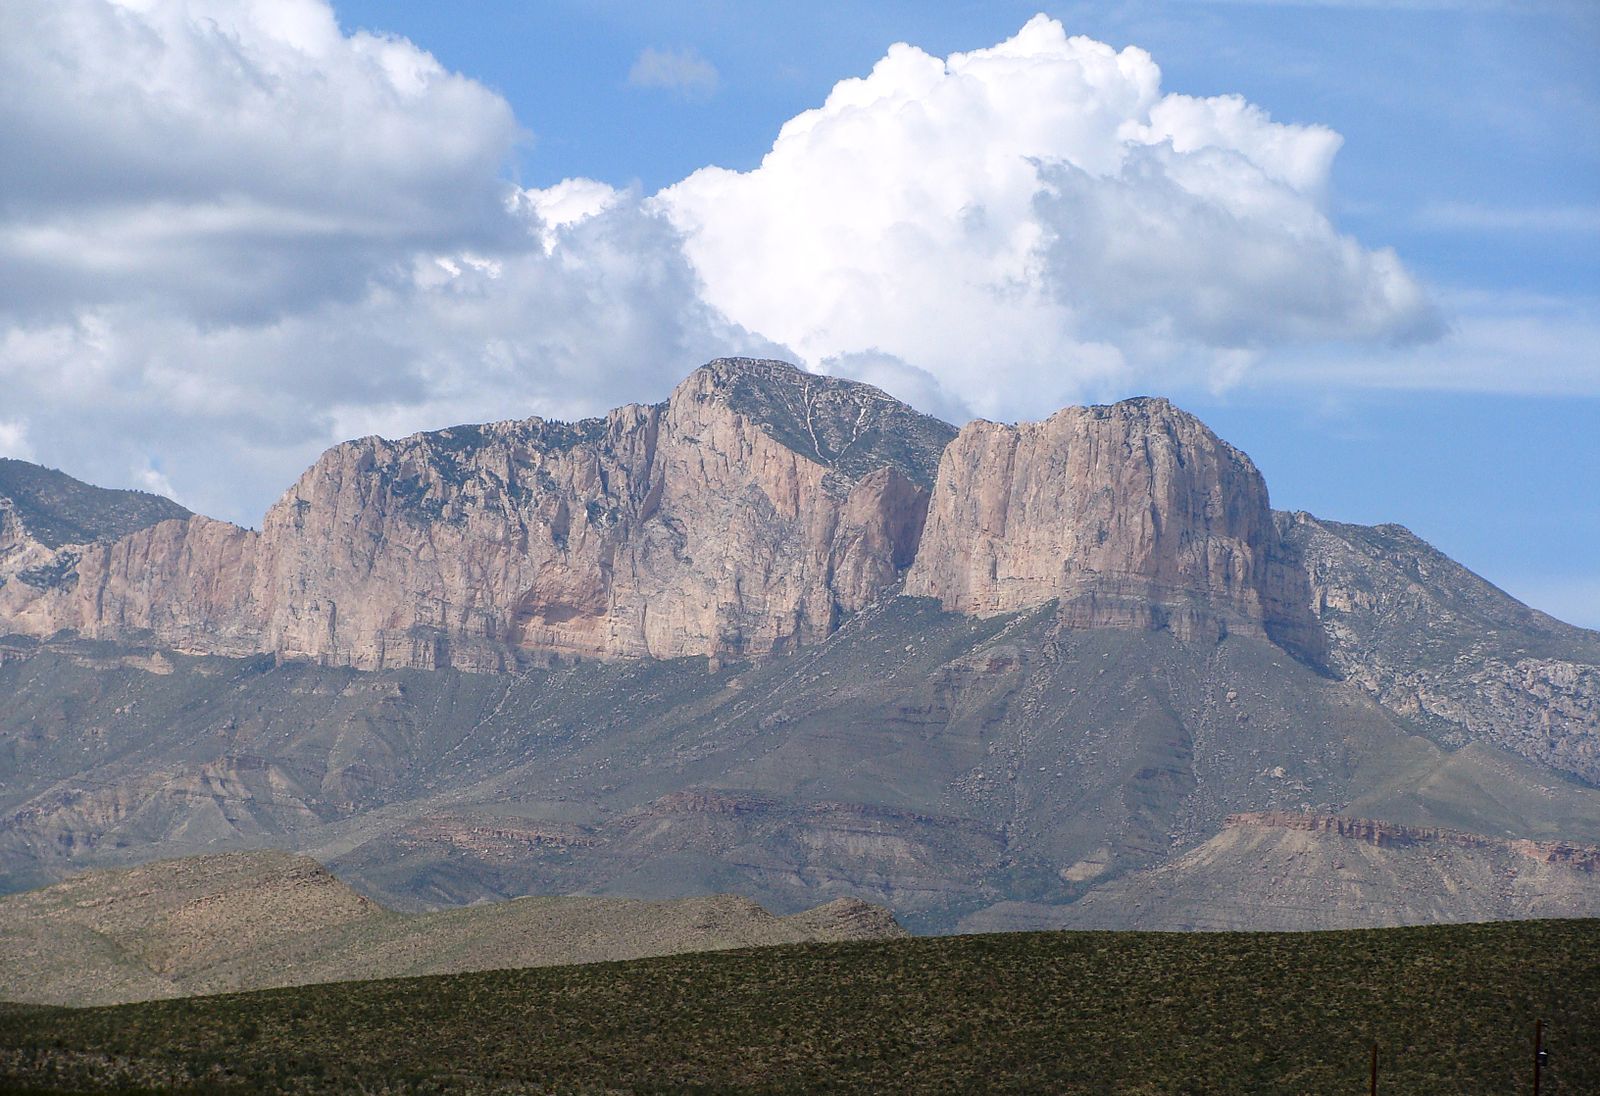
Figure 8.30: Guadalupe National Park is made of a giant fossil reef. Zereshk. 2007. CC BY-SA 3.0. https://commons.wikimedia.org/wiki/File:Guadalupe_Nima2.JPG
Figure 8.31: The placoderm Bothriolepis panderi from the Devonian of Russia. Haplochromis. 2007. CC BY-SA 3.0. https://commons.wikimedia.org/wiki/File:Bothriolepis_panderi.jpg
Figure 8.32: Several different types of fish and amphibians that led to walking on land. Dave Souza; adapted by Pixelsquid. 2020. CC BY-SA 3.0. https://commons.wikimedia.org/wiki/File:Fishapods.svg
Figure 8.33: A reconstruction of the giant arthropod (insects and their relatives) Arthropleura. Tim Bertelink. 2016. CC BY-SA 4.0. https://commons.wikimedia.org/wiki/File:Arthropleura.png
Figure 8.34: Reconstruction of Dimetrodon. Max Bellomio. 2019. CC BY-SA 4.0. https://commons.wikimedia.org/wiki/File:Dimetrodon_grandis_3D_Model_Reconstruction.png
Figure 8.35: World map of flood basalts. Williamborg. 2011. CC BY-SA 3.0. https://commons.wikimedia.org/wiki/File:Flood_Basalt_Map.jpg
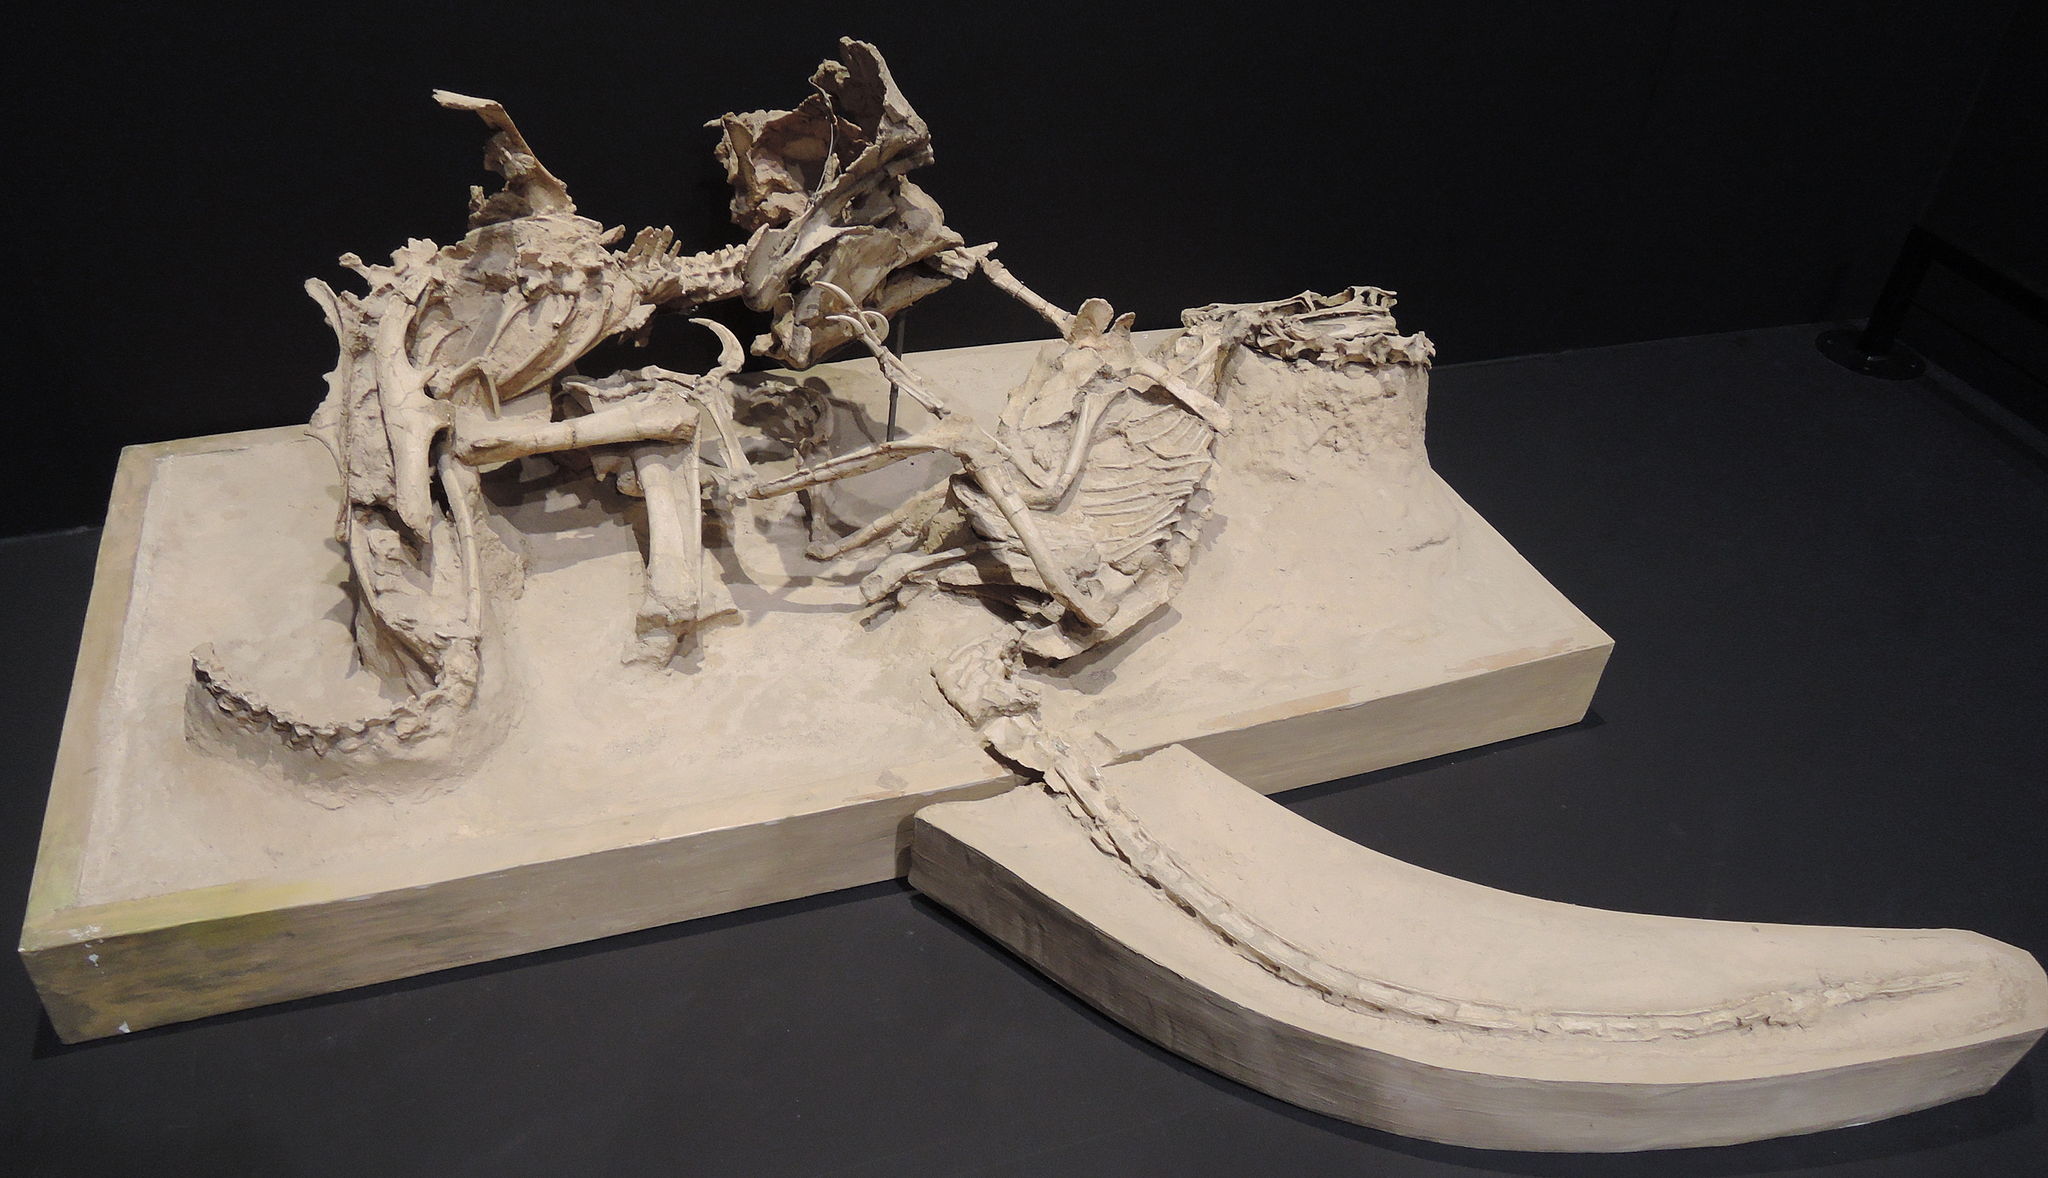
Figure 8.36: Perhaps the greatest fossil ever found, a velociraptor attacked a protoceratops, and both were fossilized mid sequence. Yuya Tamai. 2014. CC BY 2.0. https://commons.wikimedia.org/wiki/File:Fighting_dinosaurs_(1).jpg
Figure 8.37: Animation showing Pangea breaking up. USGS. 2005. Public domain. https://commons.wikimedia.org/wiki/File:Pangea_animation_03.gif
Figure 8.38: Age of oceanic lithosphere, in millions of years. Muller, R.D., M. Sdrolias, C. Gaina, and W.R. Roest (2008) Age, spreading rates and spreading symmetry of the world’s ocean crust, Geochem. Geophys. Geosyst., 9, Q04006, doi:10.1029/2007GC001743. CC BY-SA 3.0. https://commons.wikimedia.org/wiki/File:Age_of_oceanic_lithosphere.jpg
Figure 8.39: Sketch of the major features of the Sevier Orogeny. Pinkcorundum. 2011. Public domain. https://www.wikiwand.com/en/Sevier_orogeny#Media/File:Sevierorogeny.jpg
Figure 8.40: The Cretaceous Interior Seaway in the mid-Cretaceous. By William A. Cobban and Kevin C. McKinney, USGS. 2004. Public domain. https://commons.wikimedia.org/wiki/File:Cretaceous_seaway.png
Figure 8.41: A Mesozoic scene from the late Jurassic. Gerhard Boeggemann. 2006. CC BY-SA 2.5. https://commons.wikimedia.org/wiki/File:Europasaurus_holgeri_Scene_2.jpg
Figure 8.42: A drawing of the early plesiosaur Agustasaurus from the Triassic of Nevada. Nobu Tamura. 2008. CC BY 3.0. https://commons.wikimedia.org/wiki/File:Augustasaurus_BW.jpg
Figure 8.43: Reconstruction of the small (<5″) Megazostrodon, one of the first animals considered to be a true mammal. Theklan. 2017. CC BY-SA 4.0. https://commons.wikimedia.org/wiki/File:Megazostrodon_sp._Natural_History_Museum_-_London.jpg
Figure 8.44: Closed structure of a ornithischian hip, which is similar to a birds. Fred the Oyster. 2014. CC BY-SA 4.0. https://commons.wikimedia.org/wiki/File:Ornithischia_pelvis_structure.svg
Figure 8.45: Open structure of a saurischian hip, which is similar to a lizards. Fred the Oyster. 2014. CC BY-SA 4.0. https://commons.wikimedia.org/wiki/File:Saurischia_pelvis_structure.svg
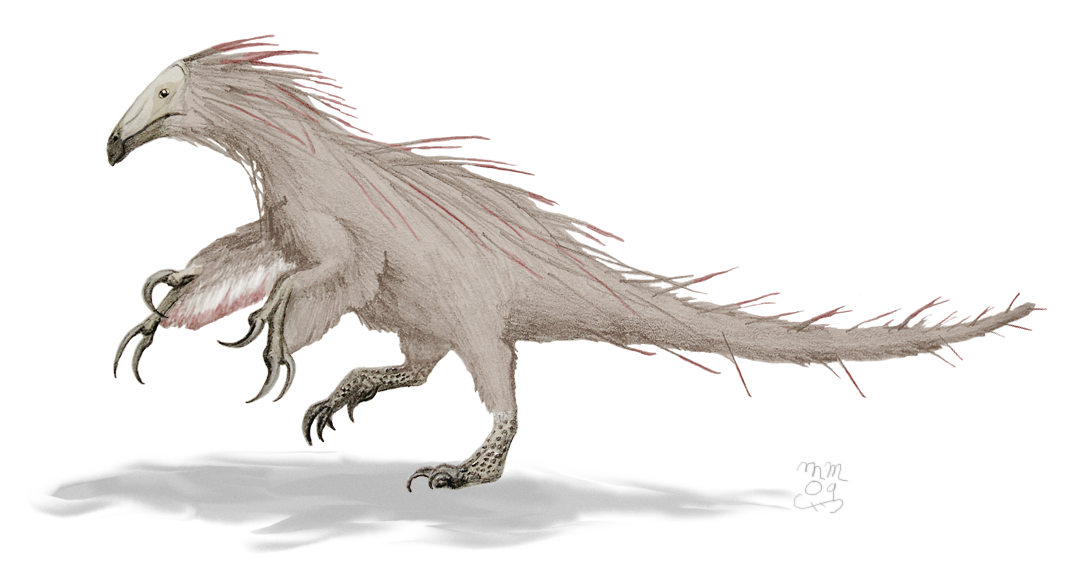
Figure 8.46: Therizinosaurs, like Beipiaosaurus (shown in this restoration), are known for their enormous hand claws. Matt Martyniuk. 2009. CC BY-SA 3.0. https://commons.wikimedia.org/wiki/File:Beipiao1mmartyniuk.png
Figure 8.47: Archaeopteryx lithographica, specimen displayed at the Museum für Naturkunde in Berlin. H. Raab. 2009. CC BY-SA 3.0. https://commons.wikimedia.org/wiki/File:Archaeopteryx_lithographica_(Berlin_specimen).jpg
Figure 8.48: Reconstructed skeleton of Argentinosaurus, from Naturmuseum Senckenberg in Germany. Eva K. 2010. CC BY-NC-ND 3.0. https://commons.wikimedia.org/wiki/File:Argentinosaurus_DSC_2943.jpg
Figure 8.49: Graph of the rate of extinctions. Smith609. 2008. CC BY-SA 3.0. https://commons.wikimedia.org/wiki/File:Extinction_intensity.svg
Figure 8.50: Artist’s depiction of an impact event. Made by Fredrik. Cloud texture from public domain NASA image. 2004. Public domain. https://commons.wikimedia.org/wiki/File:Impact_event.jpg
Figure 8.51: The land expression of the Chicxulub crater. NASA/JPL-Caltech. 2000. Public domain. https://commons.wikimedia.org/wiki/File:Yucatan_chix_crater.jpg
Figure 8.52: Geology of India, showing purple as Deccan Traps-related rocks. CamArchGrad. 2007. Public domain. https://en.wikipedia.org/wiki/File:India_Geology_Zones.jpg
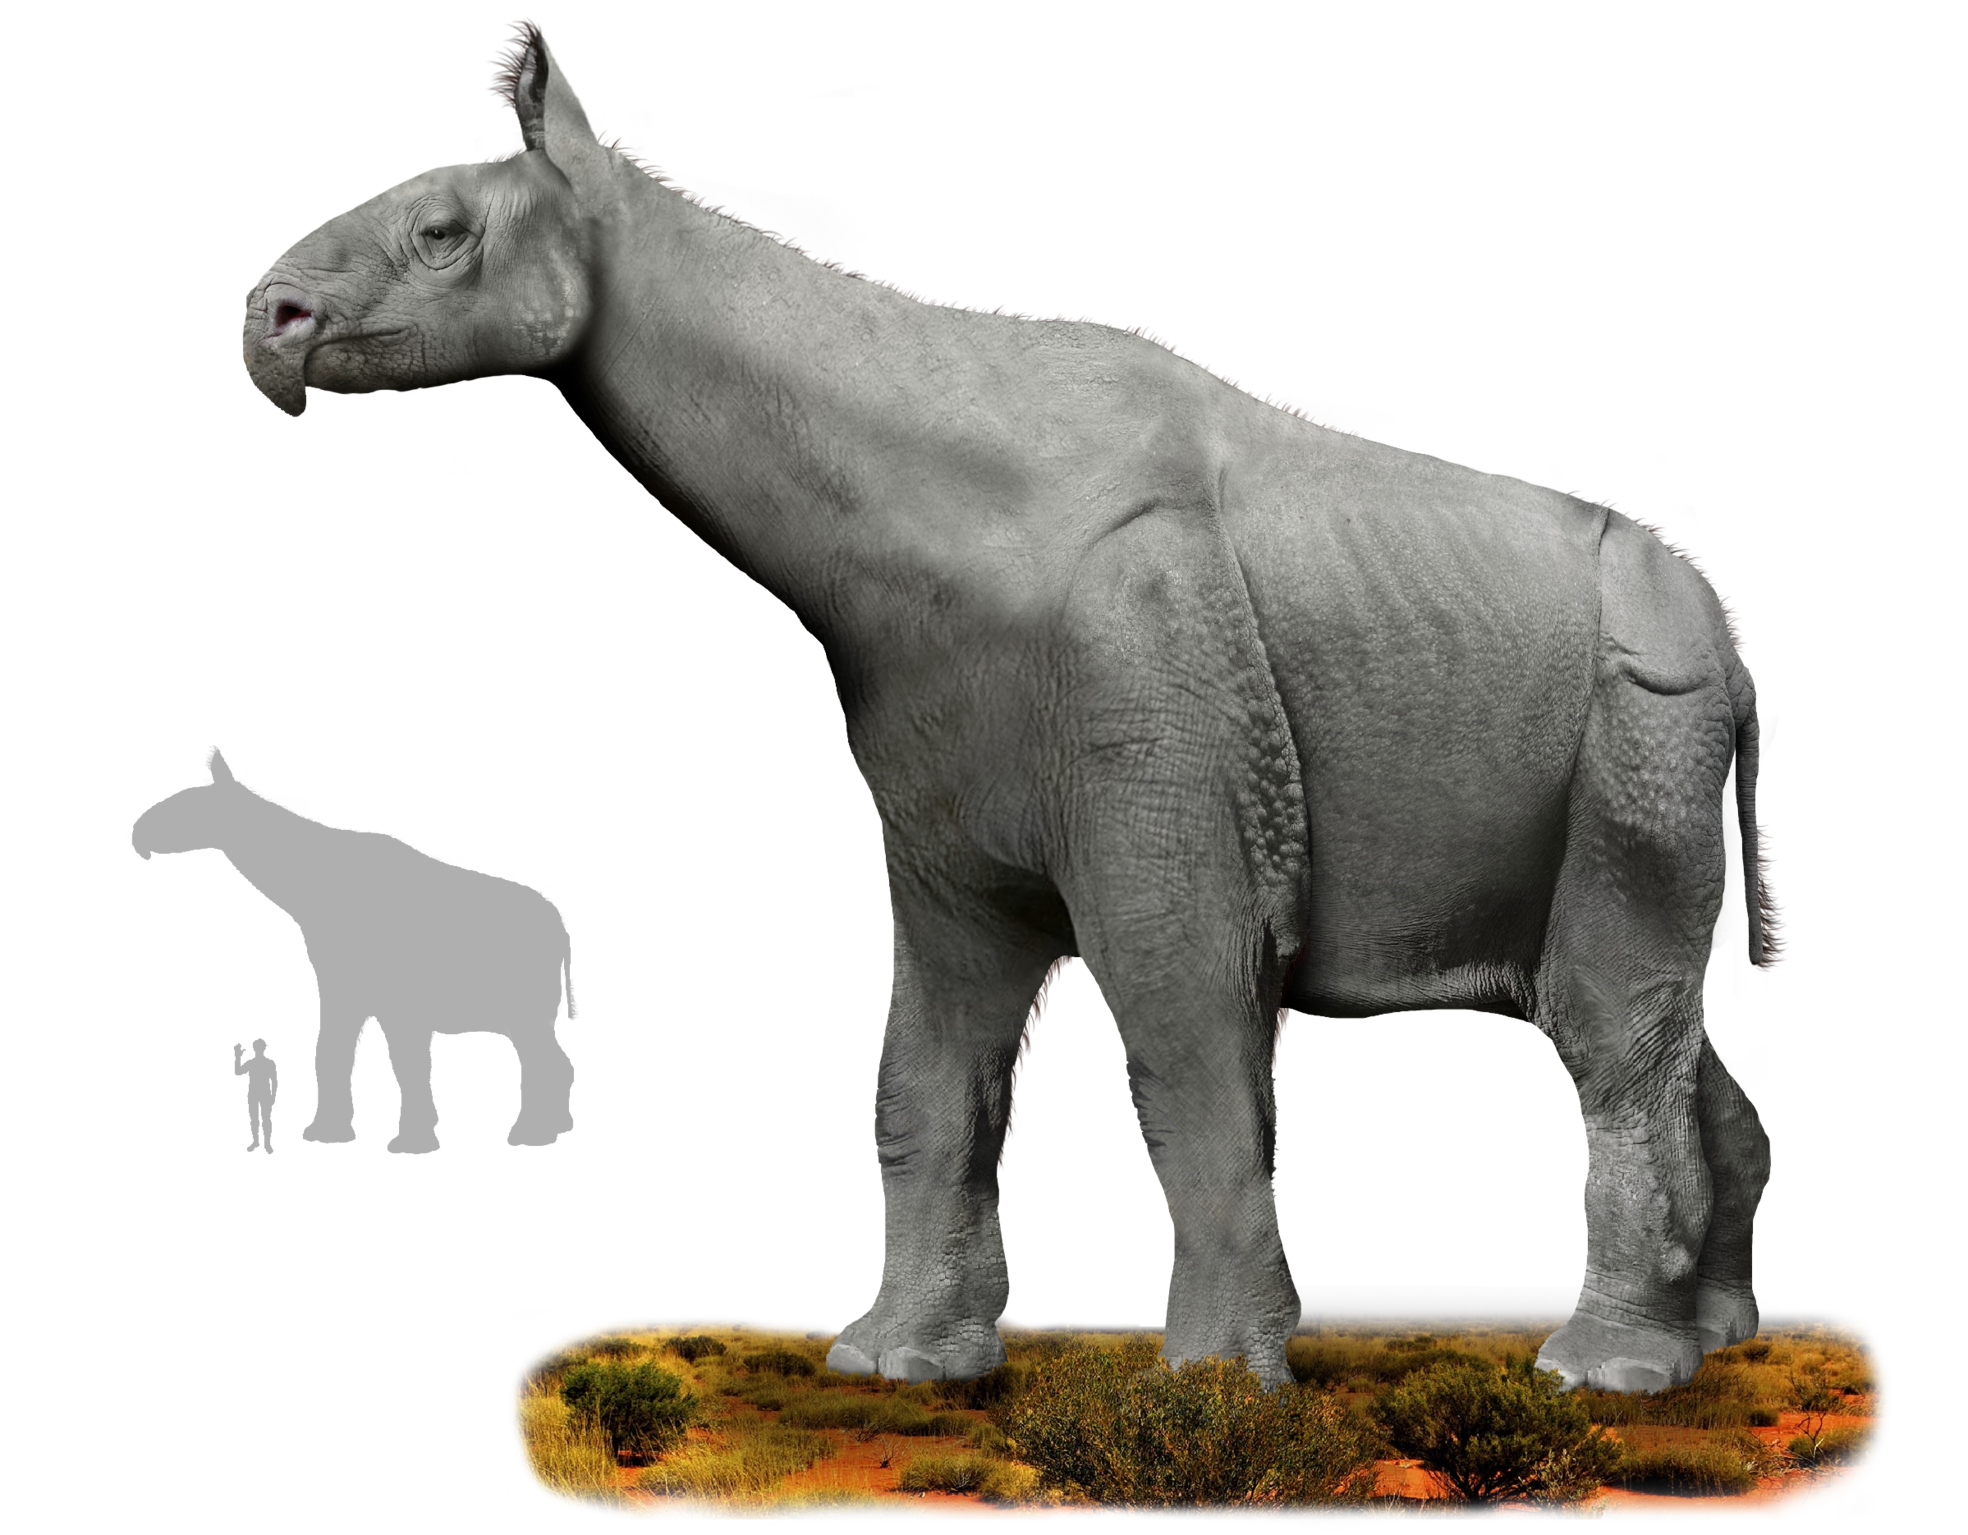
Figure 8.53: Paraceratherium, seen in this reconstruction, was a massive (15-20 ton, 15 foot tall) ancestor of rhinos. Tim Bertelink. 2016. CC BY-SA 4.0. https://commons.wikimedia.org/wiki/File:Indricotherium.png
Figure 8.54: Shallow subduction during the Laramide Orogeny. Melanie Moreno, USGS. 2006. Public domain. https://commons.wikimedia.org/wiki/File:Shallow_subduction_Laramide_orogeny.png
Figure 8.55: Map of the San Andreas fault, showing relative motion. Kate Barton, David Howell, and Joe Vigil via USGS. 2006. Public domain. https://commons.wikimedia.org/wiki/File:Sanandreas.jpg
Figure 8.56: Family tree of Hominids (Hominidae). Fred the Oyster. 2014. CC BY-SA 4.0. https://commons.wikimedia.org/wiki/File:Hominidae_chart.svg
Figure 8.57: Lucy skeleton, showing real fossil (brown) and reconstructed skeleton (white). Andrew. 2007. CC BY-SA 2.0. https://commons.wikimedia.org/wiki/File:Lucy_Skeleton.jpg
Figure 8.58: The hypothesized movement of the homo genus. NordNordWest. 2014. Public domain. https://commons.wikimedia.org/wiki/File:Spreading_homo_sapiens_la.svg
Figure 8.59: Graph showing abundance of large mammals and the introduction of humans. ElinWhitneySmith. 2006. Public domain. https://commons.wikimedia.org/wiki/File:Extinctions_Africa_Austrailia_NAmerica_Madagascar.gif
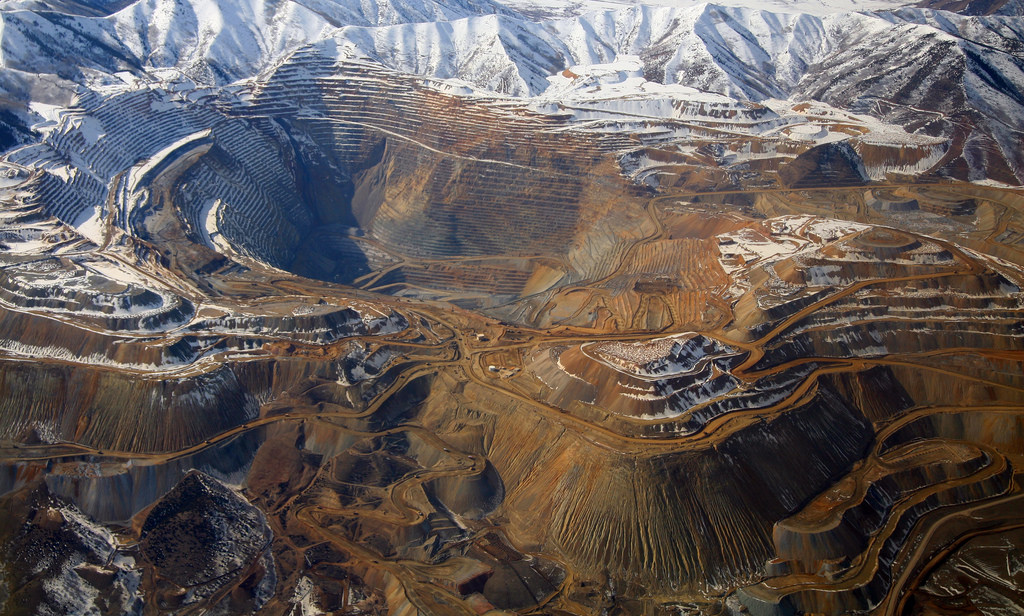
Figure 8.60: Bingham Canyon Mine, Utah. Doc Searls. 2016. CC BY 2.0. https://commons.wikimedia.org/wiki/File:Bingham_Canyon_mine_2016.jpg
Eon that represents the time from Earth's formation to 4 billion years ago. Noted for high levels of volcanism, impacts, and very low preservation.
Eon defined as the time between 4 billion years ago to 2.5 billion years ago. Most of the oldest rocks on Earth, including large portions of the continents, formed at this time.
The largest span of time recognized by geologists, larger than an era. We are currently in the Phanerozoic eon. Rocks of a specific eon are called eonotherms.
The gases that are part of the Earth, which are mainly nitrogen and oxygen.
The theory that the outer layer of the Earth (the lithosphere) is broken in several plates, and these plates move relative to one another, causing the major topographic features of Earth (e.g. mountains, oceans) and most earthquakes and volcanoes.
Meaning "earlier life," the third eon of Earth's history, starting at 2.5 billion years ago and ending at 541 million years ago. Marked by increasing atmospheric oxygen and the supercontinent Rodinia.
Meaning "ancient life," the era that started 541 million years ago and ending 252 million years ago. Vertebrates (including fish, amphibians, and reptiles) and arthropods (including insects) evolved and diversified throughout the Paleozoic. Pangea formed toward the end of the Paleozoic.
When a species no longer exists.
An arrangement of many continental masses collided together into one larger mass. According to the Wilson Cycle, this occurs every half billion years or so.
The most recent supercontinent, which formed over 300 million years ago and started breaking apart less than 200 million years ago. Africa and South America, as well as Europe and North America, bordered each other.
Meaning "middle life," it is the middle era of the Phanerozoic, starting at 252 million years ago and ending 66 million years ago. Known as the Age of Reptiles.
The last (and current) era of the Phanerozoic eon, starting 66 million years ago and spanning through the present.
Initiation point of an earthquake or fault movement.
The second largest span of time recognized by geologists; smaller than an eon, larger than a period. We are currently in the Cenozoic era.
Any evidence of ancient life.
Place where lava is erupted at the surface.
Stresses that push objects together into a smaller surface area or volume; contracting forces.
The process of atoms breaking down randomly and spontaneously.
A natural substance that is typically solid, has a crystalline structure, and is typically formed by inorganic processes. Minerals are the building blocks of most rocks.
The outermost chemical layer of the Earth, defined by its low density and higher concentrations of lighter elements. The crust has two types: continental, which is the thick, more ductile, and lowest density, and oceanic, which is higher density, more brittle, and thinner.
Middle chemical layer of the Earth, made of mainly iron and magnesium silicates. It is generally denser than the crust (except for older oceanic crust) and less dense than the core.
The innermost chemical layer of the Earth, made chiefly of iron and nickel. It has both liquid and solid components.
Liquid rock on the surface of the Earth.
Liquid rock within the Earth.
The thin, outer layer of the Earth which makes up the rocky bottom of the ocean basins. Oceanic crust is much thinner (but denser) than continental crust. Oceanic crust is made of rocks similar to basalt and as it cools, becomes more dense.
Can refer to a volcanic rock with lower silica composition, or the minerals that make up those rocks, namely olivine, pyroxene, amphibole, and biotite. Mafic rocks are darker in color and contain more minerals that are dark in color, but can contain some plagioclase feldspar. Primary mafic rocks are basalt (extrusive) and gabbro (intrusive).
The mineral makeup of a rock, i.e. which minerals are found within a rock.
An extensive, distinct, and mapped set of geologic layers.
The layers of igneous, sedimentary, and metamorphic rocks that form the continents. Continental crust is much thicker than oceanic crust. Continental crust is defined as having higher concentrations of very light elements like K, Na, and Ca, and is the lowest density rocky layer of Earth. Its average composition is similar to granite.
Can refer to a volcanic rock with higher silica composition, or the minerals that make up those rocks, namely quartz, feldspar, and muscovite mica. Felsic rocks are lighter in color and contain more minerals that are light in color. Primary felsic rocks are rhyolite (extrusive) and granite (intrusive).
An igneous rock with extremely low silica composition, being made of almost all olivine and pyroxene. Ultramafic rocks contain very low amount of silica and are common in the mantle. Primary ultramafic rocks are komatiite (extrusive) and peridotite (intrusive).
A proposed explanation for an observation that can be tested.
An atom that has different number of neutrons but the same number of protons. While most properties are based on the number of protons in an element, isotopes can have subtle changes between them, including temperature fractionation and radioactivity.
to move in a circular or curving course or orbit. Not to be confused with rotate, when something spins on an axis
A stoney and/or metallic object from our solar system which was never incorporated into a planet and has fallen onto Earth. Meteorite is used for the rock on Earth, meteoroid for the object in space, and meteor as the object travels in Earth's atmosphere.
A unit of the geologic time scale; smaller than an era, larger than an epoch. We are currently in the Quaternary period.
A hypothesis that states that movement of Jupiter and Saturn about 4 billion years ago caused a destabilization of orbits in the Asteroid and Kuiper Belts, which then caused a spike in impacts throughout of solar system.
An accepted scientific idea that explains a process using the best available information.
An amplification of earthquake waves due to a structure of buildings or structures.
An interconnected set of parts that combine and make up a whole.
Bedrock around the magma chamber being incorporated into the magma, sometimes changing the composition of the magma.
The transport and movement of weathered sediments.
The process of changing a magma's composition, usually through assimilation or fractionation.
Minerals with a luster similar to metal and contain metals, including valuable elements like lead, zinc, copper, tin, etc.
Energy that radiates from fault movement via earthquakes.
A solid part of the lithosphere which moves as a unit, i.e. the entire plate generally moves the same direction at the same speed.
The outermost physical layer of the Earth, made of the entire crust and upper mantle. It is brittle and broken into a series of plates, and these plates move in various ways (relative to one another), causing the features of the theory of plate tectonics.
The concept that any rock type (igneous, sedimentary, and metamorphic) can change into another rock type under the right conditions over geologic time.
The stable interior part of a continent, typically more than a billion years old, and sometimes as old as 2.5-3 billion years. When exposed on the surface, a craton is called a shield.
An exposed part of a craton.
Term for the underlying lithified rocks that make up the geologic record in an area. This term can sometimes refer to only the deeper, crystalline (non-layered) rocks.
Part of a craton that is covered, mainly by sedimentary rocks.
Rocks that are formed from liquid rock, i.e. from volcanic processes.
ZrSiO4. Relatively chemically inert with a hardness of 8.5. Common accessory mineral in igneous and metamorphic rocks, as well as detrital sediments. Uranium can substitute for zirconium, making zircon a valuable mineral in radiometric dating.
Metamorphism which occurs with hot fluids going within rocks, altering and changing the rocks.
Opening of a volcano where lava can erupt.
A fossil that forms as algal mats grow and capture sediment into mounds.
A test of an idea in which new information can be gathered to either accept or reject a hypothesis.
A divergent boundary within an oceanic plate, where new lithosphere and crust is created as the two plates spread apart. Mid-ocean ridge and spreading center are synonyms.
A biologic process of gaining energy from chemicals from within the Earth, similar to using the energy of the sun in photosynthesis.
Relatively flat ocean floor, which accumulates very fine grained detrital and chemical sediments.
A feature with no internal structure, habit, or layering.
A period of the early Proterozoic (around 2.5-2 billion years ago) where atmospheric oxygen levels dramatically increased, killing many non-oxygen-breathing organisms and allowing oxygen-breathing organisms to thrive.
The act of taking a solid and dissolving it into a liquid. This commonly occurs with salts and other minerals in water.
Minerals in which ions are bonded to oxygen, such as hematite (Fe2O3).
A very fine grained version of silica deposited with or without microfossils.
A separation of light (felsic) and dark (mafic) minerals in higher grade metamorphic rocks like gneiss.
The act of a solid coming out of solution, typically resulting from a drop in temperature or a decrease of the dissolving material.
Discernible layers of rock, typically from a sedimentary rock.
The process in which solids (like minerals) are disassociated and the ionic components are dispersed in a liquid (usually water).
A solution that has the maximum allowed dissolved component, and is unable to dissolve more.
A period of cooler temperatures on Earth in which ice sheets can grow on continents.
A geologic circumstance (such as a fold, fault, change in lithology, etc.) which allows petroleum resources to collect.
The ability for the atmosphere to absorb heat that is emitted by a planet's surface.
The supercontinent that existed before Pangea, about 1 billion years ago. North America was positioned in the center of the land mass.
Geologic name for the craton that makes up North America.
Meaning "visible life," the most recent eon in Earth's history, starting at 541 million years ago and extending through the present. Known for the diversification and evolution of life, along with the formation of Pangea.
A type of single-celled organism with no nucleus.
A type of organism in with a cell or cells that contains a nucleus.
A channelled body of water.
SiO2. Transparent, but can be any color imaginable with impurities. No cleavage, hard, and commonly forms equant masses. Perfect crystals are hexagonal prisms topped with pyramidal shapes. One of the most common minerals, and is found in many different geologic settings, including the dominant component of sand on the surface of Earth. Structure is a three-dimensional network of silica tetrahedra, connected as much as possible to each other.
A rock primarily made of sand.
A metamorphosed sandstone.
A group of relatively complex organisms that existed at the end of the Proterozoic.
A term for the collective time before the Phanerozoic (pre-541 million years ago), including the Hadean, Archean, and Proterozoic. Known for a lack of easy-to-find fossils.
Places that are under ocean water at all times.
The fifth (second to last) period in the Paleozoic, 359-299 million years ago. In North America, the Carboniferous is split into two different periods, the Mississippian (359-323 million years ago) and the Pennsylvanian (323-299 million years ago).
Former swamp-derived (plant) material that is part of the rock record.
A chemical or biochemical rock made of mainly calcite.
Spheres of calcite that form in saline waters with slight wave agitation. Ooid refers to the sphere, oolite the rock with the spheres.
Detached, free-falling rocks from very steep slopes.
Missing time in the rock record, either because of a lack of deposition and/or erosion.
A process where an oceanic plate descends bellow a less dense plate, causing the removal of the plate from the surface. Subduction causes the largest earthquakes possible, as the subducting plate can lock as it goes down. Volcanism is also caused as the plate releases volatiles into the mantle, causing melting.
A chain of volcanic activity, typically in a curved pattern, rising from a subduction zone. The arc is on the overriding plate, typically a few hundred kilometers from the trench, but parallel to the trench.
A down-warped feature in the crust.
The entire area which is related to land-sea interactions.
A boundary between continental and oceanic plates that has no relative movement, making it a place where an oceanic plate is connected to a continental plate, but it is not a plate boundary.
Submerged part of the continental mass, with a gentle slope.
Known as the "Age of Fishes," the 4th period of the Paleozoic, about 419-359 million years ago.
The process of uplifting mountains and creating mountain belts, primarily via tectonic movement. Orogenic belts are the mountain belts that result from these movements, and orogenesis is the name for the process of forming mountain belts.
Place where oceanic-oceanic subduction causes volcanoes to form on an overriding oceanic plate, making a chain of active volcanoes.
When two continents crash, with no subduction (and thus little to no volcanism), since each continent is too buoyant. Many of the largest mountain ranges and broadest zones of seismic activity come from collisions.
Place with a chain of mountain volcanism on a continent, from oceanic-continental subduction.
Location where two plates are in contact, allowing a relative motion between the two plates. These are the locations where most earthquakes and volcanoes are found.
The first period of the Paleozoic, 541 million years ago-485 million years ago.
A period of time in the early Cambrian (about 541-516 million years ago) in which a large diversification of life forms was found in the fossil record. Many of the modern phyla of organisms evolved in this time span.
Long term averages and variations within the conditions of the atmosphere.
Deposition and erosion tied to glacier movement.
A very fine-grained rock with very thin layering (fissile).
An exceptionally-well preserved fossil locality, often including soft tissues.
The end of a river.
Organisms that possess vertebrate or some form of a spinal column, including humans.
The second period of the Paleozoic era, 485-444 million years ago.
CaCO3. Pure form is clear, but can take on many different colors with impurities. It is soft, fizzes in acid, and has three cleavages that are not at 90°.
A topographic high found away from the beach in deeper water, but still on the continental shelf. Typically, these are formed in tropical areas by organisms such as corals.
A pronounced increase in the extinction rate, typically caused by significant environmental change. There have been 5 mass extinctions in geologic history, and a sixth that has been suggested to be currently occurring.
The third period of the Paleozoic, 444-420 million years ago.
Depositional environments that are on land.
Empty space in a geologic material, either within sediments, or within rocks. Can be filled by air, water, or hydrocarbons.
The last period of the Paleozoic, 299-252 million years ago.
The largest mass extinction in history, where an estimated 83% of genera went extinct. Linked to the Siberian Trapps as a cause.
Rare very low viscosity eruption that covers vast areas. None have been observed in human history.
The first period of the Mesozoic era, from 252-201 million years ago.
Pieces of rock that have been weathered and possibly eroded.
Area of extended continental lithosphere, forming a depression. Rifts can be narrow (focused in one place) or broad (spread out over a large area with many faults).
A sheet-like igneous intrusion that has intruded parallel to bedding planes within the bedrock.
The middle period of the Mesozoic era, 201-145 million years ago.
Planar feature where two blocks of bedrock move past each other via earthquakes.
A rock layer that has been bent in a ductile way instead of breaking (as with faulting).
The last period of the Mesozoic, 145-66 million years ago.
A waterway that existed in North America around 100 million years ago. Western North America was separated from eastern North America.
The most recent mass extinction, which killed the non-avian dinosaurs and paved the way for the diversification of mammals. Occurred when a bolide hit near Chicxulub, Mexico, 66 million years ago.
A large extraterrestrial object, such as a meteor or asteroid, that hits the surface of the Earth.
A group of all atoms with a specific number of protons, having specific, universal, and unique properties.
A series of waves produced from a sudden movement of the floor of a ocean basin (or large lake), caused by events such as earthquakes, volcanic eruptions, landslides, and bolide impacts.
A liquid fossil fuel derived from shallow marine rocks (also known as crude oil).
A 180 kilometer (110 mile) crater that exists near Chicxulub, Mexico, on the Yucatan Peninsula. Widely accepted to have caused the K-T extinction.
General name of a felsic rock that is intrusive. Has more felsic minerals than mafic minerals.
Place where two plates slide past each other, creating strike slip faults.
Place where two plates come together, casing subduction or collision.
Faulting that is deep into the crust, and typically involves crystalline basement rocks.
Stresses that pull objects apart into a larger surface area or volume; stretching forces.
Term for the extensional tectonic province that extends from California’s Sierra Nevada Mountains in the west, to Utah’s Wasatch Mountains to the east, to southern Oregon and Idaho to the north, to northern Mexico to the south. Known as a wide rift, each graben (basin) is bounded by horsts (ranges).
Name given to the subducting plate, where volatiles are driven out at depth, causing volcanism.
A ductile physical layer of the Earth, below the lithosphere. Movement within the asthenosphere is the main driver of plate motion, as the overriding lithosphere is pushed by this.
The most recent, and current, period within the Cenozoic era, starting 2.58 million years ago.
Thick glaciers that cover continents during ice ages.
A series of changes in the Earth's orbit/position in relation to the Sun which can fluctuate climate over varying periodicities.
The most recent epoch of geologic time, from 11,700 years ago to present.
A unit of geological time recognized by geologists; smaller than a period. We are currently in the Holocene epoch.
A newly-proposed time segment (an epoch) that would be representative of time since humans have changed (and left evidence behind within) the geologic record.
