12 Coastlines
Learning Objectives
By the end of this chapter, students should be able to:
- Describe how waves occur, move, and carry energy.
- Explain wave behavior approaching the shoreline.
- Describe shoreline features and zones.
- Describe wave refraction and its contribution to longshore currents and longshore drift.
- Explain how longshore currents cause the formation of spits and baymouth bars.
- Distinguish between submergent and emergent coasts and describe coastal features associated with each.
- Describe the relationship between the natural river of sand in the littoral zone and human attempts to alter it for human convenience.
- Describe the pattern of the main ocean currents and explain the different factors involved in surface currents and deep ocean currents.
- Explain how ocean tides occur and distinguish among diurnal, semidiurnal, and mixed tide patterns.
The Earth’s surface is 29% land and 71% water. Coastlines are the interfaces between, and as such, the longest visible boundaries on Earth. To understand the processes that occur at these boundaries, it is important to first understand wave energy.
12.1 Waves and Wave Processes
Wind blowing over the surface of water transfers energy to the water through friction. The energy transferred from wind to water causes waves to form. Waves move as individual oscillating particles of water. As the wave crest passes, the water is moving forward. As the wave trough passes, the water is moving backward. To see wave movement in action, watch a cork or some floating object as a wave passes.
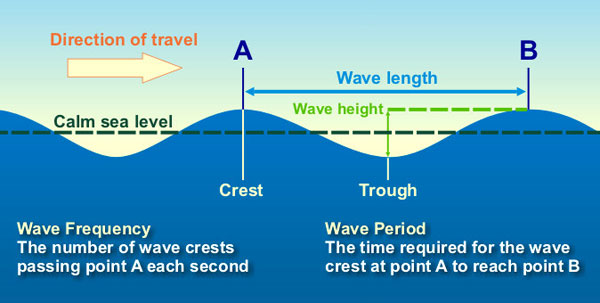
Important terms to understand in the operation of waves include: the wave crest is the highest point of the wave; the trough is the lowest point of the wave. Wave height is the vertical distance from the trough to the crest and is determined by wave energy. Wave amplitude is half the wave height, or the distance from either the crest or trough to the still water line. Wavelength is the horizontal distance between consecutive wave crests. Wave velocity is the speed at which a wave crest moves forward and is related to the wave’s energy. Wave period is the time interval it takes for adjacent wave crests to pass a given point.
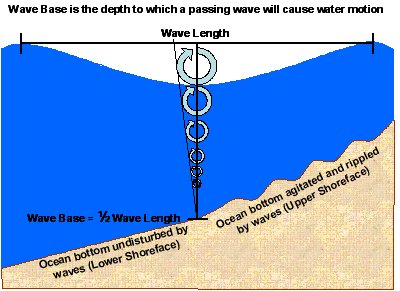
The circular motion of water particles diminishes with depth and is negligible at about one-half wavelength, an important dimension to remember in connection with waves. Wave base is the vertical depth at which water ceases to be disturbed by waves. In water shallower than wave base, waves will disturb the bottom and ripple shore sand. Wave base is measured at a depth of about one-half wavelength, where the water particles’ circular motion diminishes to zero. If waves approaching a beach have crests at about 6 m (~20 ft) intervals, this wave motion disturbs water to about 3 m (~10 ft) deep. This motion is known as fair-weather wave base. In strong storms such as hurricanes, both wavelength and wave base increase dramatically to a depth known as storm wave base, which is approximately 91 m (~300 ft).
Waves are generated by wind blowing across the ocean surface. The amount of energy imparted to the water depends on wind velocity and the distance across which the wind is blowing. This distance is called fetch. Waves striking a shore are typically generated by storms hundreds of miles from the coast and have been traveling across the ocean for days.
Winds blowing in a relatively constant direction generate waves moving in that direction. Such a group of approximately parallel waves traveling together is called a wave train. A wave train coming from one fetch can produce various wavelengths. Longer wavelengths travel at a faster velocity than shorter wavelengths, so they arrive first at a distant shore. Thus, there is a wavelength–sorting process that takes place during the wave train’s travel. This sorting process is called wave dispersion.
12.1.1 Behavior of Waves Approaching Shore

On the open sea, waves generally appear choppy because wave trains from many directions are interacting with each other, a process called wave interference. Constructive interference occurs where crests align with other crests. The aligned wave height is the sum of the individual wave heights, a process referred to as wave amplification. Constructive interference also produces hollows where troughs align with other troughs. Destructive interference occurs where crests align with troughs and cancel each other out. As waves approach shore and begin to make frictional contact with the sea floor at a depth of about one-half wavelength or less, they begin to slow down. However, the energy carried by the wave remains the same, so the waves build up higher. Remember that water moves in a circular motion as a wave passes, and each circle is fed from the trough in front of the advancing wave. As the wave encounters shallower water at the shore, there is eventually insufficient water in the trough in front of the wave to supply a complete circle, so the crest pours over creating a breaker.
A special type of wave is called a tsunami, sometimes incorrectly called a “tidal wave.” Tsunamis are generated by energetic events affecting the sea floor, such as earthquakes, submarine landslides, and volcanic eruptions (see chapter 9 and chapter 4). During earthquakes for example, tsunamis can be produced when the moving crustal rocks below the sea abruptly elevate a portion of the seafloor. Water is suddenly lifted creating a bulge at the surface and a wave train spreads out in all directions traveling at tremendous speeds [over 322 kph (200 mph)] and carrying enormous energy. Tsunamis may pass unnoticed in the open ocean because they move so fast, the wavelength is very long, and the wave height is very low. But, as the wave train approaches shore and each wave begins to interact with the shallow seafloor, friction increases and the wave slows down. Still carrying its enormous energy, wave height builds up and the wave strikes the shore as a wall of water that can be over 30 m (~100 ft) high. The massive wave, called a tsunami runup, may sweep inland well beyond the beach destroying structures far inland. Tsunamis can deliver a catastrophic blow to people at the beach. As the trough water in front of the tsunami wave is drawn back, the seafloor is exposed. Curious and unsuspecting people on the beach may run out to see exposed offshore sea life only to be overwhelmed when the breaking crest hits.

Take this quiz to check your comprehension of this section.
If you are using an offline version of this text, access the quiz for section 12.1 via the QR code.
12.2 Shoreline Features
Coastlines are dynamic, high energy, and geologically complicated places where many different erosional and depositional features exist (see chapter 5). They include all parts of the land-sea boundary directly affected by the sea, including land far above high tide and seafloor well below normal wave base. But, the shoreline itself is the direct interface between water and land that shifts with the tides. This shifting interface at the shoreline is called the littoral zone. The combination of waves, currents, climate, coastal morphology, and gravity, all act on this land-sea boundary to create shoreline features.
12.2.1 Shoreline Zones
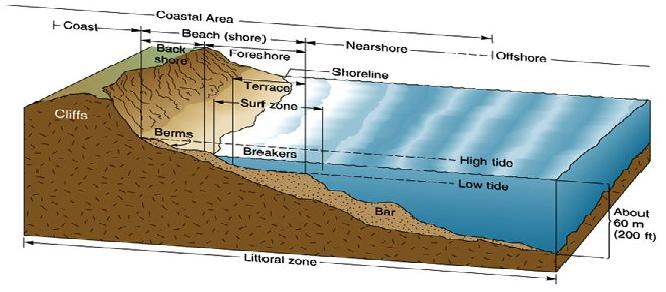
Shorelines are divided into five primary zones—offshore, nearshore, surf, foreshore, and backshore. The offshore zone is below water, but it is still geologically active due to flows of turbidity currents that cascade over the continental slope and accumulate in the continental rise. The nearshore zone is the area of the shore affected by the waves where water depth is one-half wavelength or less. The width of this zone depends on the maximum wavelength of the approaching wave train and the slope of the seafloor. The nearshore zone includes the shoreface, which is where sand is disturbed and deposited. The shoreface is broken into two segments: upper and lower shoreface. Upper shoreface is affected by everyday wave action and consists of finely-laminated and cross-bedded sand. The lower shoreface is the only area moved by storm waves and consists of hummocky cross-stratified sand. The surf zone is where the waves break.
The foreshore zone overlaps the surf zone and is periodically wet and dry due to waves and tides. The foreshore zone is where planer-laminated, well-sorted sand accumulates. The beach face is the part of the foreshore zone where the breaking waves swash up and the backwash flows back down. Low ridges above the beach face in the foreshore zone are called berms. During the summer in North America, when most people visit the beach, the zone where people spread their towels and beach umbrellas is the summer berm. Wave energy is typically lower in the summer, which allows sand to pile onto the beach. Behind the summer berm is a low ridge of sand called the winter berm. In winter, higher storm energy moves the summer berm sand off the beach and piles it in the nearshore zone. The next year, that sand is replaced on the beach and moved back onto the summer berm. The backshore zone is the area always above sea level in normal conditions. In the backshore zone, onshore winds may blow sand behind the beach and the berms, creating dunes.
12.2.2 Refraction, Longshore Currents, and Longshore Drift
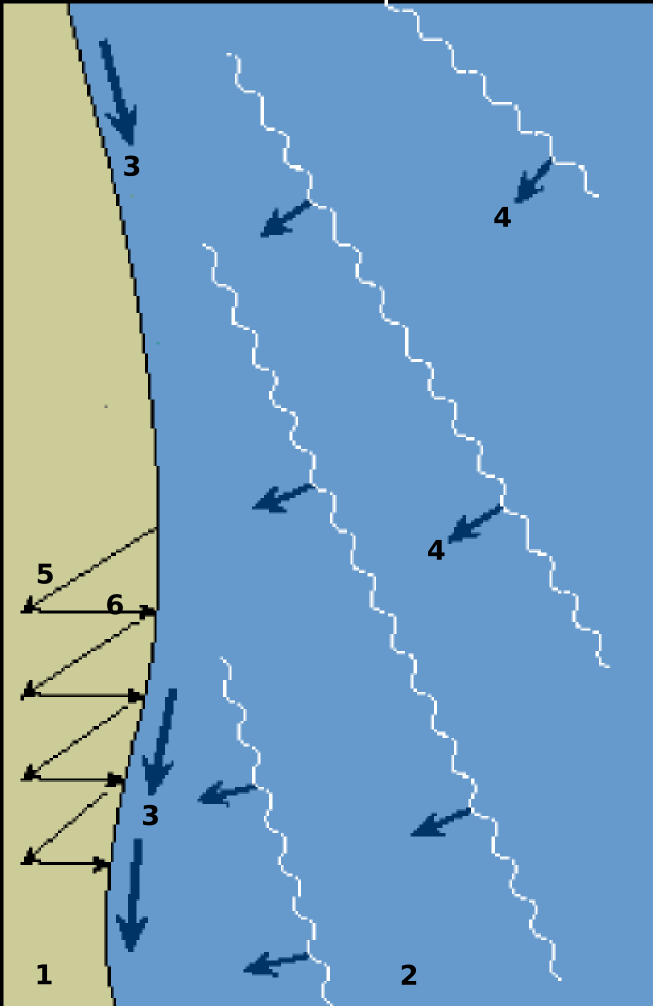
As waves enter shallower water less than one-half wavelength depth, they slow down. Waves usually approach the shoreline at an angle, with the end of the waves nearest the beach slowing down first. This causes the wave crests to bend, called wave refraction. From the beach face, this causes it to look like waves are approaching the beach straight on, parallel to the beach. However, as refracted waves actually approach the shoreline at a slight angle, they create a slight difference between the swash as it moves up the beach face at a slight angle and the backwash as it flows straight back down under gravity. This slight angle between swash and backwash along the beach creates a current called the longshore current. Waves stir up sand in the surf zone and move it along the shore. This movement of sand is called longshore drift. Longshore drift along both the west and east coasts of North America moves sand north to south on average.
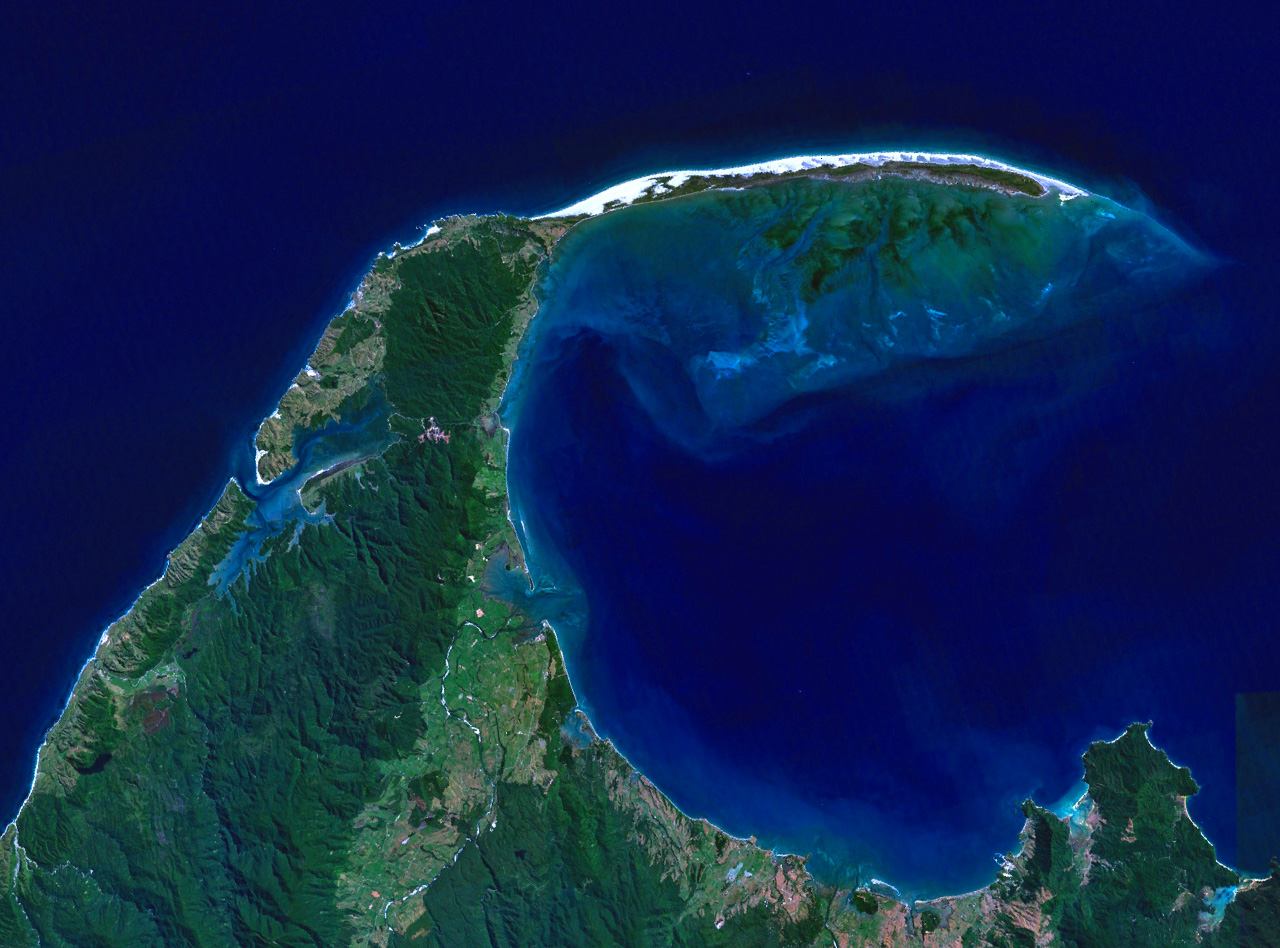
Longshore currents can carry longshore drift down a coast until it reaches a bay or inlet where it will deposit sand in the quieter water (see chapter 11). Here, a spit can form. As the spit grows, it may extend across the mouth of the bay forming a barrier called a baymouth bar. Where the bay or inlet serves as boat anchorage, spits and baymouth bars are a severe inconvenience. Often, inconvenienced communities create methods to keep their bays and harbors open.
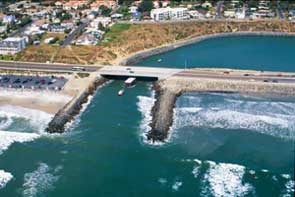
One way to keep a harbor open is to build a jetty, a long concrete or stone barrier constructed to deflect the sand away from a harbor mouth or other ocean waterway. If the jetty does not deflect the sand far enough out, sand may continue to flow along the shore, forming a spit around the end of the jetty. A more expensive but effective method to keep a bay mouth open is to dredge the sand from the growing spit, put it on barges, and deliver it back to the drift downstream of the harbor mouth. An even more expensive but more effective option is to install large pumps and pipes to draw in the sand upstream of the harbor, pump it through pipes, and discharge it back into the drift downstream of the harbor mouth. Because natural processes work continuously, human efforts to mitigate inconvenient spits and baymouth bars require ongoing modifications. For example, the community of Santa Barbara, California, tried several methods to keep their harbor open before settling on pumps and piping.
Rip currents are another coastal phenomenon related to longshore currents. Rip currents occur in the nearshore seafloor when wave trains come straight onto the shoreline. In areas where wave trains push water directly toward the beach face or where the shape of the nearshore seafloor refracts waves toward a specific point on the beach, the water piles up on shore. But this water must find an outlet back to the sea. The outlet is relatively narrow, and rip currents carry the water directly away from the beach. Swimmers caught in rip currents are carried out to sea. Swimming back to shore directly against the strong current is fruitless. A solution for good swimmers is to ride out the current to where it dissipates, swim around it, and return to the beach. Another solution for average swimmers is to swim parallel to the beach until out of the current, then return to the beach. Where rip currents are known to exist, warning signs are often posted. The best solution is to understand the nature of rip currents, have a plan before entering the water, or watch the signs and avoid them all together.
Like rip currents, undertow is a current that moves away from the shore. However, unlike rip currents, undertow occurs underneath the approaching waves and is strongest in the surf zone where waves are high and water is shallow. Undertow is another return flow for water transported onshore by waves.
12.2.3 Emergent and Submergent Coasts
Emergent coasts occur where sea levels fall relative to land level. Submergent coasts occur where sea levels rise relative to land level. Tectonic shifts and sea level changes cause the long-term rise and fall of sea level relative to land. Some features associated with emergent coasts include high cliffs, headlands, exposed bedrock, steep slopes, rocky shores, arches, stacks, tombolos, wave-cut platforms, and wave notches.
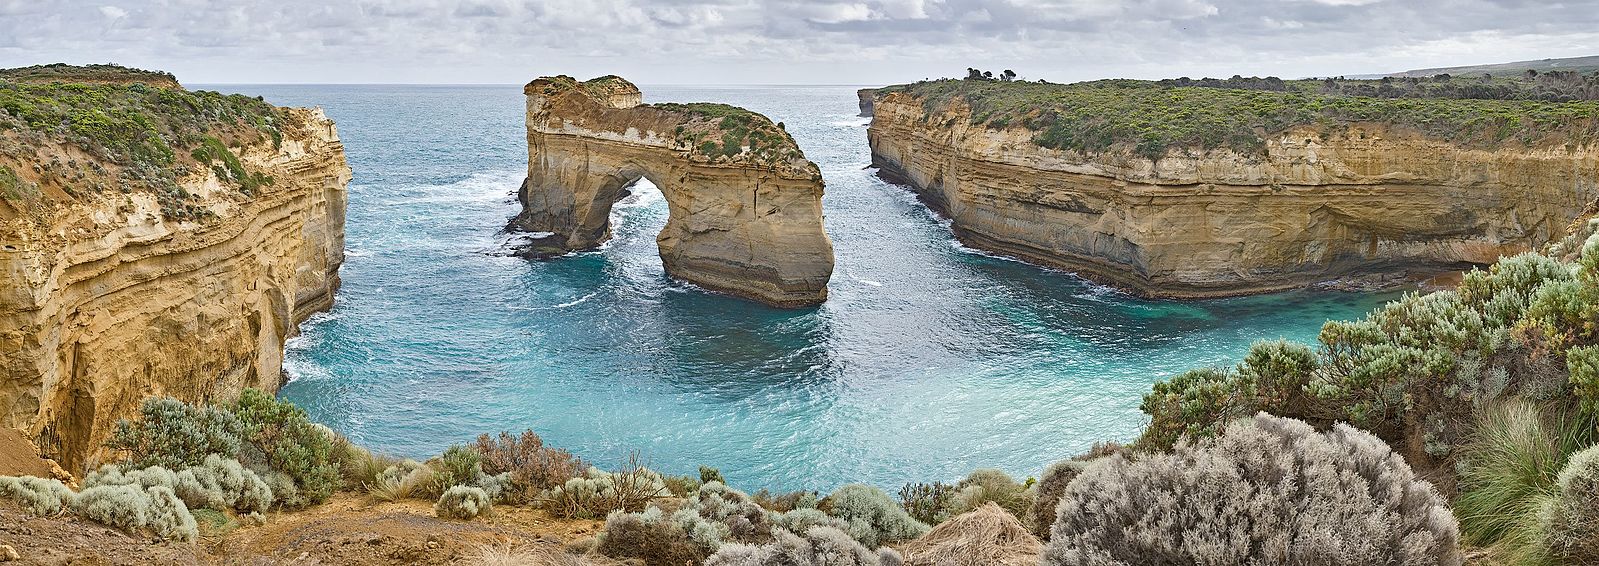
In emergent coasts, wave energy, wind, and gravity erode the coastline. The erosional features are elevated relative to the wave zone. Sea cliffs are persistent features as waves cut away at their base and higher rocks calve off by mass wasting. Refracted waves that attack bedrock at the base of headlands may erode or carve out a sea arch, which can extend below sea level in a sea cave. When a sea arch collapses, it leaves one or more rock columns called stacks.
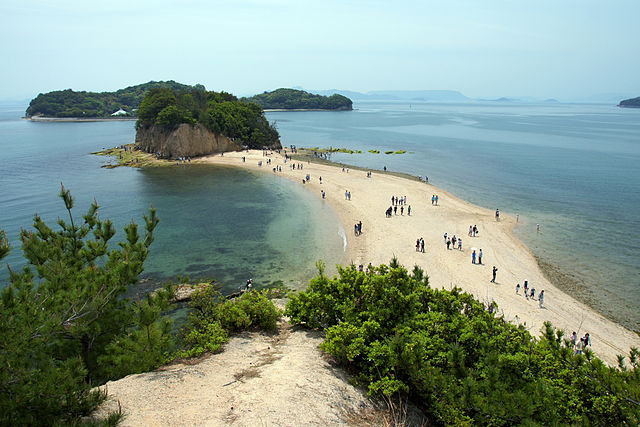
A stack or near shore island creates a quiet water zone behind it. Sand moving in the longshore drift accumulates in this quiet zone forming a tombolo: a sand strip that connects the island or stack to the shoreline. Where sand supply is low, wave energy may erode a wave-cut platform across the surf zone, exposed as bare rock with tidal pools at low tide. This bench-like terrace extends to the cliff’s base. When wave energy cuts into the base of a sea cliff, it creates a wave notch.
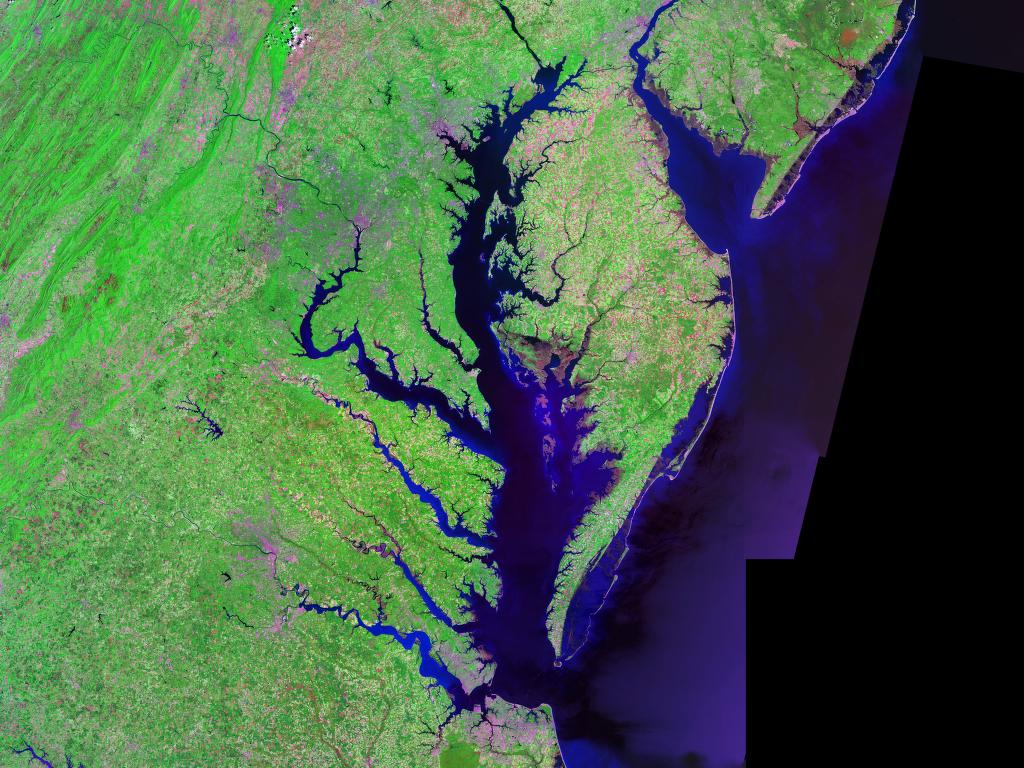
Submergent coasts occur where sea levels rise relative to land. This may be due to tectonic subsidence—when the Earth’s crust sinks—or when sea levels rise due to glacier melt. Features associated with submergent coasts include flooded river mouths, fjords, barrier islands, lagoons, estuaries, bays, tidal flats, and tidal currents. In submergent coastlines, river mouths are flooded by the rising water, for example Chesapeake Bay. Fjords are glacial valleys flooded by post-ice age sea level rise (see chapter 14). Barrier islands are elongated bodies of sand that formed from old beach sands that used to parallel the shoreline. Often, lagoons lie behind barrier islands. Barrier island formation is controversial: some scientists believe that they formed when ice sheets melted after the last ice age, raising sea levels. Another hypothesis is that barrier islands formed from spits and bars accumulating far offshore.
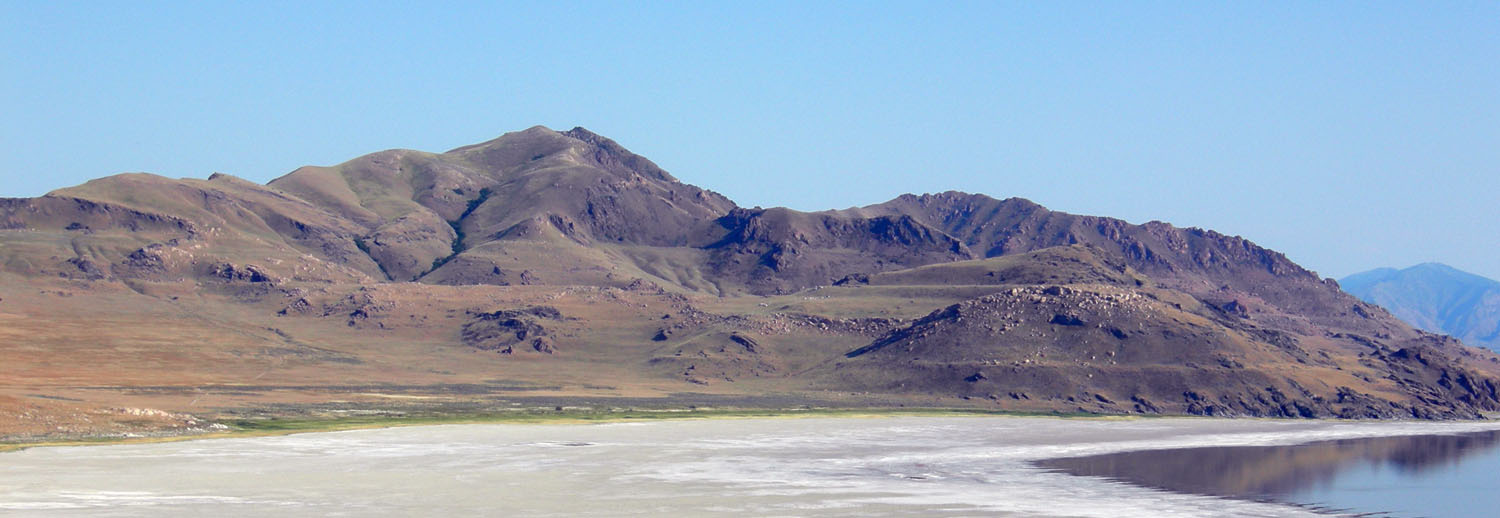
Tidal flats—or mudflats, form where tides alternately flood and expose low areas along the coast. Tidal currents create combinations of symmetrical and asymmetrical ripple marks on mudflats, and drying mud creates mud cracks. In the central Wasatch Mountains of Utah, ancient tidal flat deposits are exposed in the Precambrian strata of the Big Cottonwood Formation. These ancient deposits provide an example of applying Hutton’s principle of uniformitarianism (see chapter 1). Sedimentary structures common on modern tidal flats indicate that these ancient deposits were formed in a similar environment: there were shorelines, tides, and shoreline processes acting at that time, yet the ancient age indicates that there were no land plants to hold products of mechanical weathering in place (see chapter 5), so erosion rates would have been different.
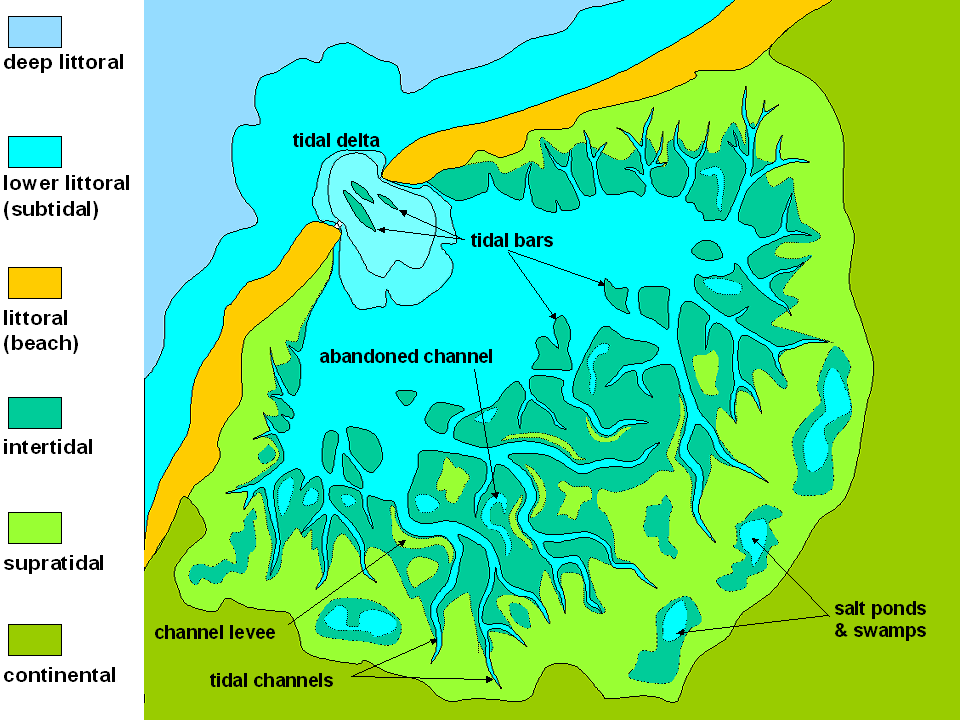
Geologically, tidal flats are broken into three different sections: barren zones, marshes, and salt pans. These zones may be present or absent in each individual tidal flat. Barren zones are areas with strong flowing water, coarser sediment, with ripple marks and cross bedding common. Marshes are vegetated with sand and mud. Salt pans or flats, less often submerged than the other zones, are the finest-grained parts of tidal flats, with silty sediment and mud cracks (see chapter 5).
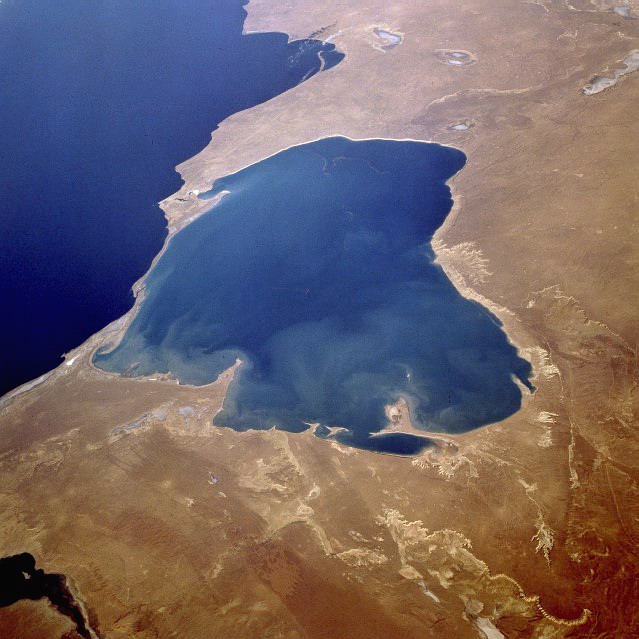
Lagoons are locations where spits, barrier islands, or other features partially cut off a body of water from the ocean. Estuaries are a vegetated type of lagoon where fresh water flows into the area making the water brackish—a salinity between salt and fresh water. However, terms like lagoon, estuary, and even bay are often loosely used in place of one another. Lagoons and estuaries are certainly transitional between land and water environments where littoral, shallow shorelines; lacustrine, lakes or lagoons; and fluvial, rivers or currents can overlap. For more information on lagoons and estuaries, see chapter 5.
12.2.4 Human Impact on Coastal Beaches
Humans impact coastal beaches when they build homes, condominiums, hotels, businesses, and harbors—and then again when they try to manage the natural processes of erosion. Waves, currents, longshore drift, and dams at river mouths deplete sand from expensive beachfront property and expose once calm harbors to high-wave energy. To protect their investment, keep sand on their beach, and maintain calm harbors, cities and landowners find ways to mitigate the damage by building jetties, groins, dams, and breakwaters.
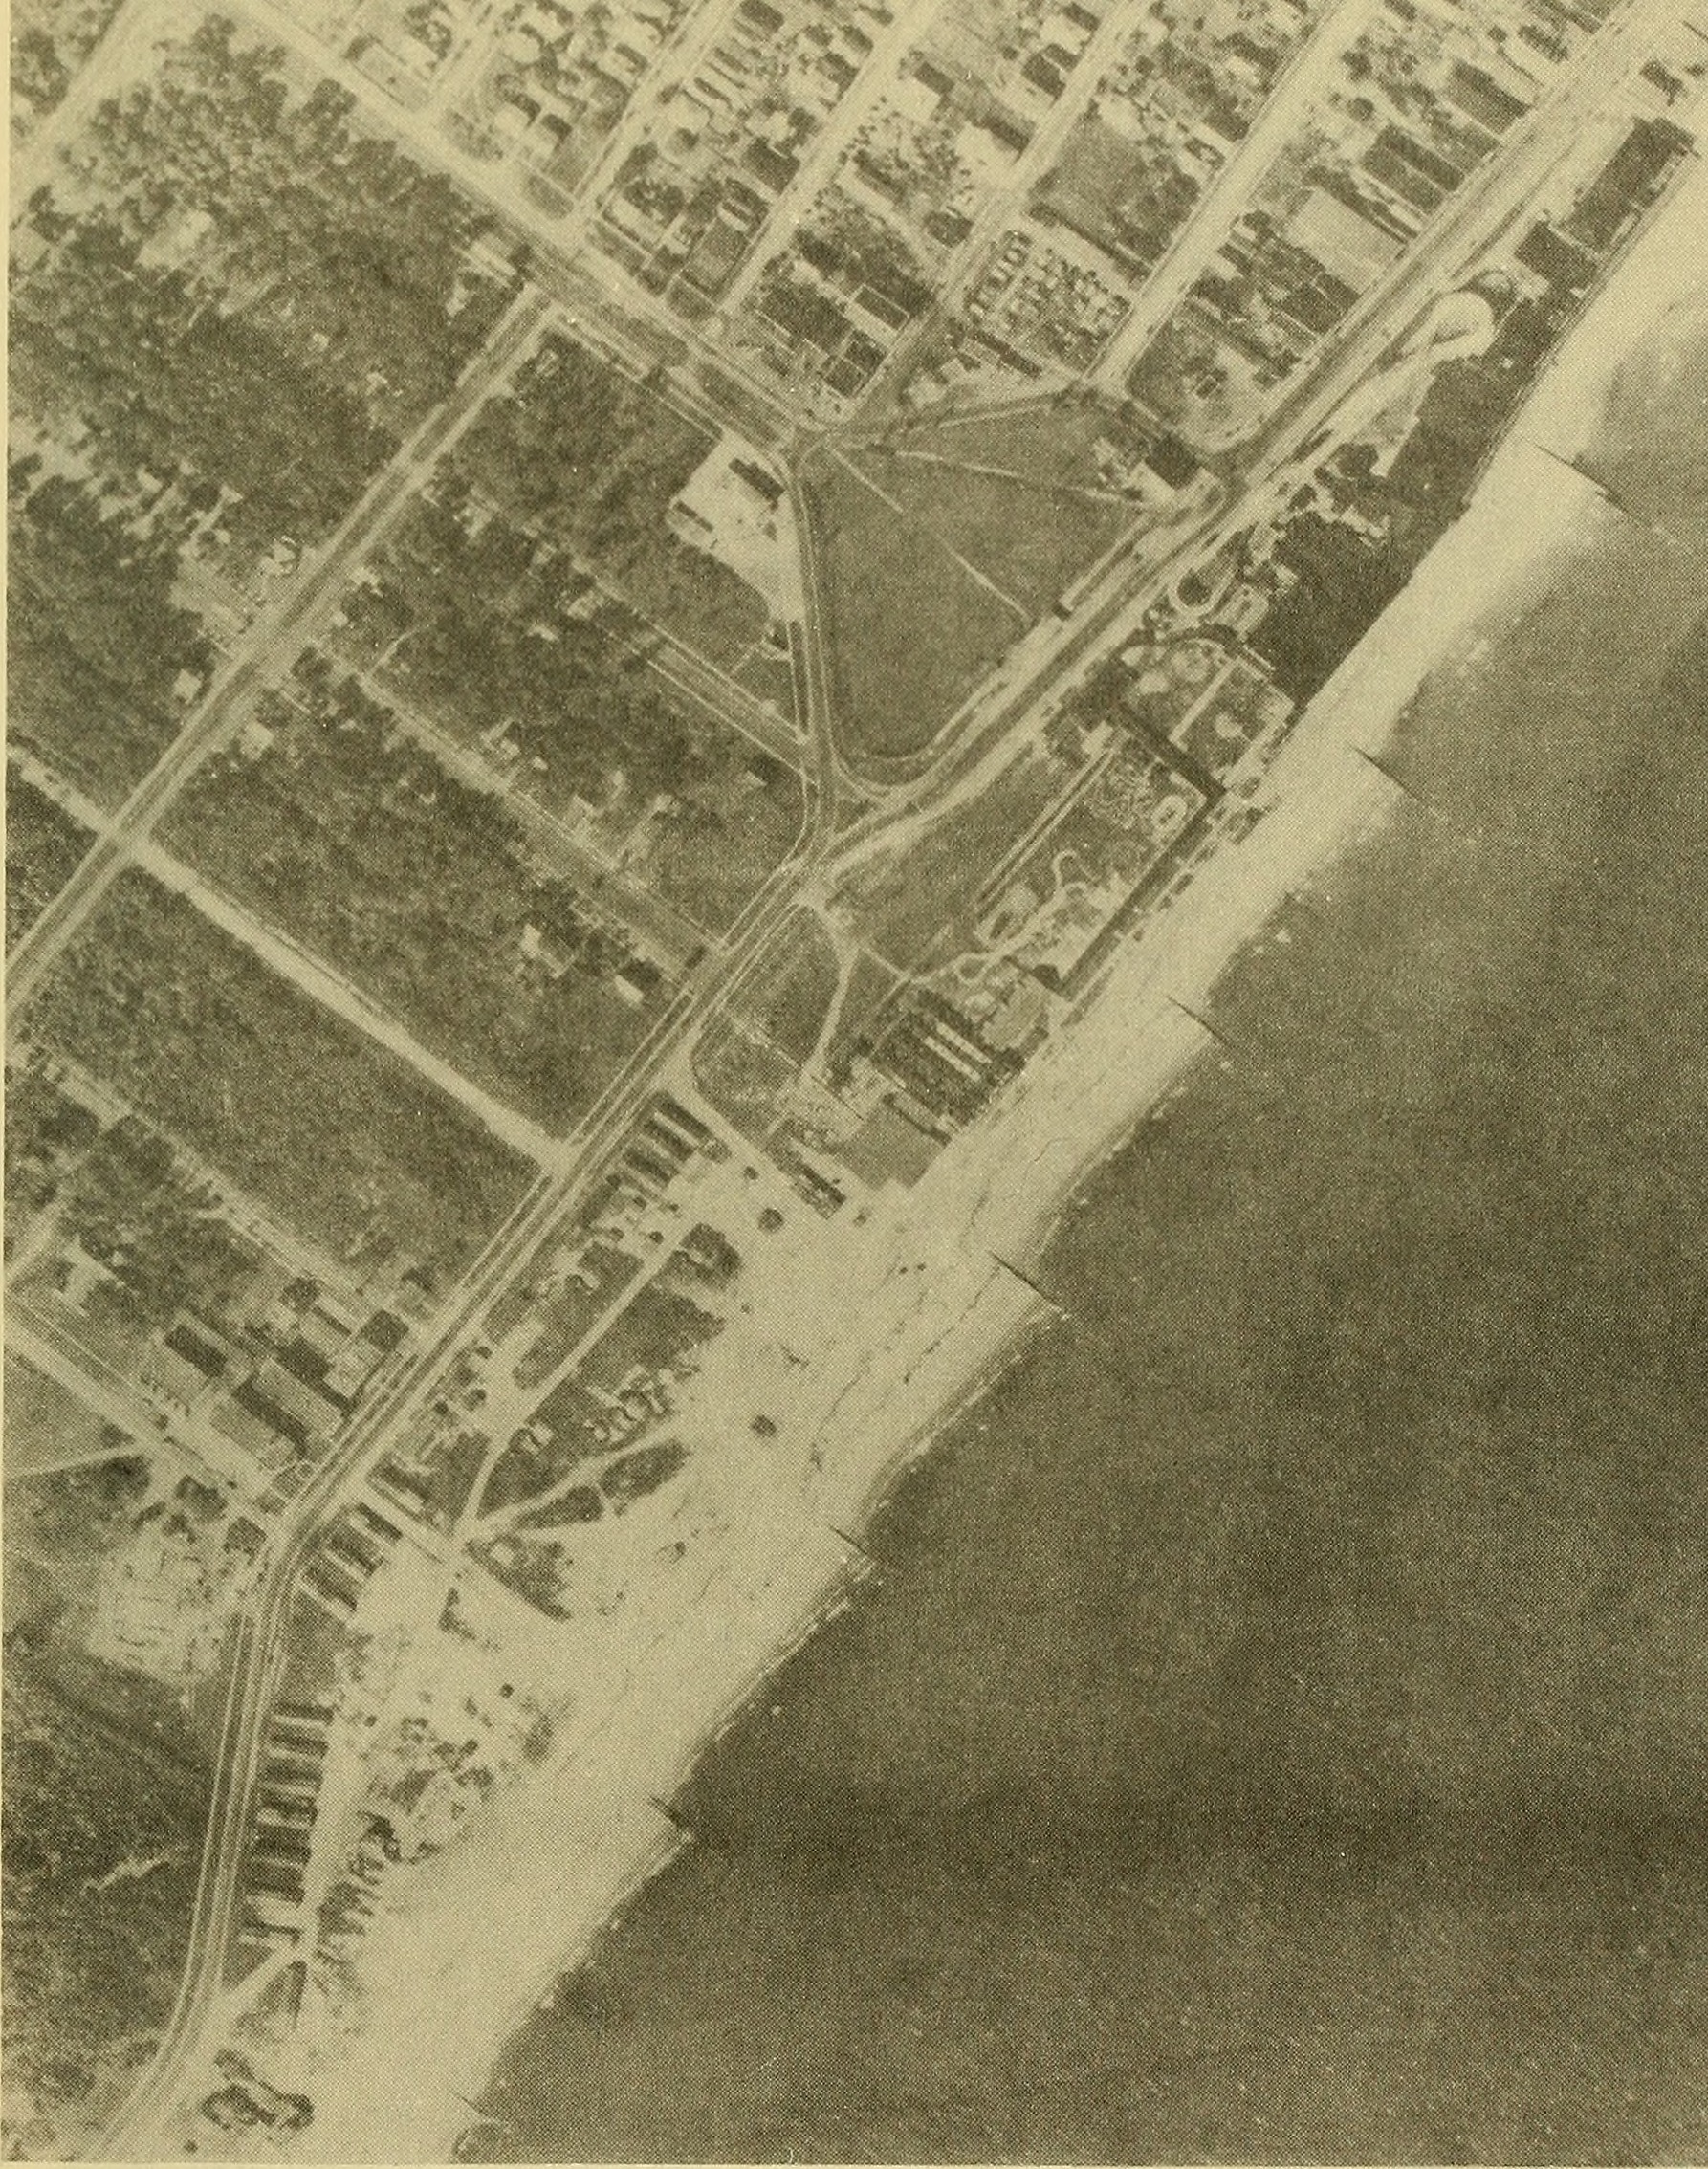
Jetties are large manmade piles of boulders or concrete barriers built at river mouths and harbors. A jetty is designed to divert the current or tide, to keep a channel to the ocean open, and to protect a harbor or beach from wave action. Groins are similar but smaller than jetties. Groins are fences of wire, wood or concrete built across the beach perpendicular to the shoreline and downstream of a property. Unlike jetties, groins are used to preserve sand on a beach rather than to divert it. Sand erodes on the downstream side of the groin and collects against the upstream side. Every groin on one property thus creates a need for another one on the property downstream. A series of groins along a beach develops a scalloped appearance along the shoreline.
Inland streams and rivers flow to the ocean carrying sand to the longshore current which distributes it to beaches. When dams are built, they trap sand and keep sediment from reaching beaches. To replenish beaches, sand may be hauled in from other areas by trucks or barges and dumped on the depleted beach. Unfortunately, this can disrupt the ecosystem that exists along the shoreline by exposing native creatures to foreign ecosystems and microorganisms and by introducing foreign objects to humans. For example, visitors to one replenished east coast beach found munitions and metal shards in the sand, which had been dredged from abandoned military test ranges.
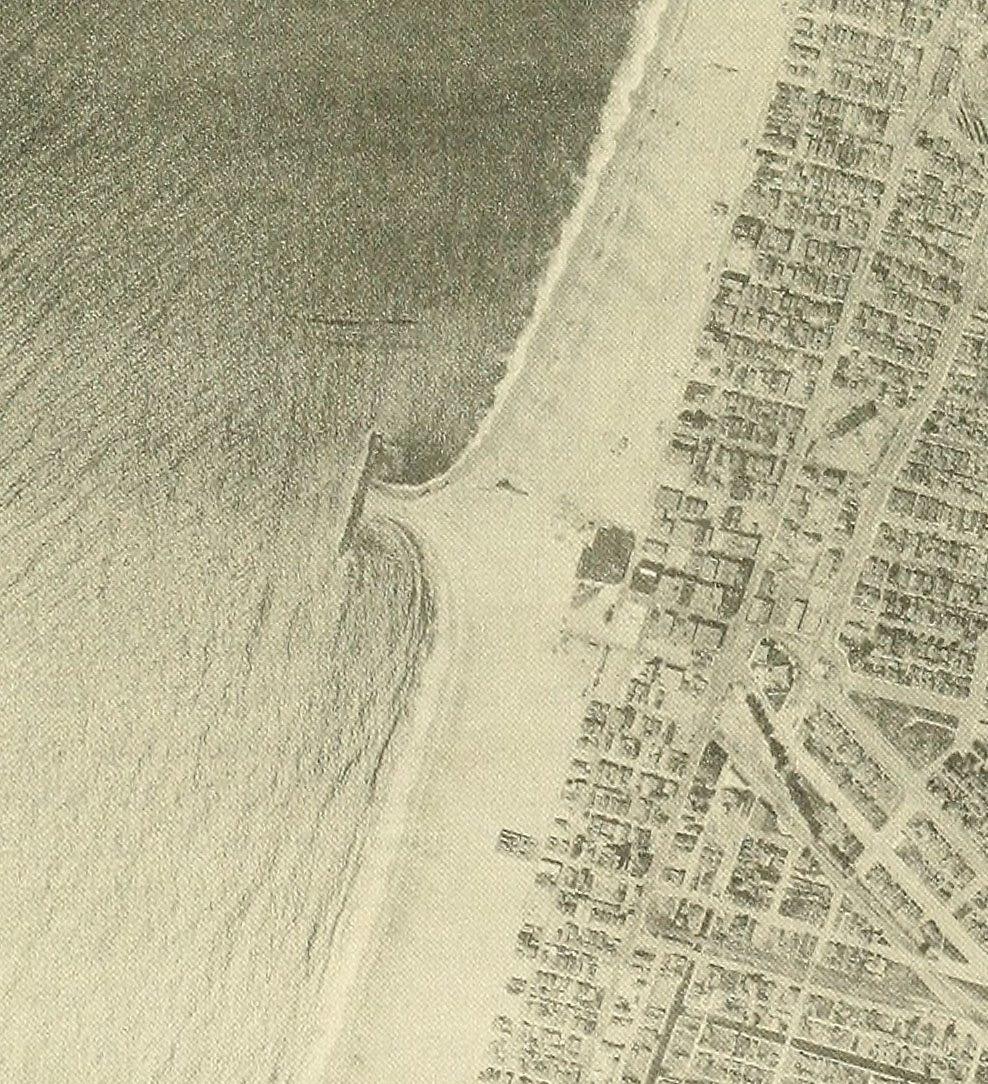
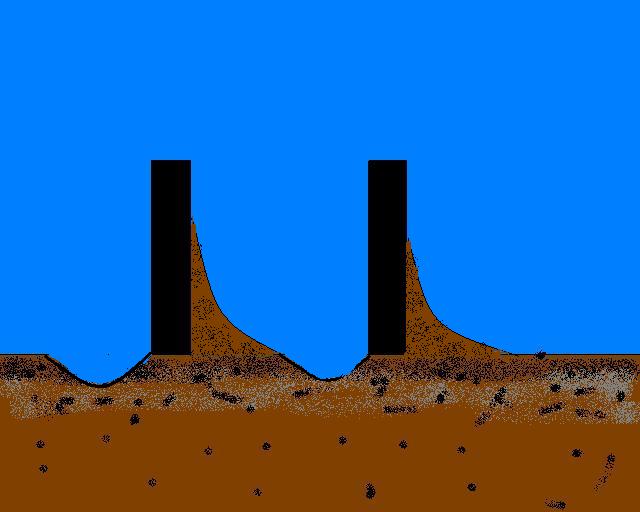
An approach to protect harbors and moorings from high-energy wave action is to build a breakwater—an offshore structure against which the waves break, leaving calmer waters behind it. Unfortunately, breakwaters keep waves from reaching the beach and stop sand moving with longshore drift. When longshore drift is interrupted, sand is deposited in quieter water, and the shoreline builds out forming a tombolo behind the breakwater. The tombolo eventually fill in behind the breakwater with sand. When the city of Venice, California built a breakwater to create a quiet water harbor, longshore drift created a tombolo behind the breakwater, as seen in the image. The tombolo now acts as a large groin in the beach drift.
12.2.5 Submarine Canyons
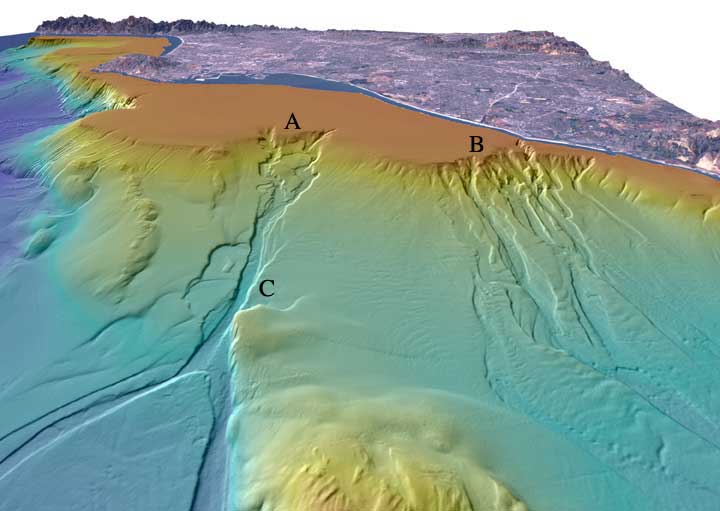
Submarine canyons are narrow, deep underwater canyons located on continental shelves. Submarine canyons typically form at the mouths of large landward river systems. They form when rivers cut down into the continental shelf during low sea level and when material continually slumps or flows down from the mouth of a river or a delta. Underwater currents rich in sediment and more dense than sea water, can flow down the canyons, even erode and deepen them, then drain onto the ocean floor. Underwater landslides, called turbidity flows, occur when steep delta faces and underwater sediment flows are released down the continental slope. Turbidity flows in submarine canyons can continue to erode the canyon, and eventually, fan-shaped deposits develop at the mouth of the canyon on the continental rise. See chapter 5 for more information on turbidity flows.

Take this quiz to check your comprehension of this section.
If you are using an offline version of this text, access the quiz for section 12.2 via the QR code.
12.3 Currents and Tides
Ocean water moves as waves, currents, and tides. Ocean currents are driven by persistent global winds blowing over the water’s surface and by water density. Ocean currents are part of Earth’s heat engine in which solar energy is absorbed by ocean water and distributed by ocean currents. Water has another unique property, high specific heat, that relates to ocean currents. Specific heat is the amount of heat necessary to raise a unit volume of a substance one degree. For water it takes one calorie per cubic centimeter to raise its temperature one degree Celsius. This means the oceans, covering 71% of the Earth’s surface, soak up solar heat with little temperature change and distribute that heat around the Earth by ocean currents.
12.3.1 Surface Currents
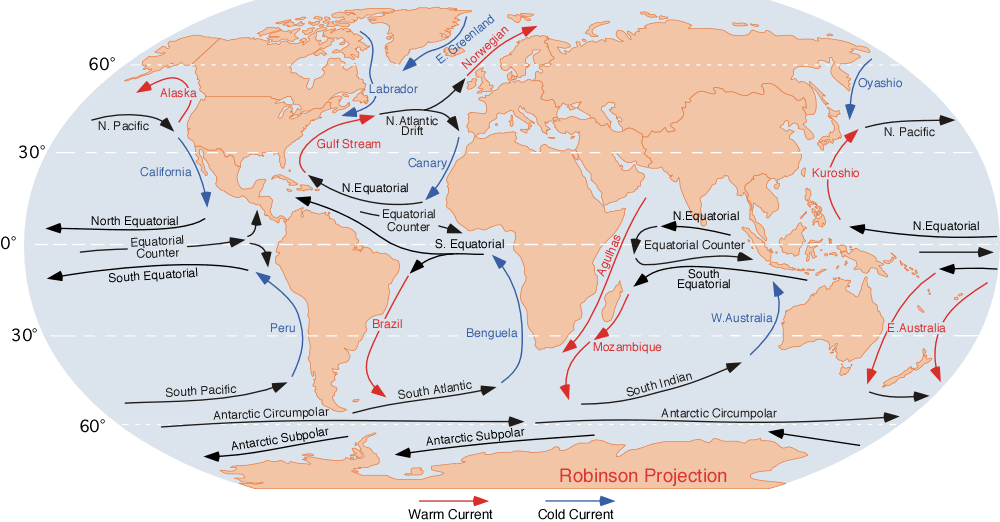
The Earth’s rotation and the Coriolis effect exert significant influence on ocean currents (see chapter 13). In the figure, the black arrows show global surface currents. Notice the large circular currents in the northern and southern hemispheres in the Atlantic, Pacific, and Indian Oceans. These currents are called gyres and are driven by atmospheric circulation—air movement. Gyres rotate clockwise in the northern hemisphere and counterclockwise in the southern hemisphere because of the Coriolis Effect. Western boundary currents flow from the equator toward the poles carrying warm water. They are key contributors to local climate. Western boundary currents are narrow and move poleward along the east coasts of adjacent continents. The Gulf Stream and the Kuroshio currents in the northern hemisphere and the Brazil, Mozambique, and Australian currents in the southern hemisphere are western boundary currents. Currents returning cold water toward the equator are broad and diffuse along the western coasts of adjacent land masses. These warm western boundary and cold eastern boundary currents affect climate of nearby lands making them warmer or colder than other areas at equivalent latitudes. For example, the warm Gulf Stream makes Northern Europe much milder than similar latitudes in northeastern Canada and Greenland. Another example is the cool Humboldt Current, also called the Peru Current, flowing north along the west coast of South America. Cold currents limit evaporation in the ocean, which is one reason the Atacama Desert in Chile is cool and arid.
12.3.2 Deep Currents
Whether an ocean current moves horizontally or vertically depends on its density. The density of seawater is determined by temperature and salinity.
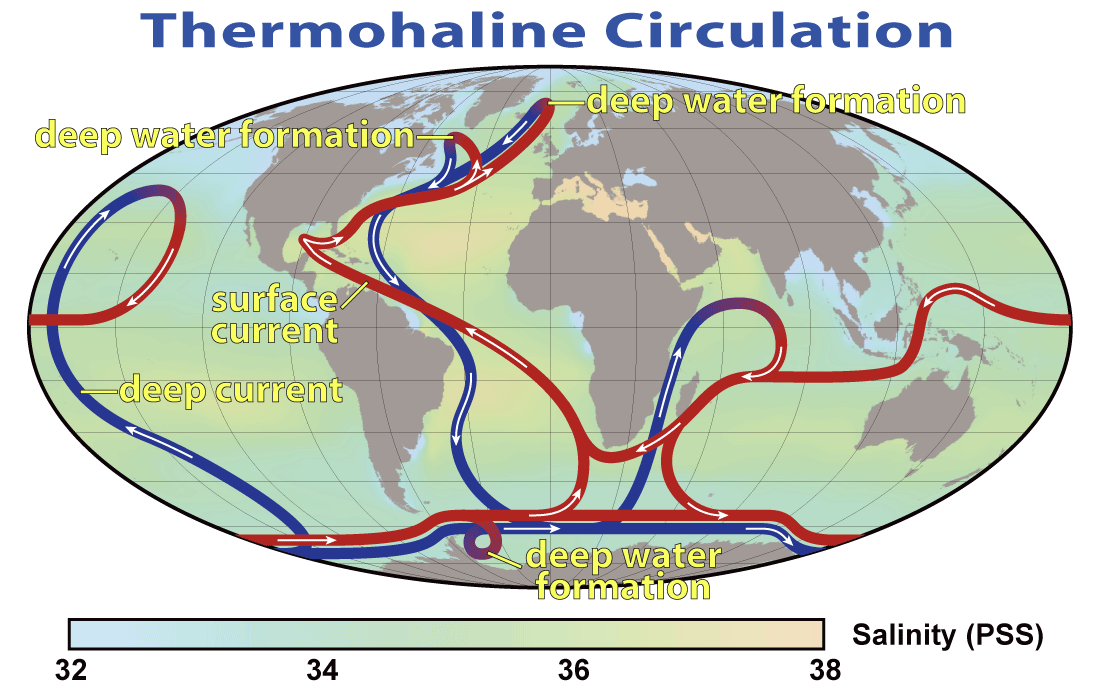
Evaporation and freshwater influx from rivers affect salinity and, therefore, the density of seawater. As the western boundary currents cool at high latitudes and salinity increases due to evaporation and ice formation (recall that ice floats; water is densest just above its freezing point). So the cold, denser water sinks to become the ocean’s deep waters. Deep-water movement is called thermohaline circulation—thermo refers to temperature, and haline refers to salinity. This circulation connects the world’s deep ocean waters. Movement of the Gulf Stream illustrates the beginning of thermohaline circulation. Heat in the warm poleward moving Gulf Stream promotes evaporation which takes heat from the water and as heat thus dissipates, the water cools. The resulting water is much colder, saltier, and denser. As the denser water reaches the North Atlantic and Greenland, it begins to sink and becomes a deep-water current. As shown in the illustration above, this worldwide connection between shallow and deep-ocean circulation overturns and mixes the entire world ocean, bringing nutrients to marine life, and is sometimes referred to as the global conveyor belt.
12.3.3 Tides
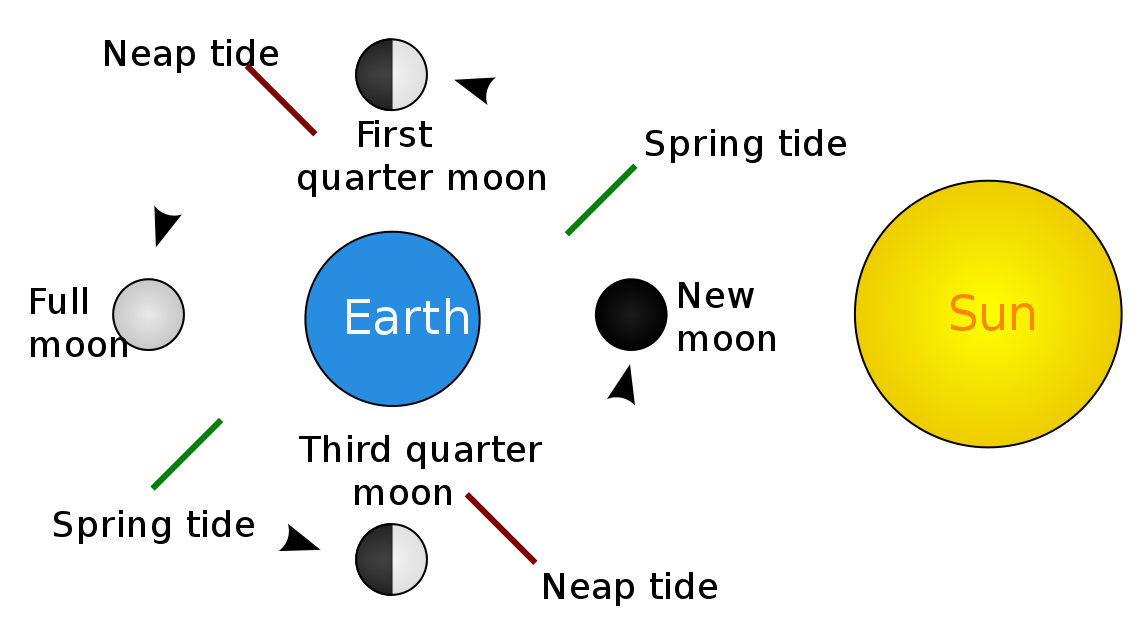
Tides are the rising and lowering of sea level during the day and are caused by the gravitational effects of the Sun and Moon on the oceans. The Earth rotates daily within the Moon and Sun’s gravity fields. Although the Sun is much larger and its gravitational pull is more powerful, the Moon is closer to Earth; hence, the Moon’s gravitational influence on tides is dominant. The magnitude of the tide at a given location and the difference between high and low tide—the tidal range, depends primarily on the configuration of the Moon and Sun with respect to the Earth orbit and rotation. Spring tide occurs when the Sun, Moon, and Earth line up with each other at the full or new Moon, and the tidal range is at a maximum. Neap tide occurs approximately two weeks later when the Moon and Sun are at right angles with the Earth, and the tidal range is lowest.
The Earth rotates within a tidal envelope, so tides rise and ebb daily. Tides are measured at coastal locations. These measurements and the tidal predictions based on them are published on the NOAA website. Tides rising and falling create tidal patterns at any given shore location. The three types of tidal patterns are diurnal, semidiurnal, and mixed.
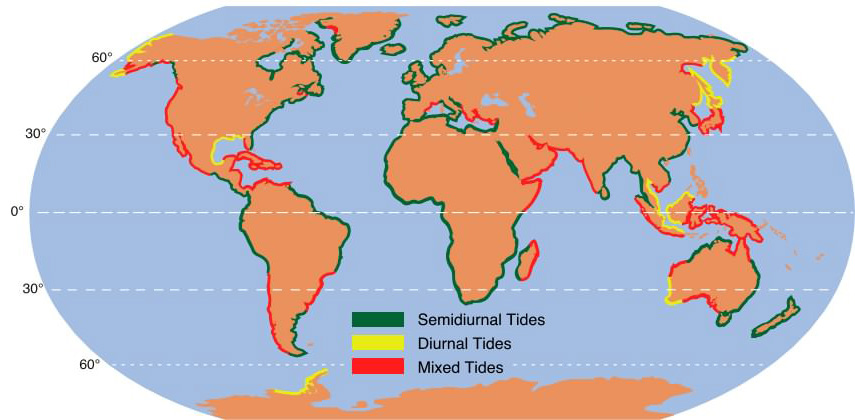
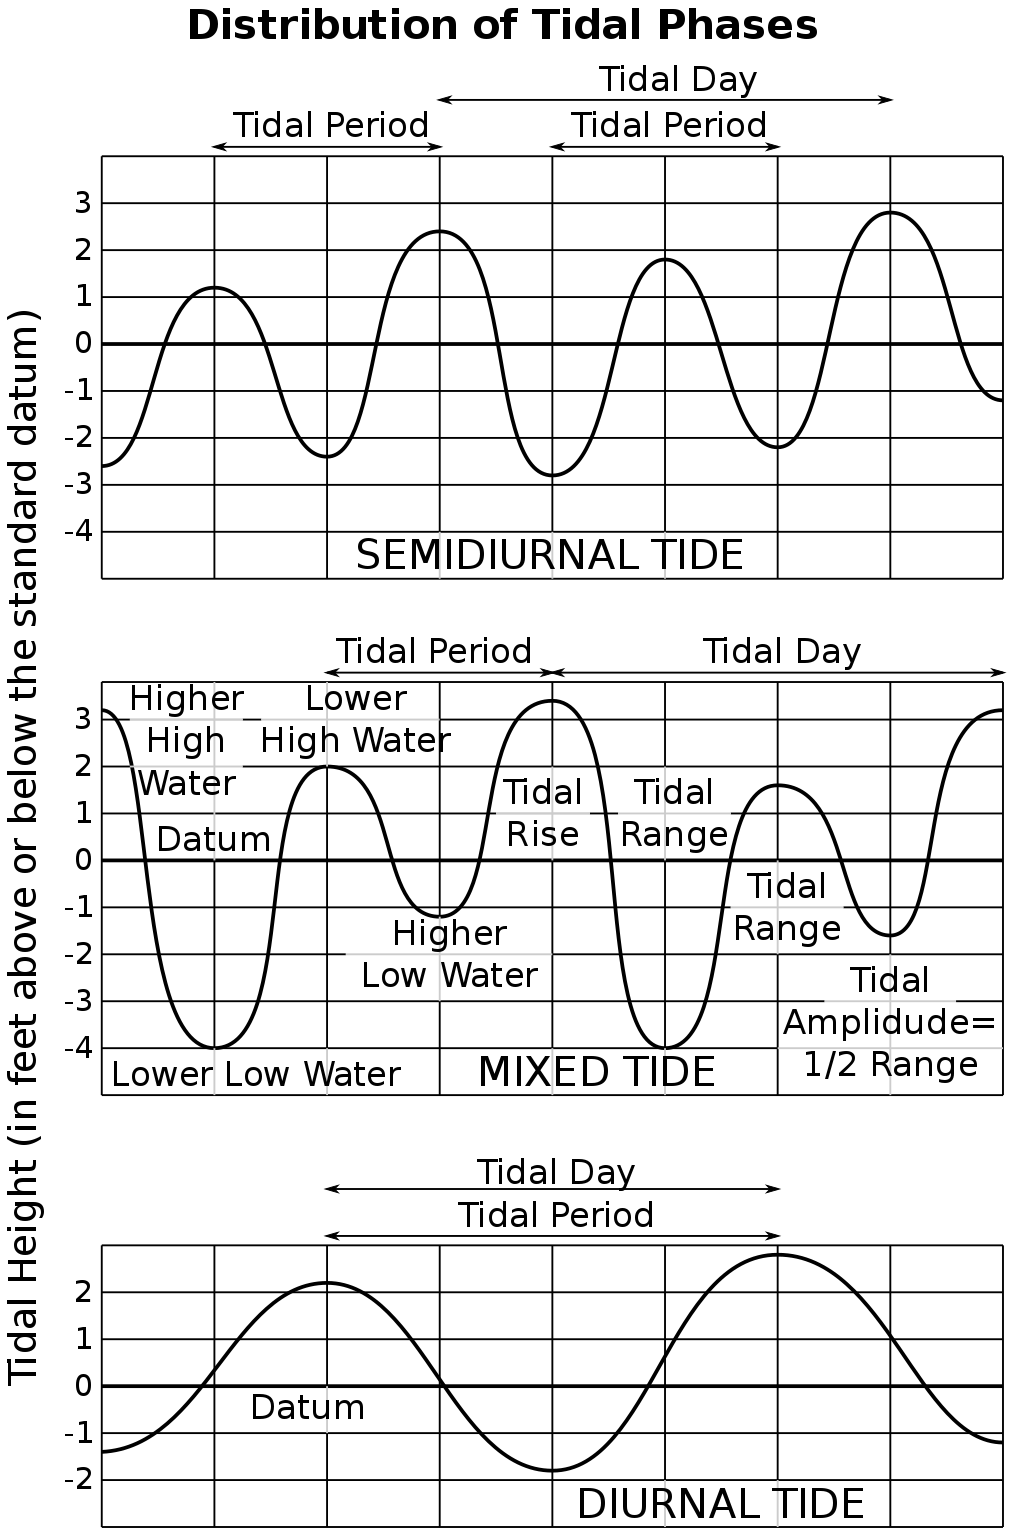
Diurnal tides go through one complete cycle each tidal day. A tidal day is the amount of time for the Moon to align with a point on the Earth as the Earth rotates, which is slightly longer than 24 hours. Semidiurnal tides go through two complete cycles in each tidal day—approximately 12 hours and 50 minutes, with the tidal range typically varying in each cycle. Mixed tides are a combination of diurnal and semidiurnal patterns and show two tidal cycles per tidal day, but the relative amplitudes of each cycle and their highs and lows vary during the tidal month. For example, there is a high, high tide and a high, low tide. The next day, there is a low, high tide and a low, low tide. Forecasting the tidal pattern and the times tidal phases arrive at a given shore location
is complicated and can be done for only a few days at a time. Tidal phases are determined by bathymetry: the depth of ocean basins and the continental obstacles that are in the way of the tidal envelope within which the Earth rotates. Local tidal experts make 48-hour tidal forecasts using tidal charts based on daily observations, as can be seen in the chart of different tide types. A typical tidal range is approximately 1 m (3 ft). Extreme tidal ranges occur where the tidal wave enters a narrow restrictive zone that funnels the tidal energy. An example is the English Channel between Great Britain and the European continent where the tidal range is 7 to 9.75 m (23 to 32 ft). The Earth’s highest tidal ranges occur at the Bay of Fundy, the funnel-like bay between Nova Scotia and New Brunswick, Canada, where the average range is nearly 12 m (40 ft) and the extreme range is around 18 m (60 ft). At extreme tidal range locations, a person who ventures out onto the seafloor exposed during ebb tide may not be able to outrun the advancing water during flood tide. NOAA has additional information on tides.

Take this quiz to check your comprehension of this section.
If you are using an offline version of this text, access the quiz for section 12.3 via the QR code.
Summary
Shoreline processes are complex, but important for understanding coastal processes. Waves, currents, and tides are the main agents that shape shorelines. Most coastal landforms can be attributed to moving sand via longshore drift, and long-term rising or falling sea levels.
The shoreline is the interface between water and land and is divided into five zones. Processes at the shoreline are called littoral processes. Waves approach the beach at an angle, which cause the waves to bend towards the beach. This bending action is called wave refraction and is responsible for creating the longshore current and longshore drift—the process that moves sand along the coasts. When the longshore current deposits sand along the coast into quieter waters, the sand can accumulate, creating a spit or barrier called a baymouth bar, which often blocks bays and harbors. Inconvenienced humans create methods to keep their harbors open and preserve sand on their beaches by creating jetties and groins, which negatively affect natural beach processes.
Emergent coasts are created by sea levels falling, while submergent coasts are caused by sea levels rising. Oceans absorb solar energy, which is distributed by currents throughout the world. Circular surface currents, called gyres, rotate clockwise in the northern hemisphere and counterclockwise in the southern hemisphere. Thermohaline deep circulation connects the world’s deep ocean waters: when shallow poleward moving warm water evaporates, the colder, saltier, and denser water sinks and becomes deep-water currents. The connection between shallow and deep-ocean circulation is called the global conveyor belt.
Tides are the rising and lowering of sea level during the day and are caused by the gravitational effects of the Sun and Moon on the oceans. There are three types of tidal patterns: diurnal, semidiurnal, and mixed. Typical tidal ranges are approximately 1 m (3 ft). Extreme tidal ranges are around 18 m (60 ft).

Take this quiz to check your comprehension of this chapter.
If you are using an offline version of this text, access the quiz for chapter 12 via the QR code.
URLs Linked Within This Chapter
Tide measurements and predictions: https://tidesandcurrents.noaa.gov/tide_predictions.html
NOAA: https://tidesandcurrents.noaa.gov/
Text References
- Colling, Angela. 2001. Ocean Circulation. Edited by Open University Course Team. Butterworth-Heinemann.
- Davis, Richard A., Jr., and Duncan M. Fitzgerald. 2009. Beaches and Coasts. John Wiley & Sons.
- Davis, Richard Albert. 1997. The Evolving Coast. Scientific American Library New York.
- Greene, Paul, George Follett, and Clint Henker. 2009. “Munitions and Dredging Experience on the United States Coast.” Marine Technology Society Journal 43 (4): 127–31.
- Jackson, Nancy L., Mitchell D. Harley, Clara Armaroli, and Karl F. Nordstrom. 2015. “Beach Morphologies Induced by Breakwaters with Different Orientations.” Geomorphology 239 (June). Elsevier: 48–57.
- “Littoral Bypassing and Beach Restoration in the Vicinity of Port Hueneme, California.” n.d. In Coastal Engineering 1966.
- Munk, Walter H. 1950. “On the Wind-Driven Ocean Circulation.” Journal of Meteorology 7 (2): 80–93.
- Normark, William R., and Paul R. Carlson. 2003. “Giant Submarine Canyons: Is Size Any Clue to Their Importance in the Rock Record?” Geological Society of America Special Papers 370 (January): 175–90.
- Reineck, H-E, and Indra Bir Singh. 2012. Depositional Sedimentary Environments: With Reference to Terrigenous Clastics. Springer Science & Business Media.
- Rich, John Lyon. 1951. “Three Critical Environments of Deposition, and Criteria for Recognition of Rocks Deposited In Each of Them.” Geological Society of America Bulletin 62 (1). gsabulletin.gsapubs.org: 1–20.
- Runyan, Kiki, and Gary Griggs. 2005. “Implications of Harbor Dredging for the Santa Barbara Littoral Cell.” In California and the World Ocean ’02, 121–35. Reston, VA: American Society of Civil Engineers.
- Schwiderski, Ernst W. 1980. “On Charting Global Ocean Tides.” Reviews of Geophysics 18 (1): 243–68.
- Stewart, Robert H. 2008. Introduction to Physical Oceanography. Texas A & M University Texas.
- Stommel, Henry, and A. B. Arons. 2017. “On the Abyssal Circulation of the World ocean—I. Stationary Planetary Flow Patterns on a Sphere – ScienceDirect.” Accessed February 26. http://www.sciencedirect.com/science/article/pii/0146631359900656.
- Stommel, Henry, and A. B. Arons. 2017. “On the Abyssal Circulation of the World ocean—I. Stationary Planetary Flow Patterns on a Sphere – ScienceDirect.” Accessed February 26. http://www.sciencedirect.com/science/article/pii/0146631359900656.
Figure References
Figure 12.1: Particle motion within a wind-blown wave. Kraaiennest. 2008. CC BY-SA 4.0. https://commons.wikimedia.org/wiki/File:Deep_water_wave.gif
Figure 12.2: Aspects of water waves, labeled. NOAA. Unknown date. Public domain. https://oceanservice.noaa.gov/education/tutorial_currents/media/supp_cur03a.html
Figure 12.3: Diagram describing wavebase. GregBenson. 2004. CC BY-SA 3.0. https://en.wikipedia.org/wiki/File:Wavebase.jpg
Figure 12.4: Wave train moving with dispersion. Fffred~commonswiki. 2006. Public domain. https://commons.wikimedia.org/wiki/File:Wave_packet_(dispersion).gif
Figure 12.5: Types of breakers. Kraaiennest. 2015. CC BY-SA 3.0. https://commons.wikimedia.org/wiki/File:Breaking_wave_types.svg
Figure 12.6: All waves, like tsunamis, slow down as they reach shallow water. Régis Lachaume. 2005. CC BY-SA 3.0. https://commons.wikimedia.org/wiki/File:Propagation_du_tsunami_en_profondeur_variable.gif
Figure 12.7: Diagram of zones of the shoreline. U.S. Navy. 2006. Public domain. https://commons.wikimedia.org/wiki/File:Littoral_Zones.jpg
Figure 12.8: Longshore drift. 1=beach, 2=sea, 3=longshore current direction, 4=incoming waves, 5=swash, 6=backwash. USGS. 2006. Public domain. https://commons.wikimedia.org/wiki/File:Longshore_i18n.png
Figure 12.9: Farewell Spit, New Zealand. NASA. 2006. Public domain. https://commons.wikimedia.org/wiki/File:Farewell_spit.jpg
Figure 12.10: Jetties near Carlsbad, California. USGS. 2005. Public domain. https://commons.wikimedia.org/wiki/File:Jetty_break2_new(USGS).jpg
Figure 12.11: Animation of rip currents. NOAA. 2008. Public domain. https://www.nws.noaa.gov/mdl/rip_current/
Figure 12.12: Island Arch, a sea arch in Victoria, Australia. Diliff. 2008. CC BY-SA 3.0. https://commons.wikimedia.org/wiki/File:Island_Archway,_Great_Ocean_Rd,_Victoria,_Australia_-_Nov_08.jpg
Figure 12.13: This tombolo, called “Angel Road,” connects the stack of Shodo Island, Japan. 663highland. 2012. CC BY-SA 3.0. https://commons.wikimedia.org/wiki/File:Angel_Road_Shodo_Island_Japan01s3.jpg
Figure 12.14: Wave notches carved by Lake Bonneville, Antelope Island, Utah. Wilson44691. 2008. Public domain. https://commons.wikimedia.org/wiki/File:WaveCutPlatformsAntelopeIslandUT.jpg
Figure 12.15: Landsat image of Chesapeake Bay, eastern United States. USGS, NASA. 2009. Public domain. https://www.usgs.gov/media/images/chesapeake-bay-landsat
Figure 12.16: General diagram of a tidal flat and associated features. Foxbat deinos. 2009. Public domain. https://en.m.wikipedia.org/wiki/File:Tidal_flat_general_sketch.png
Figure 12.17: Kara-Bogaz Gol lagoon, Turkmenistan. NASA. 1995. Public domain. https://commons.wikimedia.org/wiki/File:Kara-Bogaz_Gol_from_space,_September_1995.jpg
Figure 12.18: Groins gathering sediment from longshore drift. Archer0630. 2013. CC BY-SA 3.0. https://commons.wikimedia.org/wiki/File:Groin_effect-3.JPG
Figure 12.19: Groin system on a coast in Virginia. Internet Archive Book Images. 1958. Public domain. https://commons.wikimedia.org/wiki/File%3AThe_Annual_bulletin_of_the_Beach_Erosion_Board_(1958)_(18396945096).jpg
Figure 12.20: A tombolo formed behind the breakwater at Venice, CA. Internet Archive Book Images. 1948. Public domain. https://flic.kr/p/wRSfxb
Figure 12.21: Submarine canyons off of Los Angeles. A=San Gabriel Canyon, B=Newport Canyon. At point C, the canyon is 815 m wide and 25 m deep. USGS. 2012. Public domain. https://commons.wikimedia.org/wiki/File:Canyons_off_LA.jpg
Figure 12.22: World ocean currents. Dr. Michael Pidwirny. 2007. Public domain. https://commons.wikimedia.org/wiki/File:Corrientes-oceanicas.png
Figure 12.23: Global thermohaline circulation. NASA. 2008. Public domain. https://commons.wikimedia.org/wiki/File:Thermohaline_Circulation_2.png
Figure 12.24: The types of tides. KVDP. 2009. Public domain. https://commons.wikimedia.org/wiki/File:Tide_schematic.svg
Figure 12.25: Different tide types. Snubcube. 2013. Public domain. https://commons.wikimedia.org/wiki/File:Tide_type.svg
Figure 12.26: Global tide types. KVDP. 2009. Public domain. https://commons.wikimedia.org/wiki/File:Diurnal_tide_types_map.jpg
Figure 12.27: A tidal day lasts slightly longer than 24 hours. NOAA. Unknown date. Public domain. https://oceanservice.noaa.gov/education/tutorial_tides/tides05_lunarday.html
The part of the coastline which is directly related to water-land interaction, specifically the tidal zone and the range of wave base.
Waves that change direction due to changing speeds, typically caused by a change in density of the medium.
A net movement that occurs as waves intersect the shoreline at non-perpendicular angles.
Sediment that moves via a longshore current.
An extensive, distinct, and mapped set of geologic layers.
Features of a coastline where relative sea level is rising.
Features of a coastline where relative sea level is falling.
A channelled body of water.
The beach (shoreline) zone, where waves are crashing.
Areas with an irregular sequence of tides over the course of a month.
Top of a wave.
Bottommost part of a wave.
Twice the amplitude, or, the distance between the crest and trough of a wave.
Height or depth of a wave from the middle point.
The distance between any two repeating portions of a wave (e.g., two successive wave crests).
Speed at which a wave travels past a fixed point.
The time between like parts of a wave passing a fixed point.
The depth in which the movement of waves can be felt, specifically by sediments. This is approximately equal to 1/2 the wavelength. Wave base can change depending on fair weather verses stormy weather.
Ridges of sediment that form perpendicular to flow in the lower part of the lower flow regime.
Current conditions within the atmosphere.
The depth that waves can reach in large storms, such as hurricanes.
Distance wind has been building a wave.
The entire area which is related to land-sea interactions.
A series of waves that form and move as a group.
The range of sediment sizes within a sediment or sediment within sedimentary rocks. Well sorted means the sediment has the same sizes, poorly sorted means many different sizes are present.
A series of waves produced from a sudden movement of the floor of a ocean basin (or large lake), caused by events such as earthquakes, volcanic eruptions, landslides, and bolide impacts.
General term for sudden material falling (sliding) down a slope due to gravity.
Place where lava is erupted at the surface.
A feature with no internal structure, habit, or layering.
The part of the coastline which is below any wave base action.
Movements of water (rising and falling) due to the gravity of the moon and sun. This is most often seen in marine settings.
Long term averages and variations within the conditions of the atmosphere.
Shore area between low tide and storm wave base. Upper part is dominated by fair weather wave base, lower part is dominated by storm wave base.
Area between high tide and low tide.
Area of the shoreline that is always entirely above normal wave action.
Dense flow of sediment that goes down submarine canyons, forming submarine fans and turbidites.
Steep part of an ocean basin that is the transition between the continental mass and the ocean floor.
The layers of igneous, sedimentary, and metamorphic rocks that form the continents. Continental crust is much thicker than oceanic crust. Continental crust is defined as having higher concentrations of very light elements like K, Na, and Ca, and is the lowest density rocky layer of Earth. Its average composition is similar to granite.
Part of the coastal depositional environment, near the tidal zone but below. Lower shoreface is the part of the coastline which is only disturbed by storm waves, upper shoreface is disturbed by typical, daily wave action.
Shoreline area of breaking waves.
Active area of crashing waves.
Ridge of sand built above the beach face.
Lower, seaward berm that forms with lower wave energy in summer months.
Higher, landward berm that forms with higher wave energy in winter months.
A large pile of sediment, deposited perpendicular to flow. Internal bedding in dunes dips toward flow direction (i.e. cross bedding). Formed in the upper part of the lower flow regime.
A ridge of sediment that occurs out into a body of water, formed via longshore currents.
The end of a river.
A place where a spit extends out and covers a bay.
Artificial device (typically a wall of concrete or rocks) placed to stop or slow longshore drift.
Amount of water that leaves a system, such as a river or aquifer.
Currents that push seaward.
The act of taking a solid and dissolving it into a liquid. This commonly occurs with salts and other minerals in water.
The theory that the outer layer of the Earth (the lithosphere) is broken in several plates, and these plates move relative to one another, causing the major topographic features of Earth (e.g. mountains, oceans) and most earthquakes and volcanoes.
Term for the underlying lithified rocks that make up the geologic record in an area. This term can sometimes refer to only the deeper, crystalline (non-layered) rocks.
Part of a craton that is covered, mainly by sedimentary rocks.
Any downhill movement of material, caused by gravity.
Rock spire that is offshore and a remnant of a rock layer.
Sand bar that connects a stack and the shore.
An elevated erosional surface caused by glacial or fluvial action.
Erosional notch in bedrock cut by waves.
The act of the land surface down-warping, typically referred to when discussing sedimentation or with rapid groundwater removal.
The outermost chemical layer of the Earth, defined by its low density and higher concentrations of lighter elements. The crust has two types: continental, which is the thick, more ductile, and lowest density, and oceanic, which is higher density, more brittle, and thinner.
A body of ice that moves downhill under its own mass.
Glacial valley filled by ocean water.
Ridges of sand, made from former beach sediments, that form parallel to the shoreline.
Interior body of ocean water, at least partially cut off from the main ocean water.
Lagoon with brackish water, typically with abundant biologic factors.
Wide and flat area of land covered by ocean water during high tide, but exposed to air by low tide.
Deposition and erosion tied to glacier movement.
A period of cooler temperatures on Earth in which ice sheets can grow on continents.
Thick glaciers that cover continents during ice ages.
A proposed explanation for an observation that can be tested.
A term for the collective time before the Phanerozoic (pre-541 million years ago), including the Hadean, Archean, and Proterozoic. Known for a lack of easy-to-find fossils.
Discernible layers of rock, typically from a sedimentary rock.
Idea championed by James Hutton that the present is the key to the past, meaning the physical laws and processes that existed and operated in the past still exist and operate today.
The physical breakdown (weathering) of bedrock by processes such as pressure, ice expansion, etc.
The transport and movement of weathered sediments.
Pieces of rock that have been weathered and possibly eroded.
A sedimentary structure that has inclined layers within an overall layer. Forms commonly in dunes, larger in eolian dunes.
Water that is a mixture of sea water and fresh water.
Deposition in and around lakes.
Deposition that has to do with rivers.
A hard stabilization structure built perpendicular to the shoreline to help control longshore drift.
A geologic circumstance (such as a fold, fault, change in lithology, etc.) which allows petroleum resources to collect.
Offshore durable structure designed to lessen wave action and reduce longshore drift.
Canyon carved into a continental shelf.
Submerged part of the continental mass, with a gentle slope.
Place where rivers enter a large body of water, forming a triangular shape as the river deposits sediment and switches course.
Relatively flat ocean floor, which accumulates very fine grained detrital and chemical sediments.
The measure of the vibrational (kinetic) energy of a substance.
Large circular ocean currents formed by global atmospheric circulation patters.
Driest nonpolar desert on Earth, located in west-central South America.
A connected global ocean circulation pattern that distributes water and heat around the globe.
Places that are under ocean water at all times.
A measure of earthquake strength. Scales include Richter and Moment.
Highest high tide of the month.
Lowest low tide of the month.
Areas that have two clear high and low tides per tidal day.
The amount of time that the moon takes to appear over the same location of Earth, slightly more than 24 hours.
