17 Origin of the Universe and Our Solar System
Learning Objectives
By the end of this chapter, students should be able to:
- Explain the formation of the universe and how we observe it.
- Understand the origin of our solar system.
- Describe how the objects in our solar system are identified, explored, and characterized.
- Describe the types of small bodies in our solar system, their locations, and how they formed.
- Describe the characteristics of the giant planets, terrestrial planets, and small bodies in the solar system.
- Explain what influences the temperature of a planet’s surface.
- Explain why there is geological activity on some planets and not on others.
- Describe different methods for dating planets and the age of the solar system.
- Describe how the characteristics of extrasolar systems help us to model our own solar system.
The universe began 13.77 billion years ago when energy, matter, and space expanded from a single point. Evidence for the big bang is the cosmic “afterglow” from when the universe was still very dense, and red-shifted light from distant galaxies, which tell us the universe is still expanding.
The big bang produced hydrogen, helium, and lithium, but heavier elements come from nuclear fusion reactions in stars. Large stars make elements such as silicon, iron, and magnesium, which are important in forming terrestrial planets. Large stars explode as supernovae and scatter the elements into space.
Planetary systems begin with the collapse of a cloud of gas and dust. Material drawn to the center forms a star, and the remainder forms a disk around the star. Material within the disk clumps together to form planets. In our solar system, rocky planets are closer to the Sun, and ice and gas giants are farther away. This is because temperatures near the Sun were too high for ice to form, but silicate minerals and metals could solidify.
Early Earth was heated by radioactive decay, collisions with bodies from space, and gravitational compression. Heating melted Earth, causing molten metal to sink to Earth’s center and form a core, and silicate melt to float to the surface and form the mantle and crust. A collision with a planet the size of Mars knocked debris into orbit around Earth, and the debris coalesced into the moon. Earth’s atmosphere is the result of volcanic degassing, contributions by comets and meteorites, and photosynthesis.
The search for exoplanets has identified 12 planets that are similar in size to Earth and within the habitable zone of their stars. These are thought to be rocky worlds like Earth, but the compositions of these planets are not known for certain.
17.1 The Big Bang
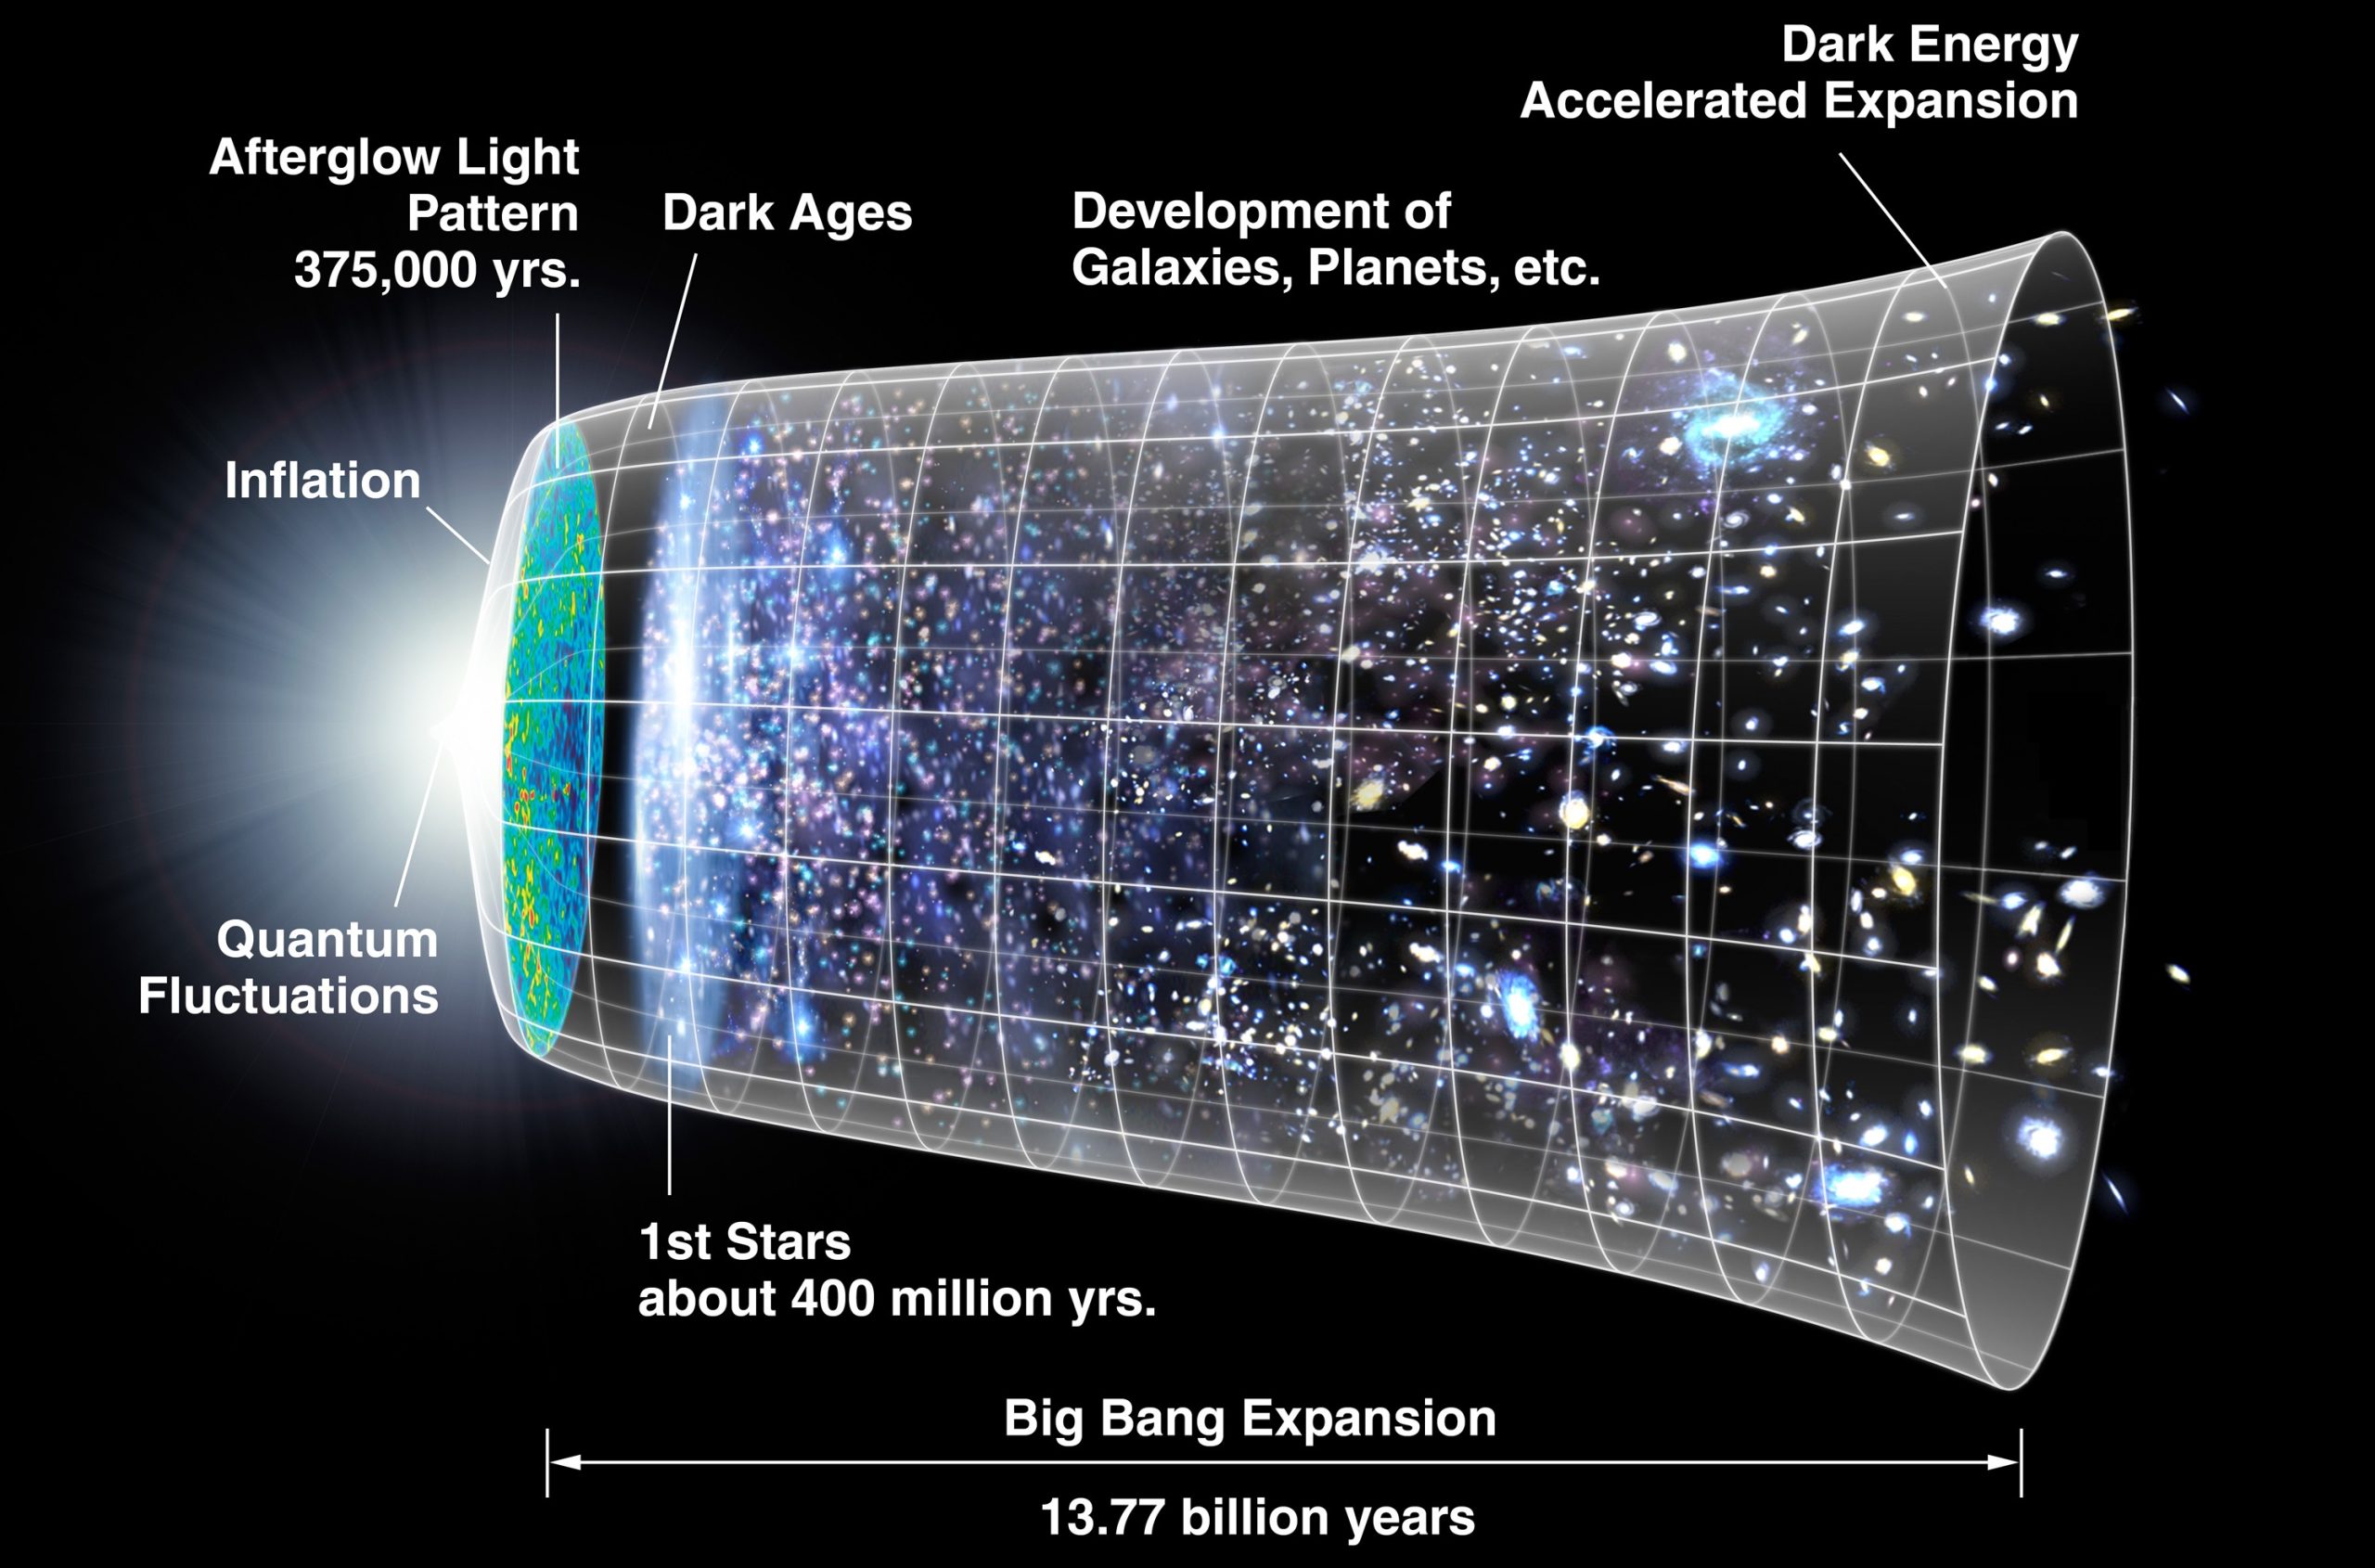
According to the big bang theory, the universe blinked violently into existence 13.77 billion years ago. The big bang is often described as an explosion, but imagining it as an enormous fireball isn’t accurate. The big bang involved a sudden expansion of matter, energy, and space from a single point. The kind of Hollywood explosion that might come to mind involves expansion of matter and energy within space, but during the big bang, space itself was created.
At the start of the big bang, the universe was too hot and dense to be anything but a sizzle of particles smaller than atoms, but as it expanded, it also cooled. Eventually some of the particles collided and stuck together. Those collisions produced hydrogen and helium, the most common elements in the universe, along with a small amount of lithium.
You may wonder how a universe can be created out of nothing, or how we can know that the big bang happened at all. Creating a universe out of nothing is mostly beyond the scope of this chapter, but there is a way to think about it. The particles that make up the universe have opposites that cancel each other out, similar to the way that we can add the numbers 1 and −1 to get zero (also known as “nothing”). As far as the math goes, having zero is exactly the same as having a 1 and a −1. It is also exactly the same as having a 2 and a −2, a 3 and a −3, two −1s and a 2, and so on. In other words, nothing is really the potential for something if you divide it into its opposite parts. As for how we can know that the big bang happened at all, there are very good reasons to accept that it is indeed how our universe came to be.
17.1.1 Looking Back to the Early Stages of the Big Bang
The notion of seeing the past is often used metaphorically when we talk about ancient events, but in this case it is meant literally. In our everyday experience, when we watch an event take place, we perceive that we are watching it as it unfolds in real time. In fact, this isn’t true. To see the event, light from that event must travel to our eyes. Light travels very rapidly, but it does not travel instantly. If we were watching a digital clock 1 m away from us change from 11:59 a.m. to 12:00 p.m., we would actually see it turn to 12:00 p.m. three billionths of a second after it happened. This isn’t enough of a delay to cause us to be late for an appointment, but the universe is a very big place, and the “digital clock” in question is often much, much farther away. In fact, the universe is so big that it is convenient to describe distances in terms of light years, or the distance light travels in one year. What this means is that light from distant objects takes so long to get to us that we see those objects as they were at some considerable time in the past. For example, the star Proxima Centauri is 4.24 light years from the sun. If you viewed Proxima Centauri from Earth on January 1, 2015, you would actually see it as it appeared in early October 2010.
We now have tools that are powerful enough to look deep into space and see the arrival of light from early in the universe’s history. Astronomers can detect light from approximately 375,000 years after the big bang is thought to have occurred. Physicists tell us that if the big bang happened, then particles within the universe would still be very close together at this time. They would be so close that light wouldn’t be able to travel far without bumping into another particle and getting scattered in another direction. The effect would be to fill the sky with glowing fog, the “afterglow” from the formation of the universe.
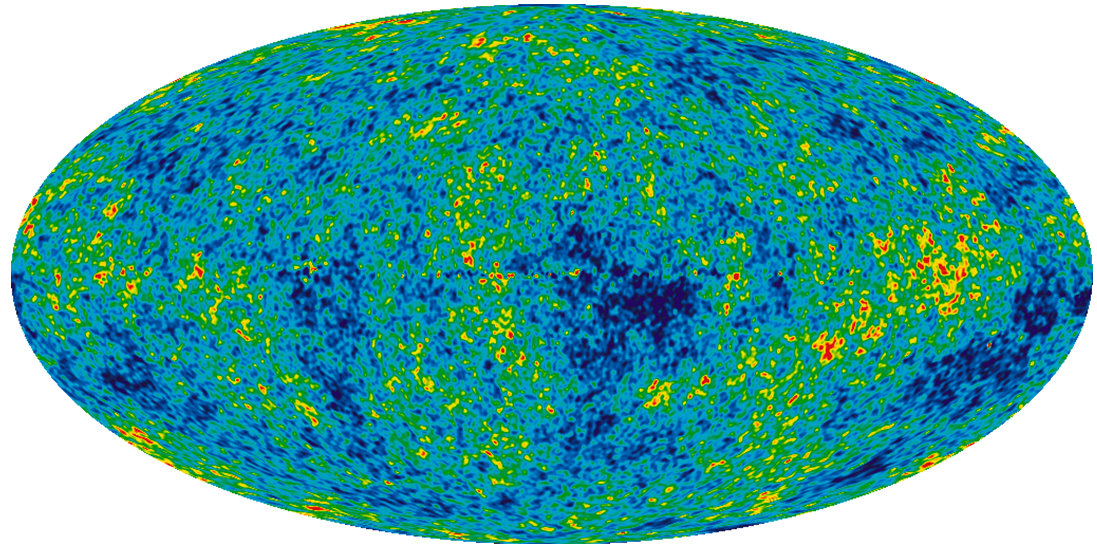
In fact, this is exactly what we see when we look at light from 375,000 years after the big bang. The fog is referred to as the cosmic microwave background (or CMB), and it has been carefully mapped throughout the sky. The map displays the cosmic microwave background as temperature variations, but these variations translate to differences in the density of matter in the early universe. The red patches are the highest density regions and the blue patches are the lowest density. Higher density regions represent the eventual beginnings of stars and planets. The map has been likened to a baby picture of the universe.
17.1.2 The Big Bang is Still Happening, and We Can See the Universe Expanding

The expansion that started with the big bang never stopped. It continues today, and we can see it happening by observing galaxies that large clusters of billions of stars, called galaxies, are moving away from us. (The exception is the Andromeda galaxy with which we are on a collision course.) The astronomer Edwin Hubble came to this conclusion when he observed that the light from other galaxies was red-shifted. The red shift is a consequence of the Doppler effect. This refers to how we see waves when the object that is creating the waves is moving toward us or away from us.
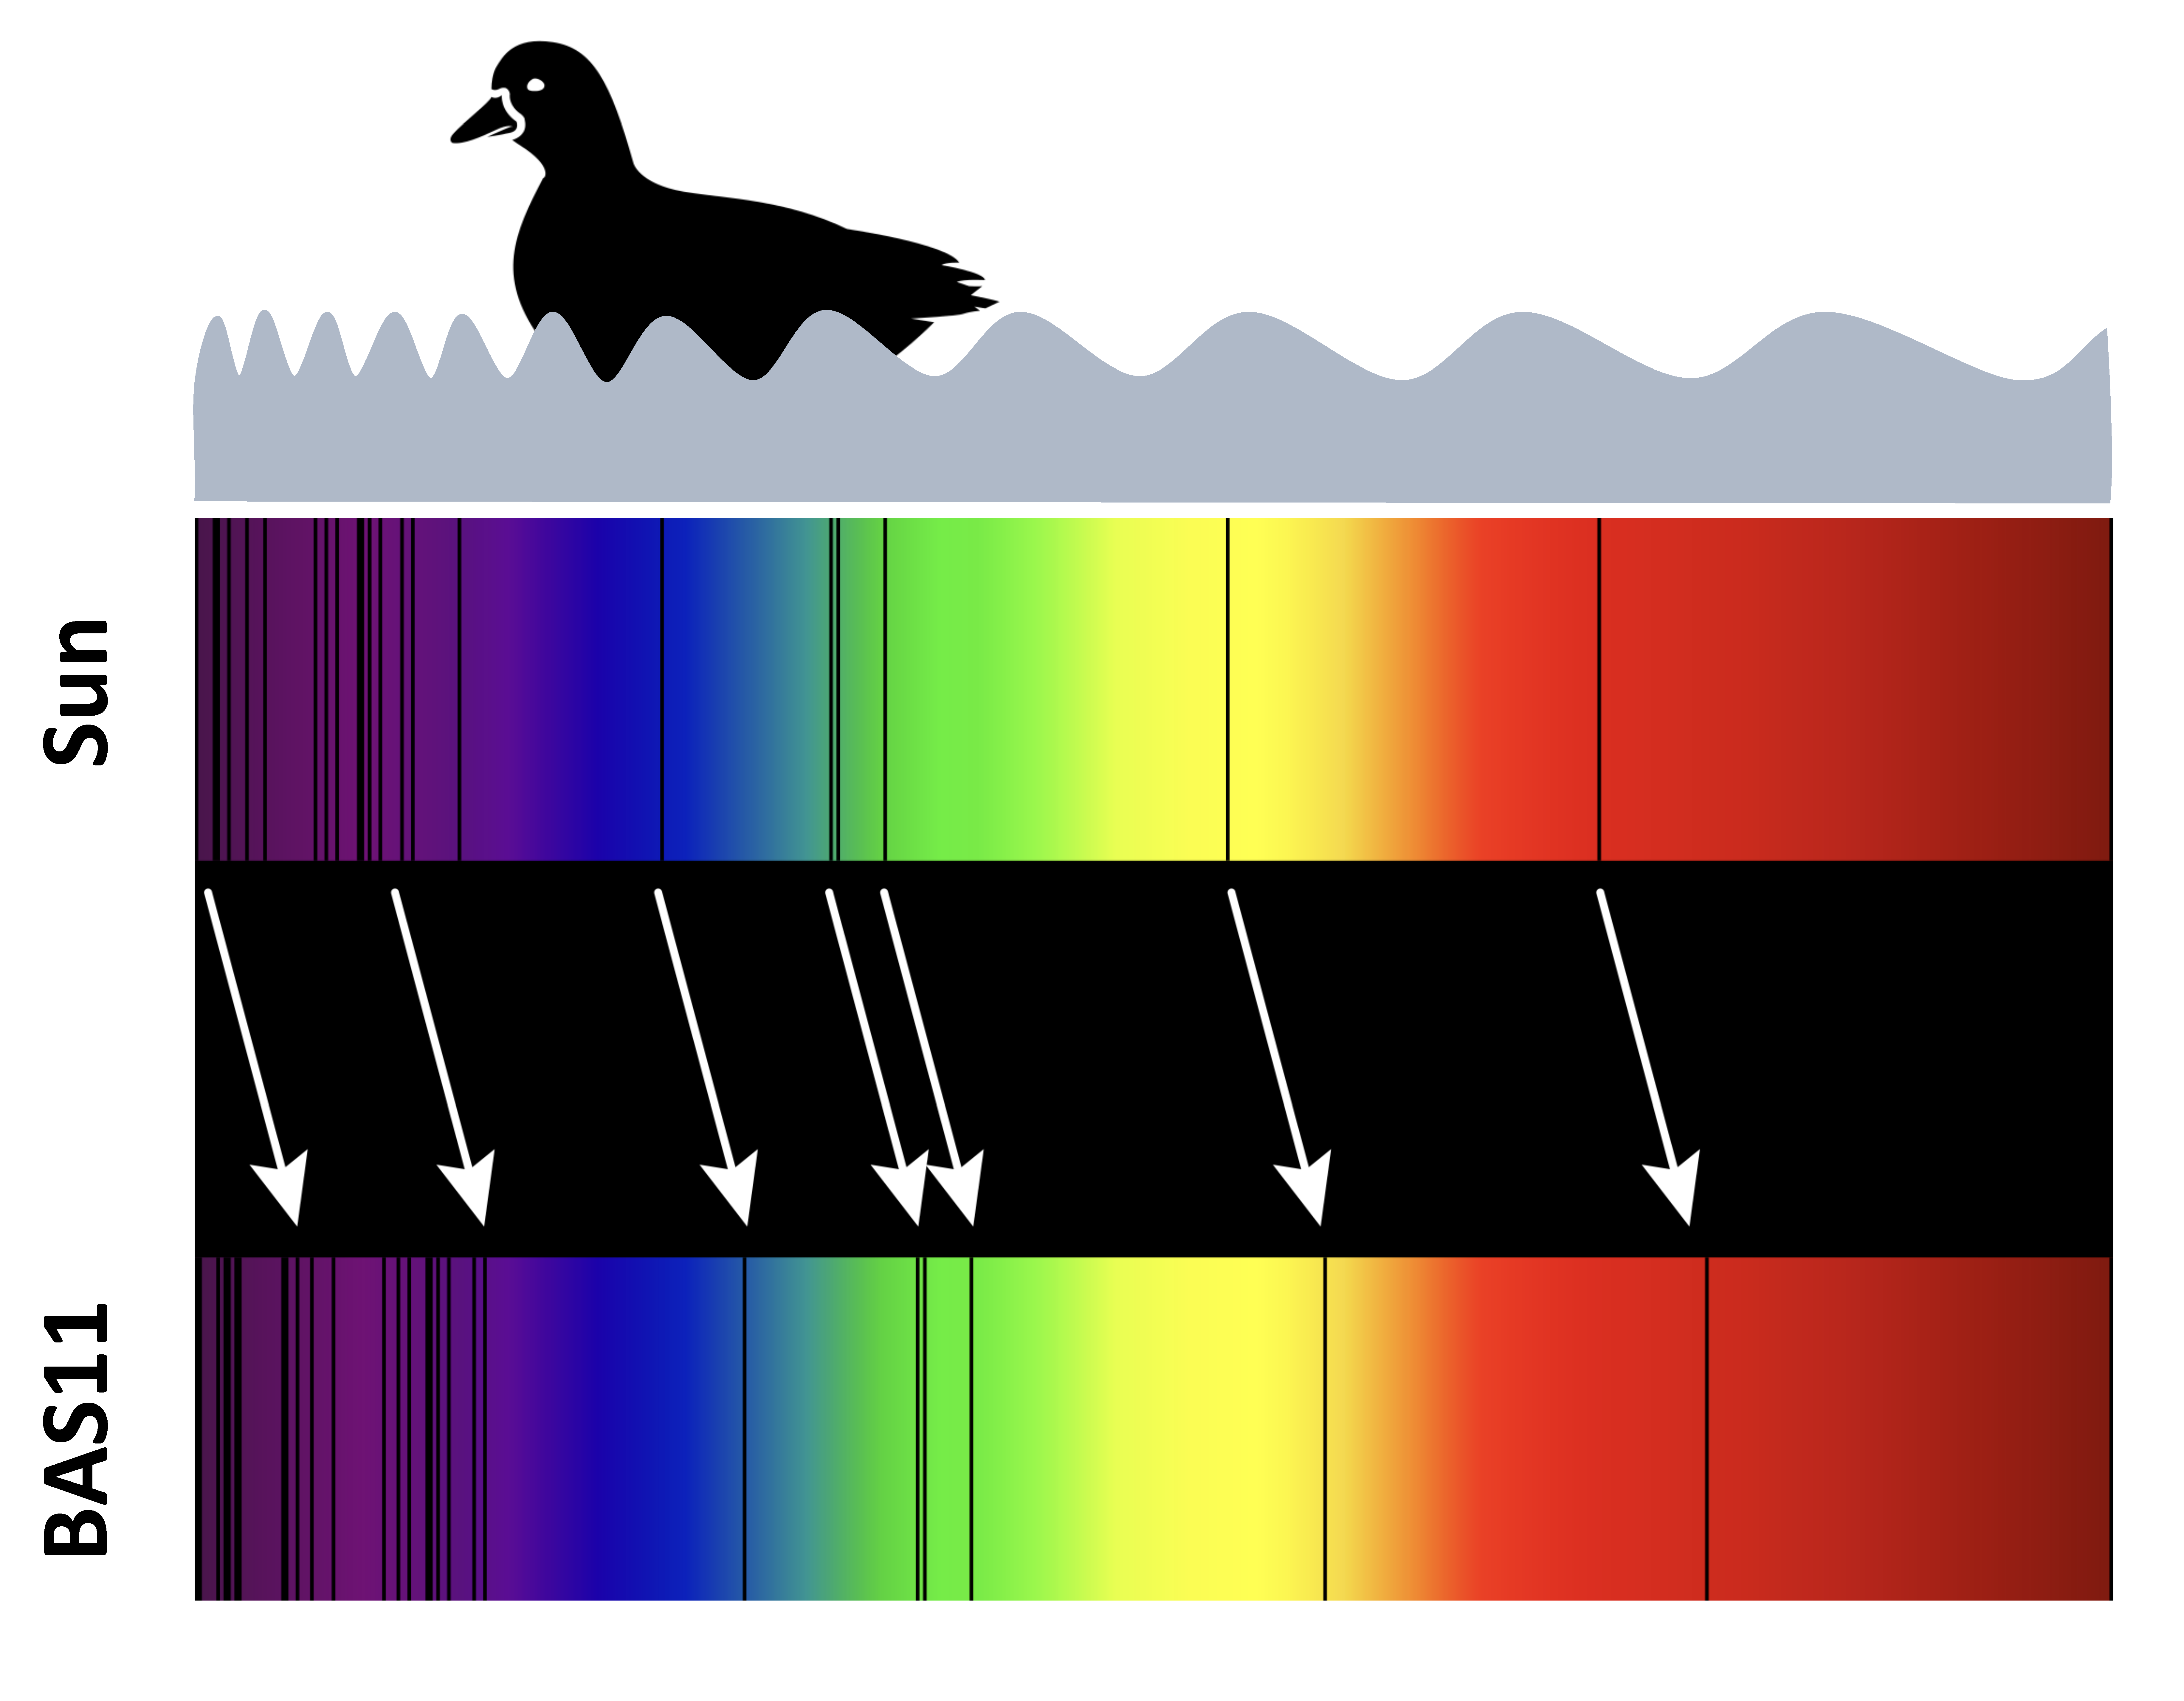
Before we get to the Doppler effect as it pertains to the red shift, let’s see how it works on something more tangible. The swimming duckling is generating waves as it moves through the water. It is generating waves that move forward as well as back, but notice that the ripples ahead of the duckling are closer to each other than the ripples behind the duckling. The distance from one ripple to the next is called the wavelength. The wavelength is shorter in the direction that the duckling is moving, and longer as the duckling moves away.
When waves are in air as sound waves rather than in water as ripples, the different wavelengths manifest as sounds with different pitches—the short wavelengths have a higher pitch, and the long wavelengths have a lower pitch. This is why the pitch of a car’s engine changes as the car races past you.

Take this quiz to check your comprehension of this section.
If you are using an offline version of this text, access the quiz for section 17.1 via the QR code.
17.2 Overview of Our Planetary System[1]
The solar system consists of the Sun and many smaller objects: the planets, their moons and rings, and such “debris” as asteroids, comets, and dust. Decades of observation and spacecraft exploration have revealed that most of these objects formed together with the Sun about 4.5 billion years ago. They represent clumps of material that condensed from an enormous cloud of gas and dust. The central part of this cloud became the Sun, and a small fraction of the material in the outer parts eventually formed the other objects.
During the past 50 years, we have learned more about the solar system than anyone imagined before the space age. In addition to gathering information with powerful new telescopes, we have sent spacecraft directly to many members of the planetary system. (Planetary astronomy is the only branch of our science in which we can, at least vicariously, travel to the objects we want to study.) With evocative names such as Voyager, Pioneer, Curiosity, and Pathfinder, our robot explorers have flown past, orbited, or landed on every planet, returning images and data that have dazzled both astronomers and the public. In the process, we have also investigated two dwarf planets, hundreds of fascinating moons, four ring systems, a dozen asteroids, and several comets (smaller members of our solar system that we will discuss later).
Our probes have penetrated the atmosphere of Jupiter and landed on the surfaces of Venus, Mars, our Moon, Saturn’s moon Titan, the asteroids Eros, Itokawa, Ryugu, and Bennu, and the Comet Churyumov-Gerasimenko (usually referred to as 67P). Humans have set foot on the Moon and returned samples of its surface soil for laboratory analysis. We have flown a helicopter drone on Mars. We have even discovered other places in our solar system that might be able to support some kind of life.
17.2.1 An Inventory
The Sun, a star that is brighter than about 80% of the stars in the Galaxy, is by far the most massive member of the solar system. It is an enormous ball about 1.4 million kilometers in diameter, with surface layers of incandescent gas and an interior temperature of millions of degrees. The Sun will be discussed in later chapters as our first, and best-studied, example of a star.
| Object | Percentage of total mass of solar system |
|---|---|
| Sun | 99.8% |
| Jupiter | 0.1% |
| Comets | 0.0005-0.03% (estimate) |
| All other planets and dwarf planets | 0.04% |
| Moons and rings | 0.00005% |
| Asteroids | 0.000002% (estimate) |
| Cosmic dust | 0.0000001% (estimate) |
Table 17.1: Mass of members of the solar system. Note that the Sun is by far the most massive member of the solar system.
Most of the material of the planets in the solar system is actually concentrated in the largest one, Jupiter, which is more massive than all the rest of the planets combined. Astronomers were able to determine the masses of the planets centuries ago using Kepler’s laws of planetary motion and Newton’s law of gravity to measure the planets’ gravitational effects on one another or on moons that orbit them. Today, we make even more precise measurements of their masses by tracking their gravitational effects on the motion of spacecraft that pass near them.
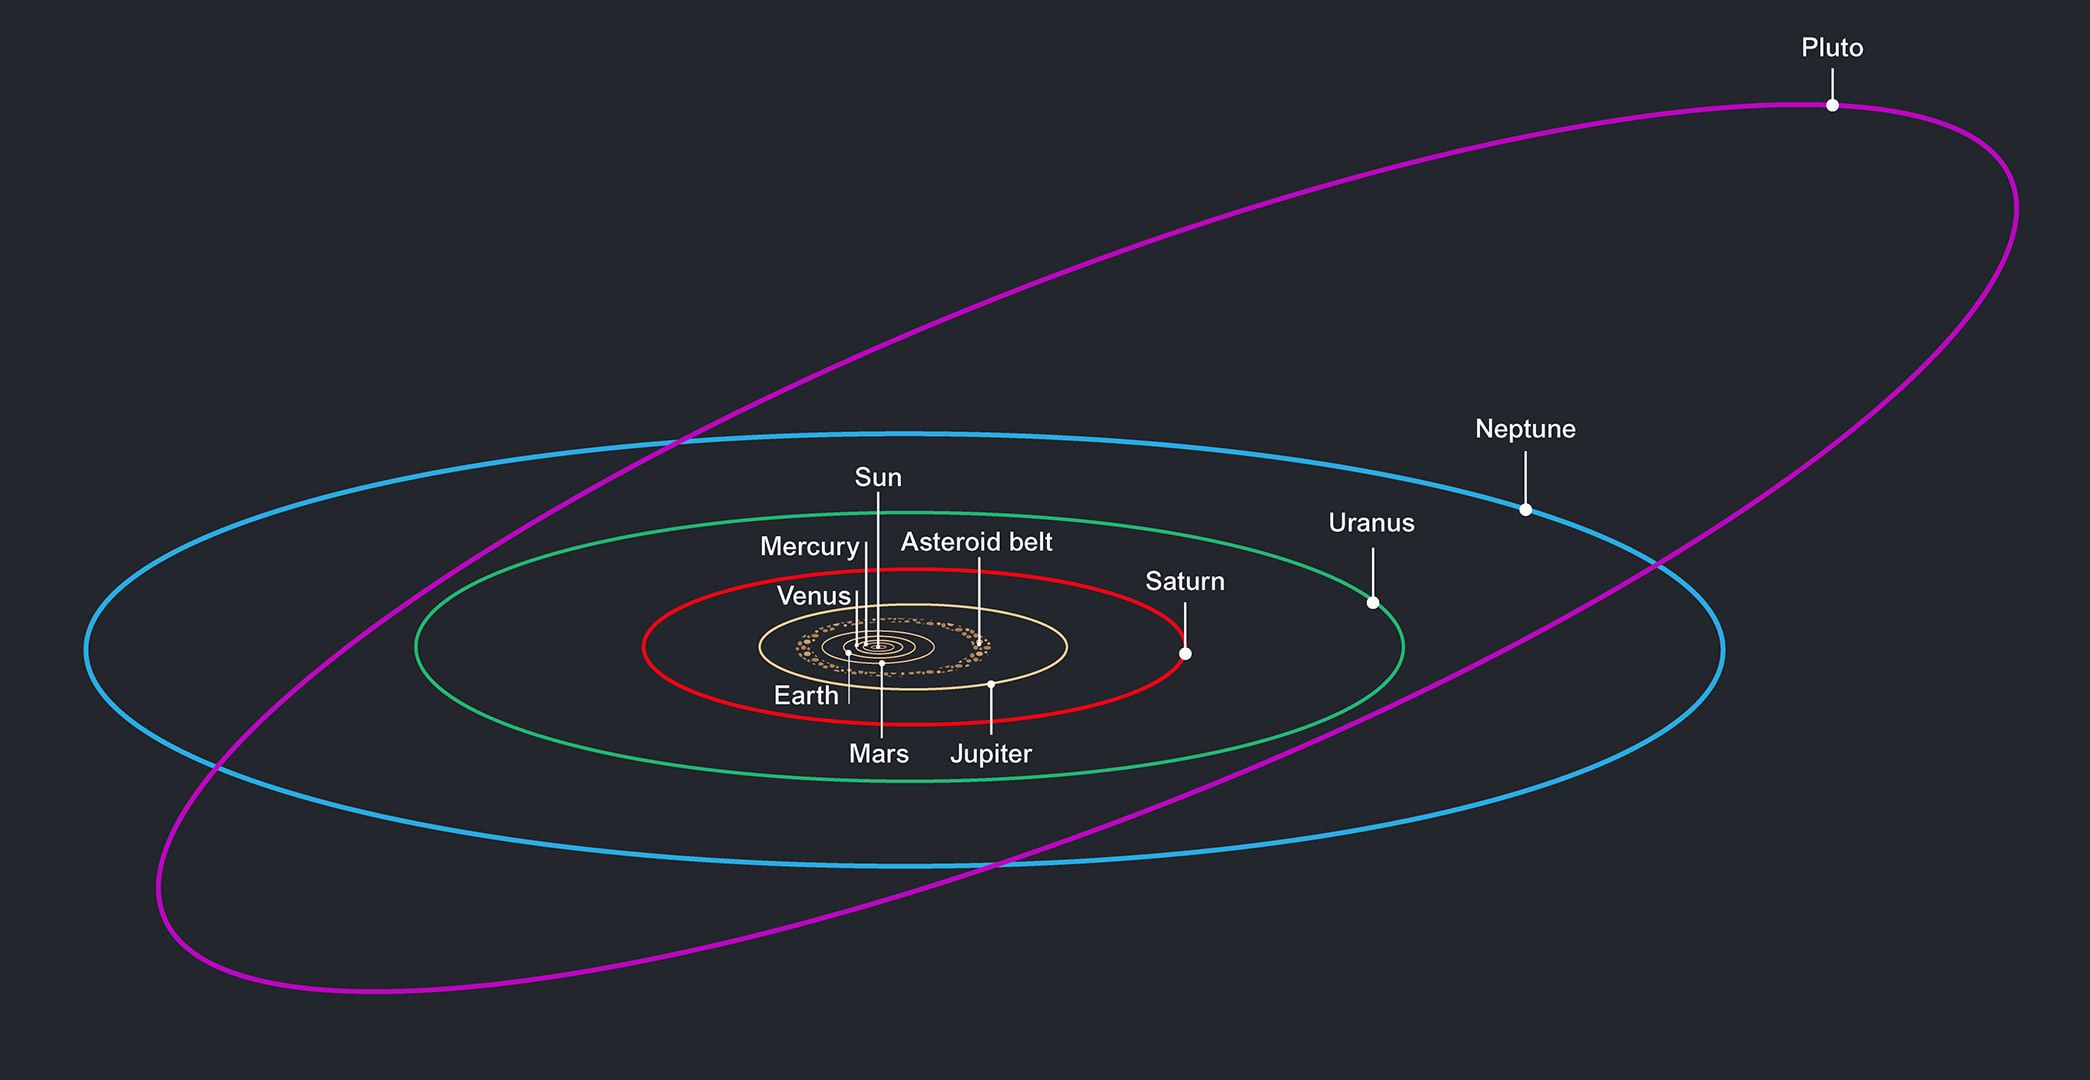
Beside Earth, five other planets were known to the ancients—Mercury, Venus, Mars, Jupiter, and Saturn—and two were discovered after the invention of the telescope: Uranus and Neptune. The eight planets all revolve in the same direction around the Sun. They orbit in approximately the same plane, like cars traveling on concentric tracks on a giant, flat racecourse. Each planet stays in its own “traffic lane,” following a nearly circular orbit about the Sun and obeying the “traffic” laws discovered by Galileo, Kepler, and Newton. Besides these planets, we have also been discovering smaller worlds beyond Neptune that are called trans-Neptunian objects or TNOs. The first to be found, in 1930, was Pluto, but others have been discovered during the twenty-first century. One of them, Eris, is about the same size as Pluto and has at least one moon (Pluto has five known moons). The largest TNOs are also classed as dwarf planets, as is the largest asteroid, Ceres. To date, more than 2600 of these TNOs have been discovered, and one, called Arrokoth, was explored by the New Horizons spacecraft.
Each of the planets and dwarf planets also rotates (spins) about an axis running through it, and in most cases the direction of rotation is the same as the direction of revolution about the Sun. The exceptions are Venus, which rotates backward very slowly (that is, in a retrograde direction), and Uranus and Pluto, which also have strange rotations, each spinning about an axis tipped nearly on its side. We do not yet know the spin orientations of Eris, Haumea, and Makemake.
The four planets closest to the Sun (Mercury through Mars) are called the inner or terrestrial planets. Often, the Moon is also discussed as a part of this group, bringing the total of terrestrial objects to five (we generally call Earth’s satellite “the Moon,” with a capital M, and the other satellites “moons,” with lowercase m’s). The terrestrial planets are relatively small worlds, composed primarily of rock and metal. All of them have solid surfaces that bear the records of their geological history in the forms of craters, mountains, and volcanoes.
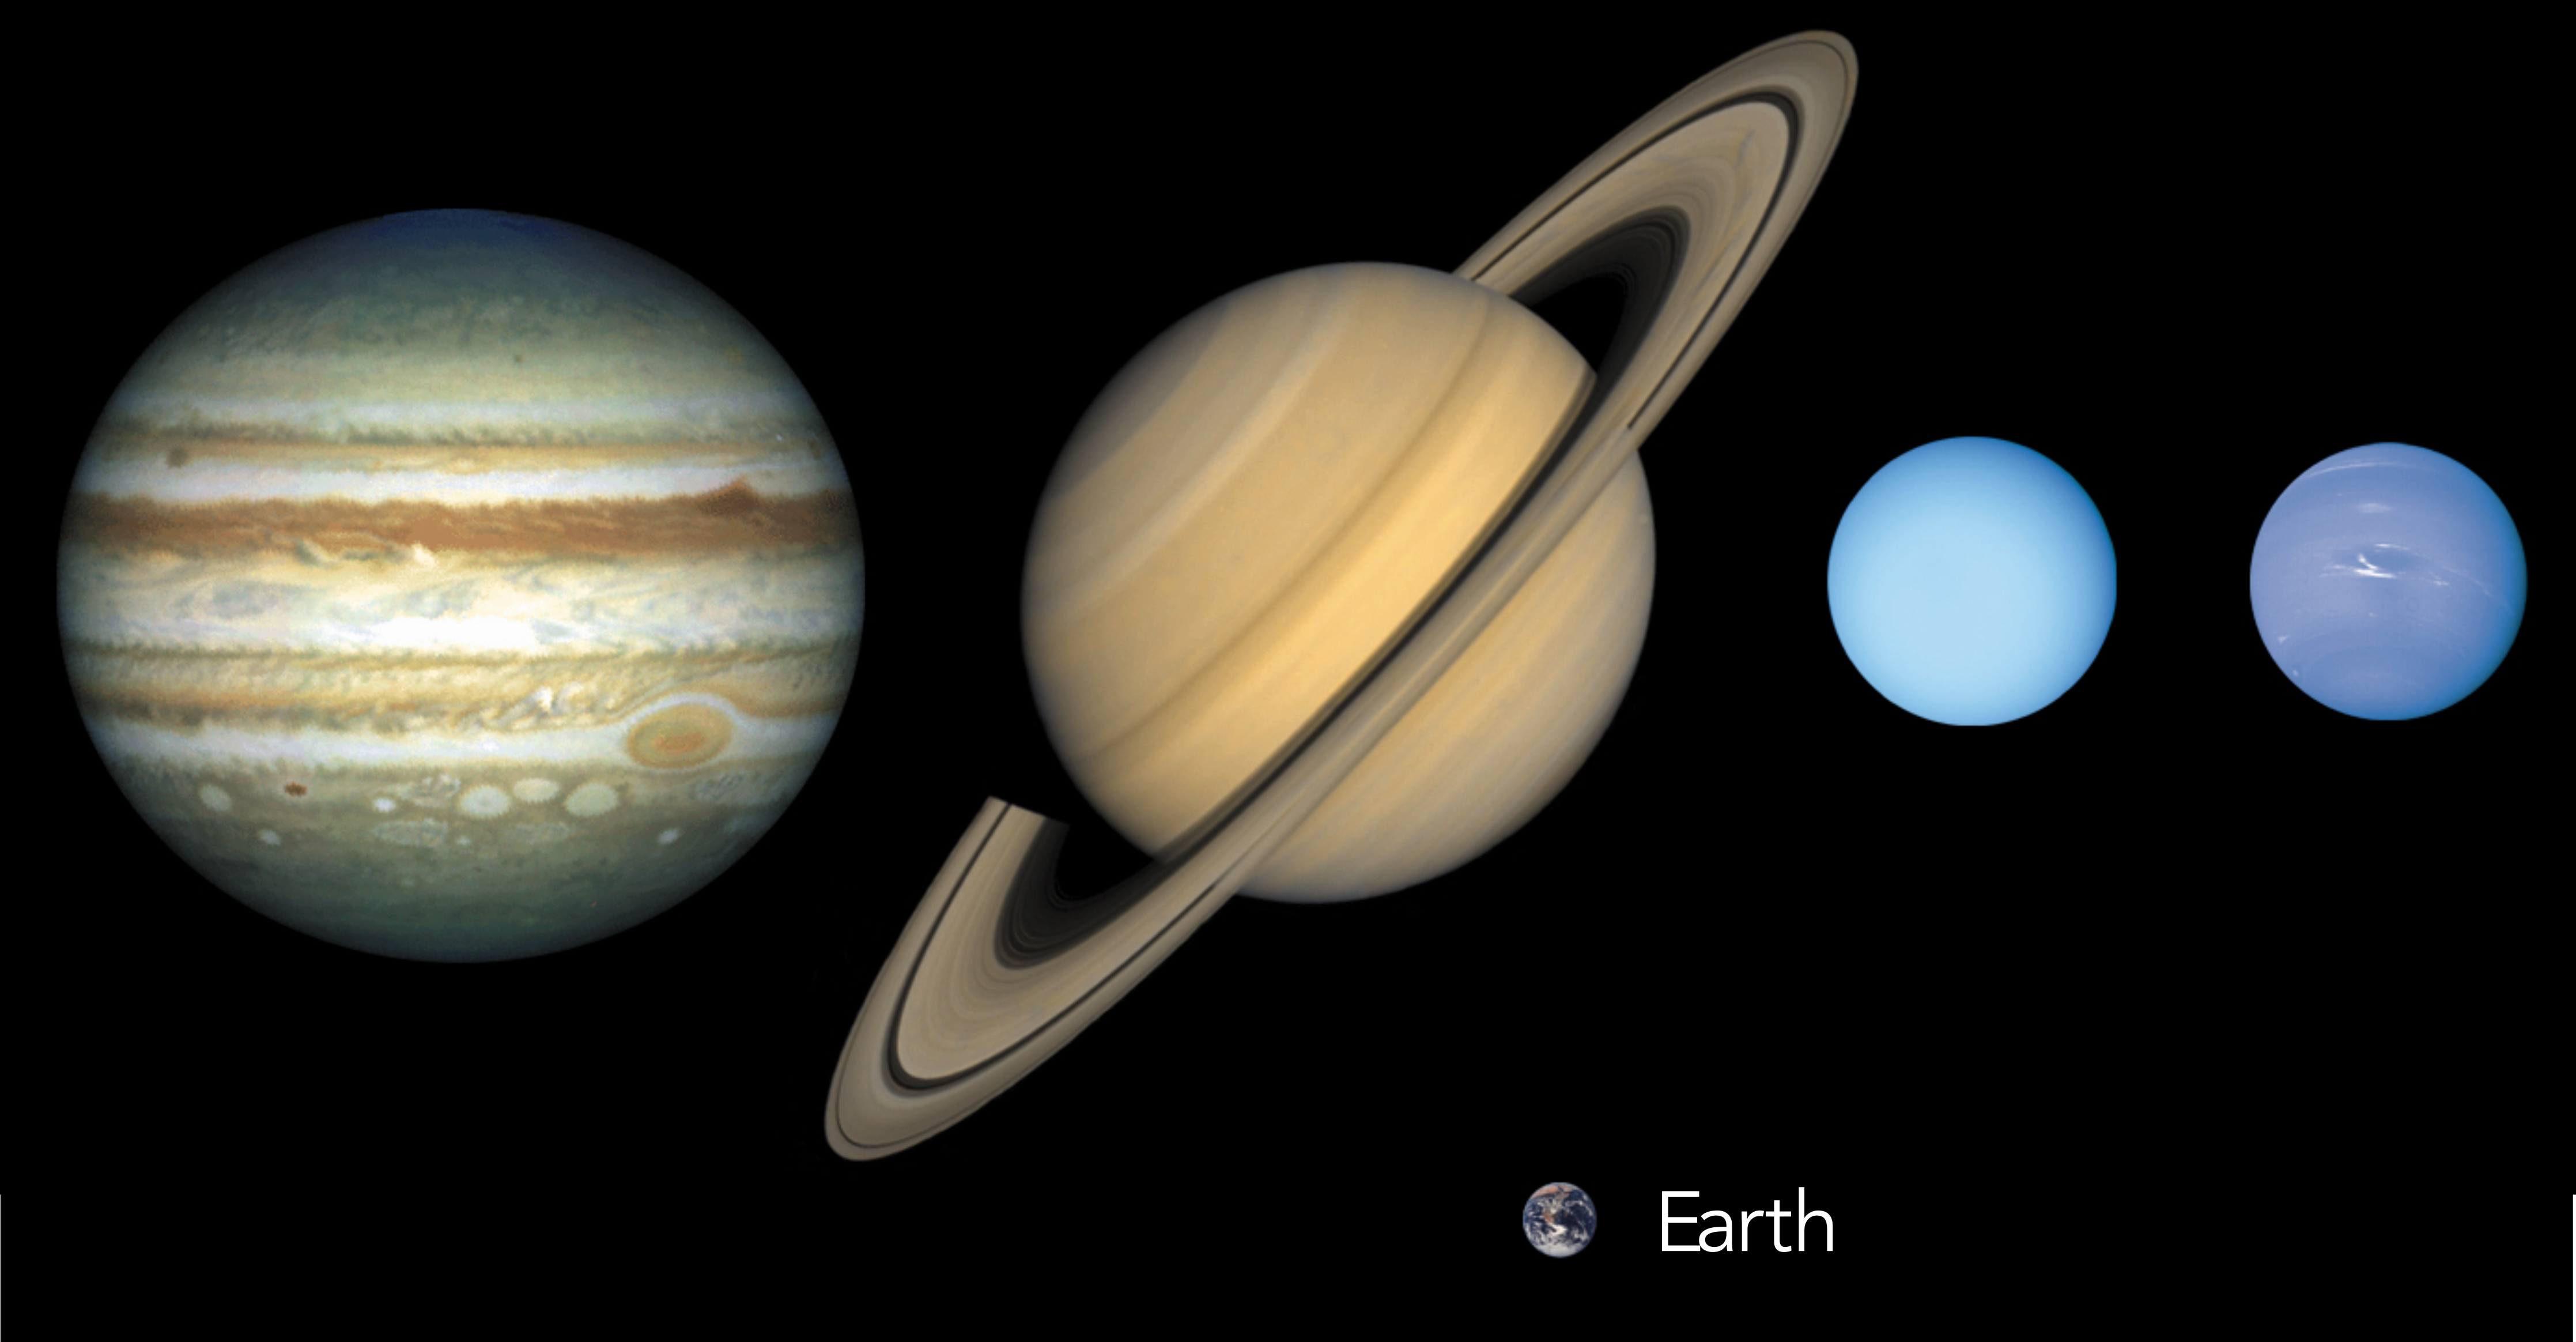
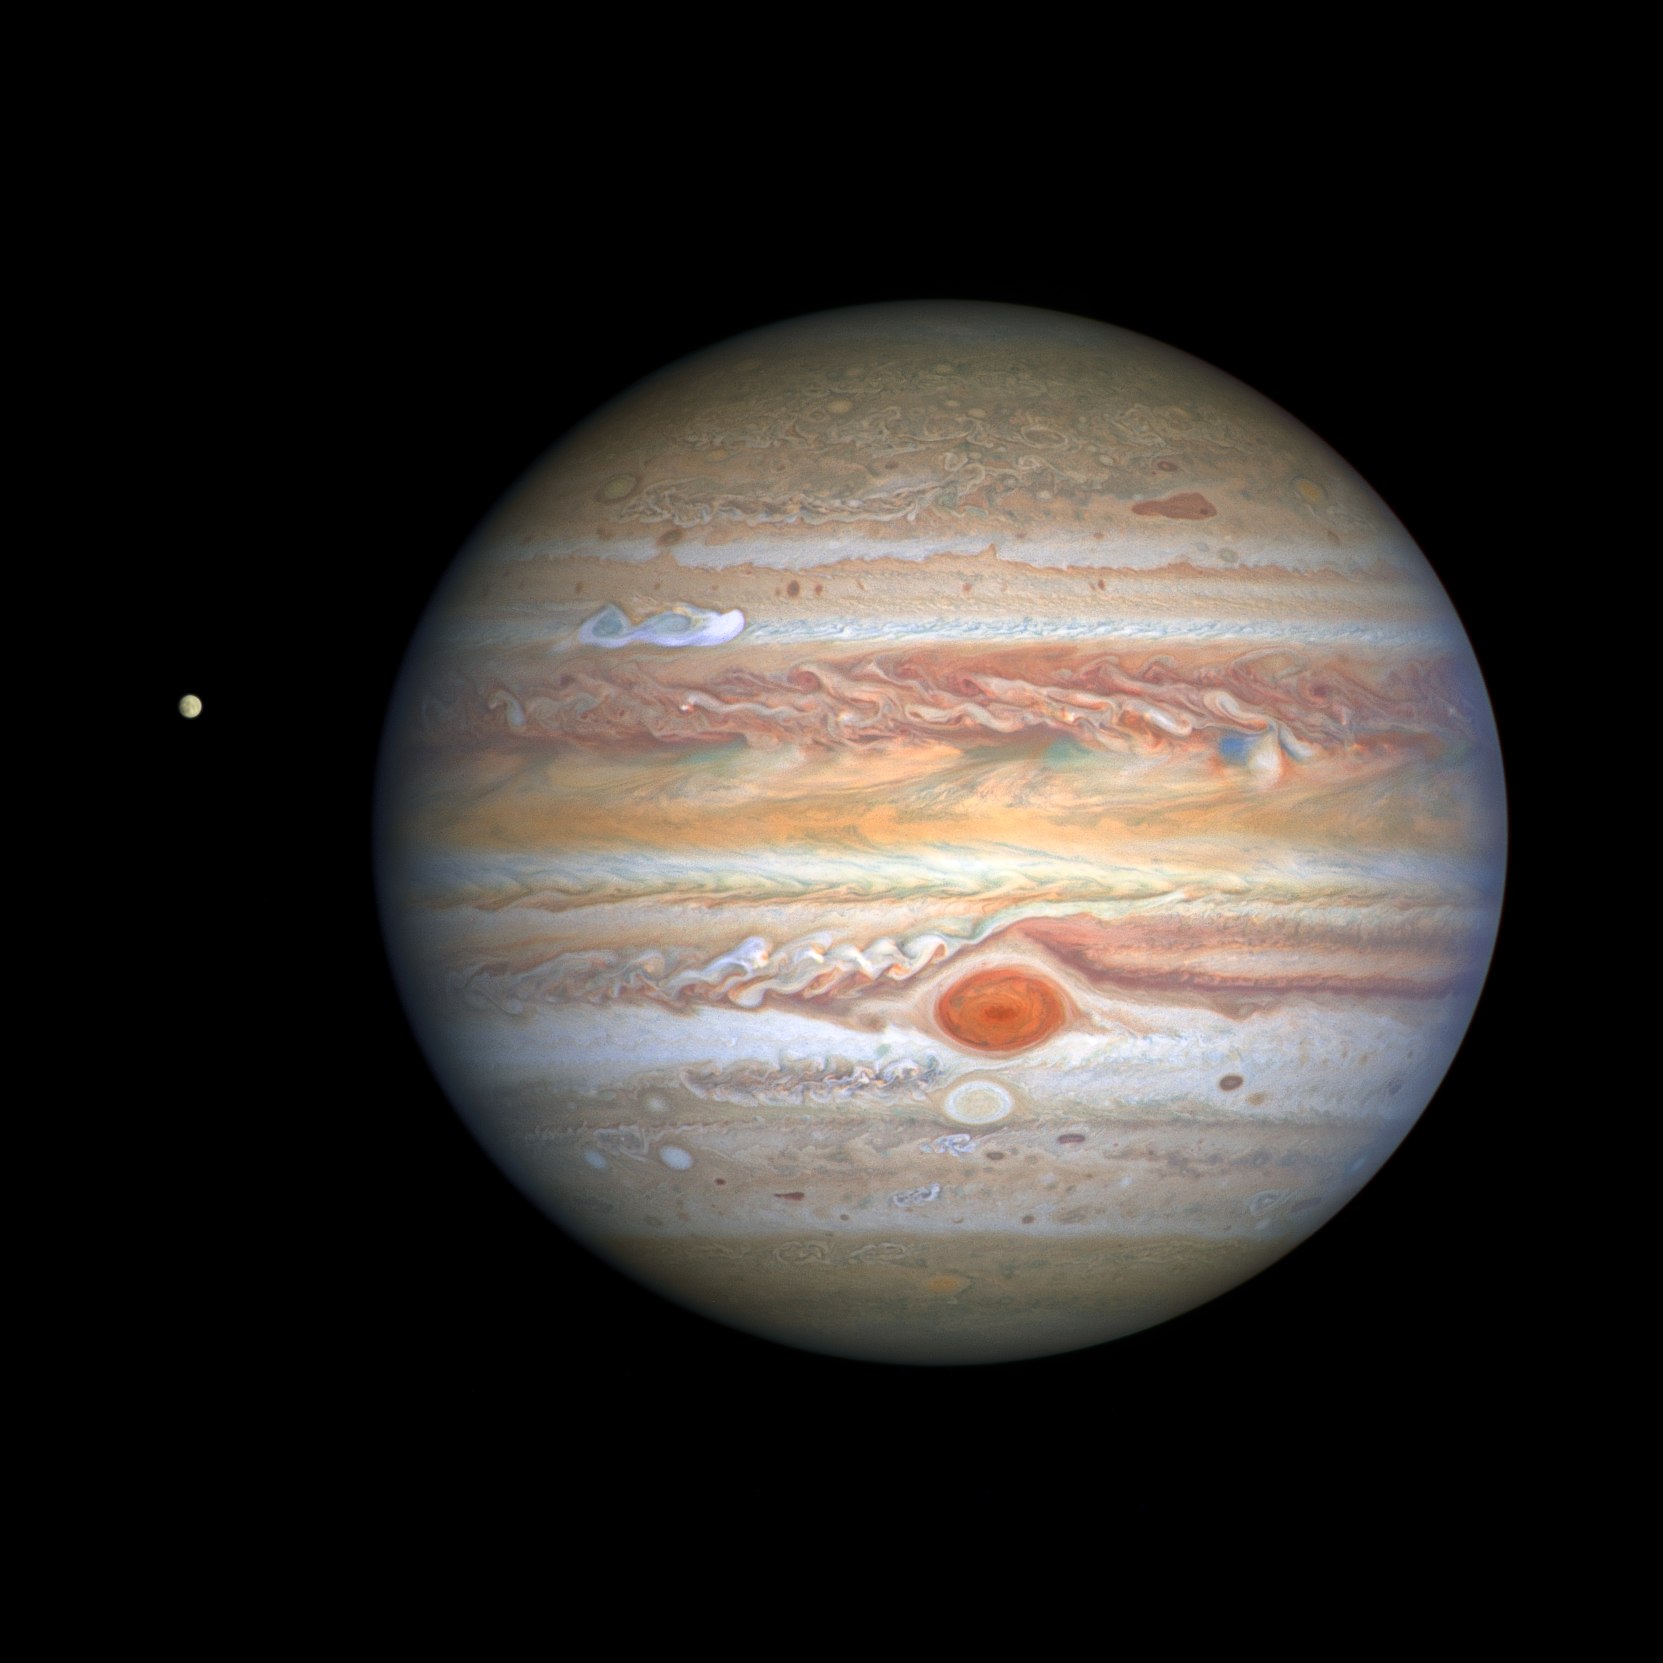
The next four planets (Jupiter through Neptune) are much larger and are composed primarily of lighter ices, liquids, and gases. We call these four the Jovian planets (after “Jove,” another name for Jupiter in mythology) or giant planets—a name they richly deserve. About 1,300 Earths could fit inside Jupiter, for example. These planets do not have solid surfaces on which future explorers might land. They are more like vast, spherical oceans with much smaller, dense cores.
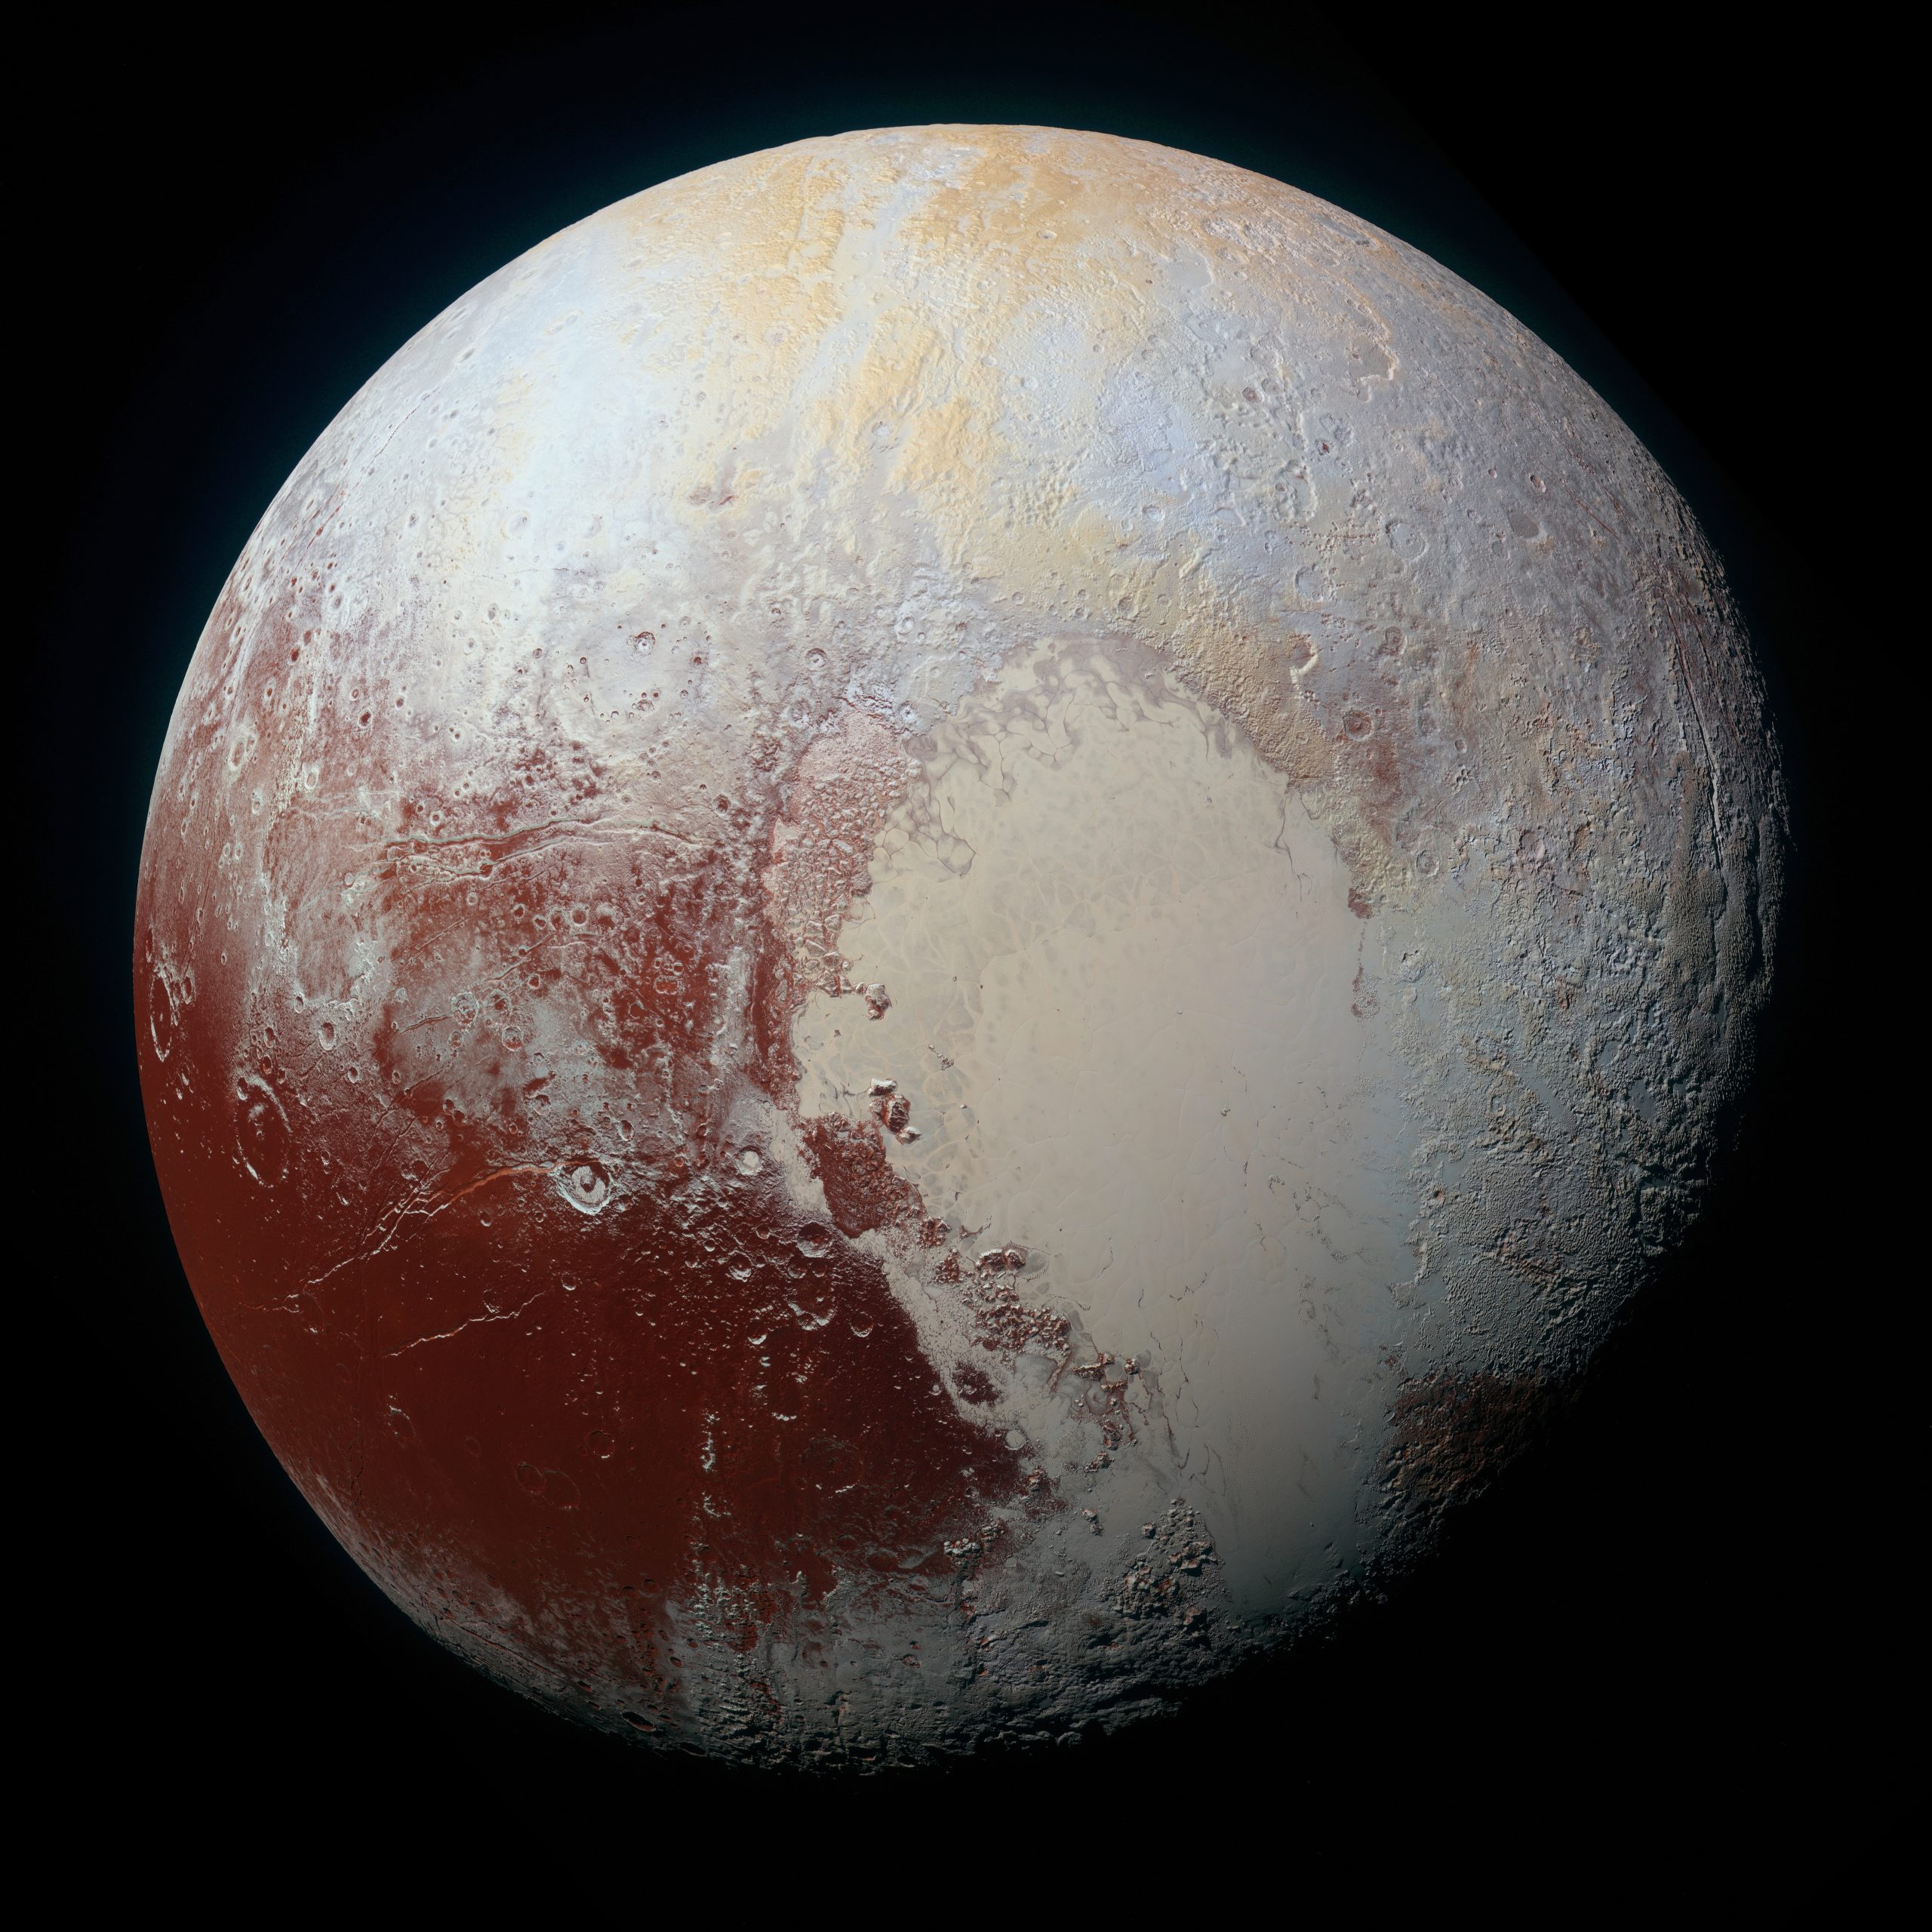
Near the outer edge of the system lies Pluto, which was the first of the distant icy worlds to be discovered beyond Neptune (Pluto was visited by a spacecraft, the NASA New Horizons mission, in 2015).
| Name | Distance from Sun (AU) | Revolution period (y) | Diameter (km) | Mass (1023 kg) | Density (g/cm3) |
|---|---|---|---|---|---|
| Mercury | 0.39 | 0.24 | 4,878 | 3.3 | 5.4 |
| Venus | 0.72 | 0.62 | 12,120 | 48.7 | 5.2 |
| Earth | 1.00 | 1.00 | 12,756 | 59.8 | 5.5 |
| Mars | 1.52 | 1.88 | 6,787 | 6.4 | 3.9 |
| Jupiter | 5.20 | 11.86 | 142,984 | 18,991 | 1.3 |
| Saturn | 9.54 | 29.46 | 120,536 | 5,686 | 0.7 |
| Uranus | 19.18 | 84.07 | 51,118 | 866 | 1.3 |
| Neptune | 30.06 | 164.82 | 49,660 | 1,030 | 1.6 |
Table 17.2: The planets.
The outermost part of the solar system is known as the Kuiper belt, which is a scattering of rocky and icy bodies. Beyond that is the Oort cloud, a zone filled with small and dispersed ice traces. These two locations are where most comets form and continue to orbit, and objects found here have relatively irregular orbits compared to the rest of the solar system. Pluto, formerly the ninth planet, is located in this region of space. The XXVIth General Assembly of the International Astronomical Union (IAU) stripped Pluto of planetary status in 2006 because scientists discovered an object more massive than Pluto, which they named Eris. The IAU decided against including Eris as a planet, and therefore, excluded Pluto as well.
The IAU narrowed the definition of a planet to three criteria: 1) it must orbit a star (in our cosmic neighborhood, the Sun), 2) it must be big enough to have enough gravity to force it into a spherical shape, and 3) it must be big enough that its gravity cleared away any other objects of a similar size near its orbit around the Sun. Pluto passed the first two parts of the definition, but not the third. Pluto and Eris are currently classified as dwarf planets.
17.2.2 Smaller Members of the Solar System
Most of the planets are accompanied by one or more moons; only Mercury and Venus move through space alone. There are more than 210 known moons orbiting planets and dwarf planets, and undoubtedly many other small ones remain undiscovered. The largest of the moons are as big as small planets and just as interesting. In addition to our Moon, they include the four largest moons of Jupiter (called the Galilean moons, after their discoverer) and the largest moons of Saturn and Neptune (confusingly named Titan and Triton).
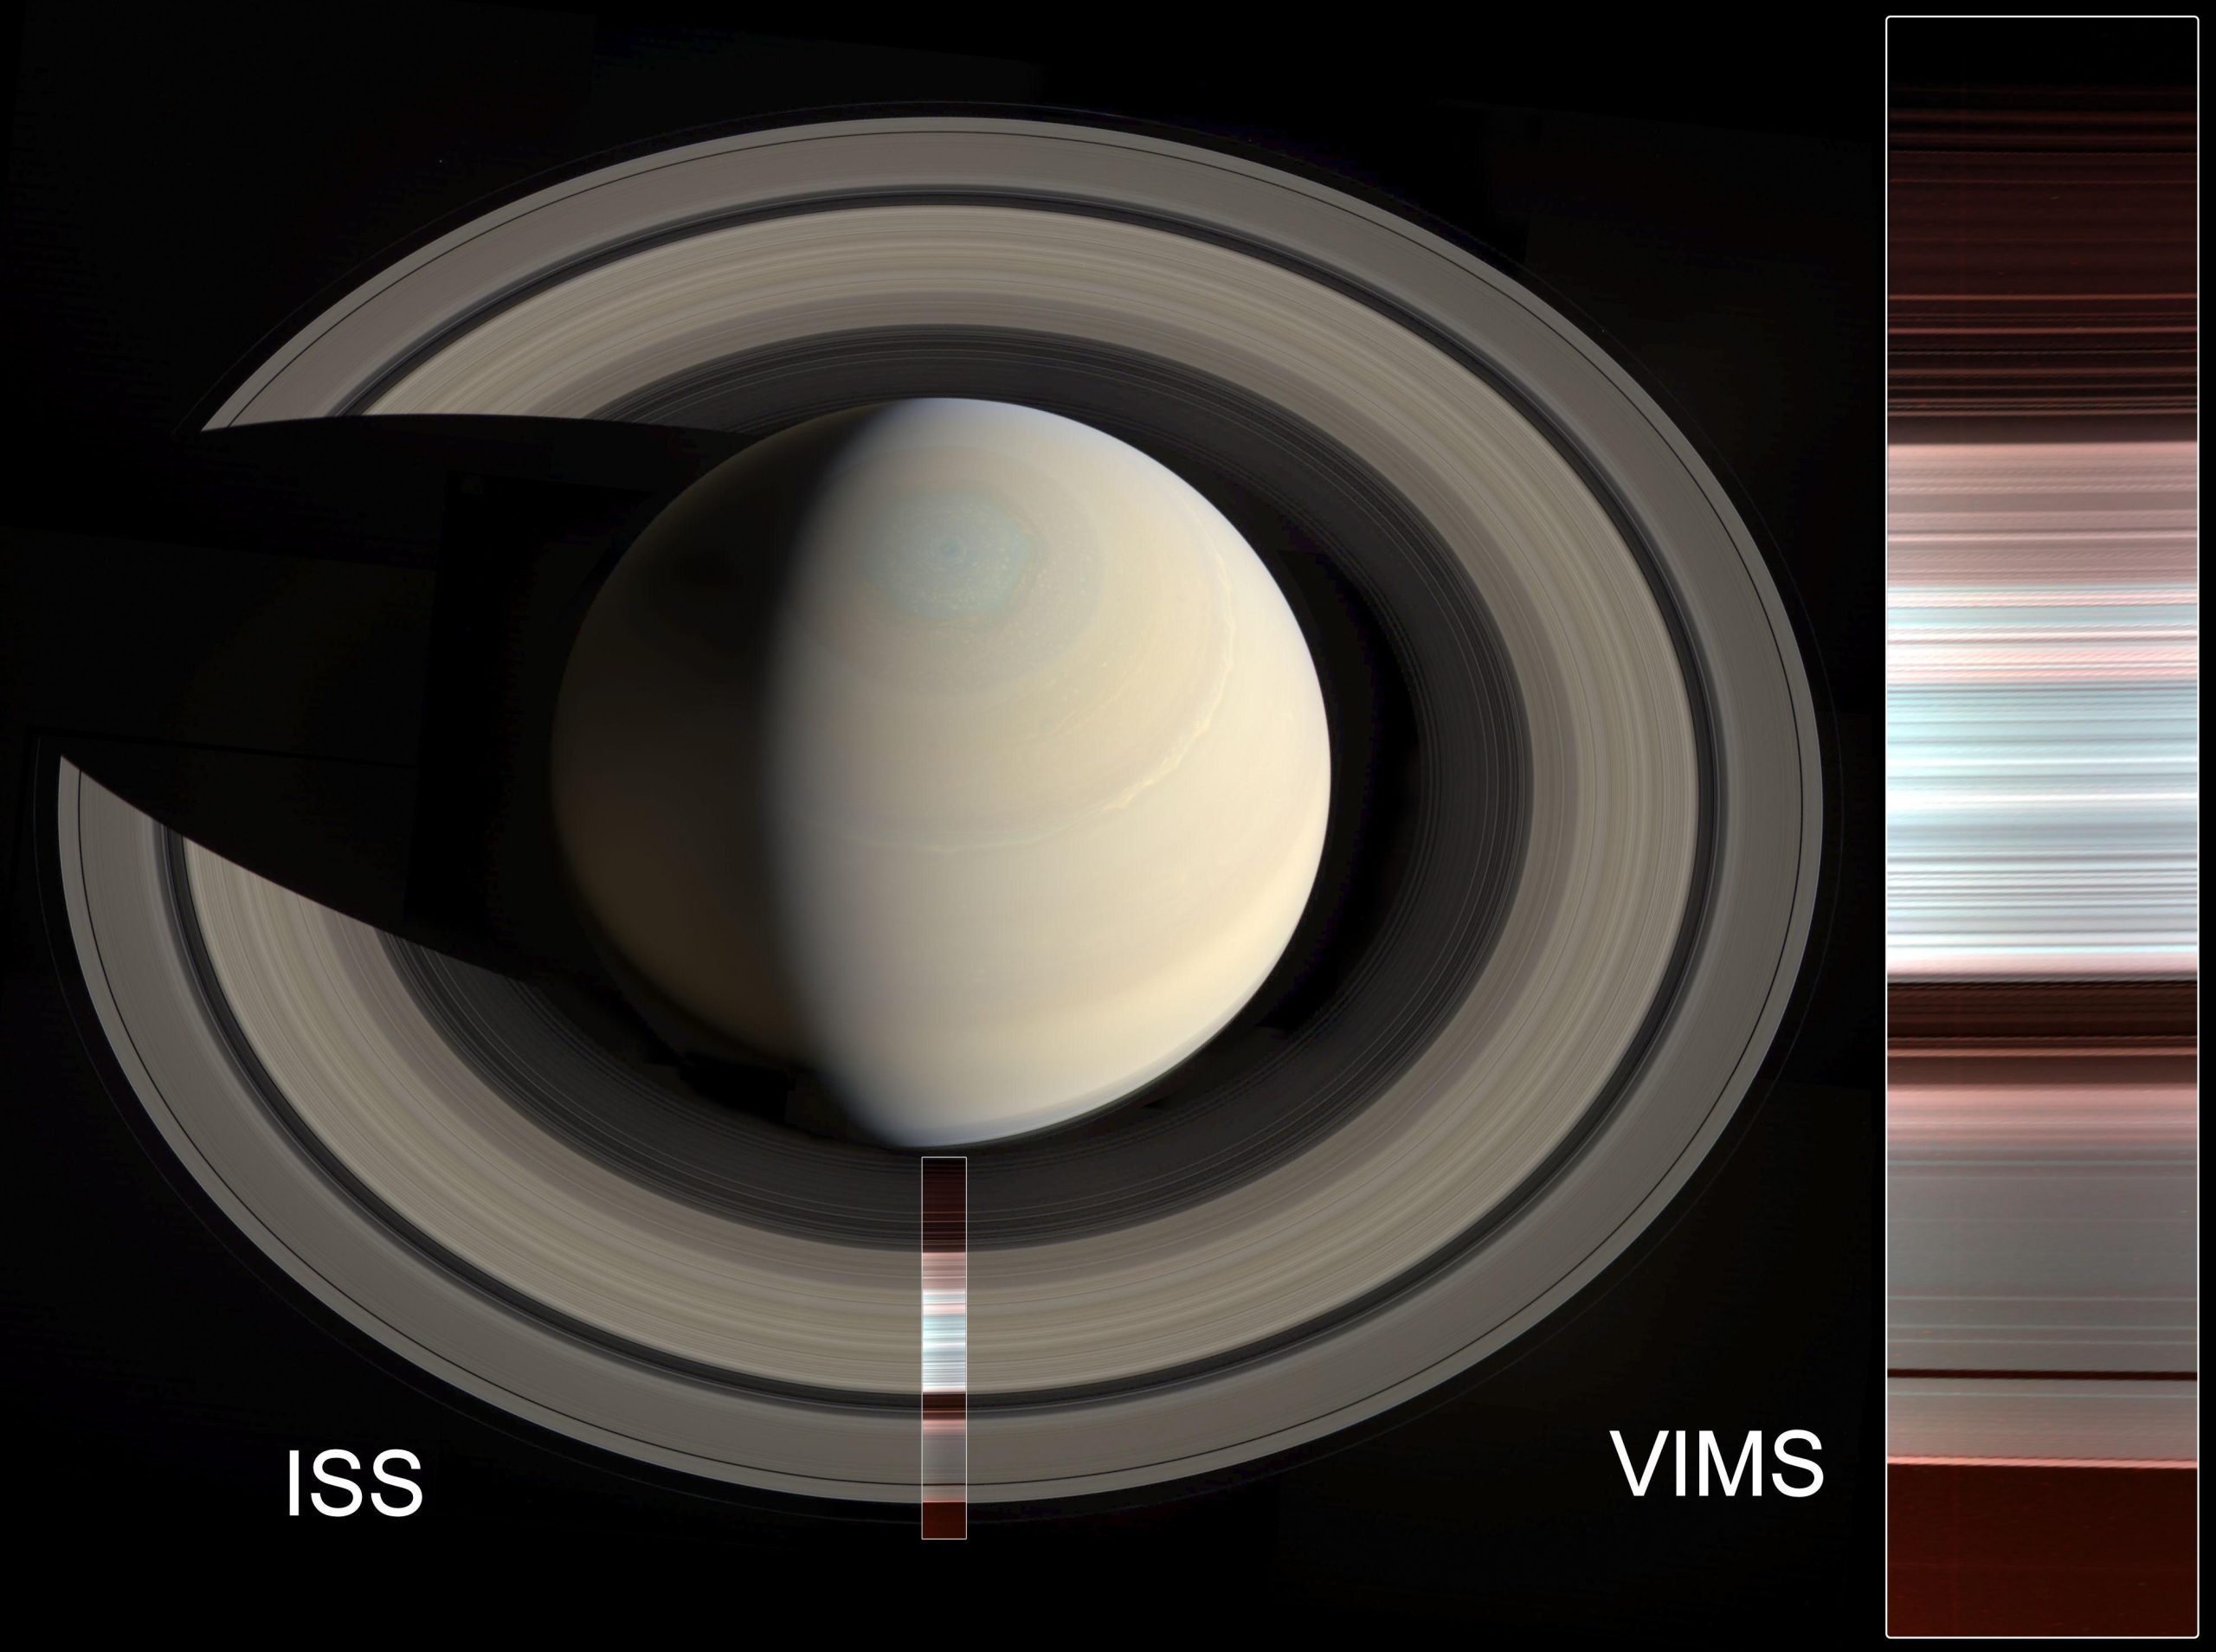
Each of the giant planets also has rings made up of countless small bodies ranging in size from mountains to mere grains of dust, all in orbit about the equator of the planet. The bright rings of Saturn are, by far, the easiest to see. They are among the most beautiful sights in the solar system. But, all four ring systems are interesting to scientists because of their complicated forms, influenced by the pull of the moons that also orbit these giant planets.
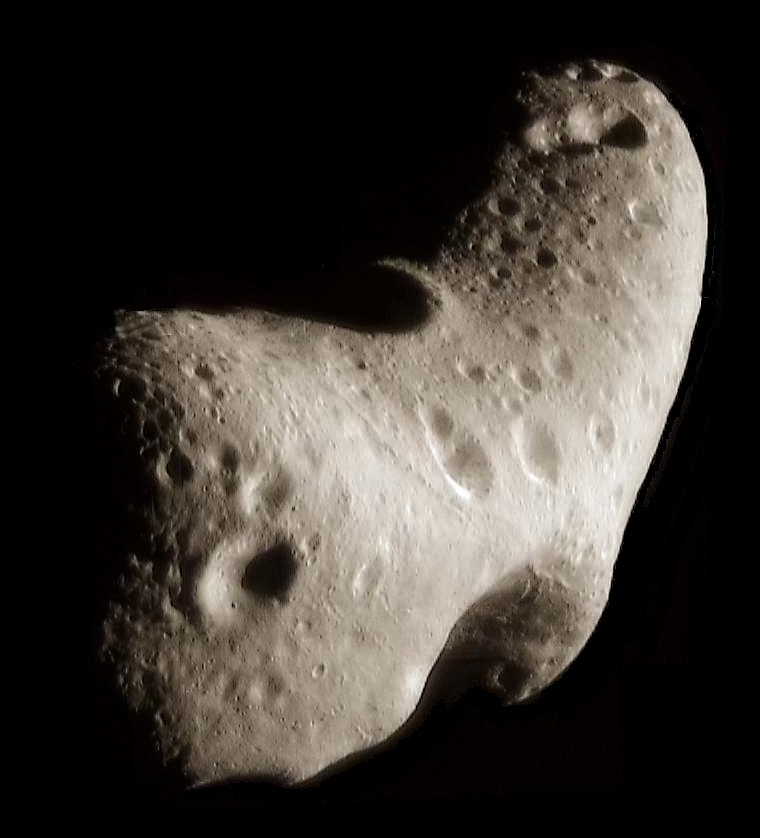
The solar system has many other less-conspicuous members. Another group is the asteroids, rocky bodies that orbit the Sun like miniature planets, mostly in the space between Mars and Jupiter (although some do cross the orbits of planets like Earth). Most asteroids are remnants of the initial population of the solar system that existed before the planets themselves formed. Some of the smallest moons of the planets, such as the moons of Mars, are very likely captured asteroids.
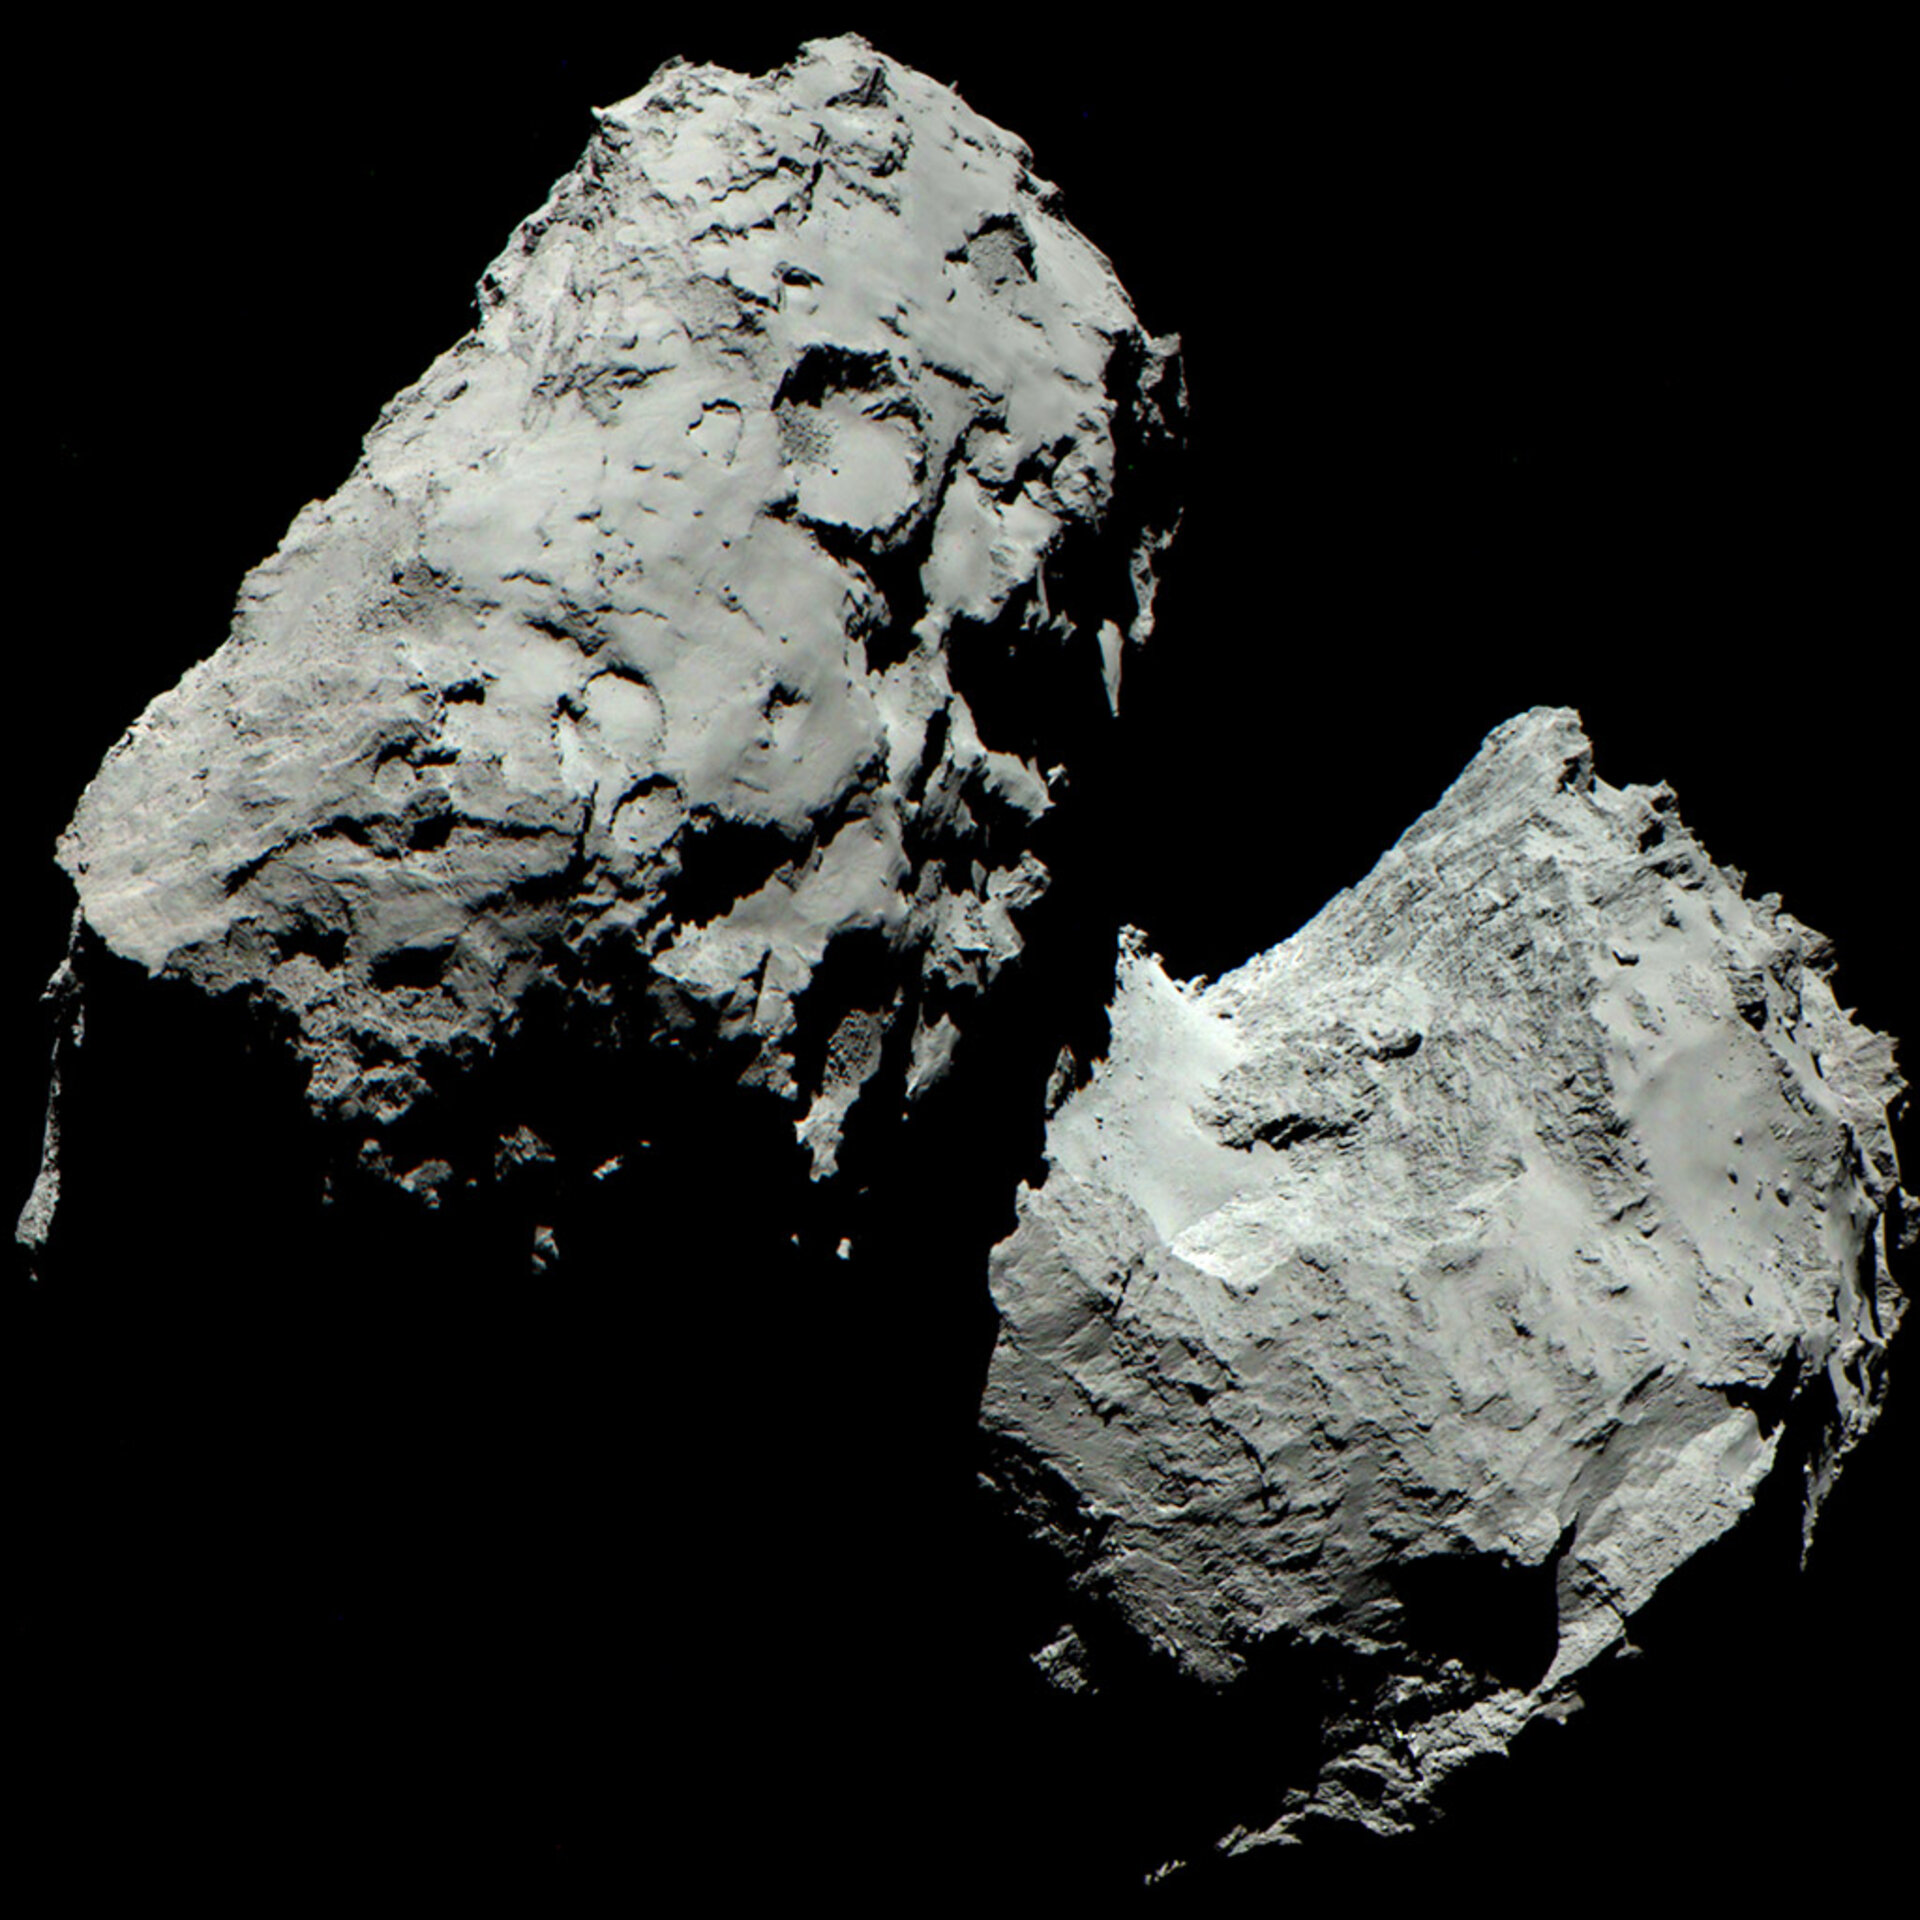
Another class of small bodies is composed mostly of ice, made of frozen gases such as water, carbon dioxide, and carbon monoxide; these objects are called comets. Comets also are remnants from the formation of the solar system, but they were formed and continue (with rare exceptions) to orbit the Sun in distant, cooler regions—stored in a sort of cosmic deep freeze. This is also the realm of the larger icy worlds, called dwarf planets.
Finally, there are countless grains of broken rock, which we call cosmic dust, scattered throughout the solar system. When these particles enter Earth’s atmosphere (as millions do each day), they burn up, producing a brief flash of light in the night sky known as a meteor (meteors are often referred to as shooting stars). Occasionally, some larger chunk of rocky or metallic material survives its passage through the atmosphere and lands on Earth. Any piece that strikes the ground is known as a meteorite. You can see meteorites on display in many natural history museums and can sometimes even purchase pieces of them from gem and mineral dealers.
17.2.3 A Scale Model of the Solar System
Astronomy often deals with dimensions and distances that far exceed our ordinary experience. What does 1.4 billion kilometers—the distance from the Sun to Saturn—really mean to anyone? It can be helpful to visualize such large systems in terms of a scale model.
In our imaginations, let us build a scale model of the solar system, adopting a scale factor of 1 billion (109)—that is, reducing the actual solar system by dividing every dimension by a factor of 109. Earth, then, has a diameter of 1.3 centimeters, about the size of a grape. The Moon is a pea orbiting this at a distance of 40 centimeters, or a little more than a foot away. The Earth-Moon system fits into a standard backpack.
In this model, the Sun is nearly 1.5 meters in diameter, about the average height of an adult, and our Earth is at a distance of 150 meters—about one city block—from the Sun. Jupiter is five blocks away from the Sun, and its diameter is 15 centimeters, about the size of a very large grapefruit. Saturn is 10 blocks from the Sun; Uranus, 20 blocks; and Neptune, 30 blocks. Pluto, with a distance that varies quite a bit during its 249-year orbit, is currently just beyond 30 blocks and getting farther with time. Most of the moons of the outer solar system are the sizes of various kinds of seeds orbiting the grapefruit, oranges, and lemons that represent the outer planets.
In our scale model, a human is reduced to the dimensions of a single atom, and cars and spacecraft to the size of molecules. Sending the Voyager spacecraft to Neptune involves navigating a single molecule from the Earth–grape toward a lemon 5 kilometers away with an accuracy equivalent to the width of a thread in a spider’s web.
If that model represents the solar system, where would the nearest stars be? If we keep the same scale, the closest stars would be tens of thousands of kilometers away. If you built this scale model in the city where you live, you would have to place the representations of these stars on the other side of Earth or beyond.
By the way, model solar systems like the one we just presented have been built in cities throughout the world. In Sweden, for example, Stockholm’s huge Globe Arena has become a model for the Sun, and Pluto is represented by a 12-centimeter sculpture in the small town of Delsbo, 300 kilometers away. Another model solar system is in Washington on the Mall between the White House and Congress (perhaps proving they are worlds apart?).

Take this quiz to check your comprehension of this section.
If you are using an offline version of this text, access the quiz for section 17.2 via the QR code.
17.3 Composition and Structure of Planets[2]
The fact that there are two distinct kinds of planets—the rocky terrestrial planets and the gas-rich Jovian planets—leads us to believe that they formed under different conditions. Certainly their compositions are dominated by different elements. Let us look at each type in more detail.
17.3.1 The Giant Planets
The two largest planets, Jupiter and Saturn, have nearly the same chemical makeup as the Sun; they are composed primarily of the two elements hydrogen and helium, with 75% of their mass being hydrogen and 25% helium. On Earth, both hydrogen and helium are gases, so Jupiter and Saturn are sometimes called gas planets. But, this name is misleading. Jupiter and Saturn are so large that the gas is compressed in their interior until the hydrogen becomes a liquid. Because the bulk of both planets consists of compressed, liquefied hydrogen, we should really call them liquid planets.
Under the force of gravity, the heavier elements sink toward the inner parts of a liquid or gaseous planet. Both Jupiter and Saturn, therefore, have cores composed of heavier rock, metal, and ice, but we cannot see these regions directly. In fact, when we look down from above, all we see is the atmosphere with its swirling clouds. We must infer the existence of the denser core inside these planets from studies of each planet’s gravity.
Uranus and Neptune are much smaller than Jupiter and Saturn, but each also has a core of rock, metal, and ice. Uranus and Neptune were less efficient at attracting hydrogen and helium gas, so they have much smaller atmospheres in proportion to their cores.
Chemically, each giant planet is dominated by hydrogen and its many compounds. Nearly all the oxygen present is combined chemically with hydrogen to form water (H2O). Chemists call such a hydrogen-dominated composition reduced. Throughout the outer solar system, we find abundant water (mostly in the form of ice) and reducing chemistry.
17.3.2 The Terrestrial Planets
The terrestrial planets are quite different from the giants. In addition to being much smaller, they are composed primarily of rocks and metals. These, in turn, are made of elements that are less common in the universe as a whole. The most abundant rocks, called silicates, are made of silicon and oxygen, and the most common metal is iron. We can tell from their densities that Mercury has the greatest proportion of metals (which are denser) and the Moon has the lowest. Earth, Venus, and Mars all have roughly similar bulk compositions: about one third of their mass consists of iron-nickel or iron-sulfur combinations; two thirds is made of silicates. Because these planets are largely composed of oxygen compounds (such as the silicate minerals of their crusts), their chemistry is said to be oxidized.
When we look at the internal structure of each of the terrestrial planets, we find that the densest metals are in a central core, with the lighter silicates near the surface. If these planets were liquid, like the giant planets, we could understand this effect as the result the sinking of heavier elements due to the pull of gravity. This leads us to conclude that, although the terrestrial planets are solid today, at one time they must have been hot enough to melt.
Differentiation is the process by which gravity helps separate a planet’s interior into layers of different compositions and densities. The heavier metals sink to form a core, while the lightest minerals float to the surface to form a crust. Later, when the planet cools, this layered structure is preserved. In order for a rocky planet to differentiate, it must be heated to the melting point of rocks, which is typically more than 1300 K.
17.3.3 Moons, Asteroids, and Comets
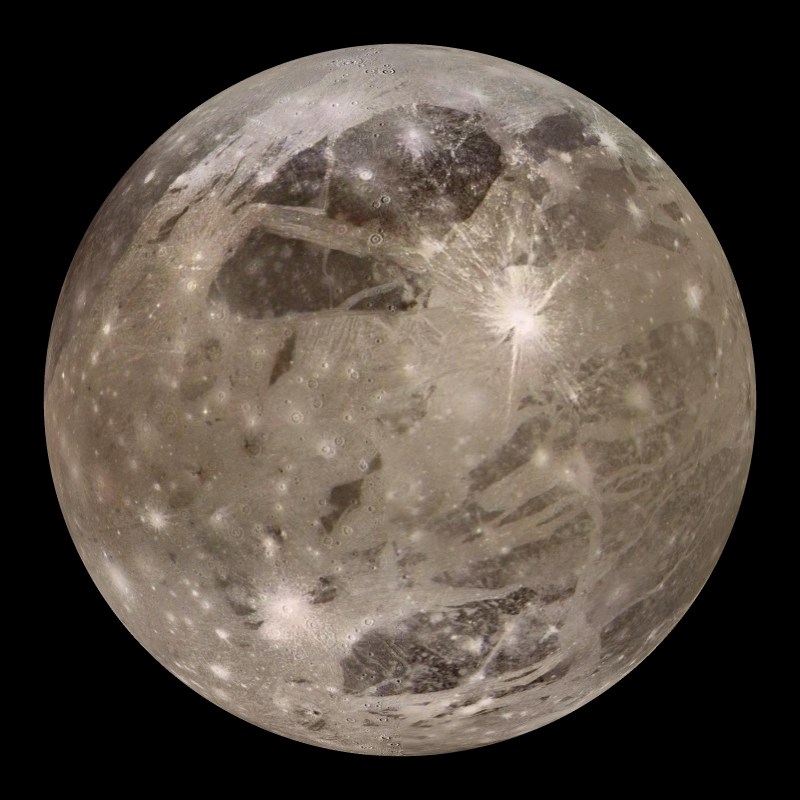
Chemically and structurally, Earth’s Moon is like the terrestrial planets, but most moons are in the outer solar system, and they have compositions similar to the cores of the giant planets around which they orbit. The three largest moons—Ganymede and Callisto in the Jovian system, and Titan in the Saturnian system—are composed half of frozen water, and half of rocks and metals. Most of these moons differentiated during formation, and today they have cores of rock and metal, with upper layers and crusts of very cold and—thus very hard—ice.
Most of the asteroids and comets, as well as the smallest moons, were probably never heated to the melting point. However, some of the largest asteroids, such as Vesta, appear to be differentiated; others are fragments from differentiated bodies. Many of the smaller objects seem to be fragments or rubble piles that are the result of collisions. Because most asteroids and comets retain their original composition, they represent relatively unmodified material dating back to the time of the formation of the solar system. In a sense, they act as chemical fossils, helping us to learn about a time long ago whose traces have been erased on larger worlds.
17.3.4 Temperatures: Going to Extremes
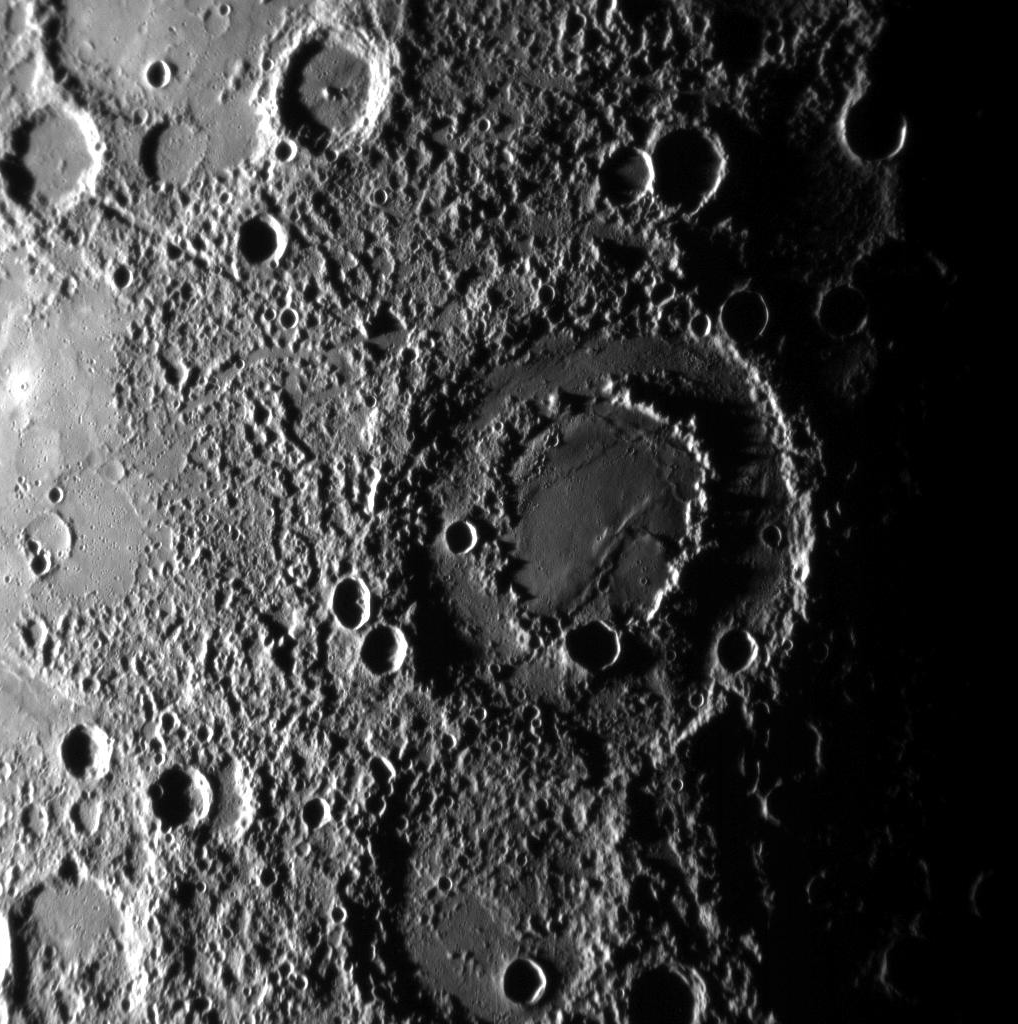
Generally speaking, the farther a planet or moon is from the Sun, the cooler its surface. The planets are heated by the radiant energy of the Sun, which gets weaker with the square of the distance. You know how rapidly the heating effect of a fireplace or an outdoor radiant heater diminishes as you walk away from it; the same effect applies to the Sun. Mercury, the closest planet to the Sun, has a blistering surface temperature that ranges from 280–430 °C on its sunlit side, whereas the surface temperature on Pluto is only about –220 °C, colder than liquid air.
Mathematically, the temperatures decrease approximately in proportion to the square root of the distance from the Sun. Pluto is about 30 AU at its closest to the Sun (or 100 times the distance of Mercury) and about 49 AU at its farthest from the Sun. Thus, Pluto’s temperature is less than that of Mercury by the square root of 100, or a factor of 10: from 500 K to 50 K.
In addition to its distance from the Sun, the surface temperature of a planet can be influenced strongly by its atmosphere. Without our atmospheric insulation (the greenhouse effect, which keeps the heat in), the oceans of Earth would be permanently frozen. Conversely, if Mars once had a larger atmosphere in the past, it could have supported a more temperate climate than it has today. Venus is an even more extreme example, where its thick atmosphere of carbon dioxide acts as insulation, reducing the escape of heat built up at the surface, resulting in temperatures greater than those on Mercury. Today, Earth is the only planet where surface temperatures generally lie between the freezing and boiling points of water. As far as we know, Earth is the only planet to support life.
17.3.5 Dating Planetary Surfaces[3]
How do we know the age of the surfaces we see on planets and moons? If a world has a surface (as opposed to being mostly gas and liquid), astronomers have developed some techniques for estimating how long ago that surface solidified. Note that the age of these surfaces is not necessarily the age of the planet as a whole. On geologically active objects (including Earth), vast outpourings of molten rock or the erosive effects of water and ice, which we call planet weathering, have erased evidence of earlier epochs and present us with only a relatively young surface for investigation.
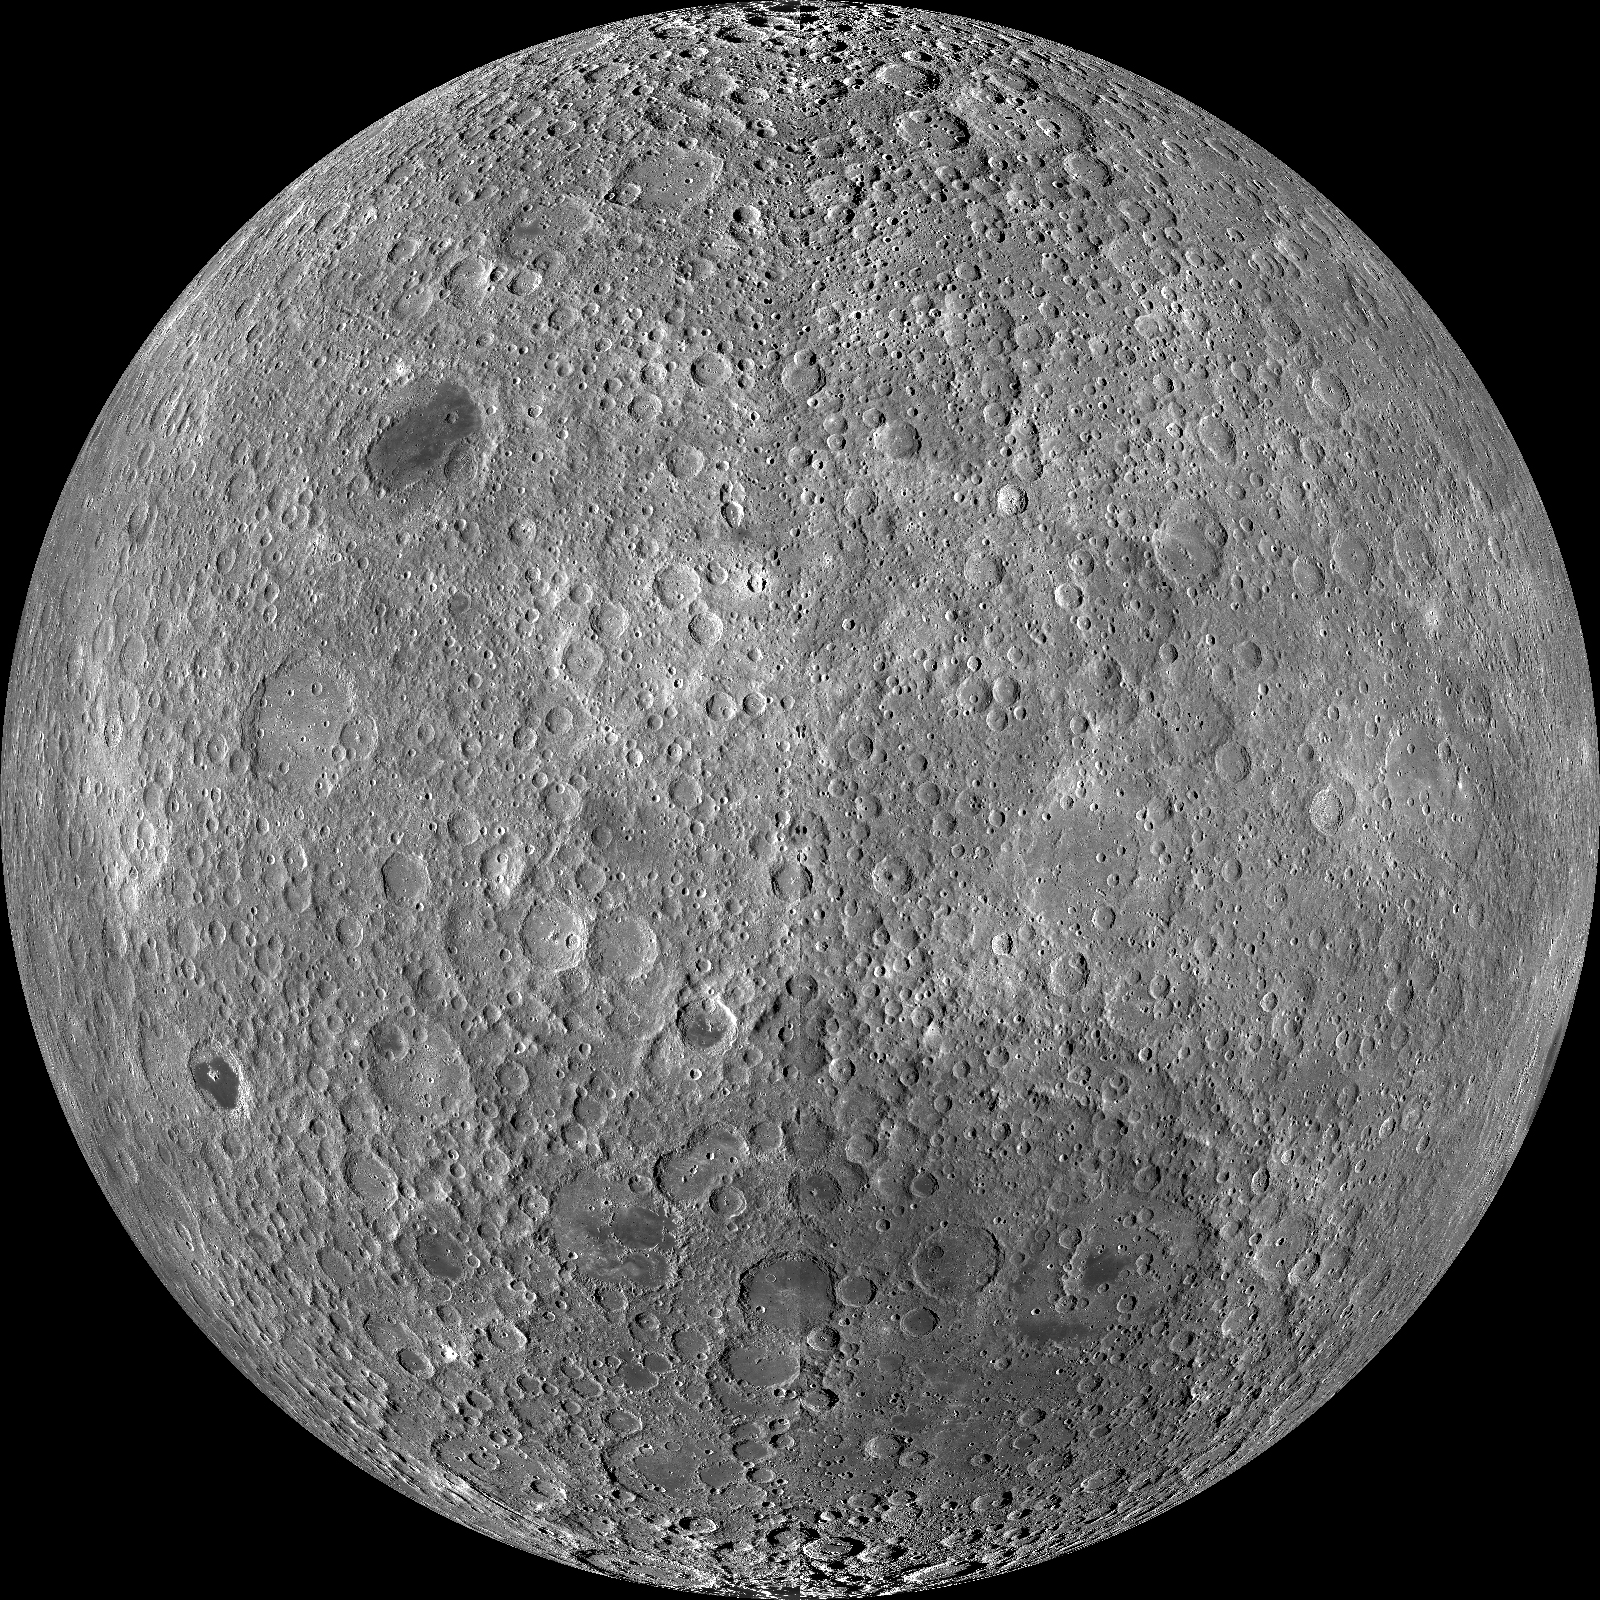
One way to estimate the age of a surface is by counting the number of impact craters. This technique works because the rate at which impacts have occurred in the solar system has been roughly constant for several billion years. Thus, in the absence of forces to eliminate craters, the number of craters is simply proportional to the length of time the surface has been exposed. This technique has been applied successfully to many solid planets and moons.
Bear in mind that crater counts can tell us only the time since the surface experienced a major change that could modify or erase preexisting craters. Estimating ages from crater counts is a little like walking along a sidewalk in a snowstorm after the snow has been falling steadily for a day or more. You may notice that in front of one house the snow is deep, while next door the sidewalk may be almost clear. Do you conclude that less snow has fallen in front of Ms. Jones’ house than Mr. Smith’s? More likely, you conclude that Jones has recently swept the walk clean and Smith has not. Similarly, the numbers of craters indicate how long it has been since a planetary surface was last “swept clean” by ongoing lava flows or by molten materials ejected when a large impact happened nearby.
Still, astronomers can use the numbers of craters on different parts of the same world to provide important clues about how regions on that world evolved. On a given planet or moon, the more heavily cratered terrain will generally be older (that is, more time will have elapsed there since something swept the region clean).
17.3.6 Radioactive Rocks
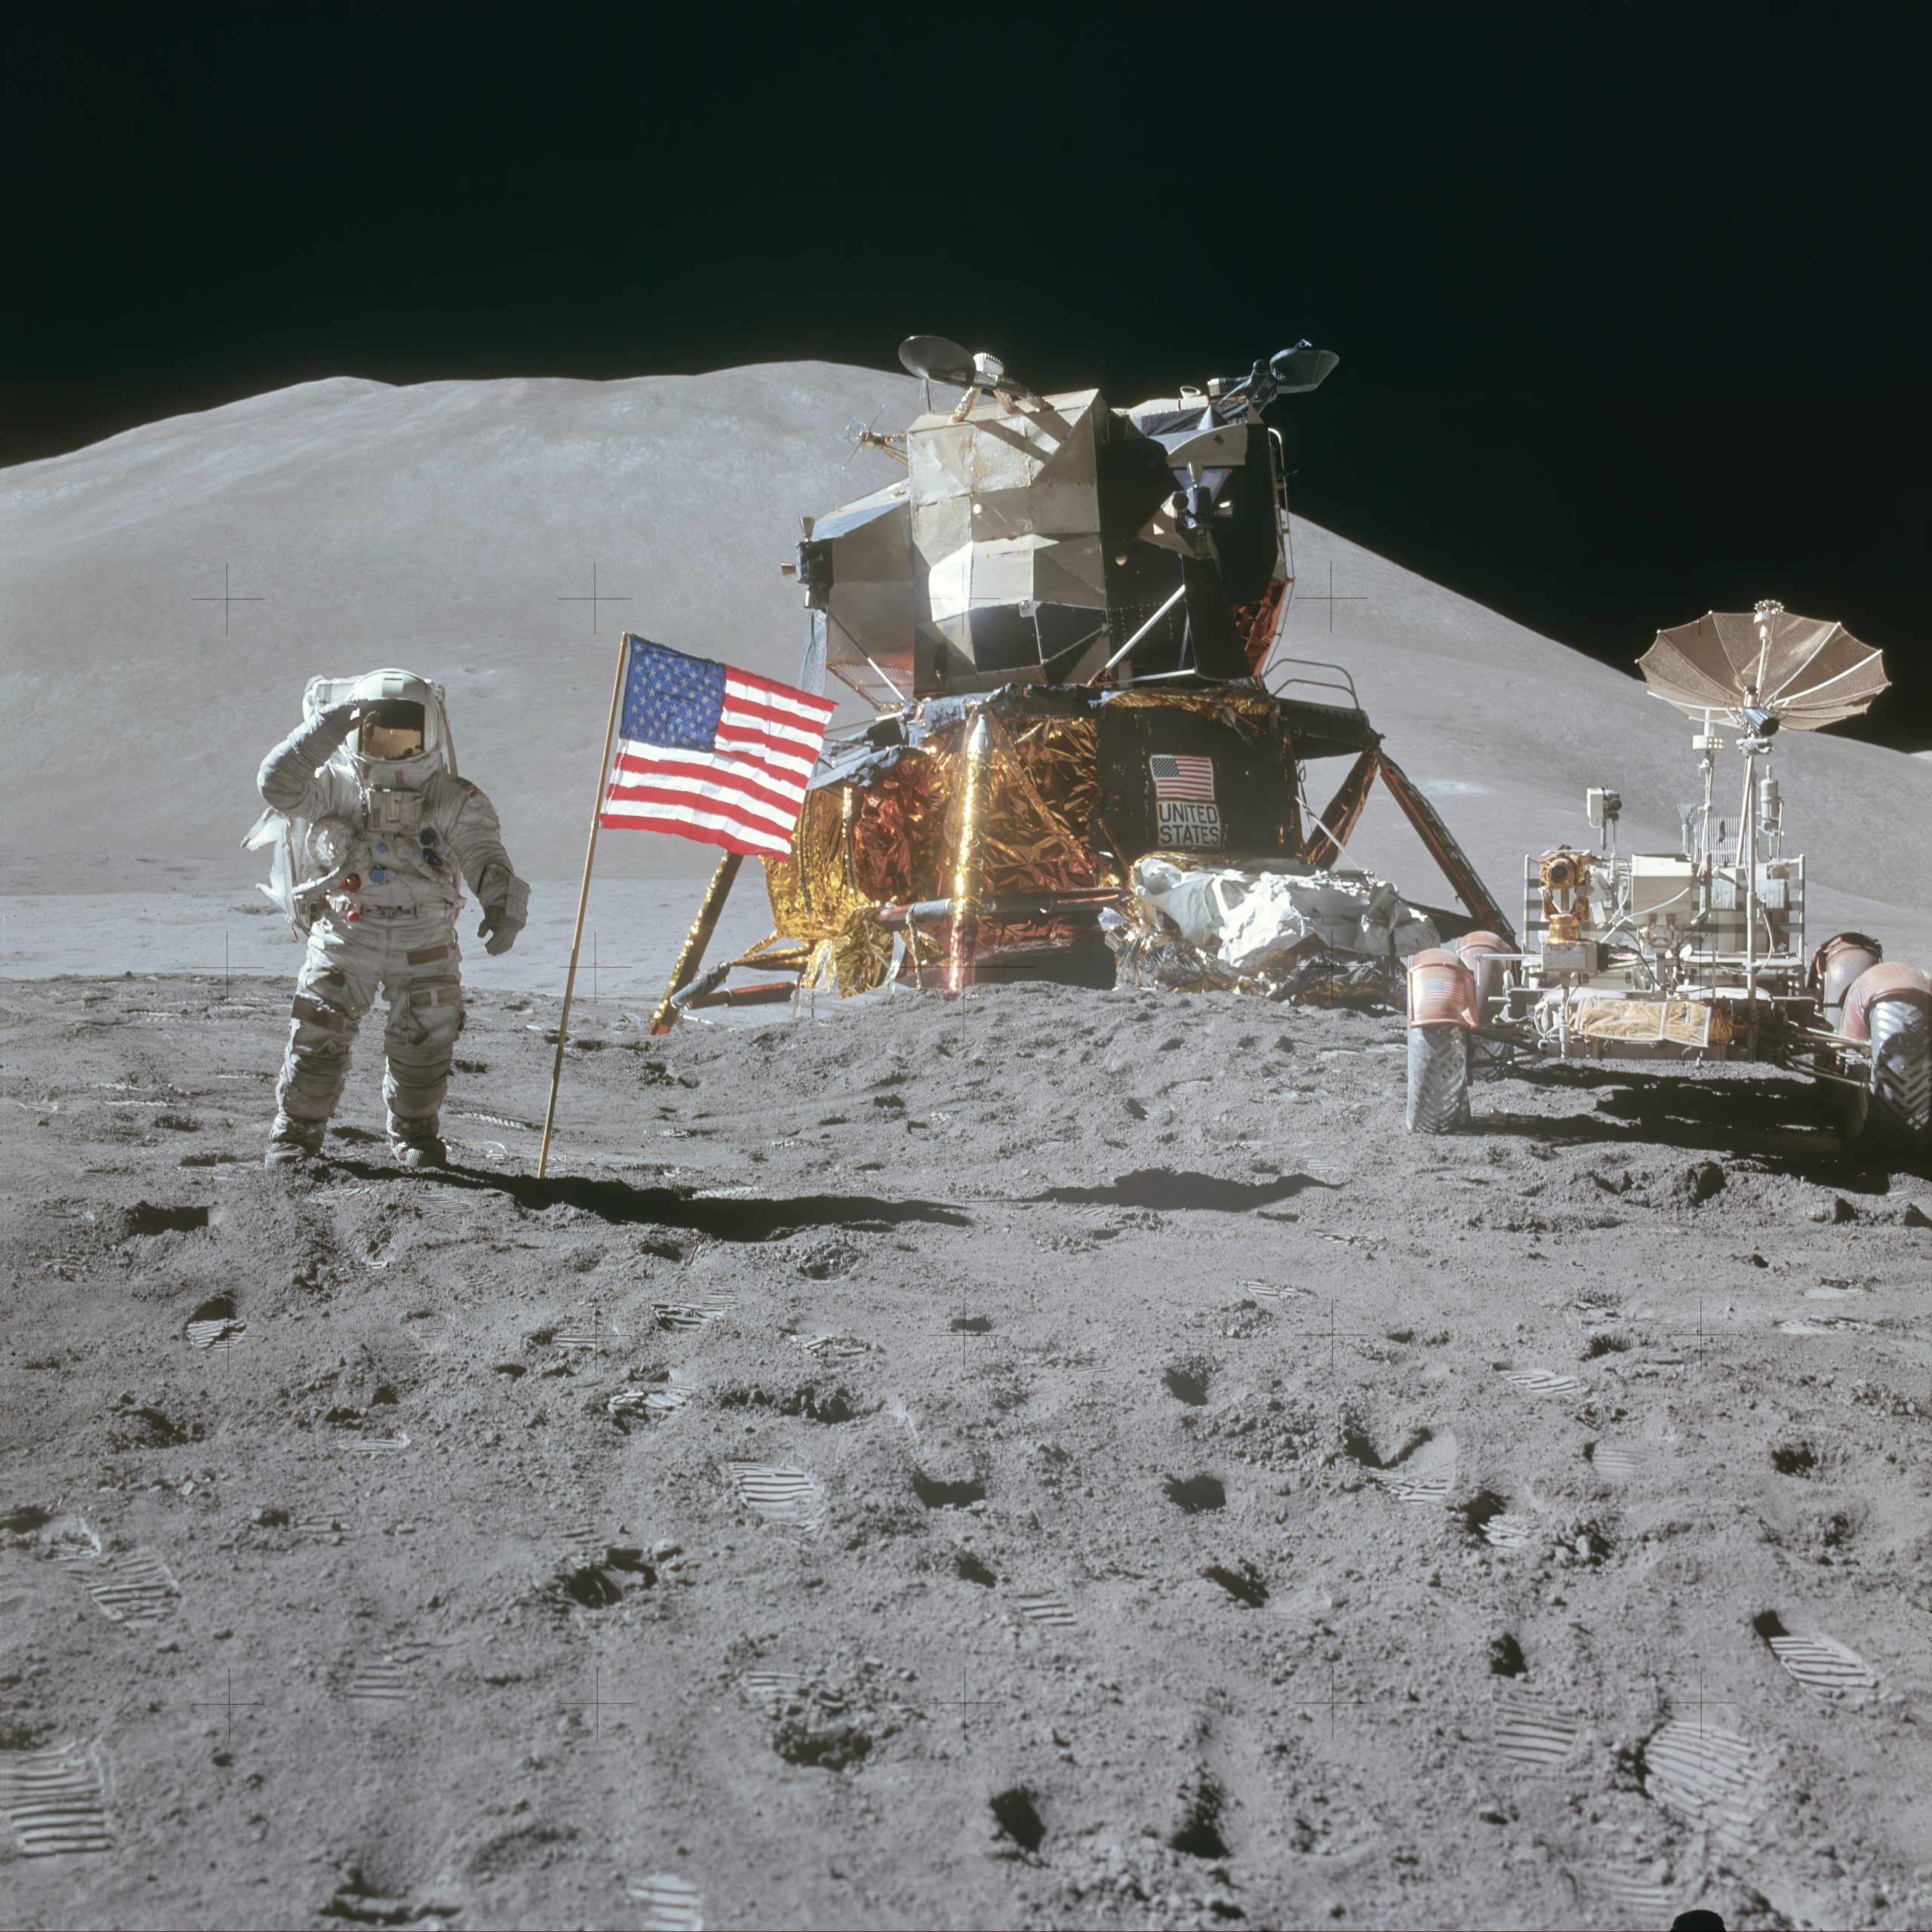
Another way to trace the history of a solid world is to measure the age of individual rocks. After samples were brought back from the Moon by Apollo astronauts, the techniques that had been developed to date rocks on Earth were applied to rock samples from the Moon to establish a geological chronology for the Moon. Furthermore, a few samples of material from the Moon, Mars, and the large asteroid Vesta have fallen to Earth as meteorites and can be examined directly.
Scientists measure the age of rocks using the properties of natural radioactivity. Around the beginning of the twentieth century, physicists began to understand that some atomic nuclei are not stable but can split apart (decay) spontaneously into smaller nuclei. The process of radioactive decay involves the emission of particles such as electrons, or of radiation in the form of gamma rays.
For any one radioactive nucleus, it is not possible to predict when the decay process will happen. Such decay is random in nature, like the throw of dice: as gamblers have found all too often, it is impossible to say just when the dice will come up 7 or 11. But, for a very large number of dice tosses, we can calculate the odds that 7 or 11 will come up. Similarly, if we have a very large number of radioactive atoms of one type (say, uranium), there is a specific time period, called its half-life, during which the chances are fifty-fifty that decay will occur for any of the nuclei.
A particular nucleus may last a shorter or longer time than its half-life, but in a large sample, almost exactly half of the nuclei will have decayed after a time equal to one half-life. Half of the remaining nuclei will have decayed after two half-lives pass, leaving only one half of a half—or one quarter—of the original sample.
If you had 1 gram of pure radioactive nuclei with a half-life of 100 years, then after 100 years you would have 1/2 gram; after 200 years, 1/4 gram; after 300 years, only 1/8 gram; and so forth. However, the material does not disappear. Instead, the radioactive atoms are replaced with their decay products. Sometimes the radioactive atoms are called parents and the decay products are called daughter elements.
In this way, radioactive elements with half-lives we have determined can provide accurate nuclear clocks. By comparing how much of a radioactive parent element is left in a rock to how much of its daughter products have accumulated, we can learn how long the decay process has been going on and hence how long ago the rock formed. The following table summarizes the decay reactions used most often to date lunar and terrestrial rocks.
| Parent | Daughter | Half-life (billions of years) |
|---|---|---|
| Samarium-147 | Neodymium-143 | 106 |
| Rubidium-87 | Strontium-87 | 48.8 |
| Thorium-232 | Lead-208 | 14 |
| Uranium-238 | Lead-206 | 4.47 |
| Potassium-40 | Argon-40 | 1.31 |
Table 17.3: Radioactive decay reaction used to date rocks. The number after each element is its atomic weight, equal to the number of protons plus neutrons in its nucleus. This specifies the isotope of the element, different isotopes of the same element differ in the number of neutrons.
When astronauts first flew to the Moon, one of their most important tasks was to bring back lunar rocks for radioactive age-dating. Until then, astronomers and geologists had no reliable way to measure the age of the lunar surface. Counting craters had let us calculate relative ages (for example, the heavily cratered lunar highlands were older than the dark lava plains), but scientists could not measure the actual age in years. Some thought that the ages were as young as those of Earth’s surface, which has been resurfaced by many geological events. For the Moon’s surface to be so young would imply active geology on our satellite. Only in 1969, when the first Apollo samples were dated, did we learn that the Moon is an ancient, geologically dead world. Using such dating techniques, we have been able to determine the ages of both Earth and the Moon: each was formed about 4.5 billion years ago (although, as we shall see, Earth probably formed earlier than the Moon).
We should also note that the decay of radioactive nuclei generally releases energy in the form of heat. Although the energy from a single nucleus is not very large (in human terms), the enormous numbers of radioactive nuclei in a planet or moon (especially early in its existence) can be a significant source of internal energy for that world. Geologists estimate that about half of Earth’s current internal heat budget comes from the decay of radioactive isotopes in its interior.

Take this quiz to check your comprehension of this section.
If you are using an offline version of this text, access the quiz for section 17.3 via the QR code.
17.4 Origin of the Solar System[4]
Much of astronomy is motivated by a desire to understand the origin of things: to find at least partial answers to age-old questions of where the universe, the Sun, Earth, and we ourselves came from. Each planet and moon is a fascinating place that may stimulate our imagination as we try to picture what it would be like to visit. Taken together, the members of the solar system preserve patterns that can tell us about the formation of the entire system. As we begin our exploration of the planets, we want to introduce our modern picture of how the solar system formed.
The recent discovery of thousands of planets in orbit around other stars has shown astronomers that many exoplanetary systems can be quite different from our own solar system. For example, it is common for these systems to include planets intermediate in size between our terrestrial and giant planets. These are often called superearths. Some exoplanet systems even have giant planets close to the star, reversing the order we see in our system.
17.4.1 Looking for Patterns
One way to approach our question of origin is to look for regularities among the planets. We found, for example, that all the planets lie in nearly the same plane and revolve in the same direction around the Sun. The Sun also spins in the same direction about its own axis. Astronomers interpret this pattern as evidence that the Sun and planets formed together from a spinning cloud of gas and dust that we call the solar nebula.
The composition of the planets gives another clue about origins. Spectroscopic analysis allows us to determine which elements are present in the Sun and the planets. The Sun has the same hydrogen-dominated composition as Jupiter and Saturn, and therefore appears to have been formed from the same reservoir of material. In comparison, the terrestrial planets and our Moon are relatively deficient in the light gases and the various ices that form from the common elements oxygen, carbon, and nitrogen. Instead, on Earth and its neighbors, we see mostly the rarer heavy elements such as iron and silicon. This pattern suggests that the processes that led to planet formation in the inner solar system must somehow have excluded much of the lighter materials that are common elsewhere. These lighter materials must have escaped, leaving a residue of heavy stuff.
The reason for this is not hard to guess, bearing in mind the heat of the Sun. The inner planets and most of the asteroids are made of rock and metal, which can survive heat, but they contain very little ice or gas, which evaporate when temperatures are high (to see what we mean, just compare how long a rock and an ice cube survive when they are placed in the sunlight). In the outer solar system, where it has always been cooler, the planets and their moons, as well as icy dwarf planets and comets, are composed mostly of ice and gas.
17.4.2 The Evidence from Far Away
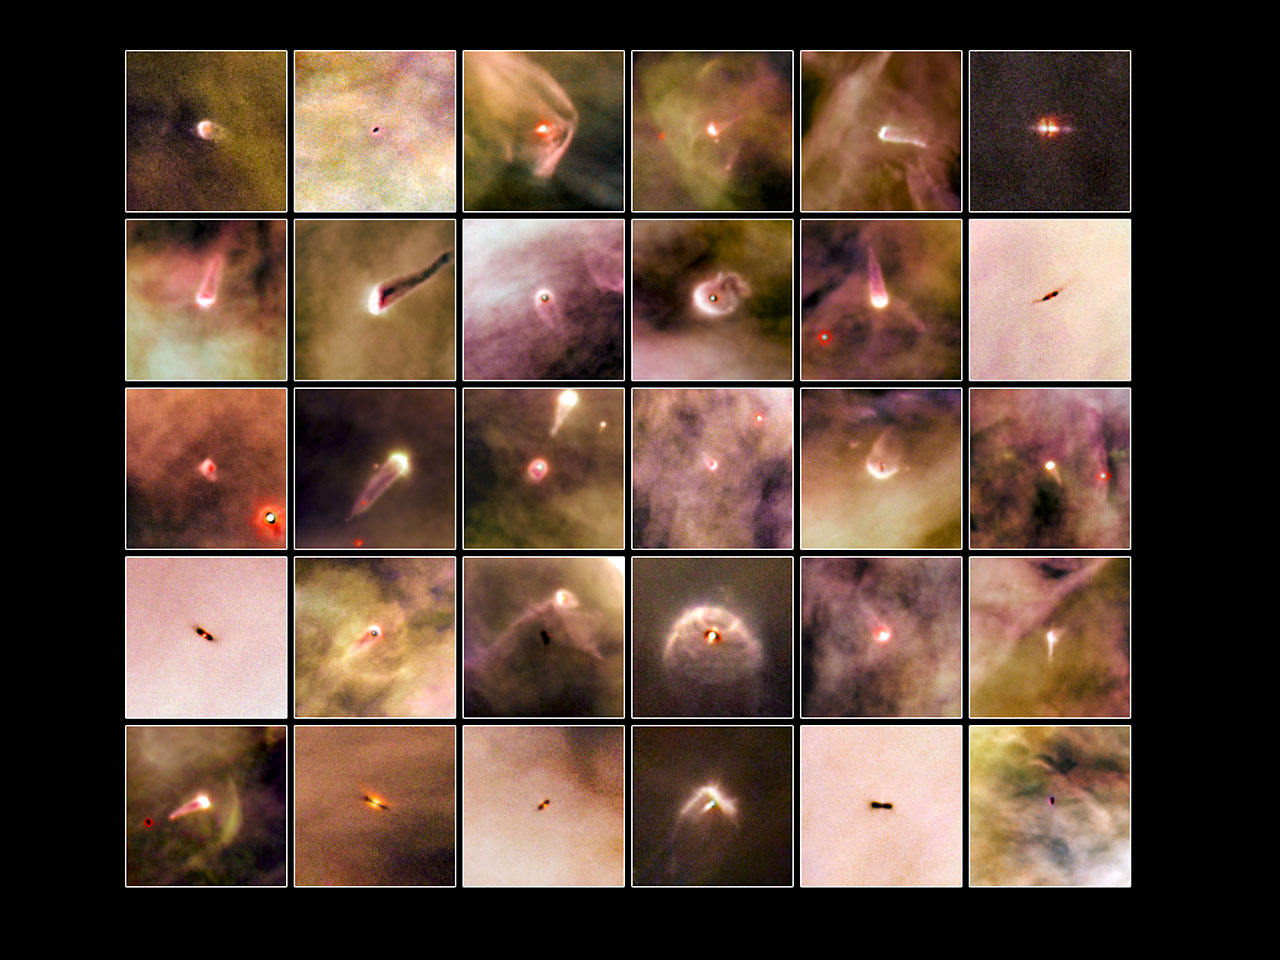
A second approach to understanding the origins of the solar system is to look outward for evidence that other systems of planets are forming elsewhere. We cannot look back in time to the formation of our own system, but many stars in space are much younger than the Sun. In these systems, the processes of planet formation might still be accessible to direct observation. We observe that there are many other “solar nebulas” or circumstellar disks—flattened, spinning clouds of gas and dust surrounding young stars. These disks resemble our own solar system’s initial stages of formation billions of years ago.
17.4.3 Building Planets
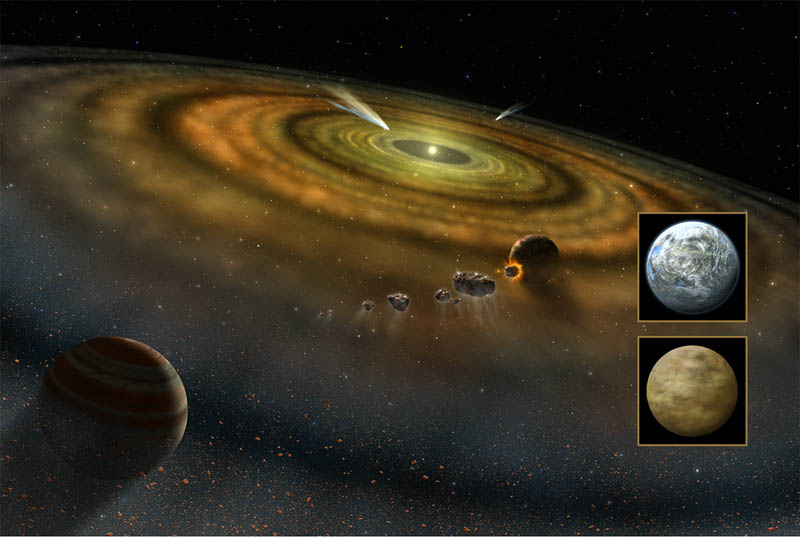
Circumstellar disks are a common occurrence around very young stars, suggesting that disks and stars form together. Astronomers can use theoretical calculations to see how solid bodies might form from the gas and dust in these disks as they cool. These models show that material begins to coalesce first by forming smaller objects, precursors of the planets, which we call planetesimals.
Today’s fast computers can simulate the way millions of planetesimals, probably no larger than 100 kilometers in diameter, might gather together under their mutual gravity to form the planets we see today. We are beginning to understand that this process was a violent one, with planetesimals crashing into each other and sometimes even disrupting the growing planets themselves. As a consequence of those violent impacts (and the heat from radioactive elements in them), all the planets were heated until they were liquid and gas, and therefore differentiated, which helps explain their present internal structures.
The process of impacts and collisions in the early solar system was complex and, apparently, often random. The solar nebula model can explain many of the regularities we find in the solar system, but the random collisions of massive collections of planetesimals could be the reason for some exceptions to the “rules” of solar system behavior. For example, why do the planets Uranus and Pluto spin on their sides? Why does Venus spin slowly and in the opposite direction from the other planets? Why does the composition of the Moon resemble Earth in many ways and yet exhibit substantial differences? The answers to such questions probably lie in enormous collisions that took place in the solar system long before life on Earth began.
Today, some 4.5 billion years after its origin, the solar system is—thank goodness—a much less violent place. However, some planetesimals have continued to interact and collide, and their fragments move about the solar system as roving “transients” that can make trouble for the established members of the Sun’s family, such as our own Earth.

Take this quiz to check your comprehension of this section.
If you are using an offline version of this text, access the quiz for section 17.4 via the QR code.
Summary
Our solar system currently consists of the Sun, eight planets, five dwarf planets, nearly 200 known moons, and a host of smaller objects. The planets can be divided into two groups: the inner terrestrial planets and the outer giant planets. Smaller members of the solar system include asteroids (including the dwarf planet Ceres), which are rocky and metallic objects found mostly between Mars and Jupiter; comets, which are made mostly of frozen gases and generally orbit far from the Sun; and countless smaller grains of cosmic dust. When a meteor survives its passage through our atmosphere and falls to Earth, we call it a meteorite.
The ages of the surfaces of objects in the solar system can be estimated by counting craters: on a given world, a more heavily cratered region will generally be older than one that is less cratered. We can also use samples of rocks with radioactive elements in them to obtain the time since the layer in which the rock formed last solidified. The half-life of a radioactive element is the time it takes for half the sample to decay; we determine how many half-lives have passed by how much of a sample remains the radioactive element and how much has become the decay product. In this way, we have estimated the age of the Moon and Earth to be roughly 4.5 billion years.
Regularities among the planets have led astronomers to hypothesize that the Sun and the planets formed together in a giant, spinning cloud of gas and dust called the solar nebula. Astronomical observations show tantalizingly similar circumstellar disks around other stars. Within the solar nebula, material first coalesced into planetesimals; many of these gathered together to make the planets and moons. The remainder can still be seen as comets and asteroids. Probably all planetary systems have formed in similar ways, but many exoplanet systems have evolved along quite different paths.

Take this quiz to check your comprehension of this chapter.
If you are using an offline version of this text, access the quiz for chapter 17 via the QR code.
Text References
Parts of this chapter are from OpenStax’s Astronomy (chapter 7). 2016. CC BY 4.0.
Chapter 17 Origin of Earth and the Solar System (CC BY 4.0) by Karla Panchuk was added from Earle, Steven (2019) Physical Geology, 2nd edition. BC Campus https://opentextbc.ca/physicalgeology2ed/chapter/22-1-starting-with-a-big-bang
Figure References
Figure 17.1: The big bang. NASA/WMAP Science Team. 2006. Public domain. https://en.wikipedia.org/wiki/File:CMB_Timeline300_no_WMAP.jpg
Figure 17.2: Cosmic microwave background (CMB) map of the sky, a baby picture of the universe. NASA / WMAP Science Team. 2012. Public domain. https://commons.wikimedia.org/wiki/File:Ilc_9yr_moll4096.png
Figure 17.3: Doppler effect. Charly Whisky. 2007. CC BY-SA 3.0. https://commons.wikimedia.org/wiki/File%3ADopplerfrequenz.gif
Figure 17.4: Red shift in light from the supercluster BAS11 compared to the sun’s light. Kindred Grey. 2022. CC BY 4.0. Includes Duck by parkjisun from Noun Project (Noun Project license).
Figure 17.5: Astronauts on the Moon. NASA Johnson Space Center; Restored by Bammesk. 1971. Public domain. https://en.wikipedia.org/wiki/File:AS15-88-11866_-_Apollo_15_flag,_rover,_LM,_Irwin_-_restoration1.jpg
Figure 17.6: Orbits of the planets. Arabik4892. 2022. CC BY-SA 4.0. https://commons.wikimedia.org/wiki/File:Planet_Orbits.jpg
Figure 17.7: Surface of Mercury. NASA/Johns Hopkins University Applied Physics Laboratory/Carnegie Institution of Washington. 2009. Public domain. https://commons.wikimedia.org/wiki/File:Mercury_Double-Ring_Impact_Basin.png
Figure 17.8: The four giant planets. Solar System Exploration, NASA. 2008. Public domain. https://commons.wikimedia.org/wiki/File:Gas_planet_size_comparisons.jpg
Figure 17.9: This intriguing image from the New Horizons spacecraft, taken when it flew by the dwarf planet Pluto in July 2015, shows some of its complex surface features. NASA / Johns Hopkins University Applied Physics Laboratory / Southwest Research Institute. 2015. Public domain. https://en.wikipedia.org/wiki/File:Pluto-01_Stern_03_Pluto_Color_TXT.jpg
Figure 17.10: Saturn and its A, B, and C rings in visible and (inset) infrared light. NASA/JPL-Caltech/Space Science Institute/G. Ugarkovic (ISS), NASA/JPL-Caltech/University of Arizona/CNRS/LPG-Nantes (VIMS). 2019. Public domain. https://commons.wikimedia.org/wiki/File:PIA23170-Saturn-Rings-IR-Map-20190613.jpg
Figure 17.11: Asteroid Eros. NASA/JPL/JHUAPL. 2000. Public domain. https://commons.wikimedia.org/wiki/File:Eros_-_PIA02923_(color).jpg
Figure 17.12: Comet Churyumov-Gerasimenko (67P). ESA/Rosetta/MPS for OSIRIS Team MPS/UPD/LAM/IAA/SSO/INTA/UPM/DASP/IDA. 2014. CC BY-SA 4.0. https://commons.wikimedia.org/wiki/File:Comet_67P_True_color.jpg
Figure 17.13: Jupiter with its moon Europa on the left. NASA, ESA, STScI, A. Simon (Goddard Space Flight Center), and M.H. Wong (University of California, Berkeley) and the OPAL team. 2020. Public domain. https://commons.wikimedia.org/wiki/File:Jupiter_and_Europa_2020.tiff
Figure 17.14: Jupiter’s moon Ganymede. NOAA. 2009. Public domain. https://commons.wikimedia.org/wiki/File:Moon_Ganymede_by_NOAA.jpg
Figure 17.15: Our cratered Moon. NASA/Goddard/Arizona State University. 2011. Public domain. https://www.nasa.gov/mission_pages/LRO/news/lro-farside.html
Figure 17.16: Radioactive decay. Andrew Fraknoi, David Morrison, and Sidney Wolff. 2015. CC BY 4.0. https://en.wikipedia.org/wiki/File:OSC_Astro_07_03_Decay_(1).jpg
Figure 17.17: NASA artist’s conception of various planet formation processes, including exocomets and other planetesimals, around Beta Pictoris, a very young type A V star. NASA/FUSE/Lynette Cook. 2007. Public domain. https://commons.wikimedia.org/wiki/File:NASA-ExocometsAroundBetaPictoris-ArtistView.jpg
Figure 17.18: Atlas of Planetary Nurseries. NASA/ESA and L. Ricci (ESO). 2009. CC BY 4.0. https://esahubble.org/copyright/
- Source: OpenStax Astronomy (CC BY). Access for free at https://openstax.org/books/astronomy-2e/pages/7-1-overview-of-our-planetary-system ↵
- Source: OpenStax Astronomy (CC BY). Access for free at https://openstax.org/books/astronomy/pages/7-2-composition-and-structure-of-planets ↵
- Source: OpenStax Astronomy (CC BY). Access for free at https://openstax.org/books/astronomy/pages/7-3-dating-planetary-surfaces ↵
- Source: OpenStax Astronomy (CC BY). Access for free at https://openstax.org/books/astronomy/pages/7-4-origin-of-the-solar-system ↵
All of space and time and their contents, including planets, stars, galaxies, and all other forms of matter and energy.
The generic term for a group of planets and other bodies circling a star is planetary system. Our planetary system is the only one officially called “solar system,” because our Sun is sometimes called Sol.
A large astronomical body that is neither a star nor a stellar remnant.
The measure of the vibrational (kinetic) energy of a substance.
Originating or existing outside the solar system.
The theory that the Universe started with a expansive explosion. Shortly after, elements were created (mostly hydrogen) and galaxies started to form.
A process inside stars where smaller atoms combine and form larger atoms.
The generic term for a group of planets and other bodies circling a star.
The process of atoms breaking down randomly and spontaneously.
Any planet beyond our solar system.
A group of all atoms with a specific number of protons, having specific, universal, and unique properties.
The distance that light can travel through space in a year. One light year is 9.4607 × 10^12 km.
Radiation left over from the an early stage in the development of the universe at the time when protons and neutrons were recombining to form atoms.
A gravitationally-bound system of stars and interstellar matter.
The increase in wavelength of light resulting from the fact that the source of the light is moving away from the observer.
The distance between any two repeating portions of a wave (e.g., two successive wave crests).
to move in a circular or curving course or orbit. Not to be confused with rotate, when something spins on an axis
An object that orbits a planet or something else that is not a star. Besides planets, moons can circle dwarf planets, large asteroids, and other bodies.
A small rocky body orbiting the sun.
a celestial object consisting of a nucleus of ice and dust and, when near the Sun, a “tail” of gas and dust particles pointing away from the Sun
A small planetary-mass object that is in direct orbit of the Sun – something smaller than any of the eight classical planets, but still a world in its own right.
The layers of gases surrounding a planet or other celestial body.
To move in a circular or curving course or orbit. Not to be confused with rotate, when something spins on an axis.
To spin on an axis. Not to be confused with revolve, when something moves in a circular or curving course or orbit.
A bowl-shaped depression, or hollowed-out area, produced by the impact of a meteorite, volcanic activity, or an explosion.
A landform that rises above its surrounding area.
Place where lava is erupted at the surface.
A circumstellar disc in the outer Solar System, extending from the orbit of Neptune at 30 astronomical units (AU) to approximately 50 AU from the Sun.
A spherical layer of icy objects surrounding our Sun; likely occupies space at a distance between about 2,000 and 100,000 astronomical units (AU) from the Sun.
An object that orbits a planet or something else that is not a star. Besides planets, moons can circle dwarf planets, large asteroids, and other bodies.
The gases that are part of the Earth, which are mainly nitrogen and oxygen.
A small body of matter from outer space that enters the Earth's atmosphere, becoming incandescent as a result of friction and appearing as a streak of light.
A stoney and/or metallic object from our solar system which was never incorporated into a planet and has fallen onto Earth. Meteorite is used for the rock on Earth, meteoroid for the object in space, and meteor as the object travels in Earth's atmosphere.
The branch of science which deals with celestial objects, space, and the physical universe as a whole.
A straight line passing from side to side through the center of a body or figure, especially a circle or sphere.
Reduction involves a half-reaction in which a chemical species decreases its oxidation number, usually by gaining electrons.
Mineral group in which the silica tetrahedra, SiO4-4, is the building block.
A solid material that is typically hard, shiny, malleable, fusible, and ductile, with good electrical and thermal conductivity.
Oxidation is the loss of electrons or an increase in the oxidation state of a chemical or atoms within it.
In planetary science, differentiation is the process of separating out the different components within a planetary body as a consequence of their physical or chemical behavior (e.g. density and chemical affinities).
An AU (or astronomical unit) is the average distance from Earth to the Sun.
The kelvin, symbol K, is the SI base unit of temperature. Absolute zero is 0 K, the equivalent of −273.15°C.
Breaking down rocks into small pieces by chemical or mechanical means.
A stable subatomic particle with a charge of negative electricity, found in all atoms and acting as the primary carrier of electricity in solids.
A penetrating form of electromagnetic radiation arising from the radioactive decay of atomic nuclei. It consists of the shortest wavelength electromagnetic waves, typically shorter than those of X-rays.
A radioactive atom that can and will decay.
The atom that is made after a radioactive decay.
Of or pertaining to an exoplanet, a planet outside the solar system.
Rotating, flattened disk of gas and dust from which the solar system originated.
Turn from liquid into vapor.
A body that could or did come together with many others under gravitation to form a planet.
The calculated amount of time that half of the mass of an original (parent) radioactive isotope breaks down into a new (daughter) isotope.
