13 Deserts
Learning Objectives
By the end of this chapter, students should be able to:
- Explain the defining characteristic of a desert and distinguish between the three broad categories of deserts.
- Explain how geographic features, latitude, atmospheric circulation, and Coriolis Effect influence where deserts are located.
- List the primary desert weathering and erosion processes.
- Identify desert landforms.
- Explain how desert landforms are formed by erosion and deposition.
- Describe the main types of sand dunes and the conditions that form them.
- Identify the main features of the Basin and Range desert (United States).
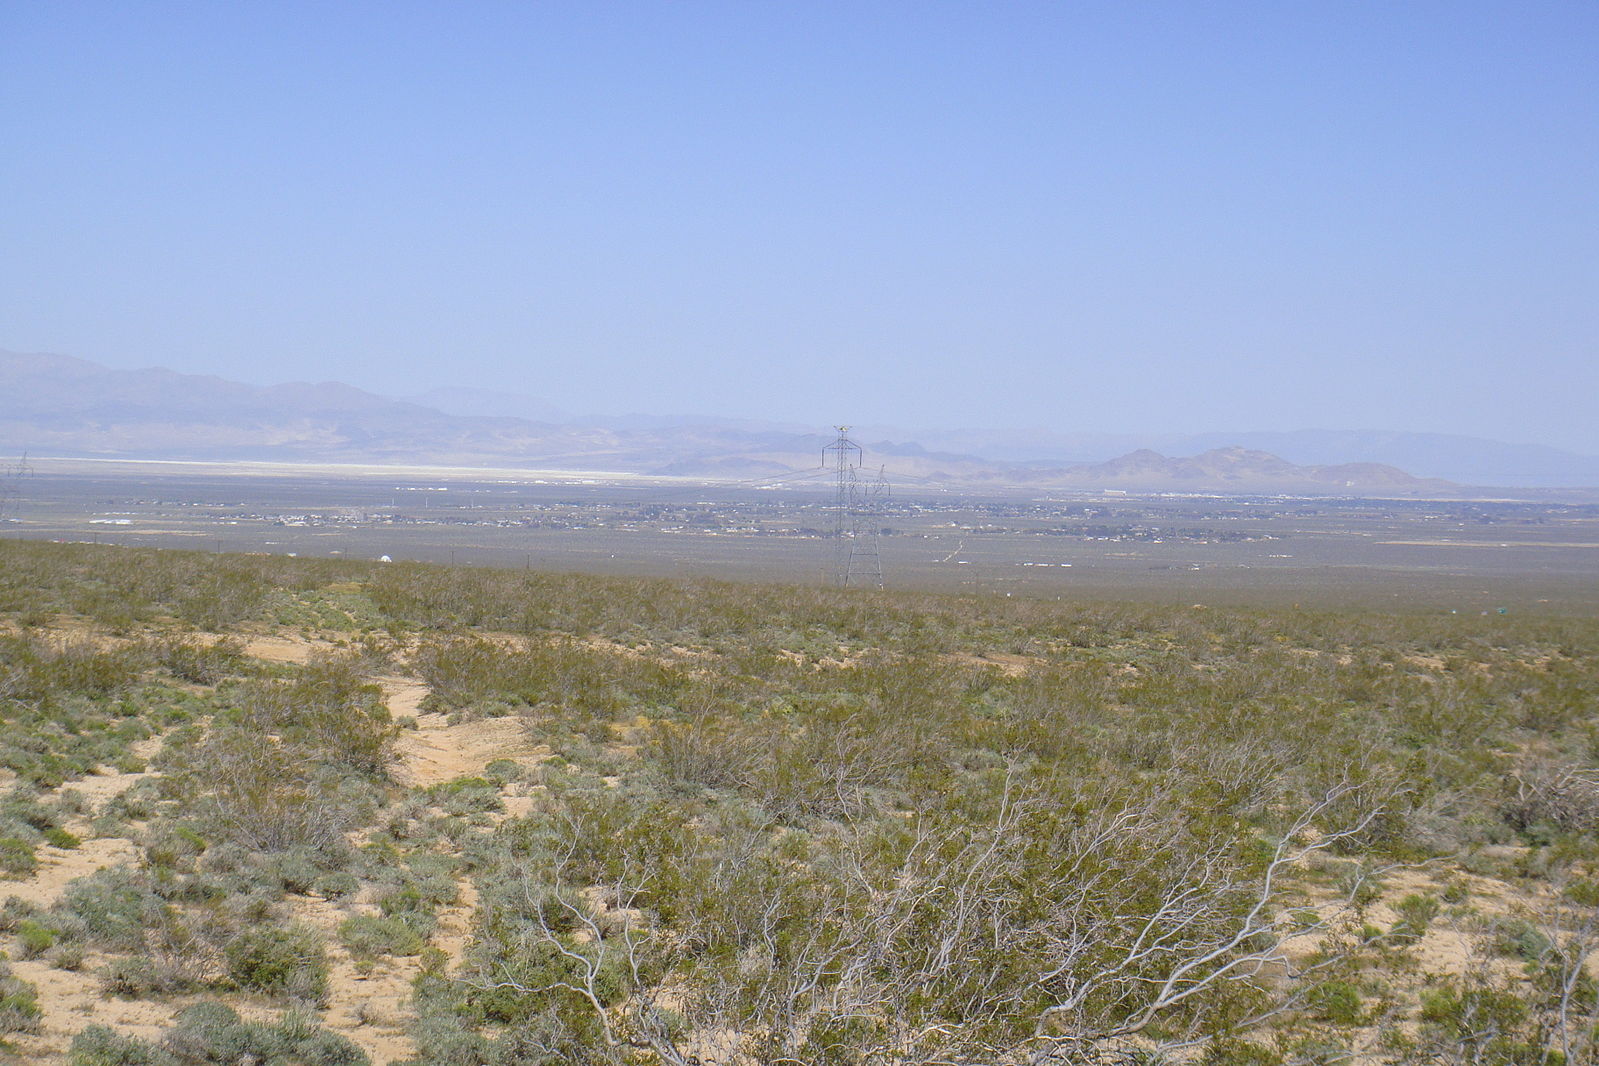
Approximately 30% of the Earth’s terrestrial surface consists of deserts, which are defined as locations of low precipitation. While temperature extremes are often associated with deserts, they do not define them. Deserts exhibit extreme temperatures because of the lack of moisture in the atmosphere, including low humidity and scarce cloud cover. Without cloud cover, the Earth’s surface absorbs more of the Sun’s energy during the day and emits more heat at night.
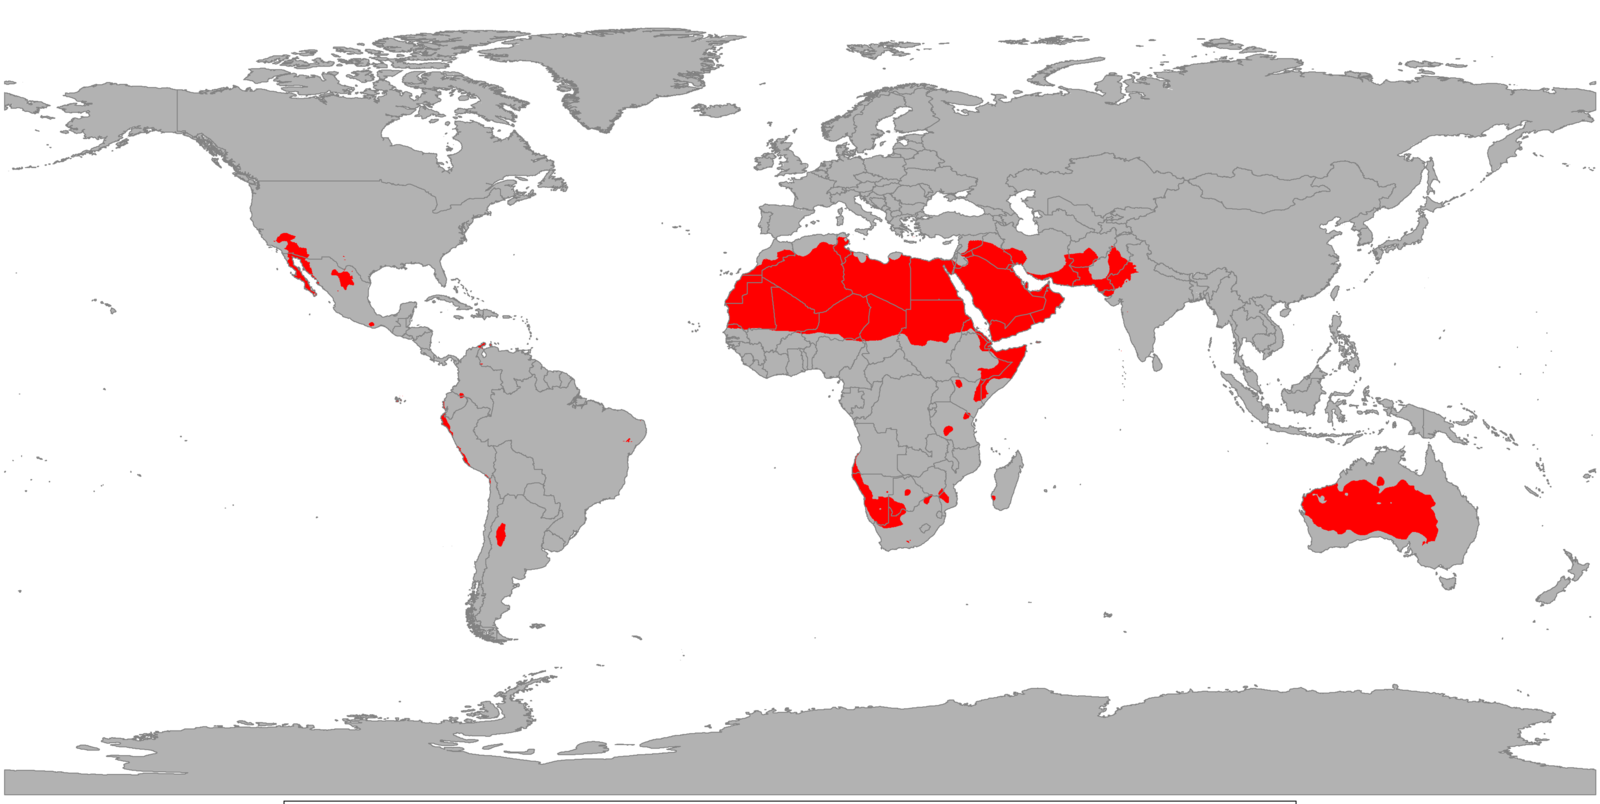
Deserts are not randomly located on the Earth’s surface. Many deserts are located at latitudes between 15° and 30° in both hemispheres and at both the North and South Poles, created by prevailing wind circulation in the atmosphere. Sinking, dry air currents occurring at 30° north and south of the equator produce trade winds that create deserts like the African Sahara and Australian Outback.
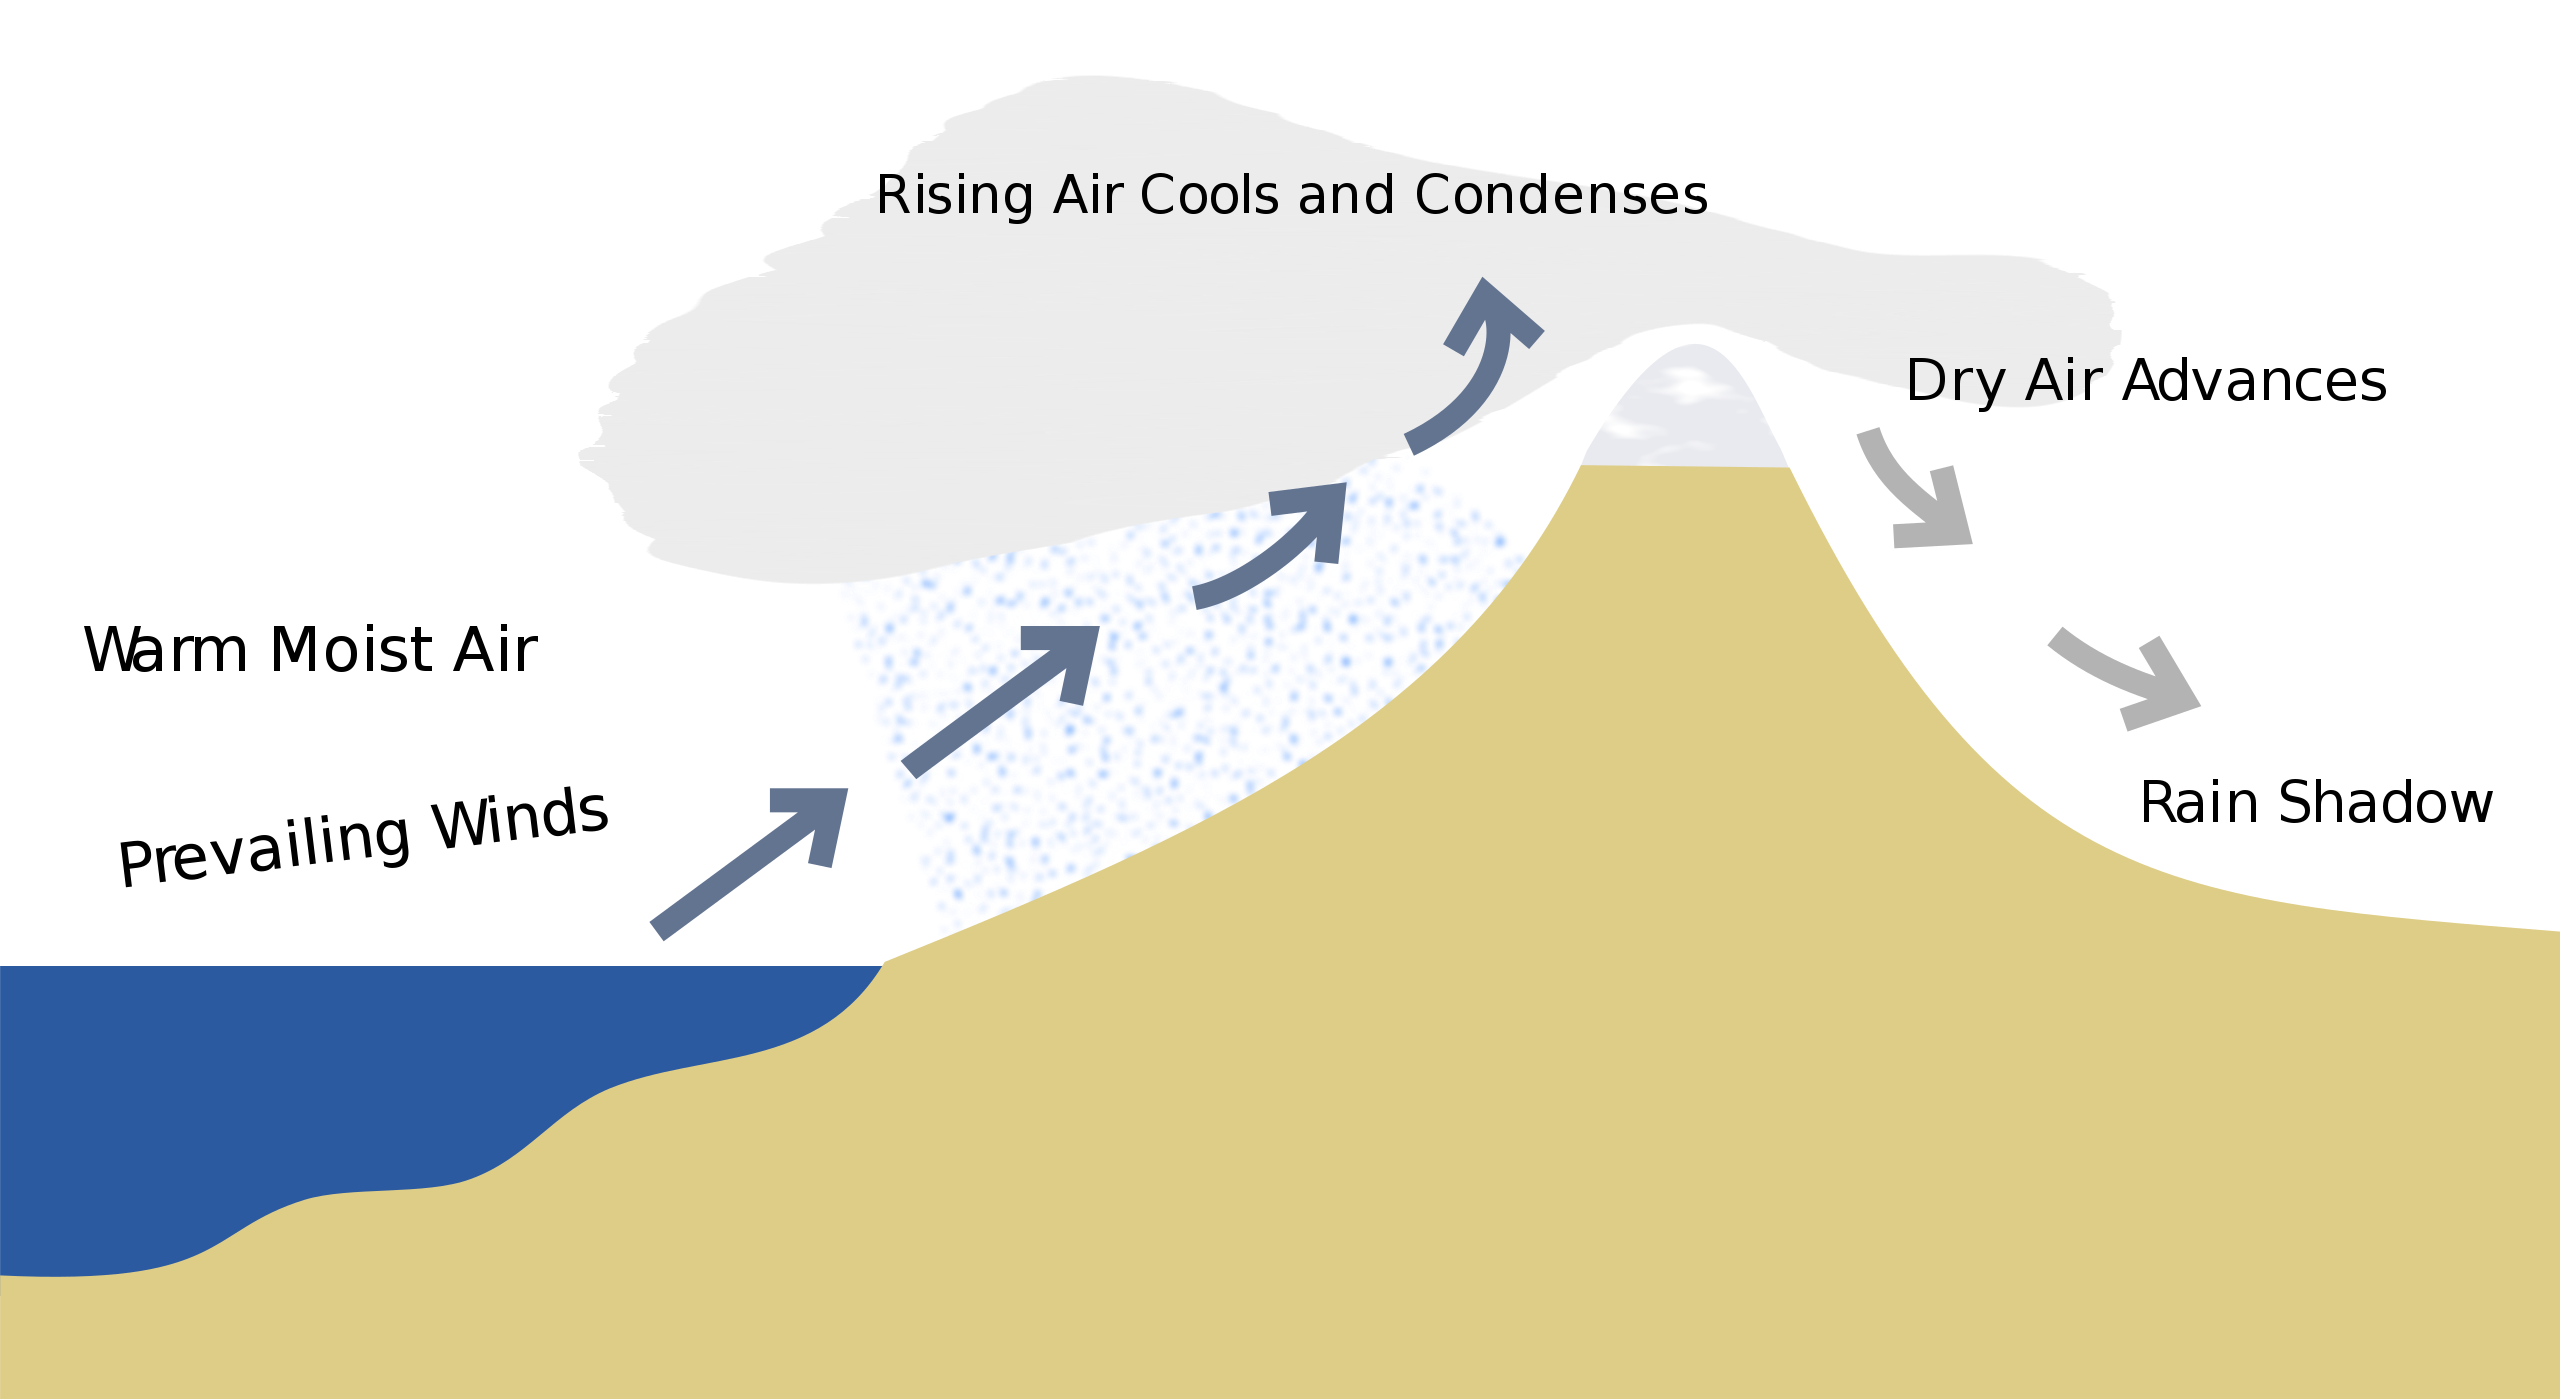
Another type of desert is found in the rain shadow created from prevailing winds blowing over mountain ranges. As the wind drives air up and over mountains, atmospheric moisture is released as snow or rain. Atmospheric pressure is lower at higher elevations, causing the moisture-laden air to cool. Cool air holds less moisture than hot air, and precipitation occurs as the wind rises up the mountain. After releasing its moisture on the windward side of the mountains, the dry air descends on the leeward or downwind side of the mountains to create an arid region with little precipitation called a rain shadow. Examples of rain-shadow deserts include the Western Interior Desert of North America and Atacama Desert of Chile, which is the Earth’s driest, warm desert.
Finally, polar deserts, such as vast areas of the Antarctic and Arctic, are created from sinking cold air that is too cold to hold much moisture. Although they are covered with ice and snow, these deserts have very low average annual precipitation. As a result, Antarctica is Earth’s driest continent.

Video 13.1: Rain shadow.
If you are using an offline version of this text, access this YouTube video via the QR code.
13.1 The Origin of Deserts
13.1.1 Atmospheric Circulation
Geographic location, atmospheric circulation, and the Earth’s rotation are the primary causal factors of deserts. Solar energy converted to heat is the engine that drives the circulation of air in the atmosphere and water in the oceans. The strength of the circulation is determined by how much energy is absorbed by the Earth’s surface, which in turn is dependent on the average position of the Sun relative to the Earth. In other words, the Earth is heated unevenly depending on latitude and angle of incidence. Latitude is a line circling the Earth parallel to the equator and is measured in degrees. The equator is 0° and the North and South Poles are 90° N and 90° S respectively (see the diagram of generalized atmospheric circulation on Earth). Angle of incidence is the angle made by a ray of sunlight shining on the Earth’s surface. Tropical zones are located near the equator, where the latitude and angle of incidence are close to 0°, and receive high amounts of solar energy. The poles, which have latitudes and angles of incidence approaching 90°, receive little or almost no energy.
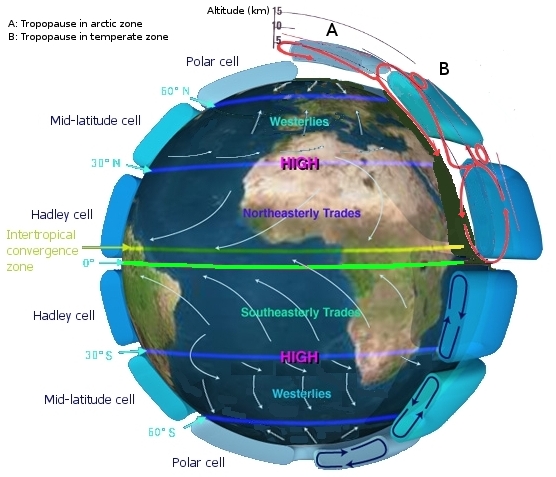
The figure shows the generalized air circulation within the atmosphere. Three cells of circulating air span the space between the equator and poles in both hemispheres, the Hadley Cell, the Ferrel or Midlatitude Cell, and the Polar Cell. In the Hadley Cell located over the tropics and closest to the equatorial belt, the sun heats the air and causes it to rise. The rising air cools and releases its contained moisture as tropical rain. The rising dried air spreads away from the equator and toward the north and south poles, where it collides with dry air in the Ferrel Cell. The combined dry air sinks back to the Earth at 30° latitude. This sinking drier air creates belts of predominantly high pressure at approximately 30° north and south of the equator, called the horse latitudes. Arid zones between 15o and 30o north and south of the equator thus exist within which desert conditions predominate. The descending air flowing north and south in the Hadley and Ferrel cells also creates prevailing winds called trade winds near the equator, and westerlies in the temperate zone. Note the arrows indicating general directions of winds in these zones.
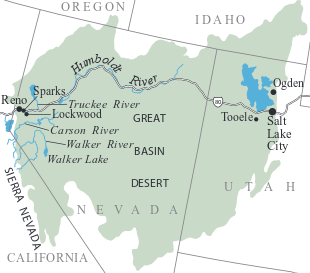
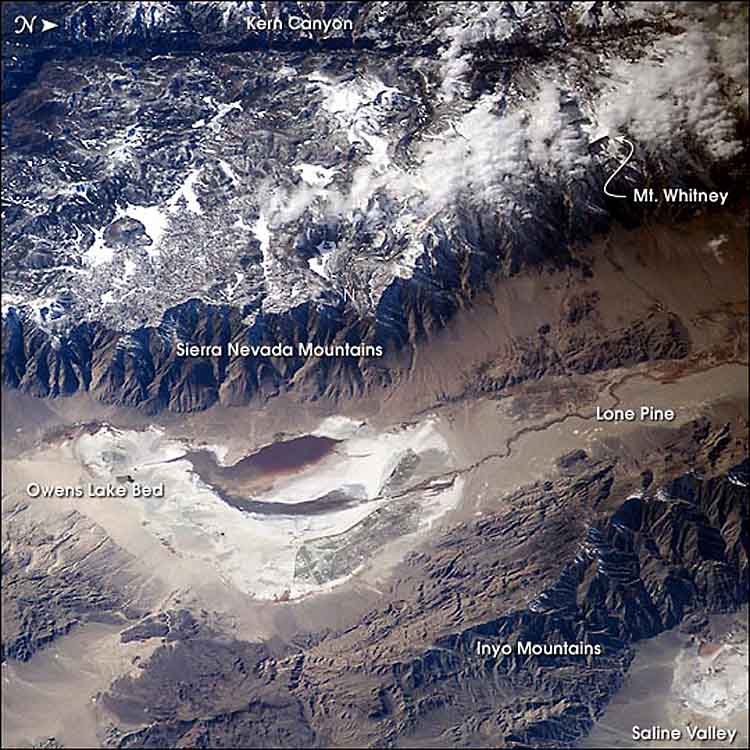
Other deserts, like the Great Basin Desert that covers parts of Utah and Nevada, owe at least part of their origin to other atmospheric phenomena. The Great Basin Desert, while somewhat affected by sinking air effects from global circulation, is a rain-shadow desert. As westerly moist air from the Pacific rises over the Sierra Nevada and other mountains, it cools and loses moisture as condensation and precipitation on the upwind or rainy side of the mountains.
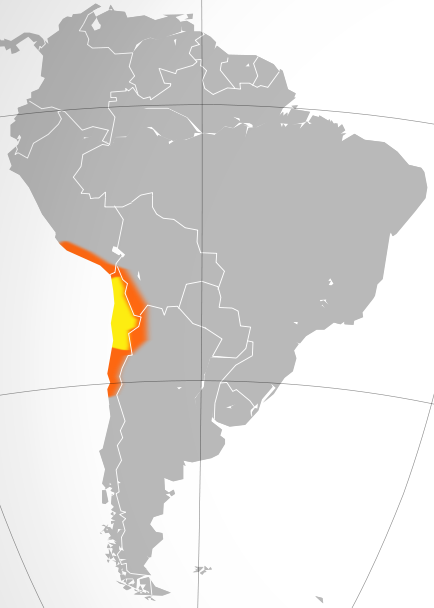
One of the driest places on Earth is the Atacama Desert of northern Chile. The Atacama Desert occupies a strip of land along Chile’s coast just north of latitude 30°S, at the southern edge of the trade-wind belt. The desert lies west of the Andes Mountains, in the rain shadow created by prevailing trade winds blowing west. As this warm moist air crossing the Amazon basin meets the eastern edge of the mountains, it rises, cools, and precipitates much of its water out as rain. Once over the mountains, the cool, dry air descends onto the Atacama desert. Onshore winds from the Pacific are cooled by the Peru (Humboldt) ocean current. This super-cooled air holds almost no moisture and, with these three factors, some locations in the Atacama Desert have received no measured precipitation for several years. This desert is the driest, non-polar location on Earth.
Notice in the figure that the polar regions are also areas of predominantly high pressure created by descending cold dry air, the Polar Cells. As with the other cells, cold air, which holds much less moisture than warm air, descends to create polar deserts. This is why historically, land near the north and south poles has always been so dry.
13.1.2 Coriolis Effect

The Earth rotates toward the east where the sun rises. Think of spinning a weight on a string around your head. The speed of the weight depends on the length of the string. The speed of an object on the rotating Earth depends on its horizontal distance from the Earth’s axis of rotation. Higher latitudes are a smaller distance from the Earth’s rotational axis, and therefore do not travel as fast eastward as lower latitudes that are closer to the equator. When a fluid like air or water moves from a lower latitude to a higher latitude, the fluid maintains its momentum from moving at a higher speed, so it will travel relatively faster eastward than the Earth beneath at the higher latitudes. This factor causes deflection of movements that occur in north-south directions.
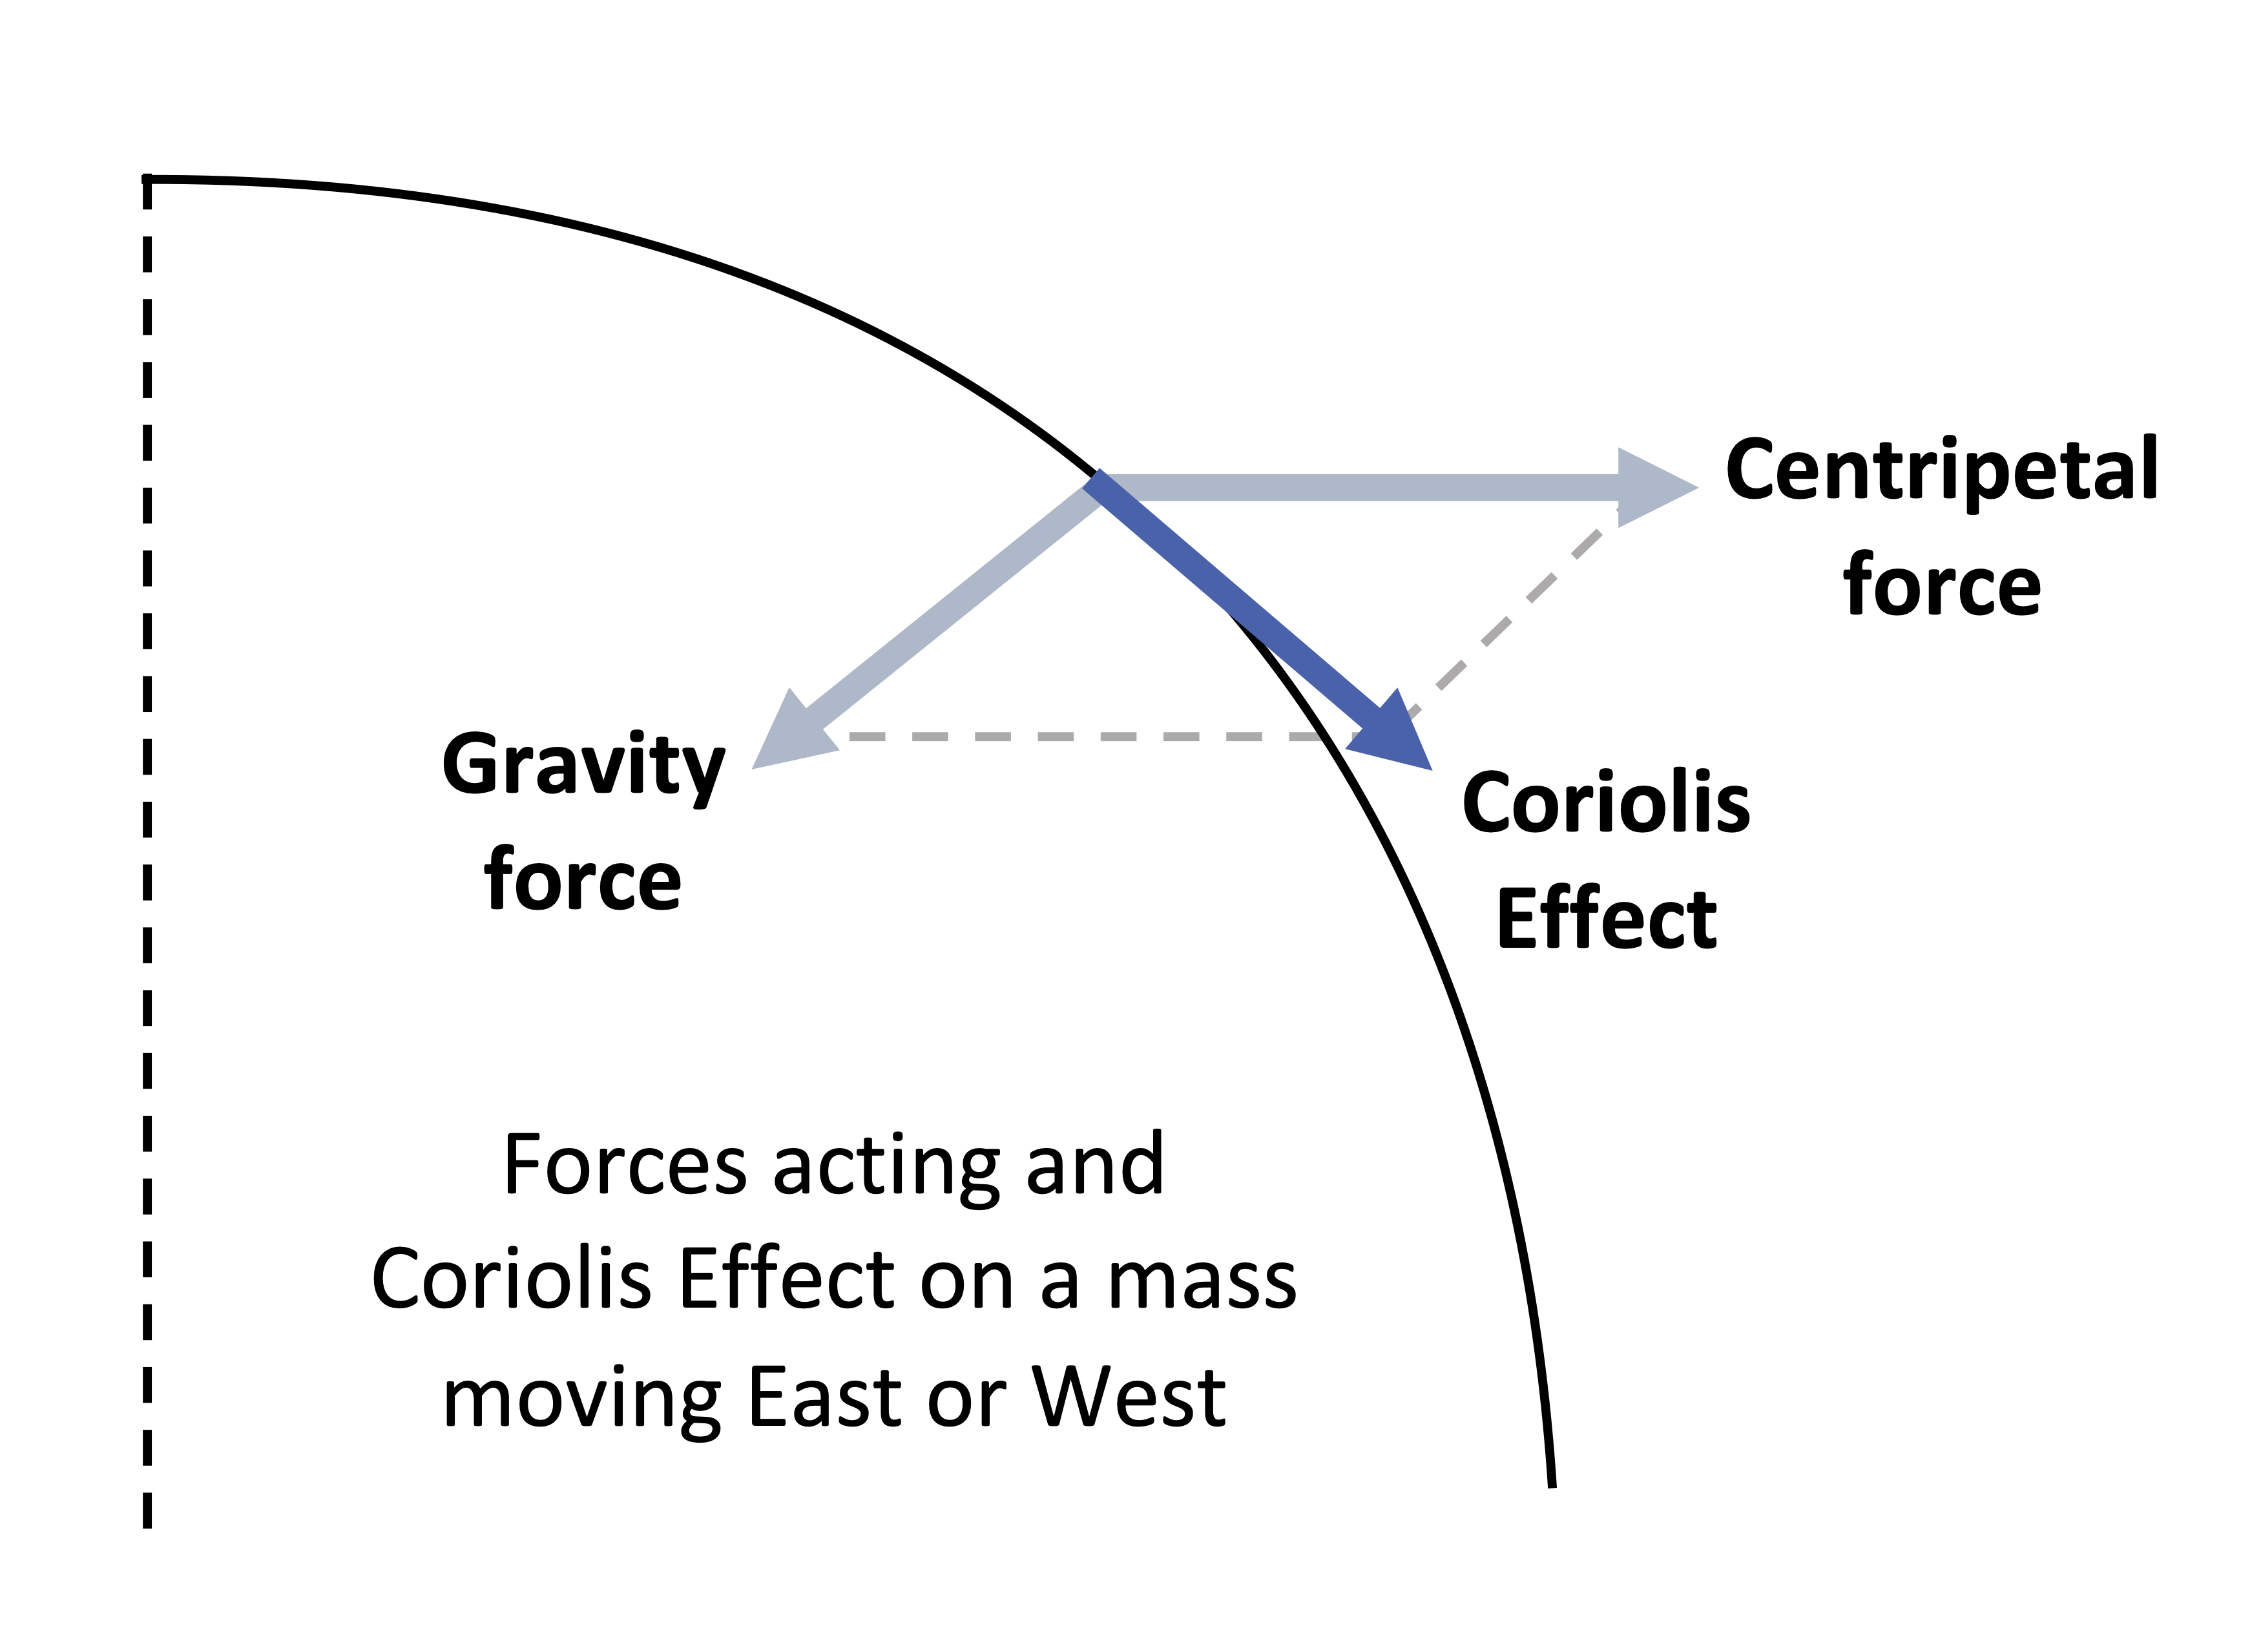
Another factor in the Coriolis effect also causes deflection of east-west movement due to the angle between the centripetal effect of Earth’s spin and gravity pulling toward the earth’s center (see figure 13.9). This produces a net deflection toward the equator. The total Coriolis deflection on a mass moving in any direction on the rotating Earth results from a combination of these two factors.
Since each hemisphere has three atmospheric cells moving respectively north and south relative to the Earth beneath them, the Coriolis effect deflects these moving air masses to the right in the Northern Hemisphere and to the left in the Southern Hemisphere. The Coriolis effect also deflects moving masses of water in the ocean currents.
For example, in the northern hemisphere Hadley Cell, the lower altitude air currents are flowing south towards the equator. These are deflected to the right (or west) by the Coriolis effect. This deflected air generates the prevailing trade winds that European sailors used to cross the Atlantic Ocean and reach South America and the Caribbean Islands in their tall ships. This air movement is mirrored in the Hadley Cell in the southern hemisphere; the lower altitude air current flowing equatorward is deflected to the left, creating trade winds that blow to the northwest.
In the northern Mid-Latitude or Ferrel Cell, surface air currents flow from the horse latitudes (latitude 30°) toward the North Pole, and the Coriolis effect deflects them toward the east, or to the right, producing the zone of westerly winds. In the southern hemisphere Mid-Latitude or Ferrel Cell, the poleward flowing surface air is deflected to the left and flows southeast creating the Southern Hemisphere westerlies.
Another Coriolis-generated deflection produces the Polar Cells. At 60o north and south latitude, relatively warmer rising air flows poleward cooling and converging at the poles where it sinks in the polar high. This sinking dry air creates the polar deserts, the driest deserts on Earth. Persistence of ice and snow is a result of cold temperatures at these dry locations.
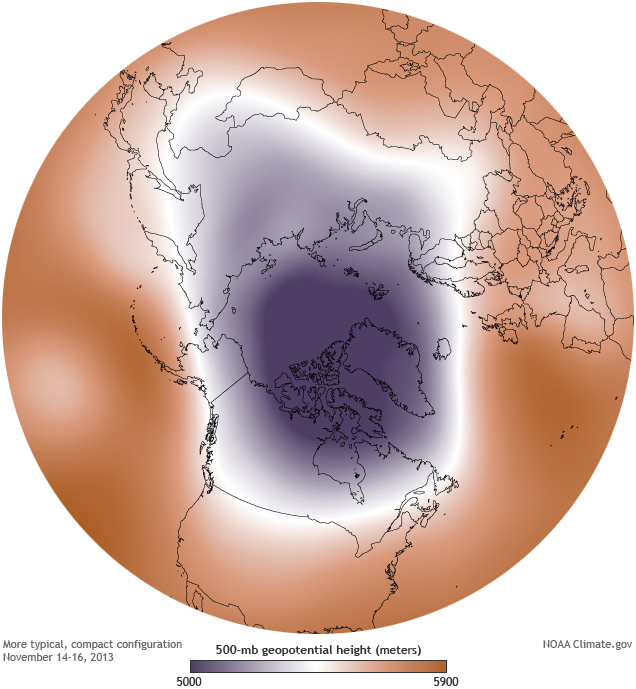
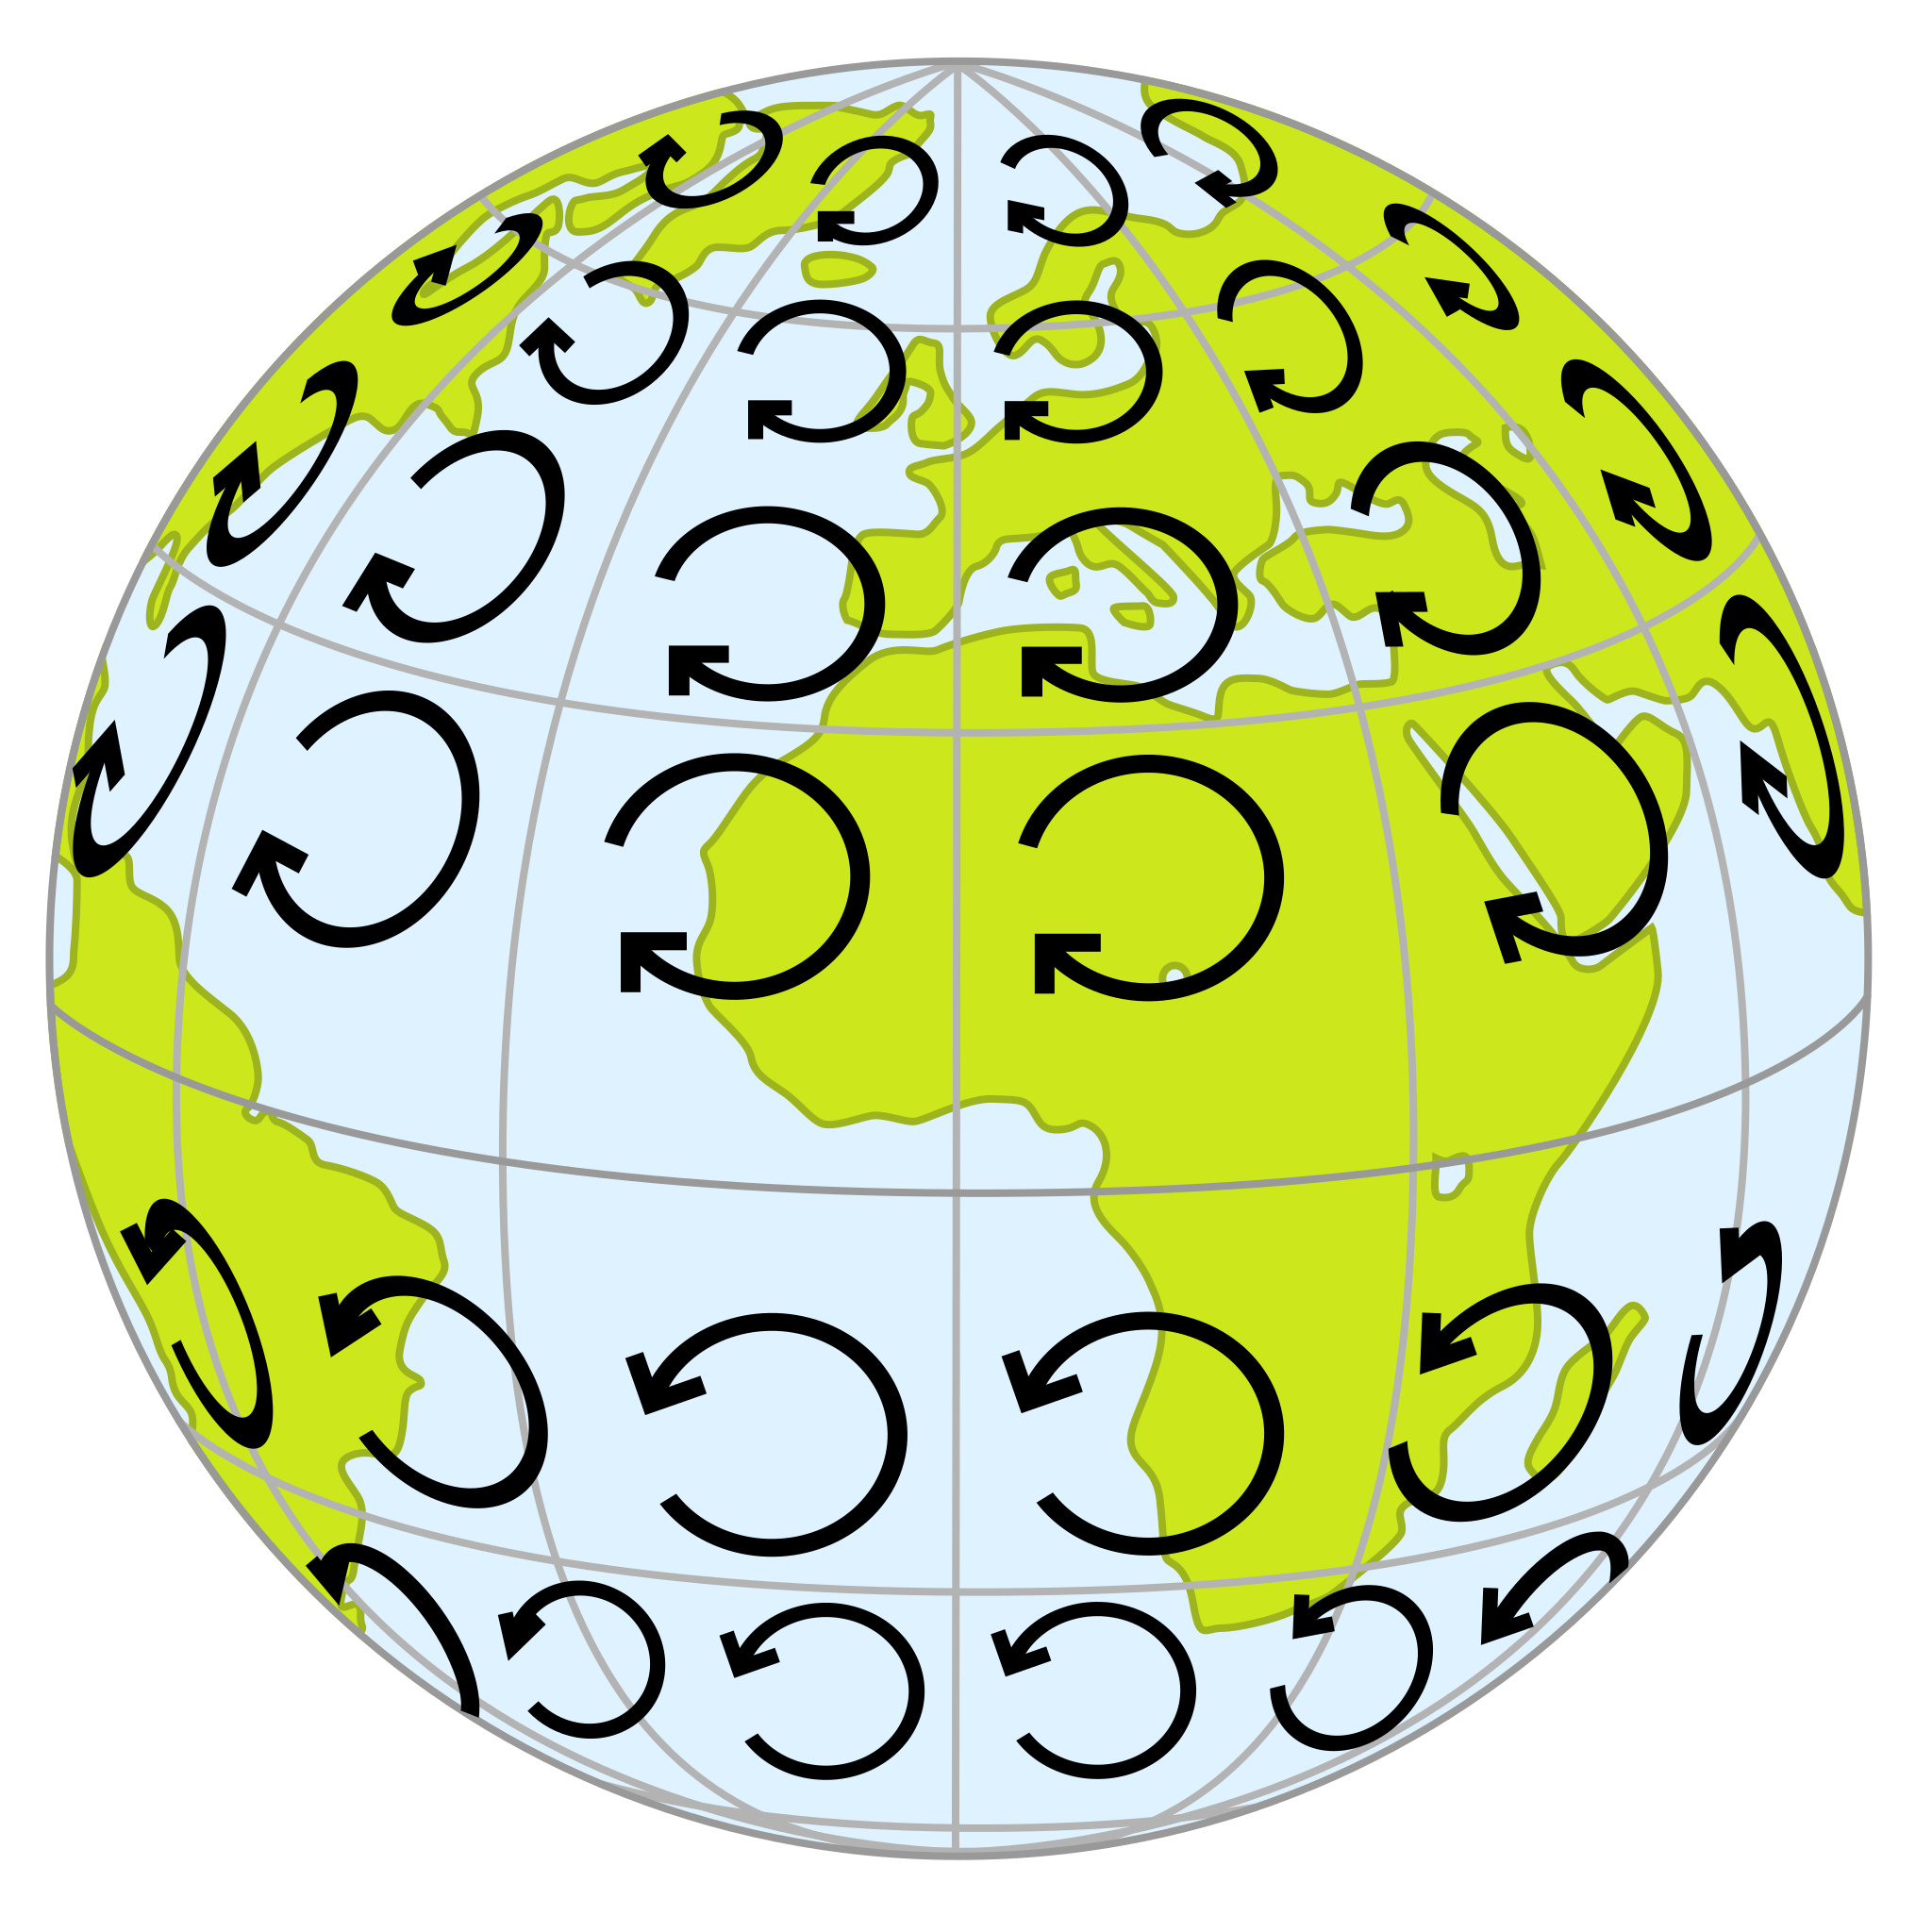
The Coriolis effect operates on all motions on the Earth. Artillerymen must take the Coriolis effect into account on ballistic trajectories when making long-distance targeting calculations. Geologists note how its effect on air and oceanic currents creates deserts in designated zones around the Earth as well as the surface currents in the ocean. The Coriolis effect causes the ocean gyres to turn clockwise in the northern hemisphere and counterclockwise in the southern. It also affects weather by creating high-altitude, polar jet streams that sometimes push lobes of cold arctic air into the temperate zone, down to as far as latitude 30° from the usual 60°. It also causes low pressure systems and intense tropical storms to rotate counter-clockwise in the Northern Hemisphere and clockwise in the Southern Hemisphere.

Video 13.2: The Coriolis effect.
If you are using an offline version of this text, access this YouTube video via the QR code.

Take this quiz to check your comprehension of this section.
If you are using an offline version of this text, access the quiz for section 13.1 via the QR code.
13.2 Desert Weathering and Erosion
Weathering takes place in desert climates by the same means as other climates, only at a slower rate. While higher temperatures typically spur faster chemical weathering, water is the main agent of weathering, and lack of water slows both mechanical and chemical weathering. Low precipitation levels also mean less runoff as well as ice wedging. When precipitation does occur in the desert, it is often heavy and may result in flash floods in which a lot of material may be dislodged and moved quickly.
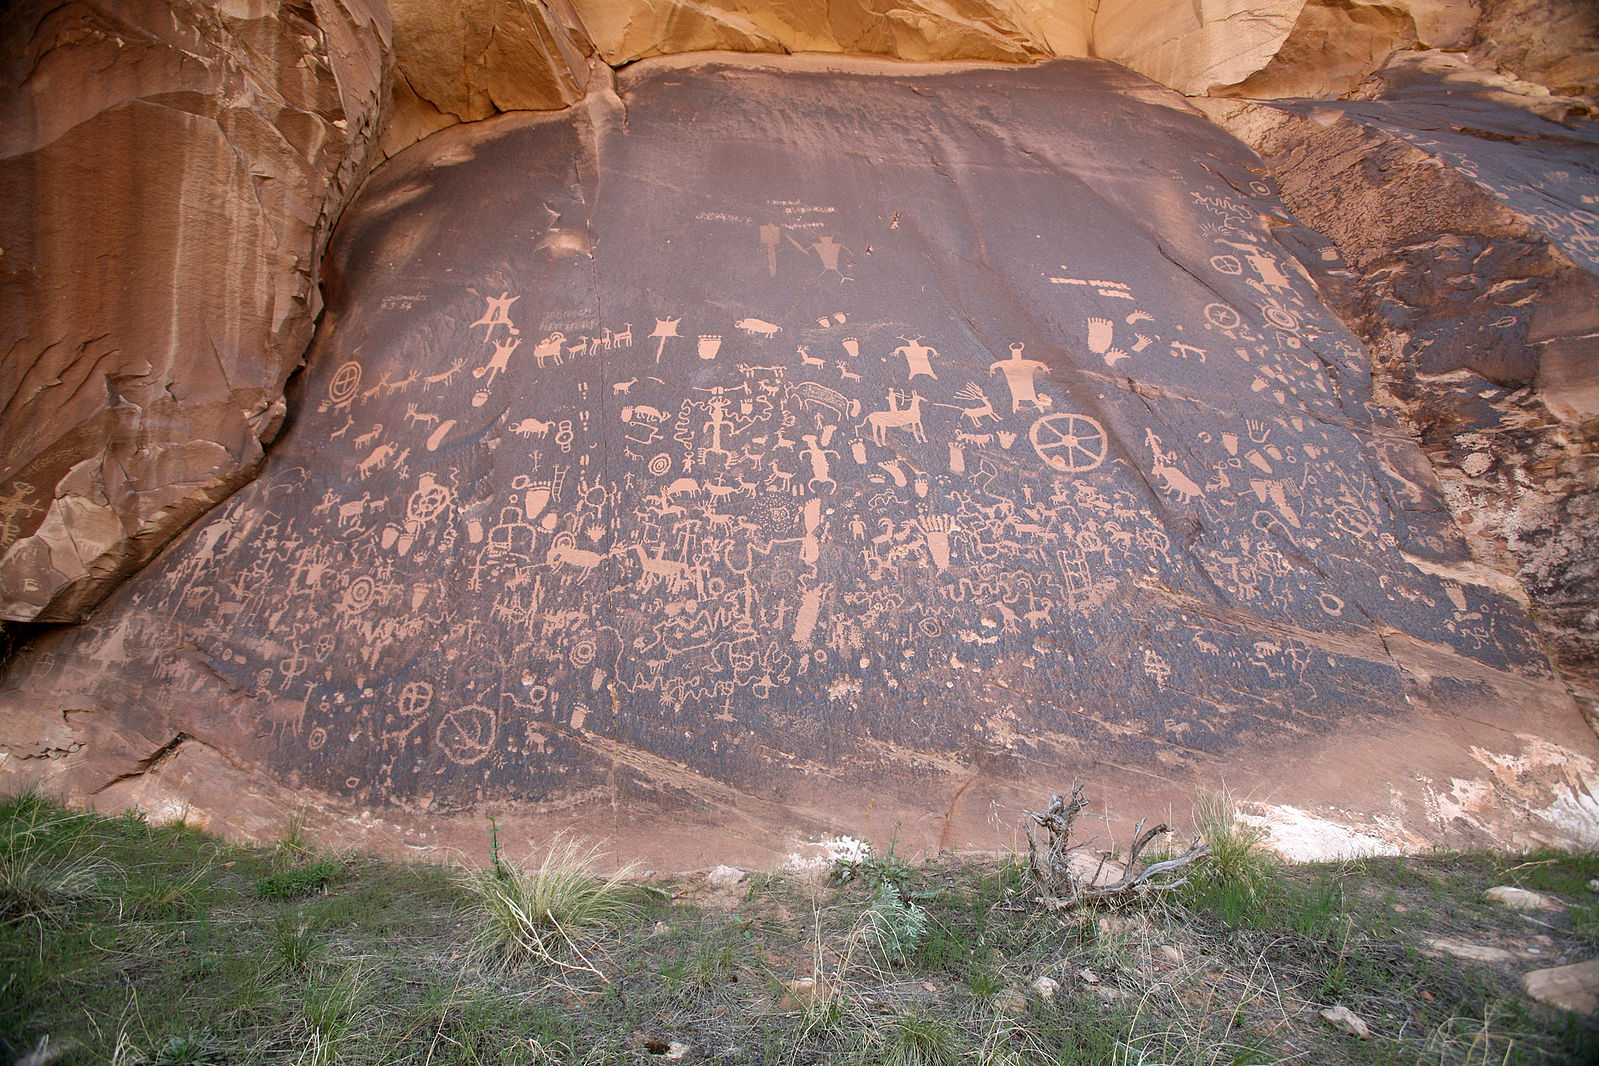
One unique weathering product in deserts is desert varnish. Also known as desert patina or rock rust, this is thin dark brown layers of clay minerals and iron and manganese oxides that form on very stable surfaces within arid environments. The exact way this material forms is still unknown, though cosmogenic and biologic mechanisms have been proposed.
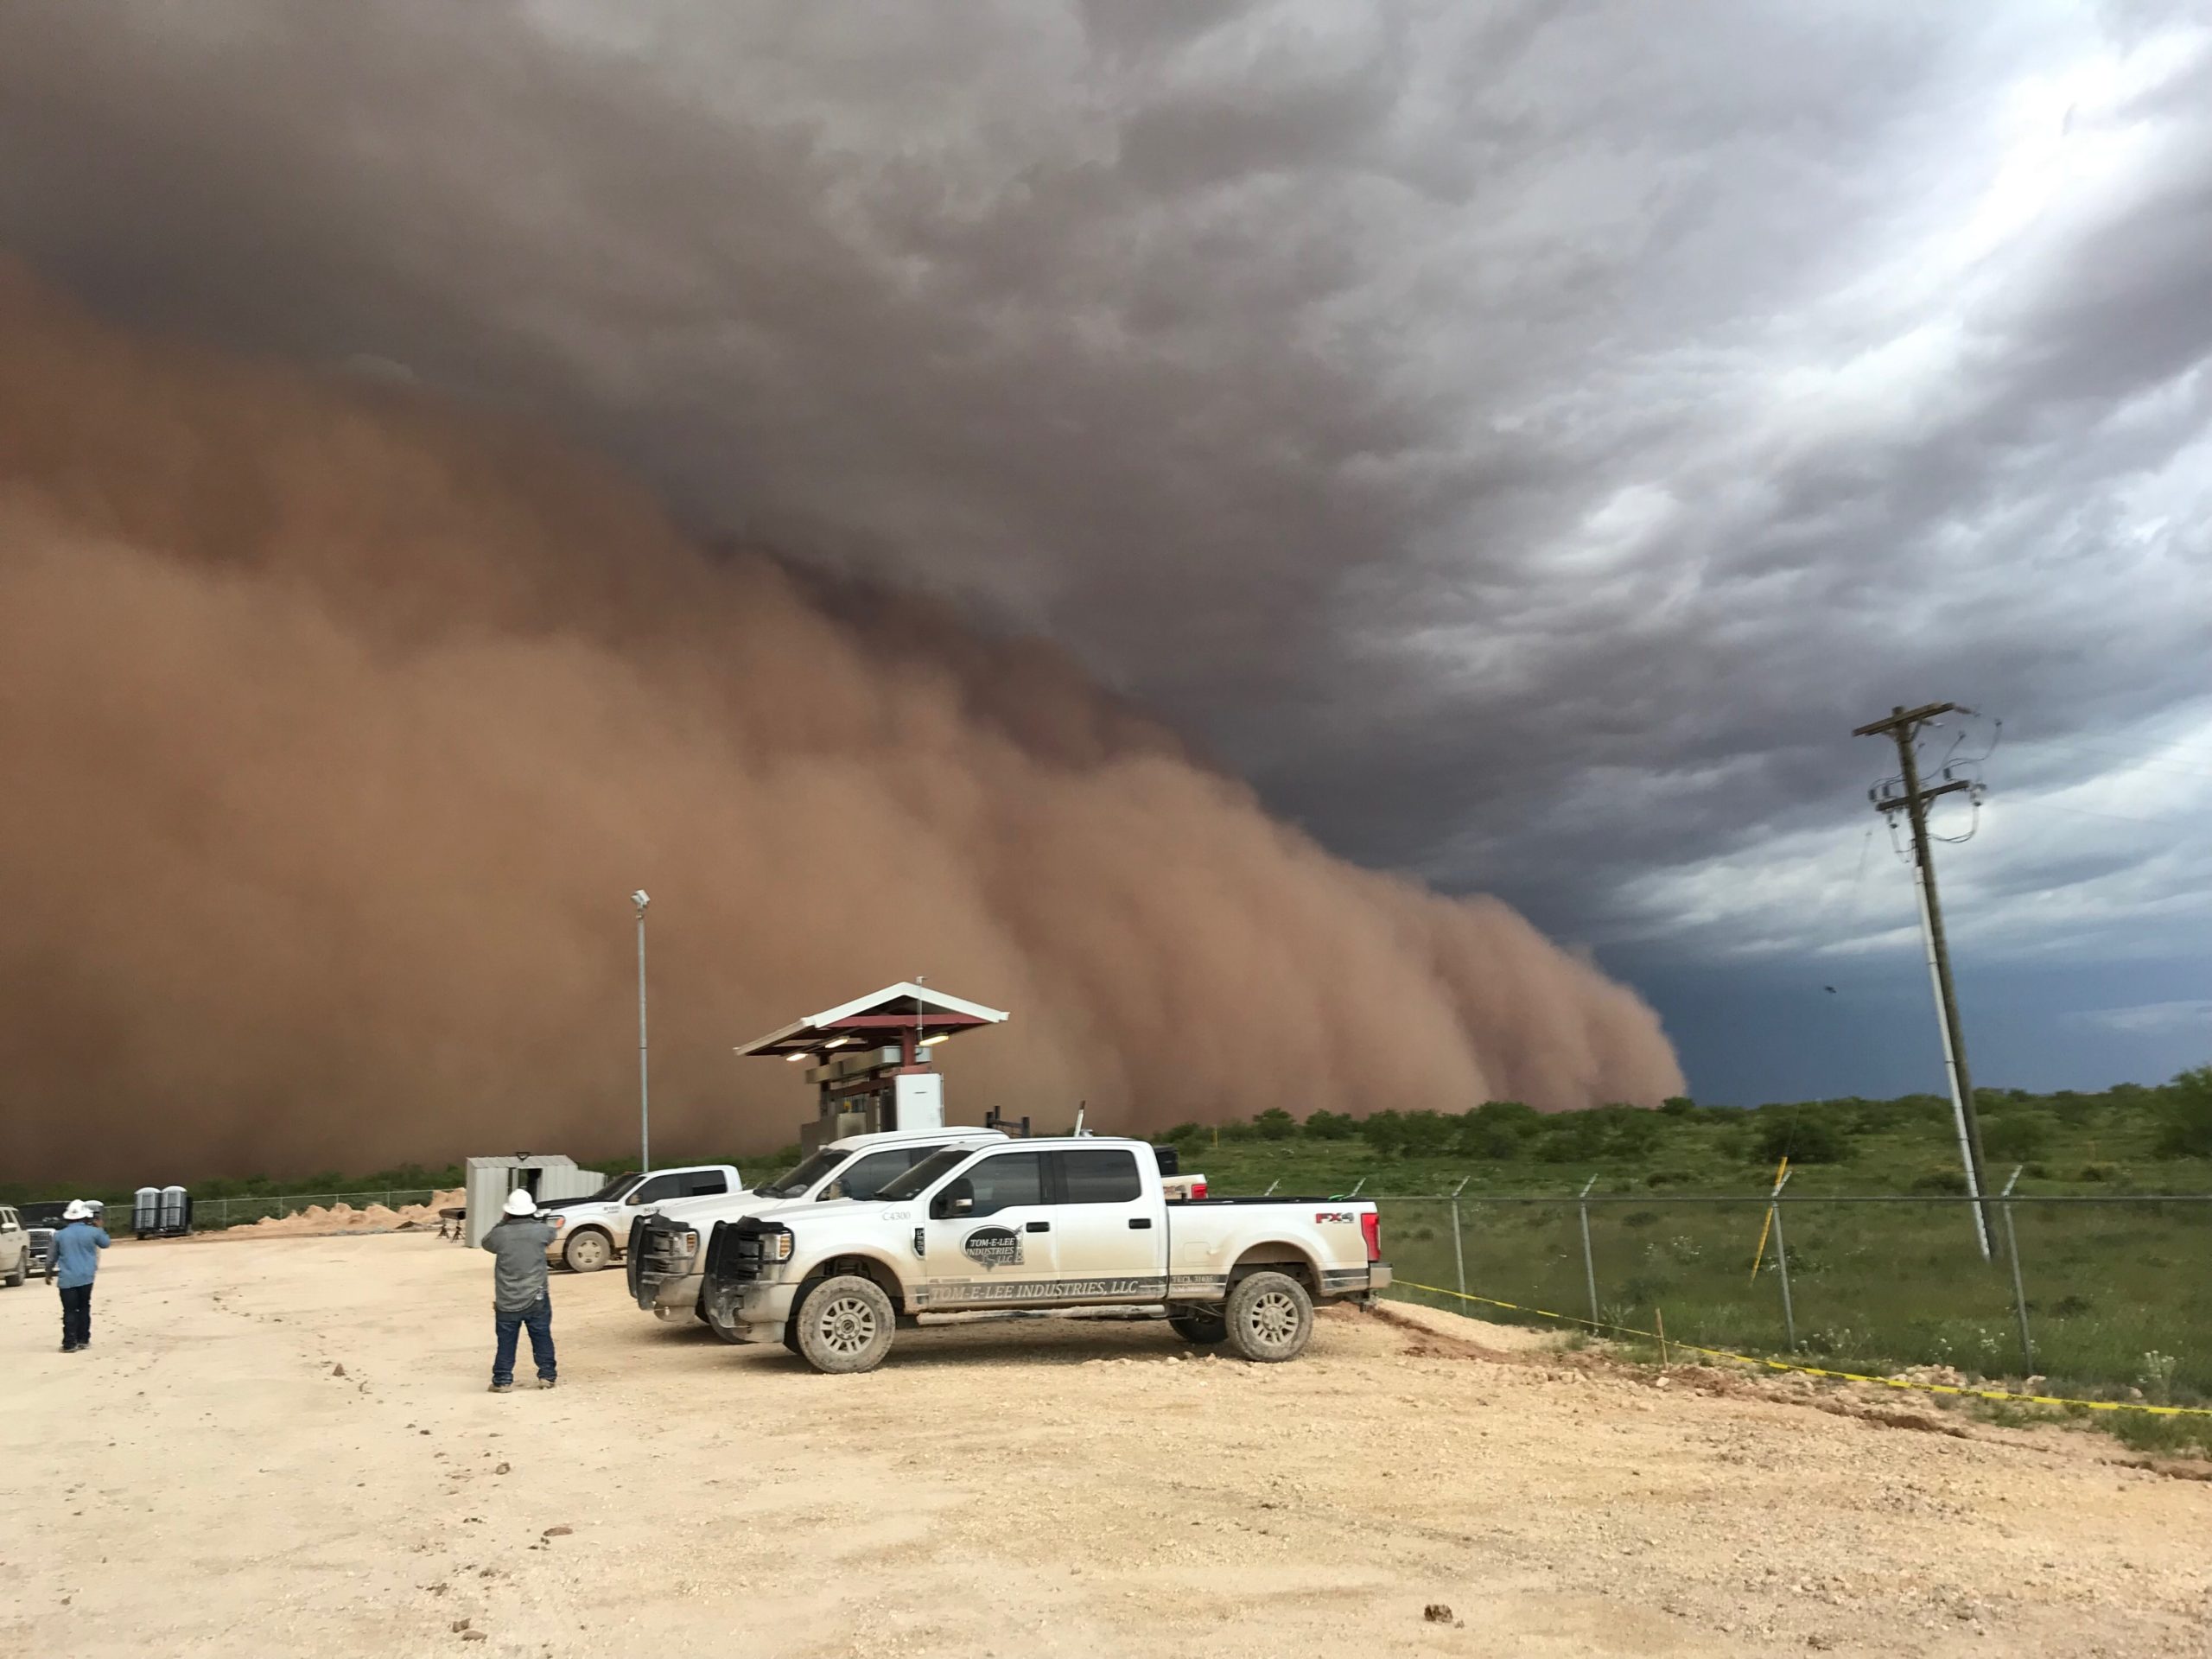
While water is still the dominant agent of erosion in most desert environments, wind is a notable agent of weathering and erosion in many deserts. This includes suspended sediment traveling in haboobs, or large dust storms, that frequent deserts. Deposits of windblown dust are called loess. Loess deposits cover wide areas of the midwestern United States, much of it from rock flour that melted out of the ice sheets during the last ice age. Loess was also blown from desert regions in the West. Possessing lower energy than water, wind transport nevertheless moves sand, silt, and dust. As noted in chapter 11, the load carried by a fluid (air is a fluid like water) is distributed among bedload and suspended load. As with water, in wind these components depend on wind velocity.
Sand size material moves by a process called saltation in which sand grains are lifted into the moving air and carried a short distance where they drop and splash into the surface dislodging other sand grains which are then carried a short distance and splash dislodging still others.
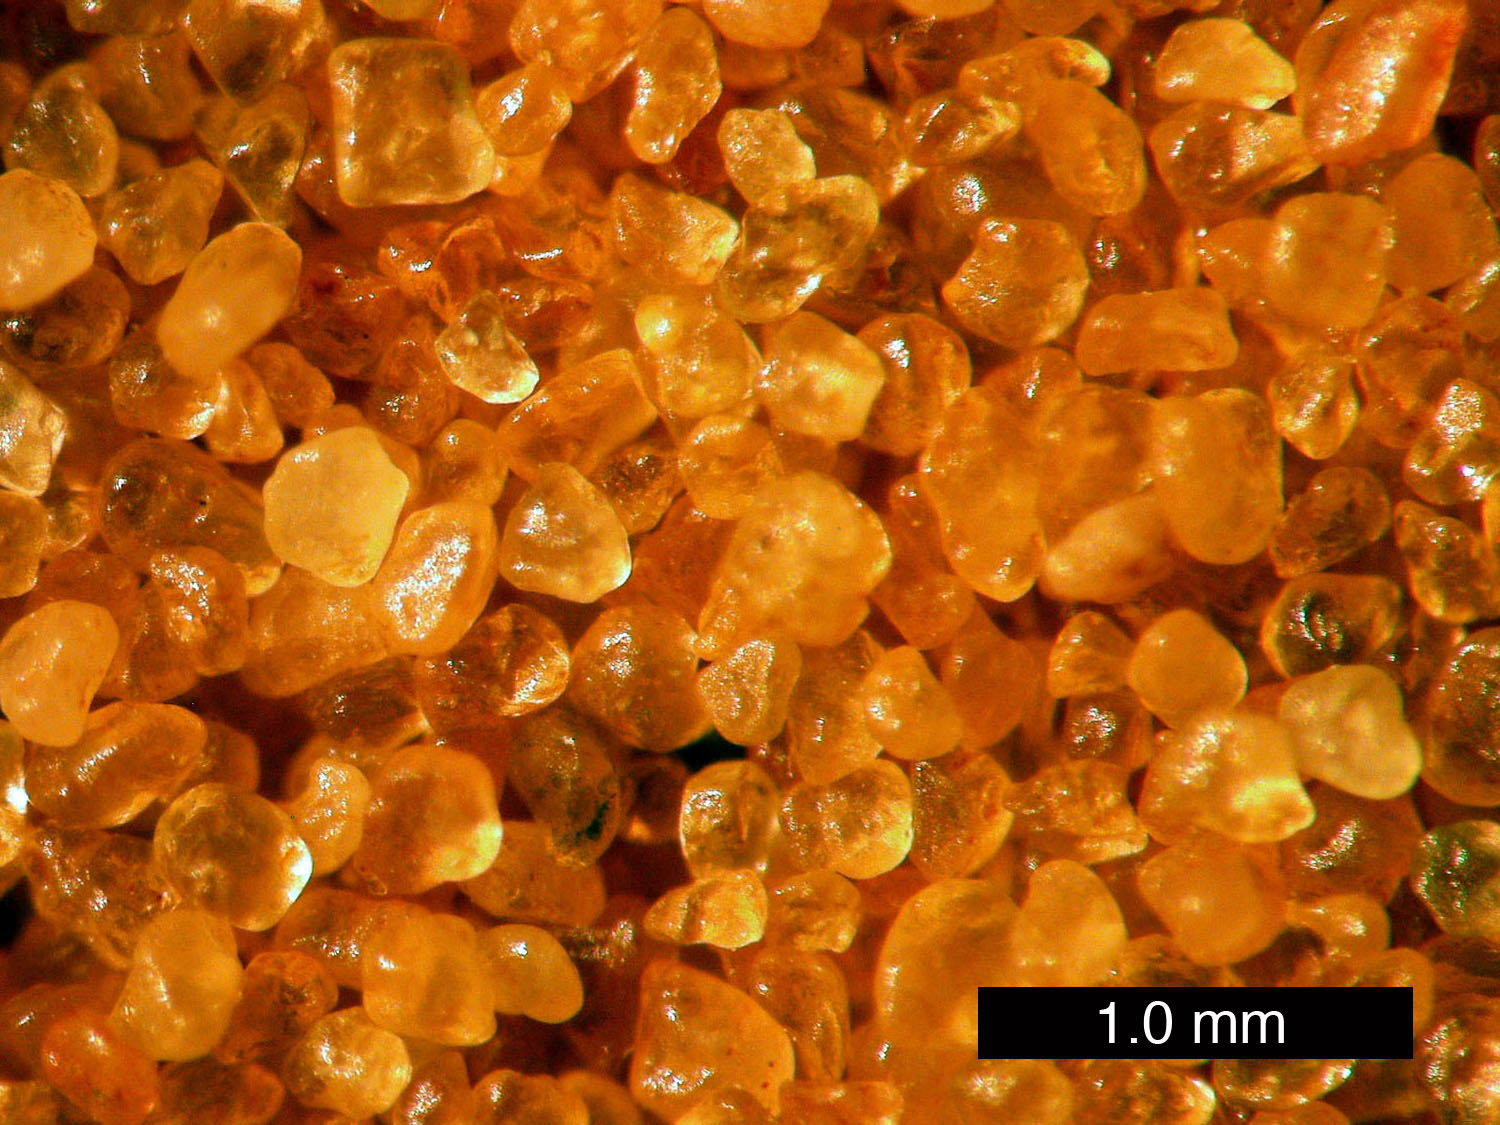
Since saltating sand grains are constantly impacting other sand grains, wind blown sand grains are commonly quite well rounded with frosted surfaces. Saltation is a cascading effect of sand movement creating a zone of wind blown sand up to a meter or so above the ground. This zone of saltating sand is a powerful erosive agent in which bedrock features are effectively sandblasted. The fine-grained suspended load is effectively sorted from the sand near the surface carrying the silt and dust into haboobs. Wind is thus an effective sorting agent separating sand and dust sized (≤70 µm) particles (see chapter 5). When wind velocity is high enough to slide or roll materials along the surface, the process is called creep.
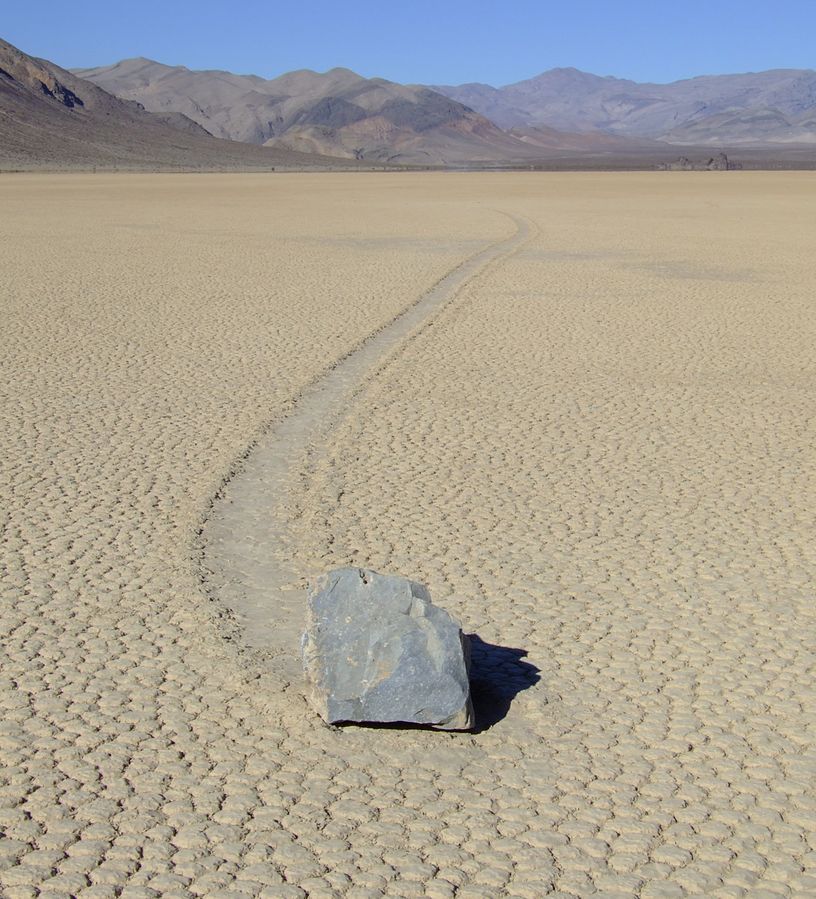
One extreme version of sediment movement was shrouded in mystery for years: Sliding stones. Also called sailing stones and sliding rocks, these are large moving boulders along flat surfaces in deserts, leaving trails. This includes the famous example of the Racetrack Playa in Death Valley National Park, California. For years, scientists and enthusiasts attempted to explain their movement, with little definitive results. In recent years, several experimental and observational studies have confirmed that the stones, imbedded in thin layers of ice, are propelled by friction from high winds. These studies include measurements of actual movement, as well as re-creations of the conditions, with resulting movement in the lab.

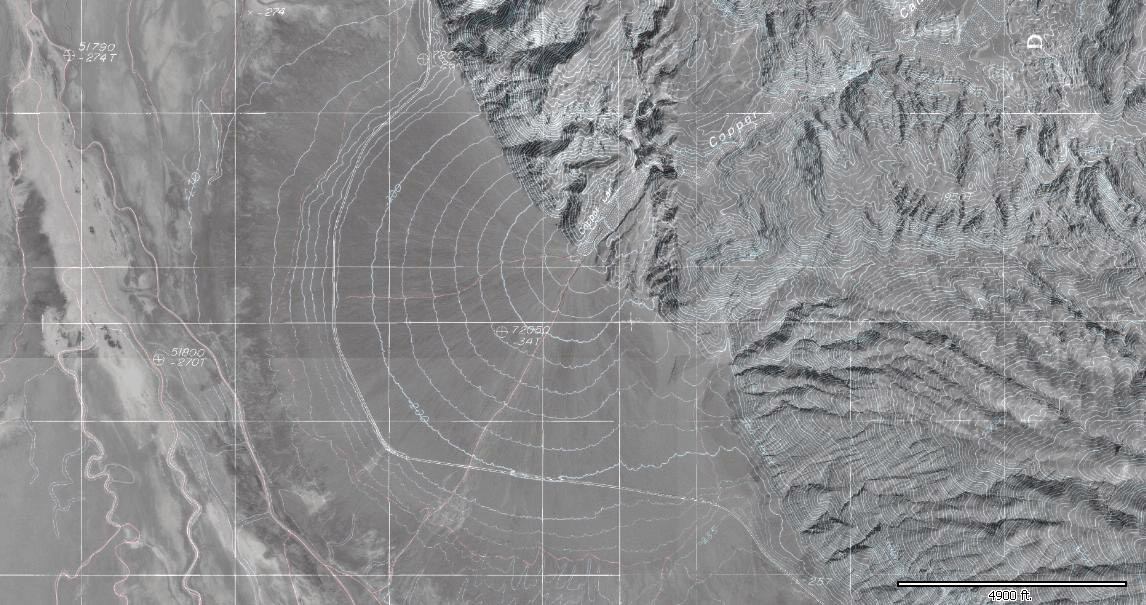
The zone of saltating sand is an effective agent of erosion through sand abrasion. A bedrock outcrop which has such a sandblasted shape is called a yardang. Rocks and boulders lying on the surface may be blasted and polished by saltating sand. When predominant wind directions shift, multiple sandblasted and polished faces may appear. Such wind abraded desert rocks are called ventifacts.
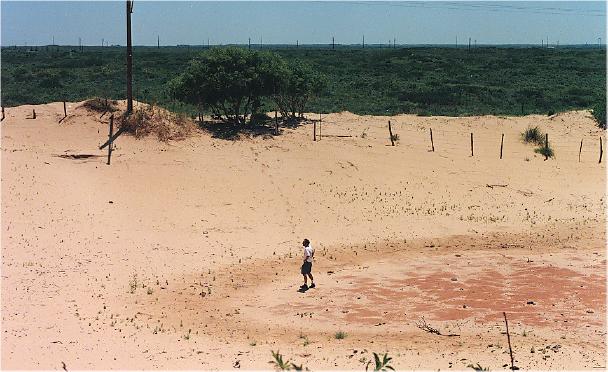
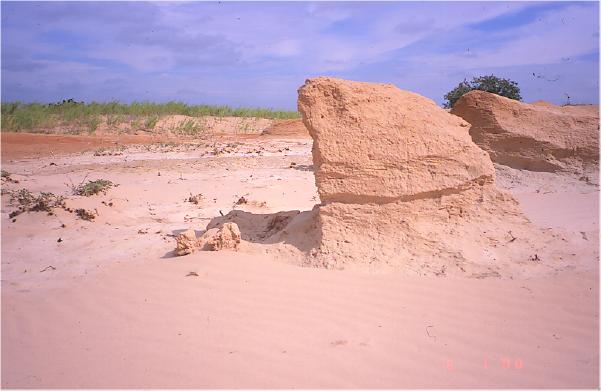
In places with sand and silt accumulations, clumps of vegetation often anchor sediment on the desert surface. Yet, winds may be sufficient to remove materials not anchored by vegetation. The bowl-shaped depression remaining on the surface is called a blowout.

Take this quiz to check your comprehension of this section.
If you are using an offline version of this text, access the quiz for section 13.2 via the QR code.
13.3 Desert Landforms
In the American Southwest, as streams emerge into the valleys from the adjacent mountains, they create desert landforms called alluvial fans. When the stream emerges from the narrow canyon, the flow is no longer constrained by the canyon walls and spreads out. At the lower slope angle, the water slows down and drops its coarser load. As the channel fills with this conglomeratic material, the stream is deflected around it. This deposited material deflects the stream into a system of radial distributary channels in a process similar to how a delta is made by a river entering a body of water. This process develops a system of radial distributaries and constructs a fan shaped feature called an alluvial fan.
Alluvial fans continue to grow and may eventually coalesce with neighboring fans to form an apron of alluvium along the mountain front called a bajada.
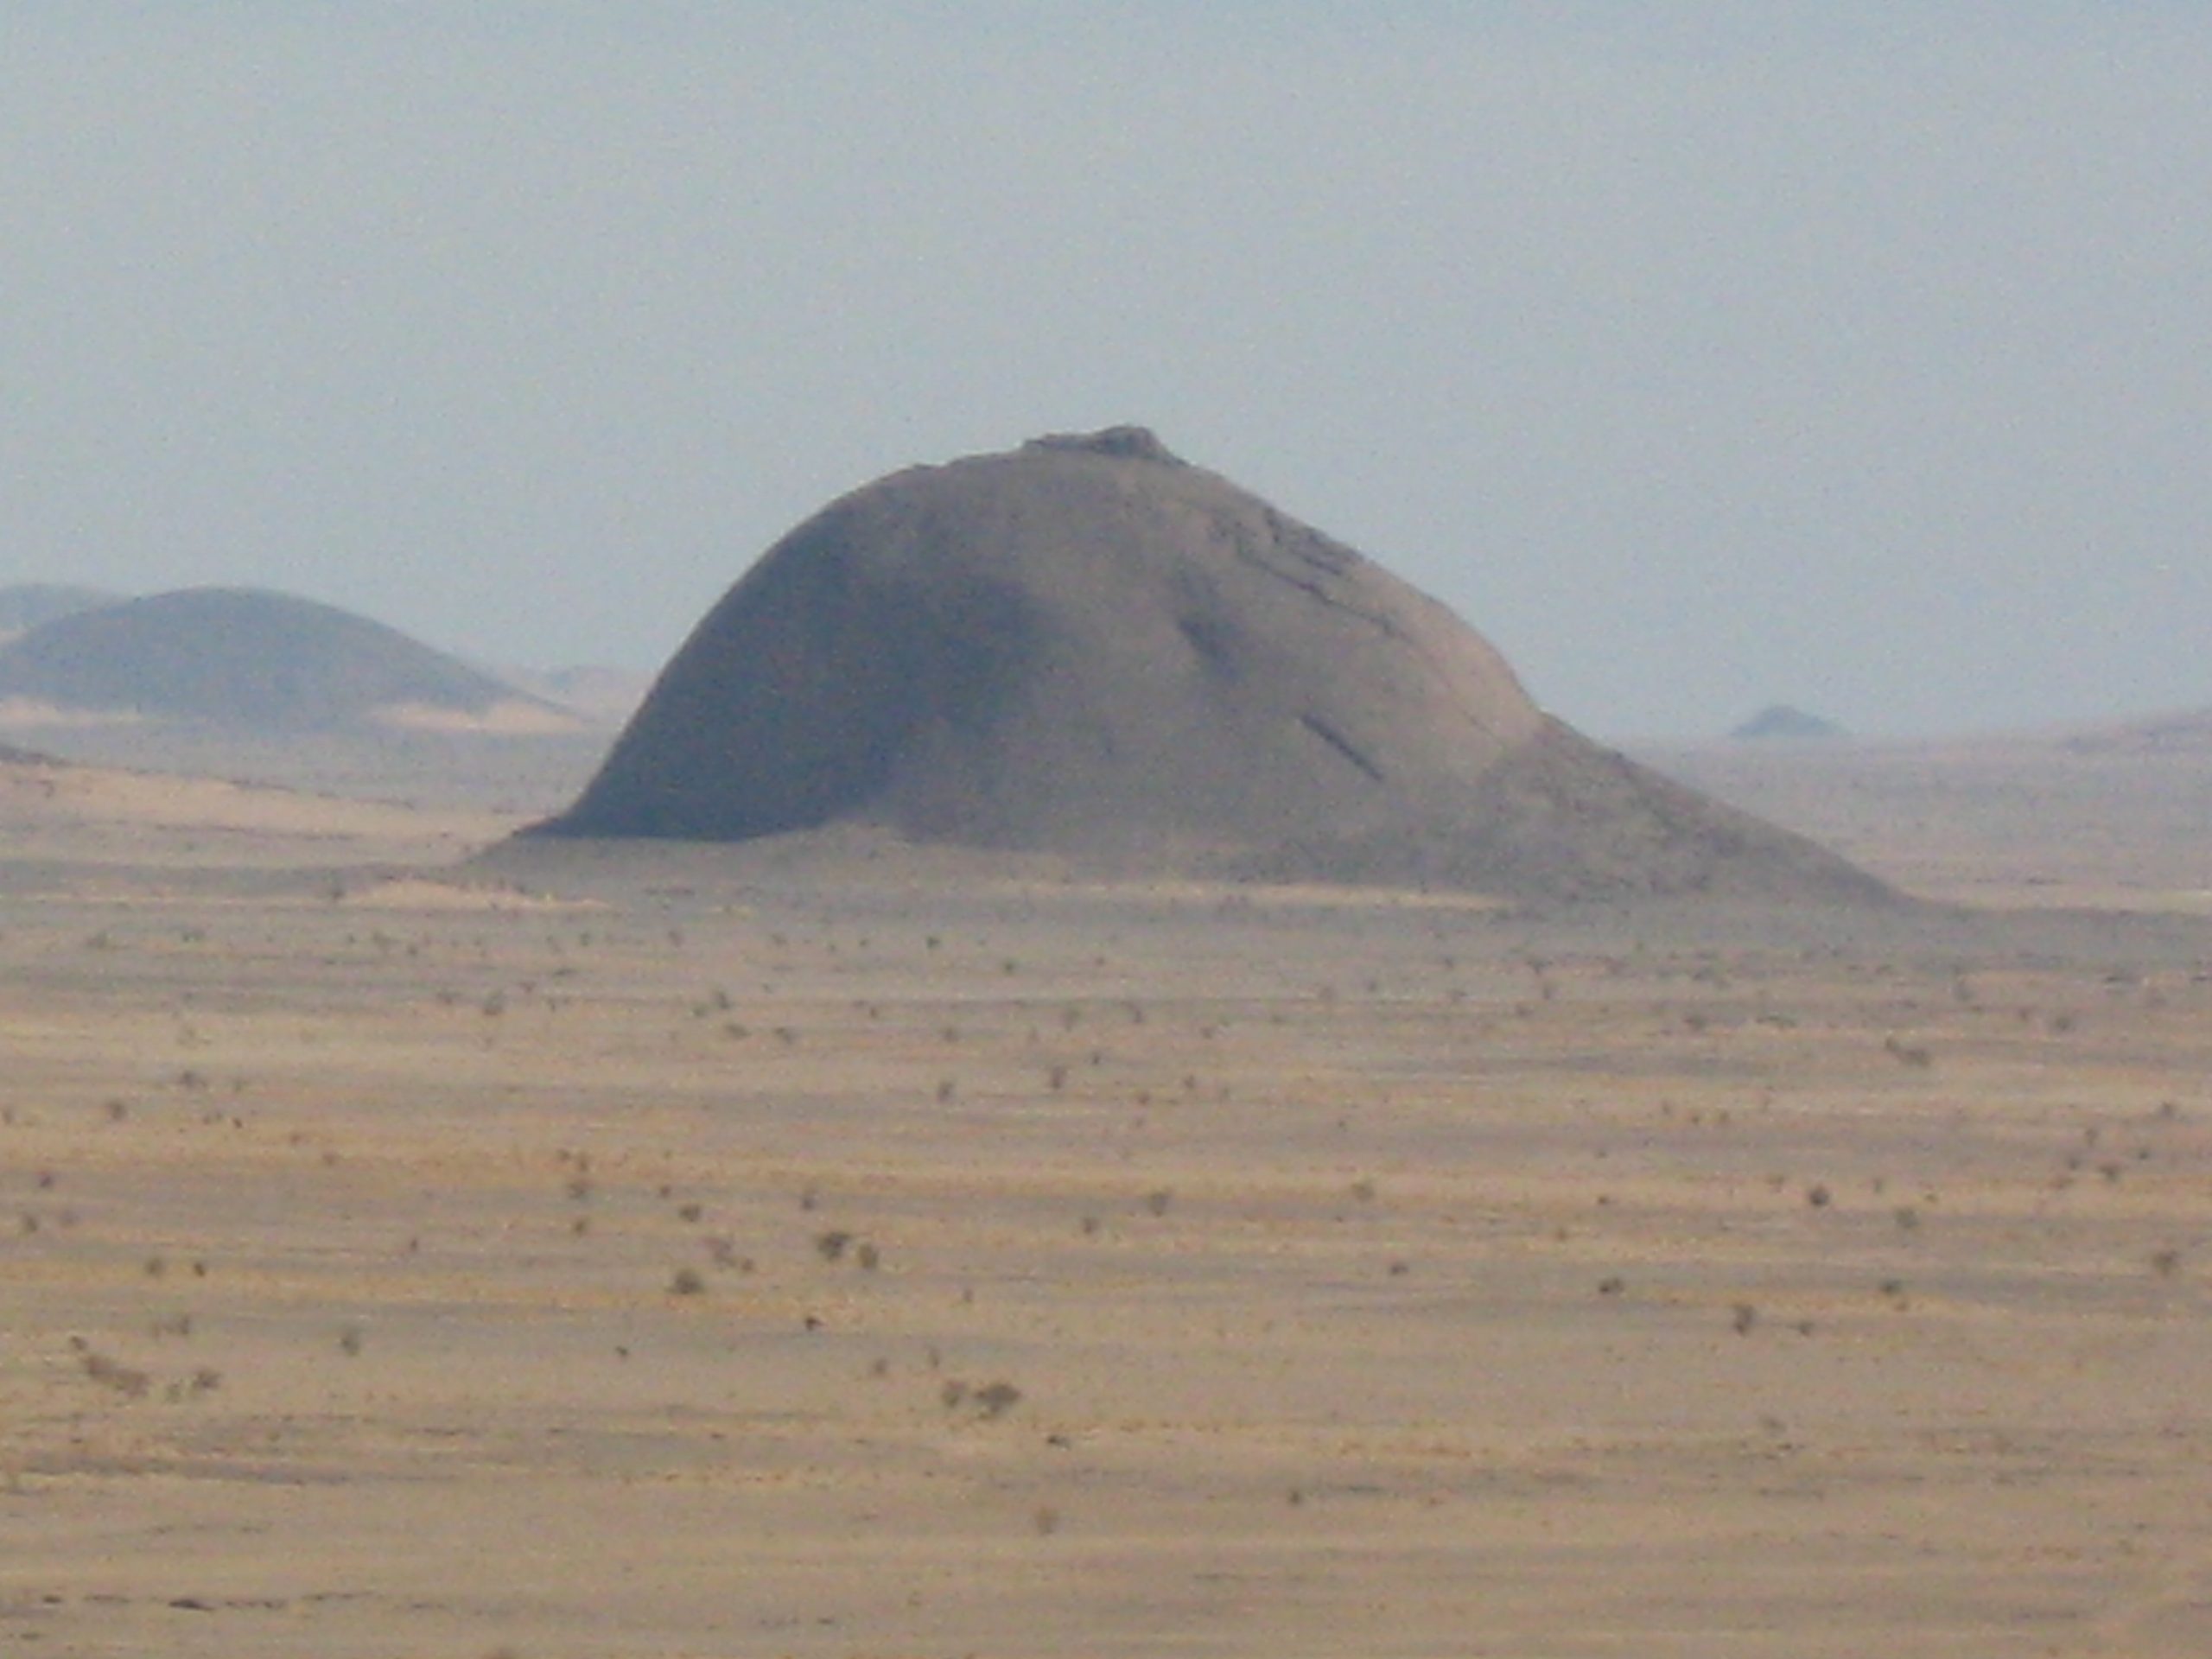
As the mountains erode away and their sediment accumulates first in alluvial fans, then bajadas, the mountains eventually are buried in their own erosional debris. Such buried mountain remnants are called inselbergs, “island mountains,” as first described by the German geologist Wilhelm Bornhardt (1864–1946).
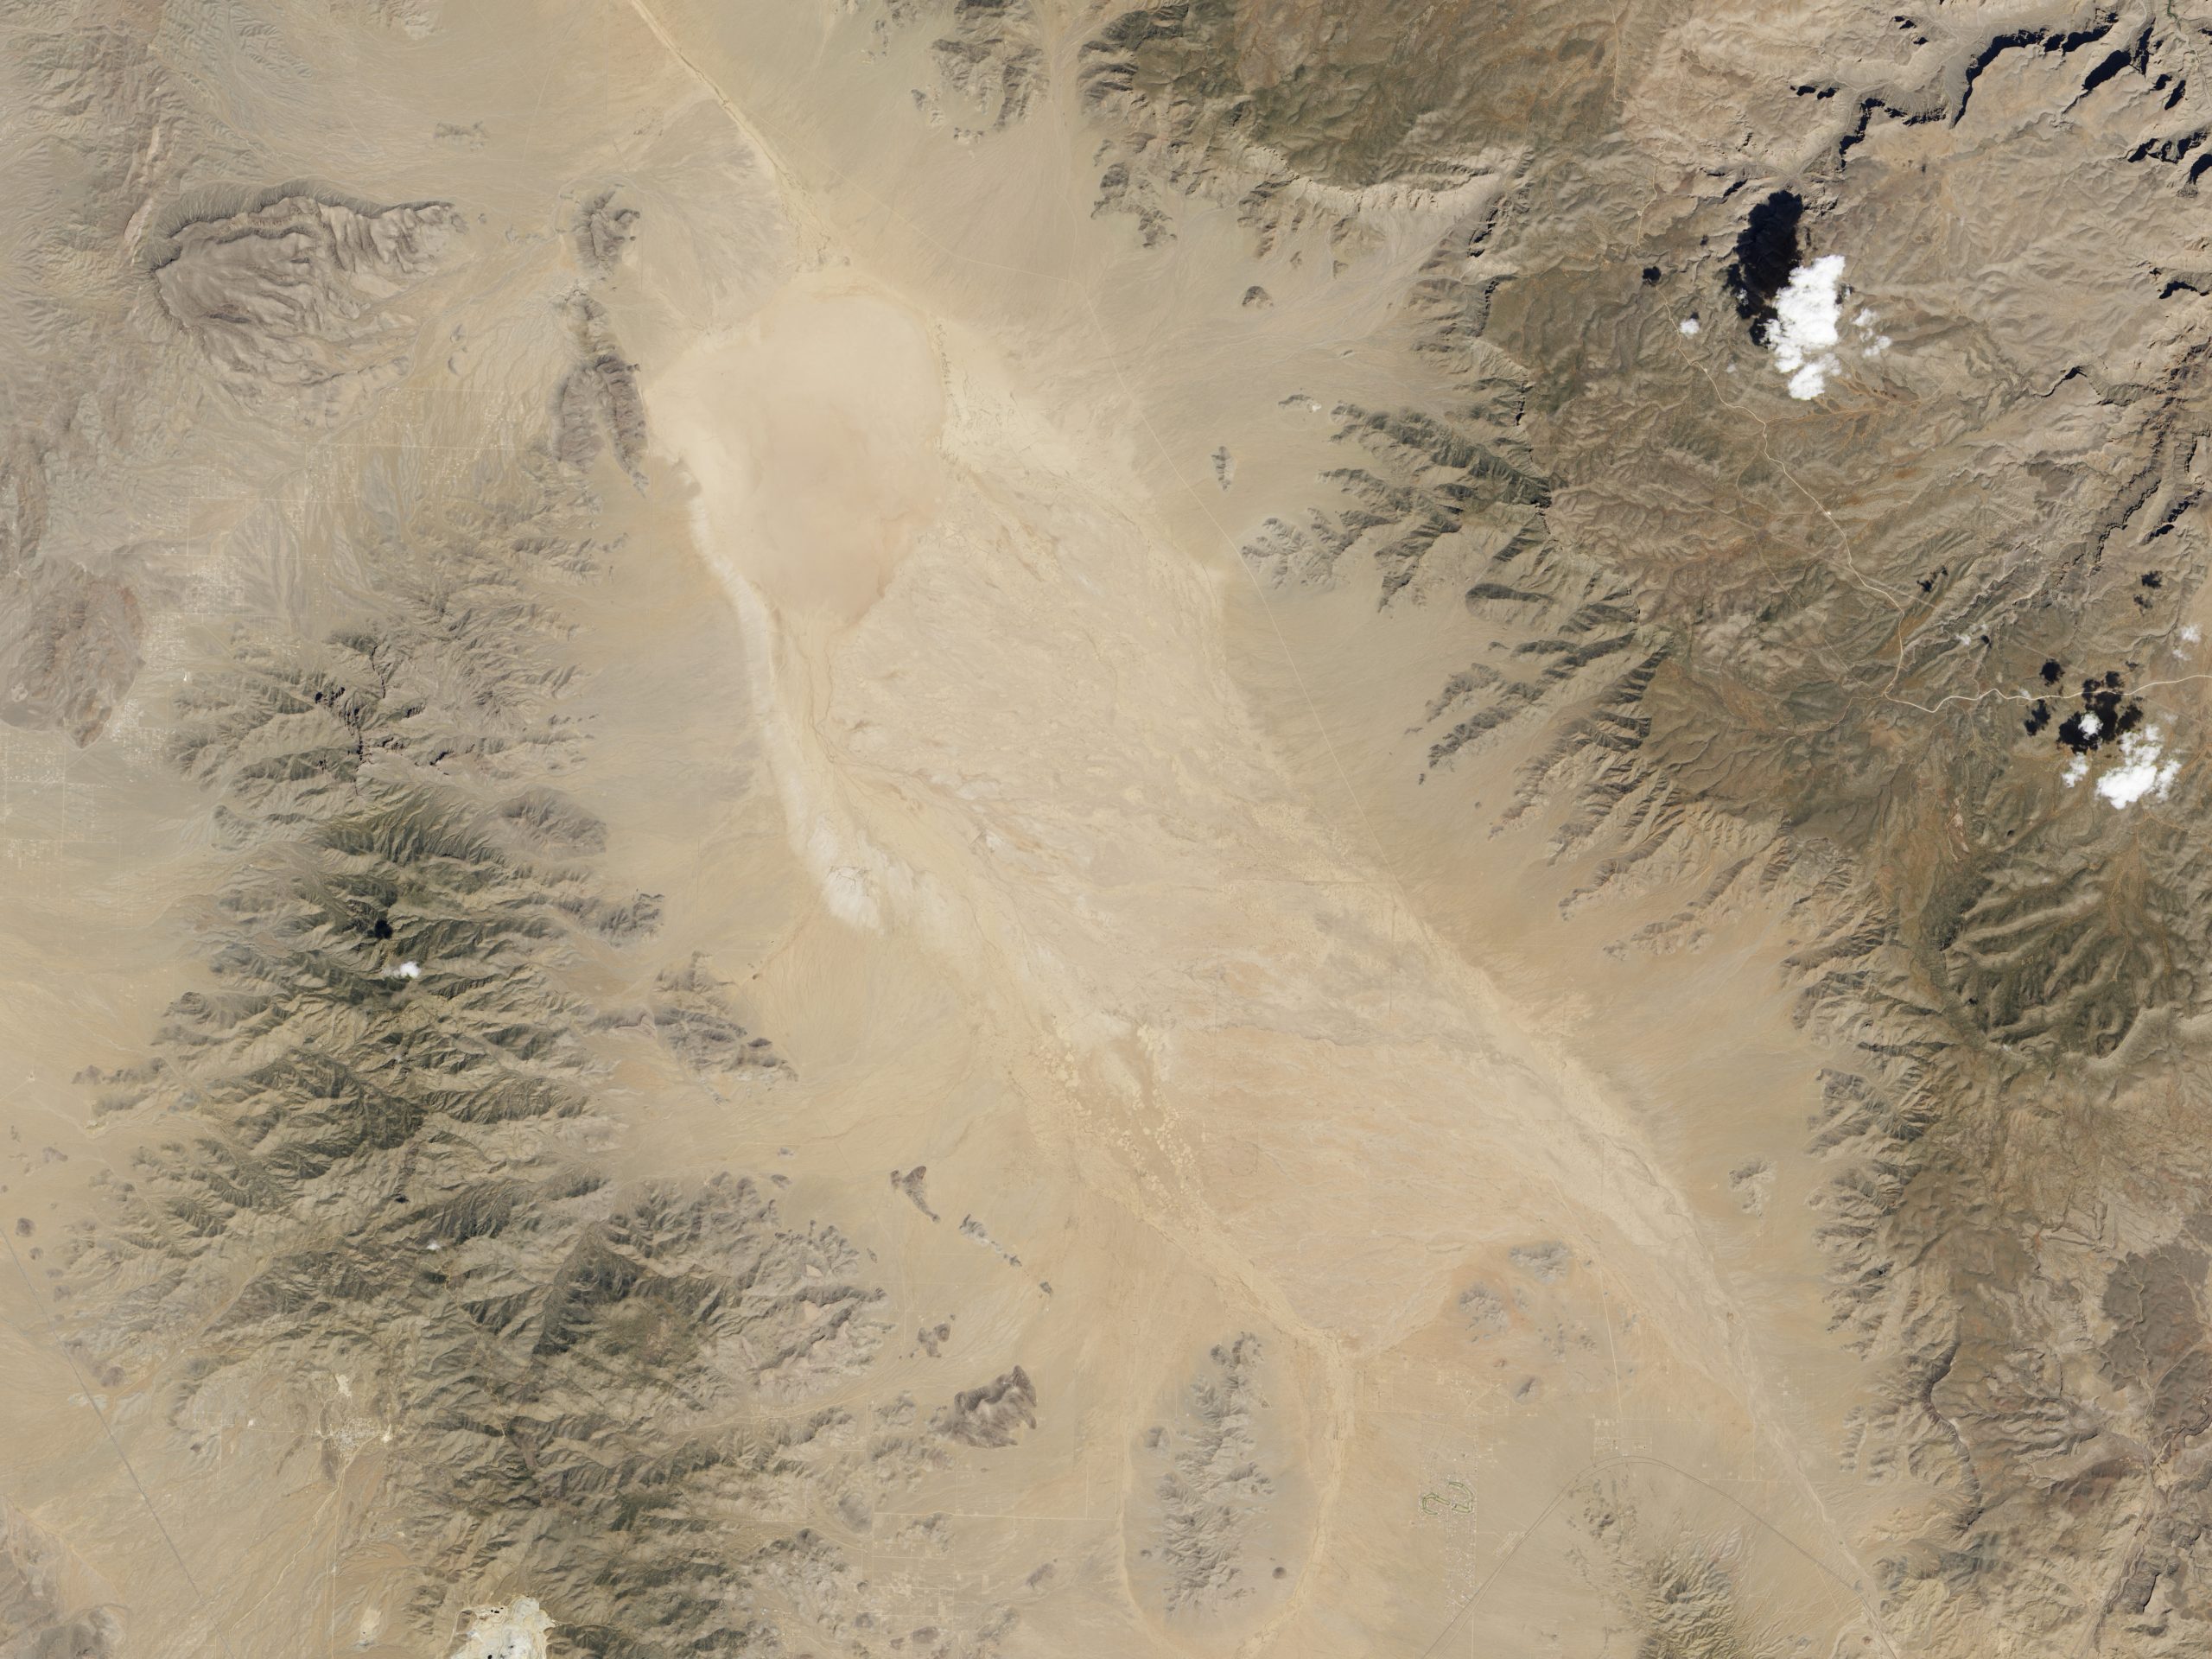
Where the desert valley is an enclosed basin, i.e. streams entering it do not drain out, the water is removed by evaporation and a dry lake bed is formed called a playa.
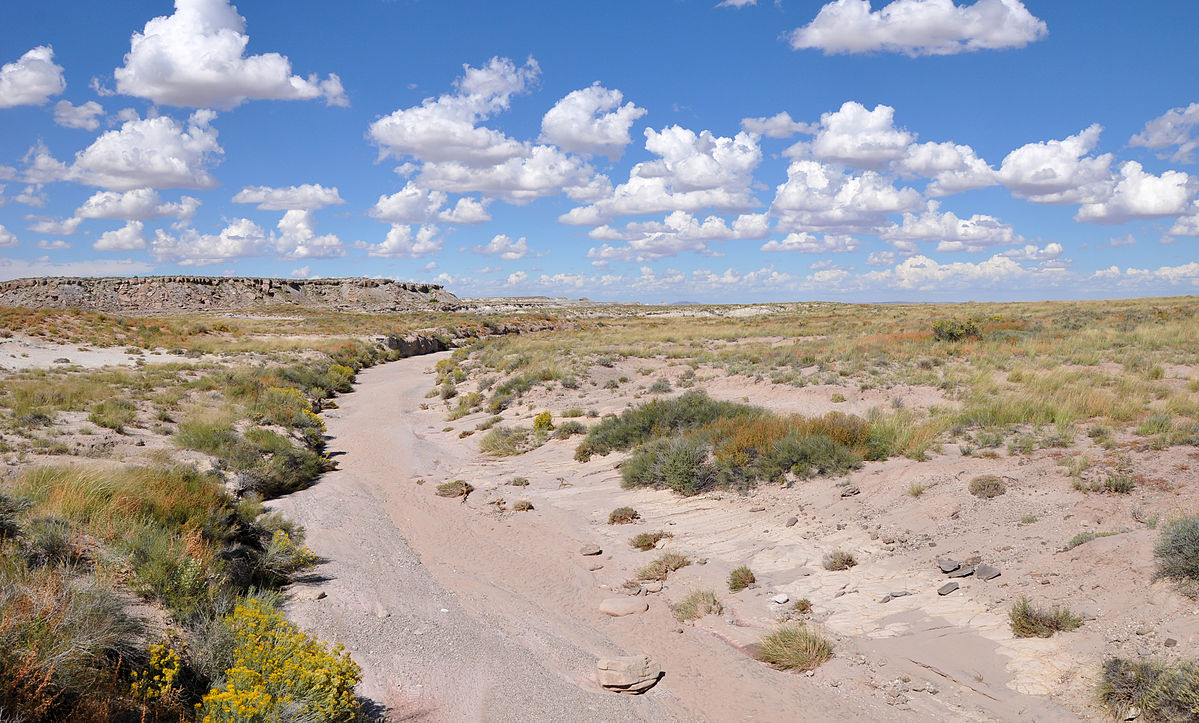
Playas are among the flattest of all landforms. Such a dry lake bed may cover a large area and be filled after a heavy thunderstorm to only a few inches deep. Playa lakes and desert streams that contain water only after rainstorms are called intermittent or ephemeral. Because of intense thunderstorms, the volume of water transported by ephemeral drainage in arid environments can be substantial during a short period of time. Desert soil structures lack organic matter that promotes infiltration by absorbing water. Instead of percolating into the soil, the runoff compacts the ground surface, making the soil hydrophobic or water-repellant. Because of this hardpan surface, ephemeral streams may gather water across large areas, suddenly filling with water from storms many miles away.
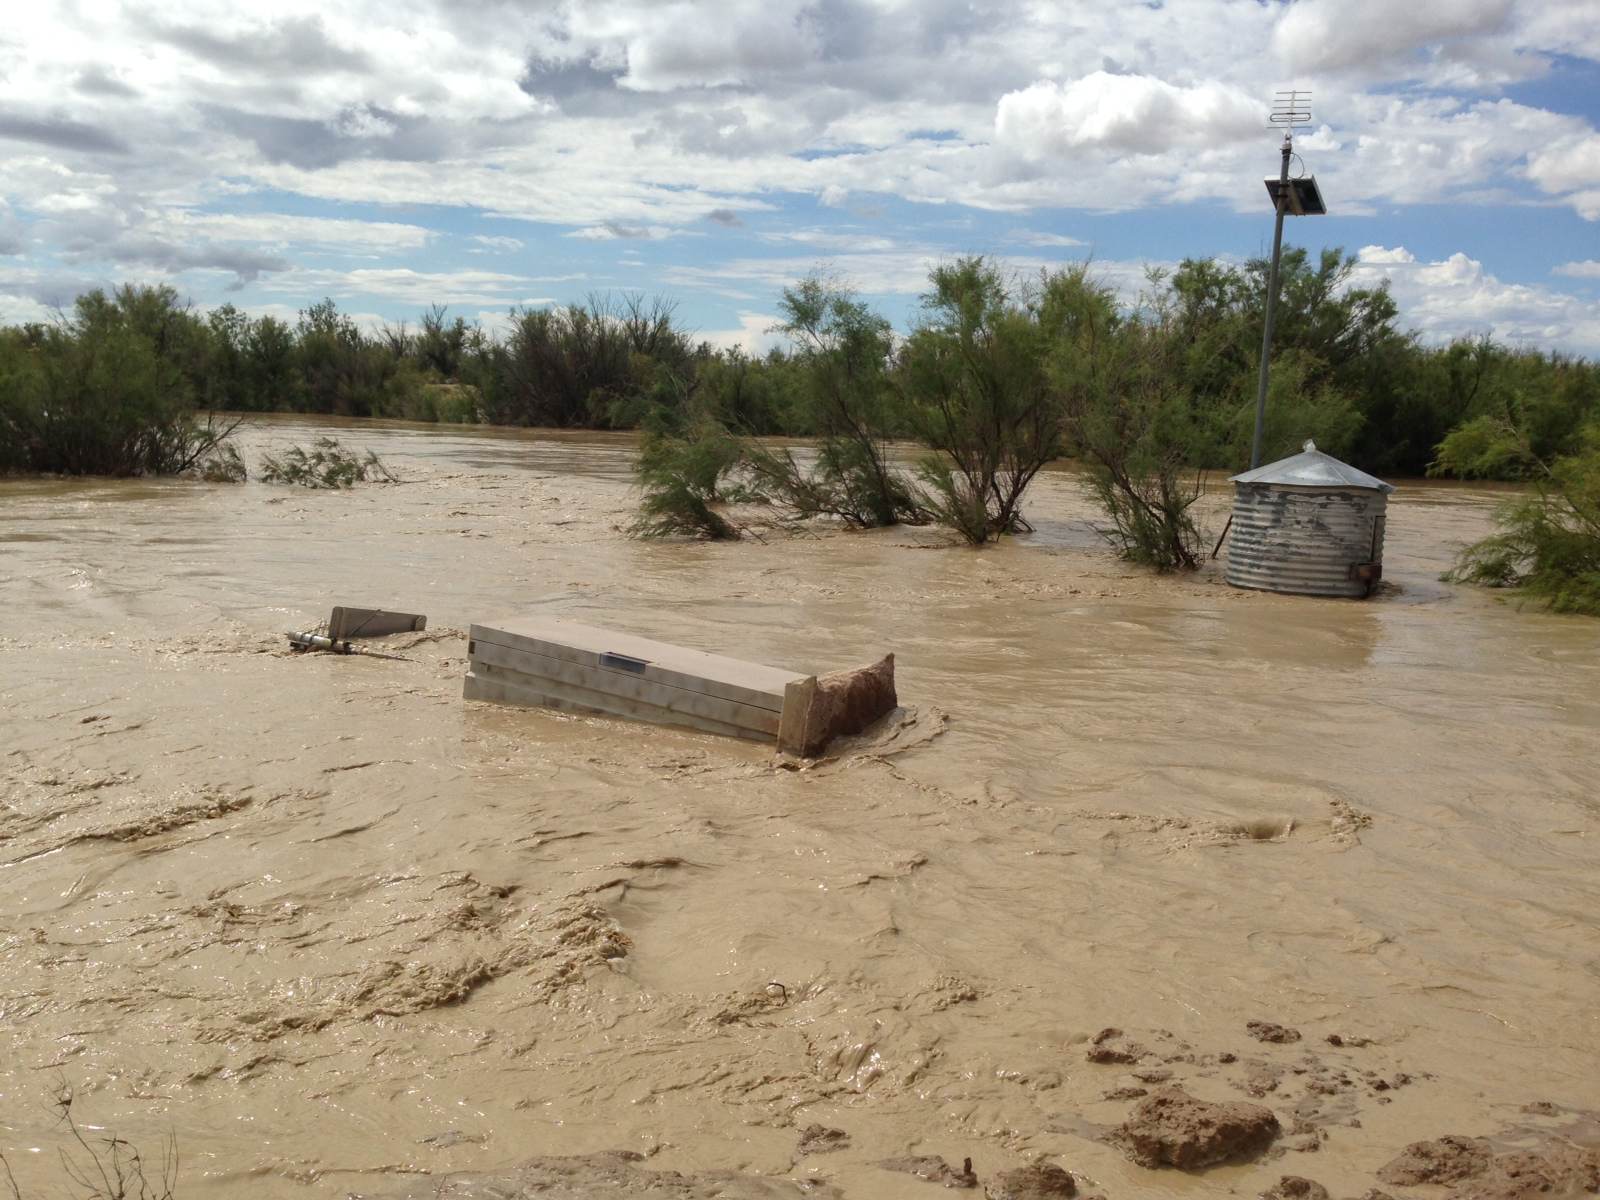
High-volume ephemeral flows, called flash floods, may move as sheet flows or sheetwash, as well as be channeled through normally dry arroyos or canyons. Flash floods are a major factor in desert deposition. Dry channels can fill quickly with ephemeral drainage, creating a mass of water and debris that charges down the arroyo, and even overflowing the banks. Flash floods pose a serious hazard for desert travelers because the storm activity feeding the runoff may be miles away. People hiking or camping in arroyos that have been bone dry for months, or years, have been swept away by sudden flash floods.
13.3.1 Sand
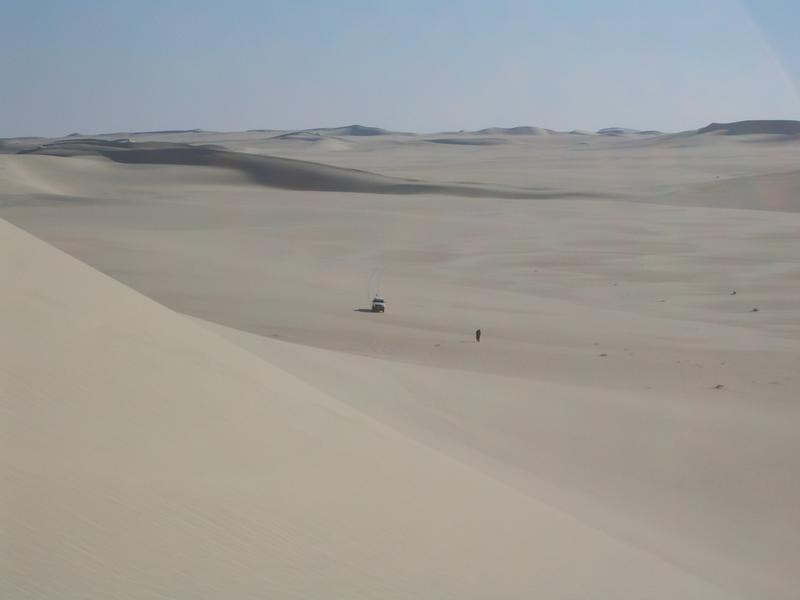
The popular concept of a typical desert is a broad expanse of sand. Geologically, deserts are defined by a lack of water and arid regions resembling a sea of sand belong to the category of desert called an erg. An erg consists of fine-grained, loose sand grains, often blown by wind, or aeolian forces, into dunes. Probably the best known erg is the Rub’ al Khali, which means Empty Quarter, of the Arabian Peninsula. Ergs are also found in the Great Sand Dunes National Park (Colorado), Little Sahara Recreation Area (Utah), White Sands National Monument (New Mexico), and parts of Death Valley National Park (California). Ergs are not restricted to deserts, but may form anywhere there is a substantial supply of sand, including as far north as 60° N in Saskatchewan, Canada, in the Athabasca Sand Dunes Provincial Park. Coastal ergs exist along lakes and oceans as well, and examples are found in Oregon, Michigan, and Indiana.
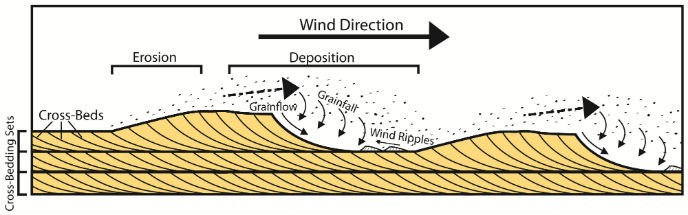
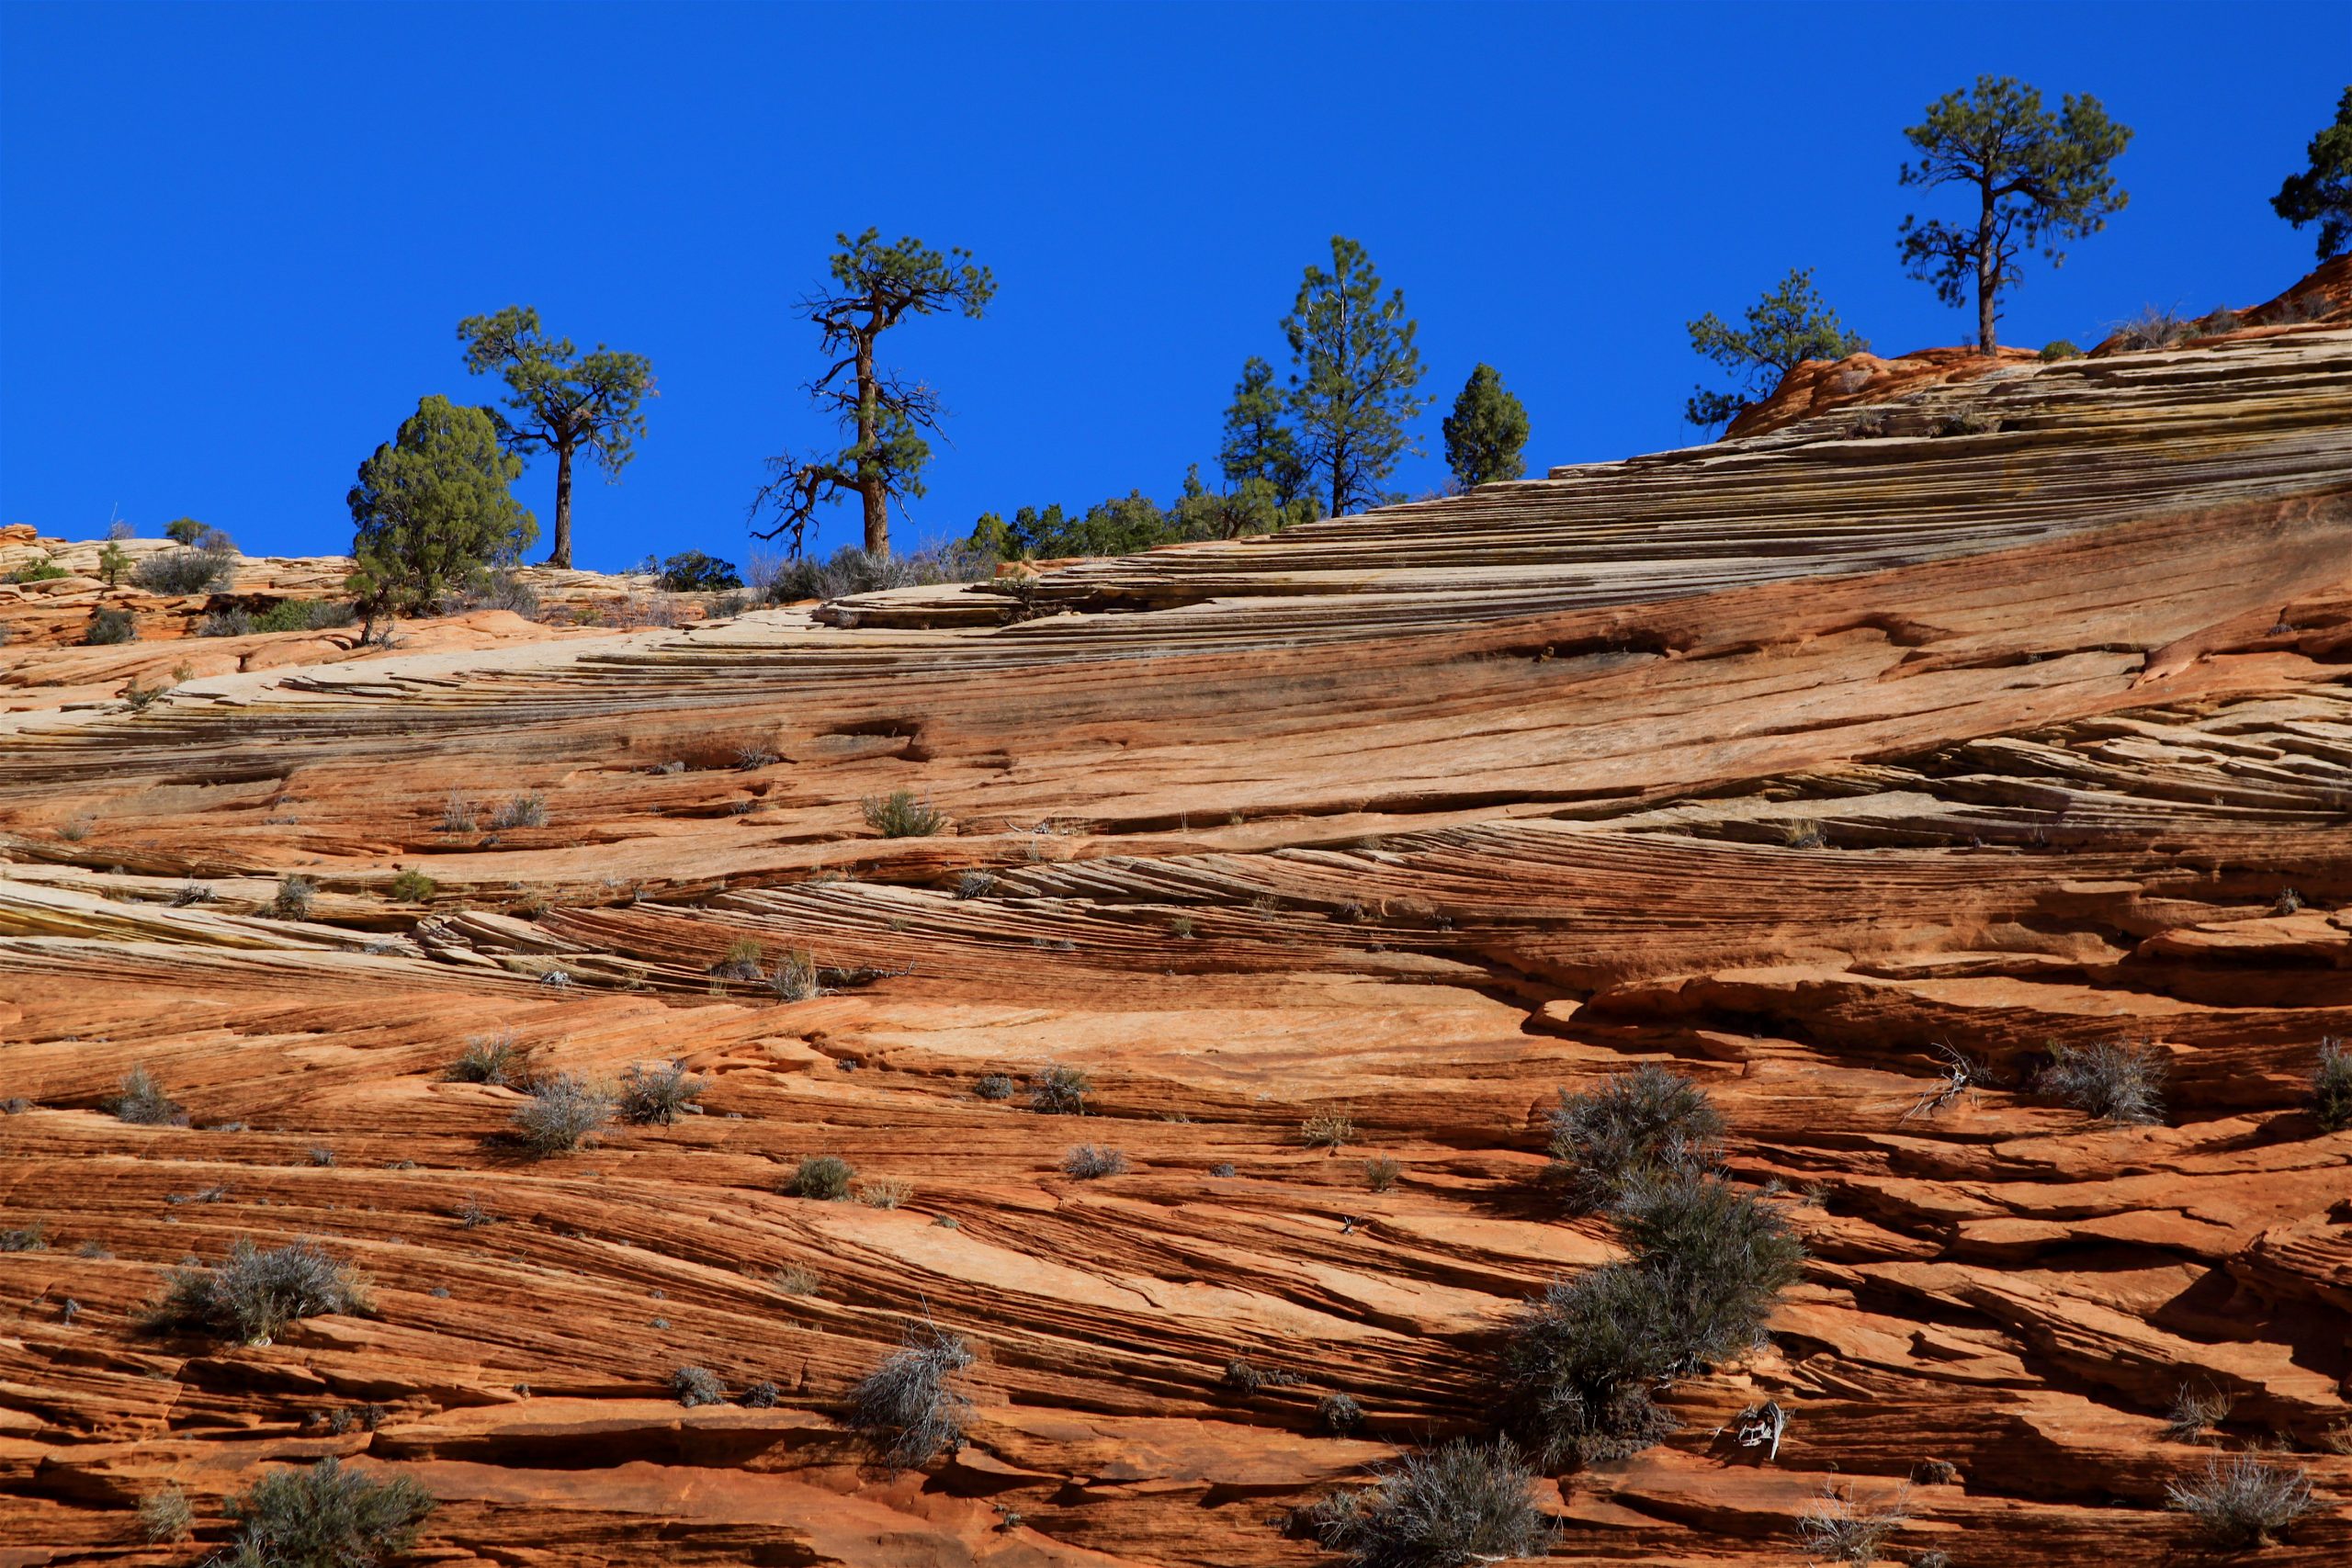
An internal cross section of a sand dune shows a feature called cross bedding. As wind blows up the windward side of the dune, it carries sand to the dune crest depositing layers of sand parallel to the windward (or “stoss”) side. The sand builds up the crest of the dune and pours over the top until the leeward (downwind or slip) face of the dune reaches the angle of repose, the maximum angle which will support the slip face. Dunes are unstable features and move as the sand erodes from the stoss side and continues to drop down the leeward side covering previous stoss and slip-face layers and creating the cross beds. Mostly, these are reworked over and over again, but occasionally, the features are preserved in a depression, then lithified. Shifting wind directions and abundant sand sources create chaotic patterns of cross beds like those seen in Zion National Park of Utah.
In the Mesozoic Era, Utah was covered by a series of ergs, with the thickest being in Southern Utah, which lithified into sandstone (see chapter 5). Perhaps the best known of these sandstone formations is the Navajo Sandstone of Jurassic age. This sandstone formation consists of dramatic cliffs and spires in Zion National Park and covers a large part of the Colorado Plateau. In Arches National Park, a later series of sand dunes covered the Navajo Sandstone and lithified to become the Entrada Formation also during the Jurassic. Erosion of overlying layers exposed fins of the underlying Entrada Sandstone and carved out weaker parts of the fins forming the arches.
As the cements that hold the grains together in these modern sand cliffs disintegrate and the freed grains gather at the base of the cliffs and move down the washes, sand grains may be recycled and redeposited. These Mesozoic sand ergs may represent ancient quartz sands recycled many times from igneous origins in the early Precambrian, just passing now through another cycle of erosion and deposition. An example of this is Coral Pink Sand Dunes State Park in Southwestern Utah, which contains sand that is being eroded from the Navajo Sandstone to form new dunes.
Dune Types
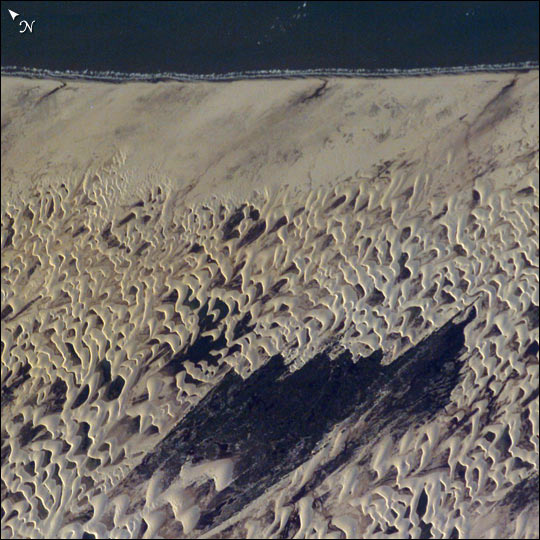
Dunes are complex features formed by a combination of wind direction and sand supply, in some cases interacting with vegetation. There are several types of dunes representing variables of wind direction, sand supply and vegetative anchoring. Barchan dunes or crescent dunes form where sand supply is limited and there is a fairly constant wind direction. Barchans move downwind and develop a crescent shape with wings on either side of a dune crest. Barchans are known to actually move over homes, even towns.
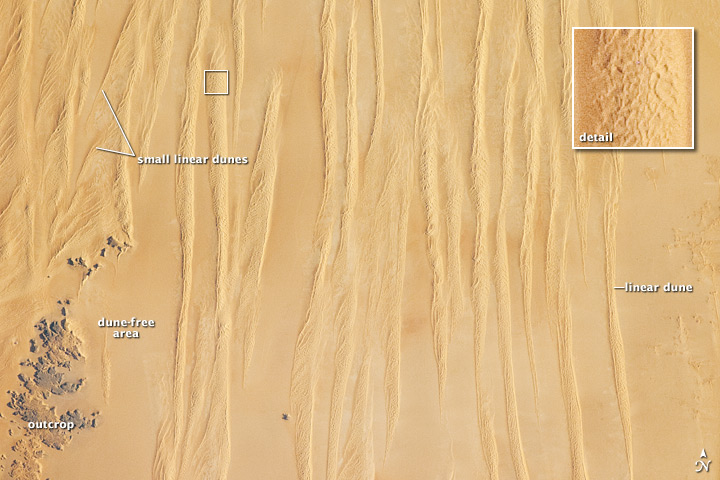
Longitudinal dunes or linear dunes form where sand supply is greater and the wind blows around a dominant direction, in a back-and-forth manner. They may form ridges tens of meters high lined up with the predominant wind directions.
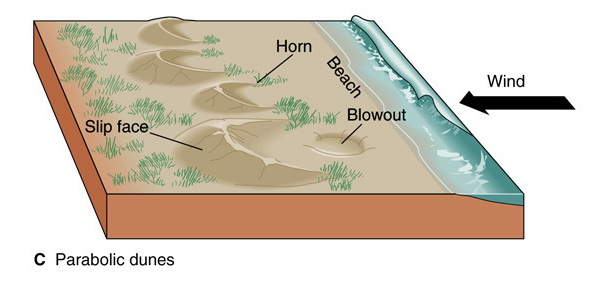
Parabolic dunes form where vegetation anchors parts of the sand and unanchored parts blowout. Parabolic dune shape may be similar to barchan dunes but usually reversed, and it is determined more by the anchoring vegetation than a strict parabolic form.
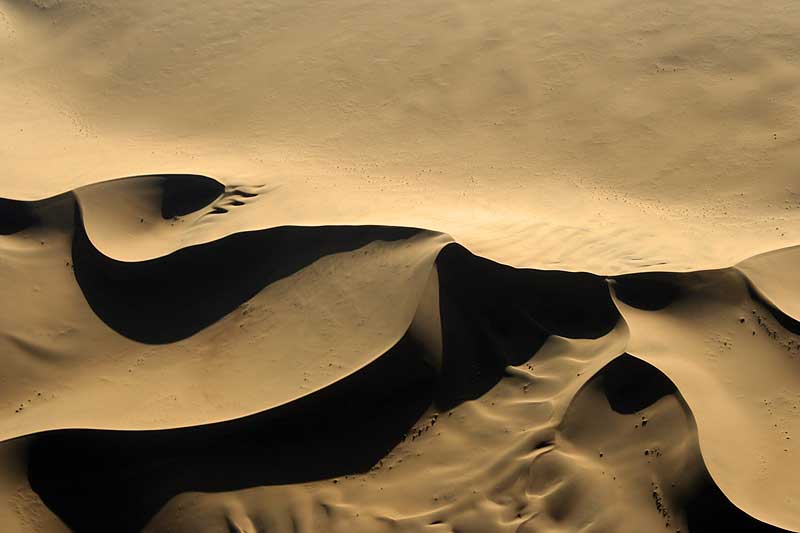
Star dunes form where the wind direction is variable in all directions. Sand supply can range from limited to quite abundant. It is the variation in wind direction that forms the star.

Take this quiz to check your comprehension of this section.
If you are using an offline version of this text, access the quiz for section 13.3 via the QR code.
13.4 The Great Basin and the Basin and Range
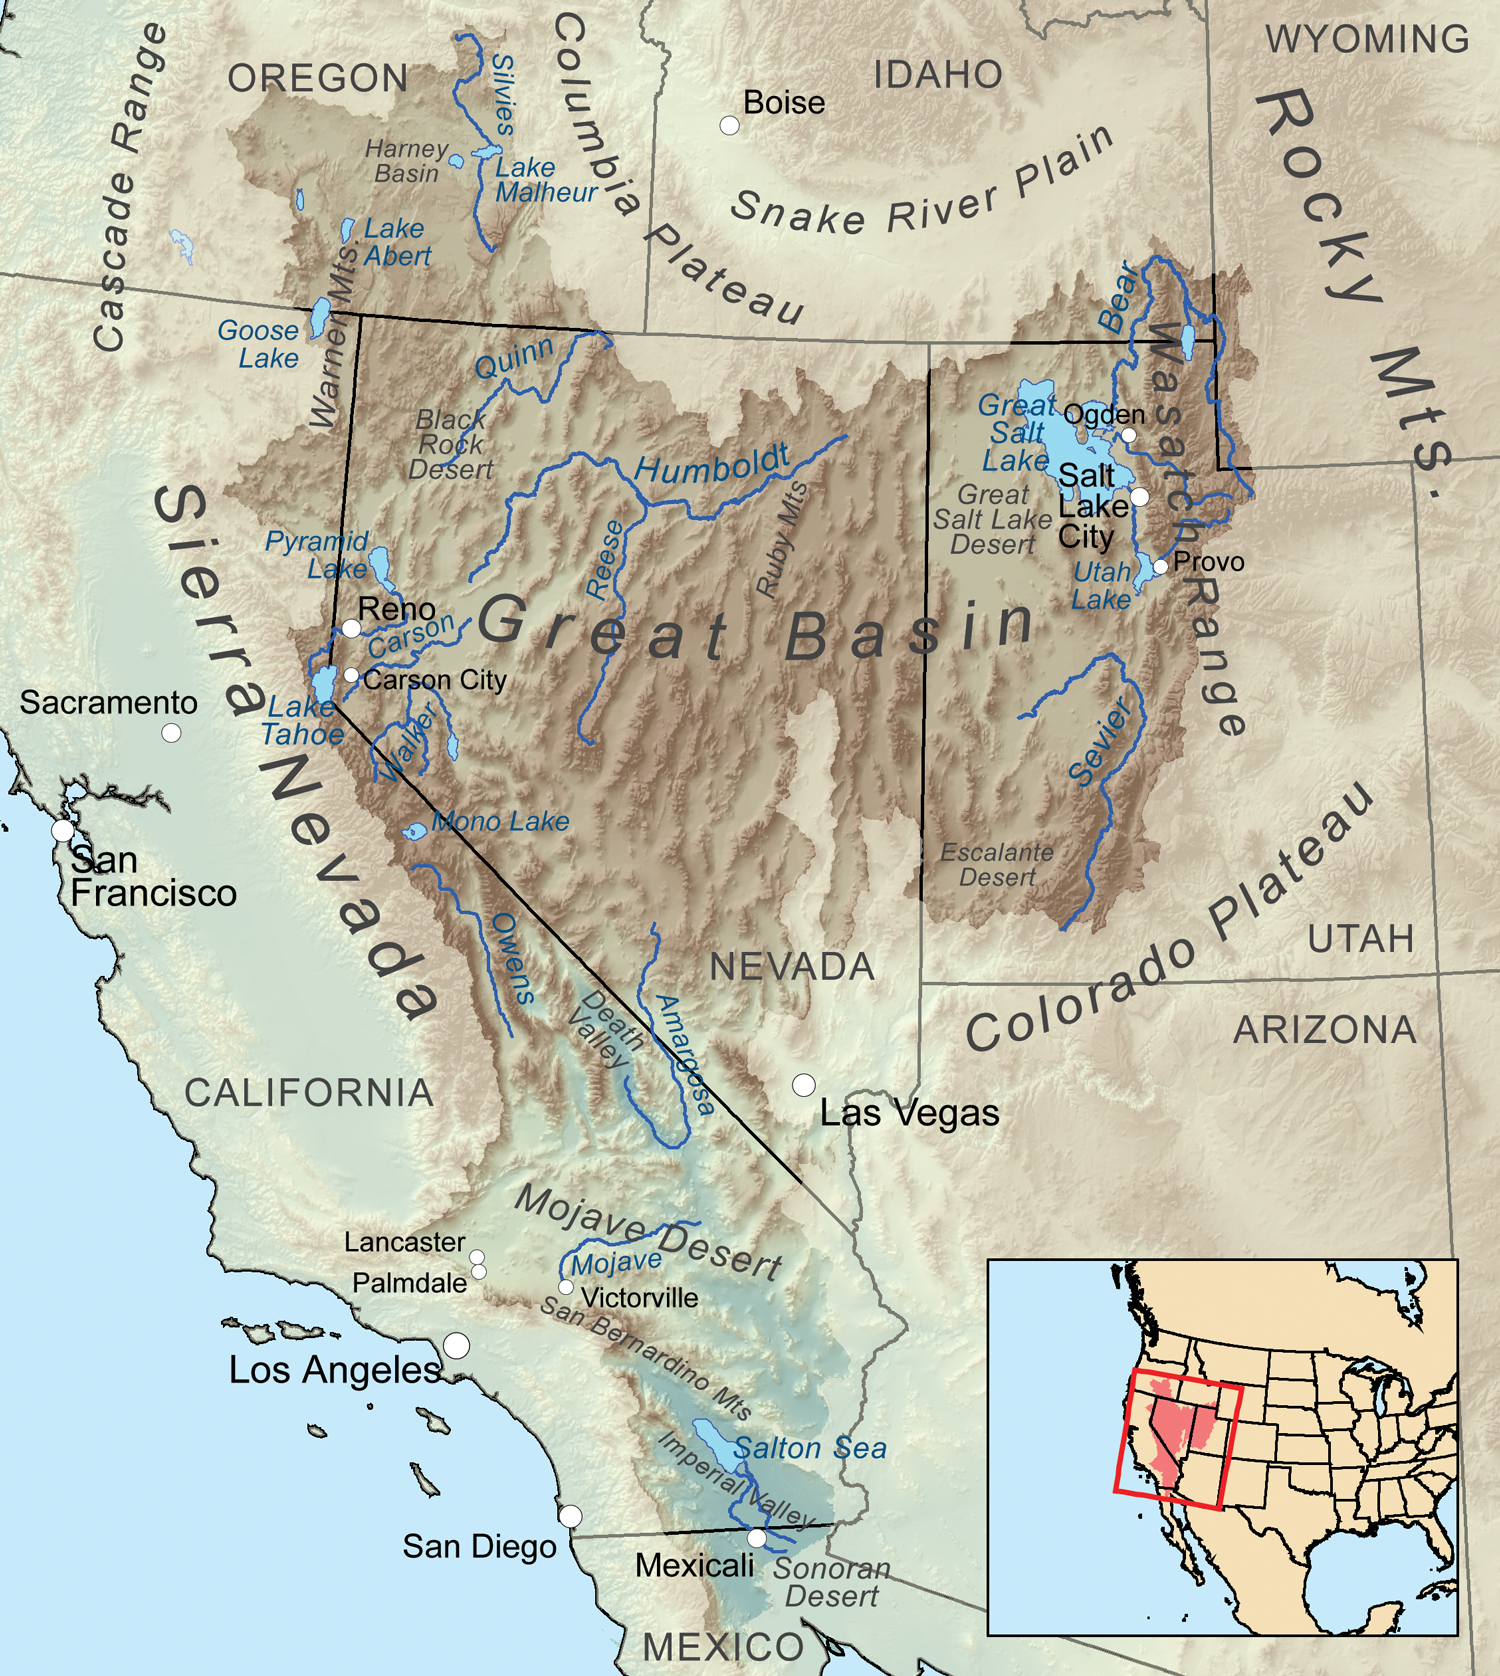
The Great Basin is the largest area of interior drainage in North America, meaning there is no outlet to the ocean and all precipitation remains in the basin or is evaporated. It covers western Utah, most of Nevada, and extends into southeastern California, southern Oregon, and southern Idaho. Because there is not outlet to the ocean, streams in the Great Basin deliver runoff to lakes and playas within the basin. A subregion within the Great Basin is the Basin and Range which extends from the Wasatch Front in Utah west across Nevada to the Sierra Nevada Mountains of California. The basins and ranges referred to in the name are horsts and grabens, formed by normal fault blocks from crustal extension, as discussed in chapter 2 and chapter 9. The lithosphere of the entire area has stretched by a factor of about 2, meaning from end to end, the distance has doubled over the past 30 million years or so. Valleys without outlets form individual basins, each of which is filled with alluvial sediments leading into playa depositional environments. During the recent Ice Age, The climate was more humid and while glaciers were forming in some of the mountains, pluvial lakes formed covering large areas (see section 14.4.3). During the Ice Age, valleys in much of western Utah and eastern Nevada were covered by Lake Bonneville. As the climate became arid after the Ice Age, Lake Bonneville dried leaving as a remnant the Great Salt Lake in Utah.
The desert of the Basin and Range extends from about 35° to near 40° and results from a rain shadow effect created by westerly winds from the Pacific rising and cooling over the Sierras becoming depleted of moisture by precipitation on the western side. The result is relatively dry air descending across Nevada and western Utah.
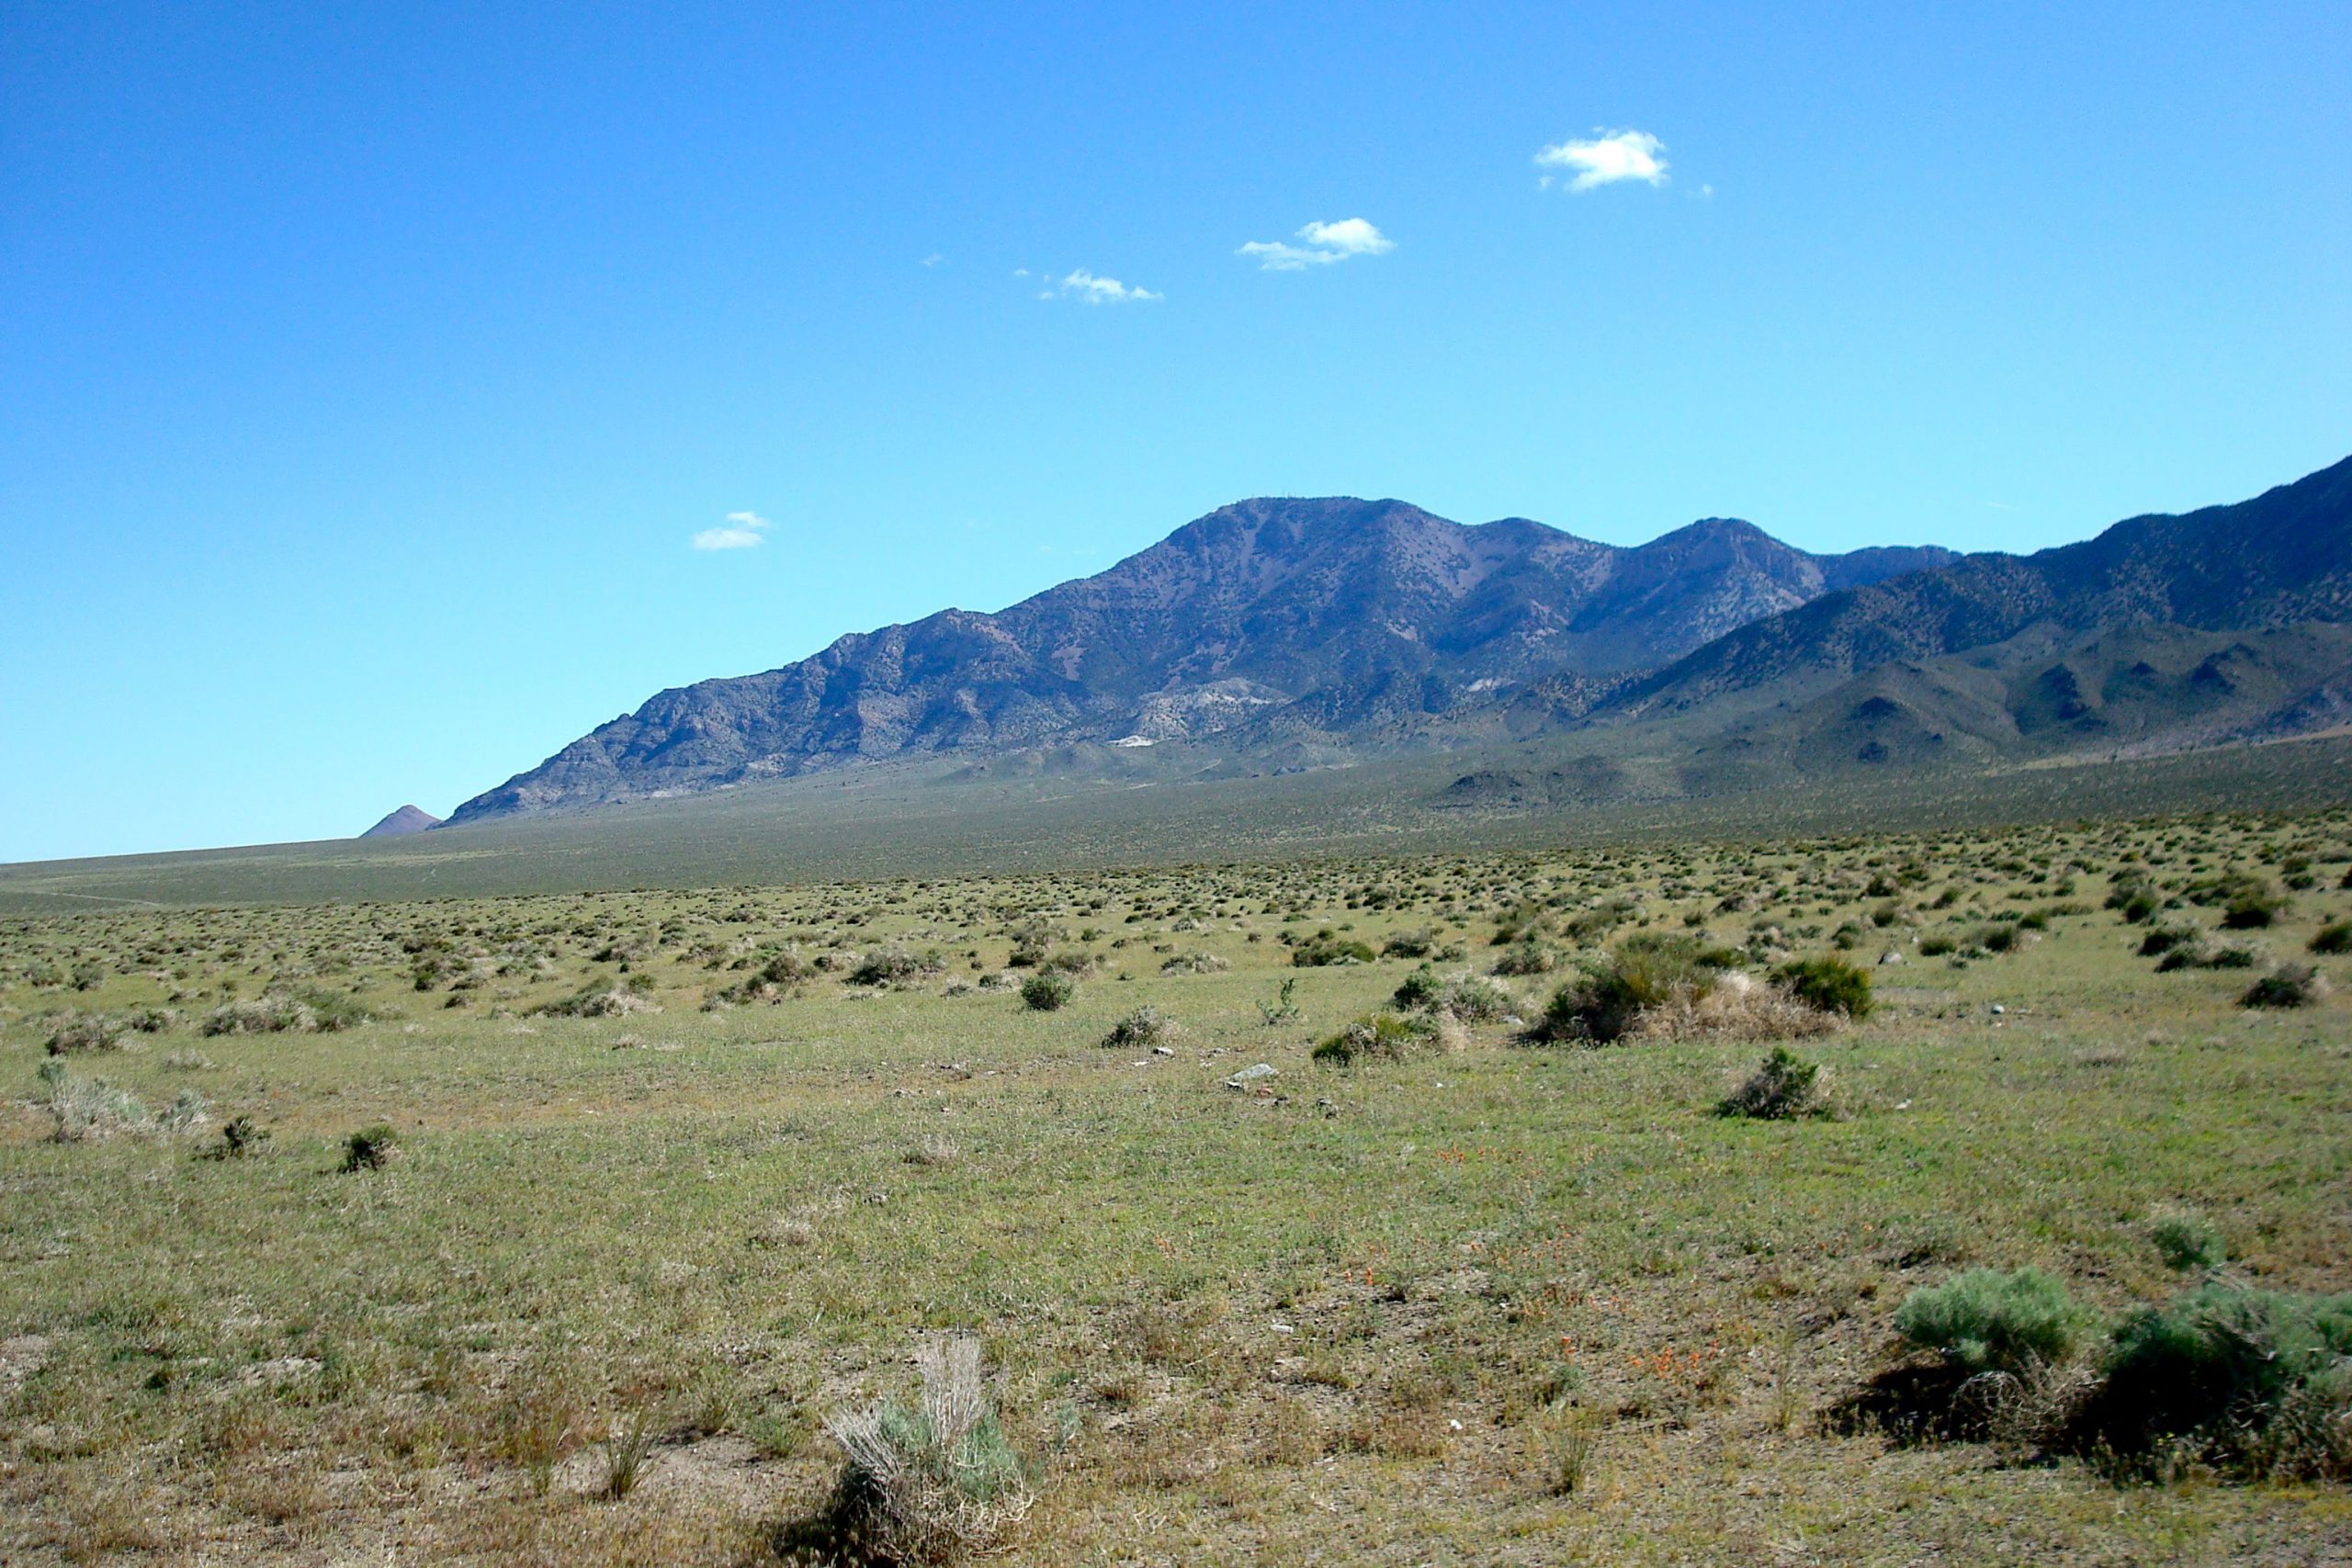
A journey from the Wasatch Front southwest to the Pacific Ocean will show stages of desert landscape evolution from the fault block mountains of Utah with sharp peaks and alluvial fans at the mouths of canyons, through landscapes in Southern Nevada with bajadas along the mountain fronts, to the landscapes in the Mojave Desert of California with subdued inselbergs sticking up through a sea of coalesced bajadas. These landscapes illustrate the evolutionary stages of desert landscape development.
13.4.1 Desertification
When previously arable land suitable for agriculture transforms into desert, this process is called desertification. Plants and humus-rich soil (see chapter 5) promote groundwater infiltration and water retention. When an area becomes more arid due to changing environmental conditions, the plants and soil become less effective in retaining water, creating a positive feedback loop of desertification. This self-reinforcing loop spirals into increasingly arid conditions and further enlarges the desert regions.
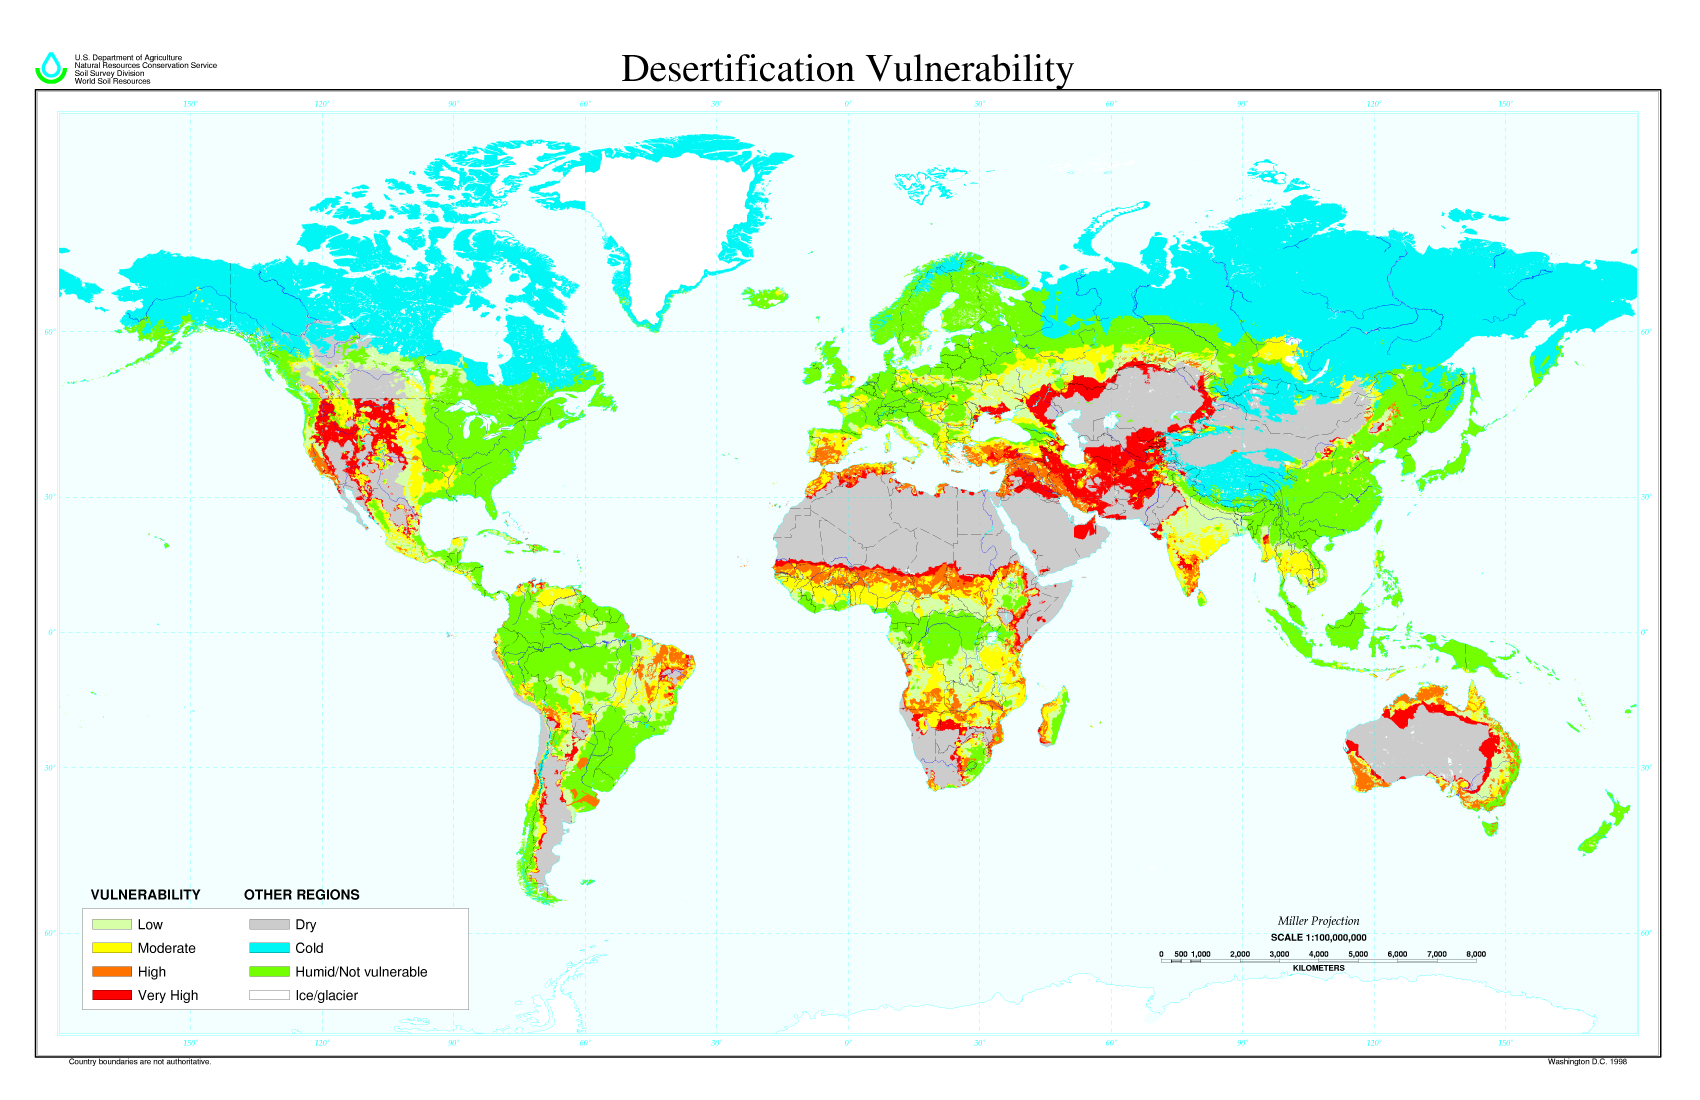
Desertification may be caused by human activities, such as unsustainable crop cultivation practices, overgrazing by livestock, overuse of groundwater, and global climate change. Human-caused desertification is a serious worldwide problem. The world map figure above shows what areas are most vulnerable to desertification. Note the red and orange areas in the western and midwestern regions of the United States, which also cover large areas of arable land used for raising food crops and animals. The creation of the Dust Bowl in the 1930s (see chapter 5) is a classic example of a high-vulnerability region impacted by human–caused desertification. As demonstrated in the Dust Bowl, conflicts may arise between agricultural practices and conservation measures. Mitigating desertification while allowing farmers to make a survivable living requires public and individual education to create community support and understanding of sustainable agriculture alternatives.

Take this quiz to check your comprehension of this section.
If you are using an offline version of this text, access the quiz for section 13.4 via the QR code.
Summary
Approximately 30% of Earth’s surface is arid lands, the location of which is determined by latitude, atmospheric circulation, and terrain. The arid belts between 15o and 30o north and south latitudes are produced by descending air masses associated with major cells in the atmosphere and include the major deserts like the Sahara in Africa and the Middle East. Rain shadow deserts lie behind mountain ranges or long land expanses in zones of prevailing winds like the deserts of western North America, the Atacama of South America, and the Gobi of Asia. Dry descending air also creates the polar deserts at the poles.
Major atmospheric circulation involves the Hadley cells, midlatitude or Ferrel cells, and the polar cells in each hemisphere. Warmed and rising air in the Hadley cells rains back on the tropics and moves toward the poles as dryer air. That air meets the dryer equatorward moving air of the Ferrel cells. This dry air descends in the arid zones, called the horse latitudes, to produce the arid belts in each hemisphere. Rotation of the Earth creates the Coriolis Effect that deflects these moving air masses to produce zones of prevailing winds, the Trade Winds in the subtropics and the Westerlies in the midlatitudes. A combination of latitude, rain shadow, and cold adjacent ocean currents causes the Atacama Desert of northern Chile, the driest desert on Earth.
Weathering in deserts takes place just as in other climes only slower because of less water. Desert varnish is a weathering product unique to desert environments. As in more humid climes, water is the main agent of erosion although wind is a notable agent. Large dust storms called haboobs transport large amounts of sediment that may accumulate in sand seas called ergs or finer grained loess deposits. Sand transport occurs mainly by saltation in which grain to grain impact causes frosting of grain surfaces. Sandblasting by persistent winds produces stones with polished surfaces called ventifacts and sculpted bedrock features called yardangs.
Landforms produced in desert environments include alluvial fans, bajadas, inselbergs, and playas. Windblown sand can accumulate as dunes. The forms of dunes, like barchans, parabolic, longitudinal, and star dunes, relate to the abundance of sand supply and wind direction as well as presence of vegetation. The internal structure of dunes shows cross bedding. Fossil dunes in an ancient desert leave cross bedding in places like Zion and Arches national parks in Utah showing shifting wind directions in these ancient environments. Ephemeral streams in desert regions may carry water only after storms and pose risk of flash floods.
The Great Basin of North America is an enclosed basin with no drainage to the ocean. The only exit for precipitation there is by evaporation. Travels in the Great Basin show stages of development of desert landscapes from playas and alluvial fans, to bajadas, to inselbergs which are eroded mountains buried in their own erosional debris.
Poor land management can result in dying vegetation and loss of soil moisture producing an accelerating process of desertification in which once productive land is degraded into unproductive desert. This is a serious worldwide problem.

Take this quiz to check your comprehension of this chapter.
If you are using an offline version of this text, access the quiz for chapter 13 via the QR code.
Text References
- Bagnold, R. A. 1941. “The Physics of Blown Sand and Desert Dunes.” Methum, London, UK, 265.
- Boggs, Sam. 2006. “Principles of Sedimentology and Stratigraphy.” Pearson Prentice Hall. http://agris.fao.org/agris-search/search.do?recordID=US201300110702.
- Clements, Thomas. 1952. “Wind-Blown Rocks and Trails on Little Bonnie Claire Playa, Nye County, Nevada.” Journal of Sedimentary Research 22 (3). Society for Sedimentary Geology. http://archives.datapages.com/data/sepm/journals/v01-32/data/022/022003/0182.htm.
- Collado, Gonzalo A., Moisés A. Valladares, and Marco A. Méndez. “Hidden Diversity in Spring Snails from the Andean Altiplano, the Second Highest Plateau on Earth, and the Atacama Desert, the Driest Place in the World.” Zoological Studies 52 (1): 50.
- Easterbrook, Don J. 1999. Surface Processes and Landforms. Pearson College Division.
- Geist, Helmut. 2005. The Causes and Progression of Desertification. Ashgate Aldershot.
- Grayson, Donald K. 1993. The Desert’s Past: A Natural Prehistory of the Great Basin. Smithsonian Inst Pr.
- Hadley, Geo. 1735. “Concerning the Cause of the General Trade-Winds: By Geo. Hadley, Esq; FRS.” Philosophical Transactions 39 (436-444). The Royal Society: 58–62.
- Hartley, Adrian J., and Guillermo Chong. 2002. “Late Pliocene Age for the Atacama Desert: Implications for the Desertification of Western South America.” Geology 30 (1). geology.gsapubs.org: 43–46.
- Hedin, Sven Anders. 1903. Central Asia and Tibet. Vol. 1. Hurst and Blackett, limited.
- Hooke, Roger Leb. 1967. “Processes on Arid-Region Alluvial Fans.” The Journal of Geology 75 (4). journals.uchicago.edu: 438–60.
- King, Lester C. 1953. “Canons of Landscape Evolution.” Geological Society of America Bulletin 64 (7). gsabulletin.gsapubs.org: 721–52.
- Kletetschka, Gunther, Roger Leb Hooke, Andrew Ryan, George Fercana, Emerald McKinney, and Kristopher P. Schwebler. 2013. “Sliding Stones of Racetrack Playa, Death Valley, USA: The Roles of Rock Thermal Conductivity and Fluctuating Water Levels.” Geomorphology 195 (August). Elsevier: 110–17.
- Laity, Julie E. 2009. “Landforms, Landscapes, and Processes of Aeolian Erosion.” In Geomorphology of Desert Environments, edited by Anthony J. Parsons and Athol D. Abrahams, 597–627. Springer Netherlands.
- Littell, Eliakim, and Robert S. Littell. 1846. Littell’s Living Age. T.H. Carter & Company.
- Livingstone, Ian, and Andrew Warren. 1996. Aeolian Geomorphology: An Introduction. Longman.
- Muhs, Daniel R., and E. A. Bettis. 2003. “Quaternary Loess-Paleosol Sequences as Examples of Climate-Driven Sedimentary Extremes.” Special Papers-Geological Society of America. Boulder, Colo.; Geological Society of America; 1999, 53–74.
- Norris, Richard D., James M. Norris, Ralph D. Lorenz, Jib Ray, and Brian Jackson. 2014. “Sliding Rocks on Racetrack Playa, Death Valley National Park: First Observation of Rocks in Motion.” PloS One 9 (8). journals.plos.org: e105948.
- Shao, Yaping. 2008. Physics and Modelling of Wind Erosion. Springer Science & Business Media.
- Stanley, George M. 1955. “Origin of Playa Stone Tracks, Racetrack Playa, Inyo County, California.” Geological Society of America Bulletin 66 (11). gsabulletin.gsapubs.org: 1329–50.
- Walker, Alta S. 1996. “Deserts: Geology and Resources.” Government Printing Office. https://pubs.er.usgs.gov/publication/7000004.
- Wilson, Ian Gordon. 1971. “Desert Sandflow Basins and a Model for the Development of Ergs.” The Geographical Journal 137 (2). [Wiley, Royal Geographical Society (with the Institute of British Geographers)]: 180–99.
Figure References
Figure 13.1: World hot deserts (Koppen BWh). Peel, M. C., Finlayson, B. L., and McMahon, T. A.; adapted by Me ne frego. 2011. CC BY-SA 3.0. https://en.wikipedia.org/wiki/File:Koppen_World_Map_BWh.png
Figure 13.2: Mountainous areas in front of the prevailing winds create a rain shadow. domdomegg. 2015. CC BY 4.0. https://commons.wikimedia.org/wiki/File:Rainshadow_copy.svg
Figure 13.3: In this image from the ISS, the Sierra Nevada Mountains are perpendicular to prevailing westerly winds, creating a rain shadow to the east (down in the image). NASA. 2003. Public domain. https://earthobservatory.nasa.gov/images/3273/southern-sierra-nevada-and-owens-lake
Figure 13.4: Generalized atmospheric circulation. NASA. 2009. Public domain. https://commons.wikimedia.org/wiki/File:Earth_Global_Circulation.jpg
Figure 13.5: USGS Map of the Great Basin Desert. USGS. 2012. Public domain. https://commons.wikimedia.org/wiki/File:Central_Basin_and_Range_ecoregion.gif
Figure 13.6: Map of the Atacama desert (yellow) and surrounding related climate areas (orange). cobaltcigs. 2010. CC BY-SA 3.0. https://en.wikipedia.org/wiki/File:Atacama_map.svg
Figure 13.7: The polar vortex of mid-November, 2013. NOAA. 2014. Public domain. https://commons.wikimedia.org/wiki/File:November2013_polar_vortex_geopotentialheight_mean_Large.jpg
Figure 13.8: In the inertial frame of reference of the top picture, the ball moves in a straight line. Hubi. 2003. CC BY-SA 3.0. https://commons.wikimedia.org/wiki/File:Corioliskraftanimation.gif
Figure 13.9: Forces acting on a mass moving East–West on the rotating Earth that produce the Coriolis Effect. Kindred Grey. 2022. CC BY 4.0.
Figure 13.10: Inertia of air masses caused by the Coriolis Effect in the absence of other forces. Kes47. 2015. CC BY-SA 3.0. https://commons.wikimedia.org/wiki/File:Coriolis_effect.svg
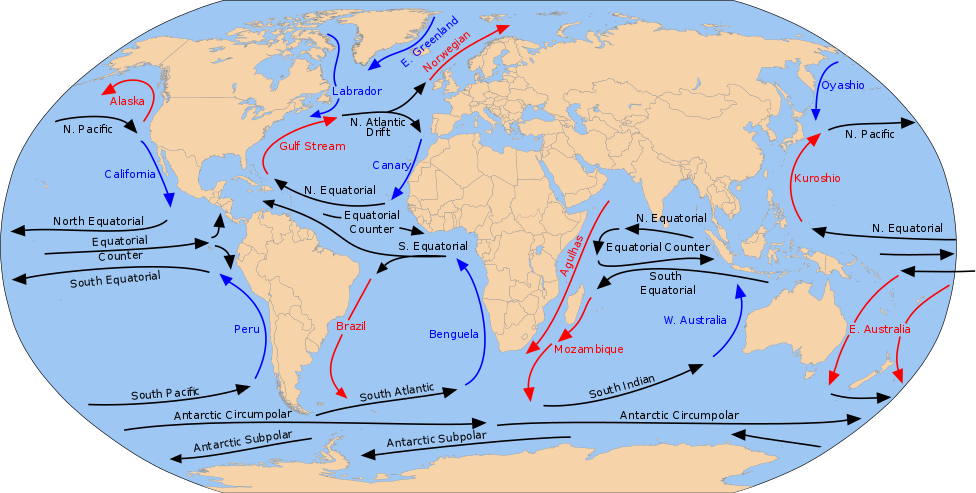
Figure 13.11: Gyres of the Earth’s oceans. Canuckguy; adapted by Shadowxfox and Popadius. 2012. Public domain. https://commons.wikimedia.org/wiki/File:Corrientes-oceanicas-en.svg
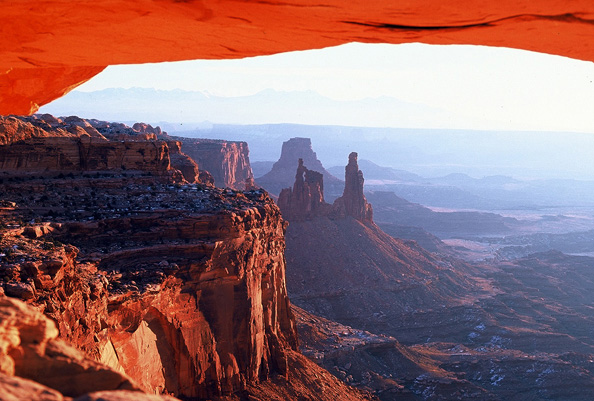
Figure 13.12: Weathering and erosion of Canyonlands National Park has created a unique landscape, including arches, cliffs, and spires. Rick. 2005. CC BY 2.0. https://commons.wikimedia.org/wiki/File:Mesa_Arch_Canyonlands_National_Park.jpg
Figure 13.13: Newspaper rock, near Canyonlands National Park, has many petroglyphs carved into desert varnish. Cacophony. 2009. CC BY-SA 3.0. https://commons.wikimedia.org/wiki/File:Newspaper_Rock_Full.jpg
Figure 13.14: A dust storm (haboob) hits Texas in 2019. Jakeorin. 2019. CC BY-SA 4.0. https://commons.wikimedia.org/wiki/File:Haboob_in_Big_Spring,_TX.jpg
Figure 13.15: Diagram showing the mechanics of saltation. NASA. 2002. Public domain. https://commons.wikimedia.org/wiki/File:Saltation-mechanics.gif
Figure 13.16: Enlarged image of frosted and rounded windblown sand grains. Wilson44691. 2008. Public domain. https://commons.wikimedia.org/wiki/File:CoralPinkSandDunesSand.JPG
Figure 13.17: A “sailing stone” at Racetrack Playa in Death Valley National Park, California. Lgcharlot. 2006. CC BY-SA 4.0. https://commons.wikimedia.org/wiki/File:Racetrack_Playa_in_Death_Valley_National_Park.jpg
Figure 13.18: Wind-carved ventifact in White Desert National Park, Egypt. Christine Schultz. 2003. Public domain. https://commons.wikimedia.org/wiki/File:Weisse_W%C3%BCste.jpg
Figure 13.19: A yardang near Meadow, Texas. United States Department of Agriculture. 2000. Public domain. https://commons.wikimedia.org/wiki/File:Yardang_Lea-Yoakum_Dunes.jpg
Figure 13.20: Blowout in Texas. Leaflet. 1996. CC BY-SA 3.0. https://commons.wikimedia.org/wiki/File:Blowout_Earth_TX.jpg
Figure 13.21: Aerial image of alluvial fan in Death Valley. USGS. 2005. Public domain. https://commons.wikimedia.org/wiki/File:Alluvial_Fan.jpg
Figure 13.22: Bajada along Frisco Peak in Utah. GerthMichael. 2010. CC BY-SA 3.0. https://commons.wikimedia.org/wiki/File:FriscoMountainUT.jpg
Figure 13.23: Inselbergs in the Western Sahara. Nick Brooks. 2007. CC BY 2.0. https://commons.wikimedia.org/wiki/File:Breast-Shaped_Hill.jpg
Figure 13.24: Satellite image of desert playa surrounded by mountains. Robert Simmon, using Landsat data from the U.S. Geological Survey and NASA. 2013. Public domain. https://earthobservatory.nasa.gov/images/80913/eye-exam-for-a-satellite
Figure 13.25: Dry wash (or ephemeral stream). Finetooth. 2010. CC BY-SA 3.0. https://commons.wikimedia.org/wiki/File:Dry_Wash_in_PEFO_NP.jpg
Figure 13.26: Flash flood in a dry wash. USGS. 2016. Public domain. https://www.usgs.gov/media/images/a-flooded-river-australia
Figure 13.27: Sahara Desert, a sand sea or erg. Wsx. 2004. CC BY-SA 3.0. https://commons.wikimedia.org/wiki/File:Sahara_Desert_in_Jalu,_Libya.jpeg
Figure 13.28: Formation of cross bedding in sand dunes. David Tarailo, GSA, GeoCorps Program. 2015. Public domain. https://commons.wikimedia.org/wiki/File:Formation_of_cross-bedding.jpg
Figure 13.29: Cross beds in the Navajo Sandstone at Zion National Park. Roy Luck. 2010. CC BY 2.0. https://commons.wikimedia.org/wiki/File:Sandstone_showing_Cross-bedding_Zion_National_Park_Utah_USA.jpg
Figure 13.30: Enlarged image of frosted and rounded windblown sand grains. Wilson44691. 2008. Public domain. https://commons.wikimedia.org/wiki/File:CoralPinkSandDunesSand.JPG
Figure 13.31: NASA image of barchan dune field in coastal Brazil. NASA. 2003. Public domain. https://earthobservatory.nasa.gov/images/3889/coastal-dunes-brazil
Figure 13.32: Satellite image of longitudinal dunes in Egypt. NASA. 2012. Public domain. https://earthobservatory.nasa.gov/images/78151/linear-dunes-great-sand-sea-egypt
Figure 13.33: Parabolic dunes. Po ke jung. 2011. CC BY 3.0. https://commons.wikimedia.org/wiki/File:Parabolic_dune.jpg
Figure 13.34: Star dune in Namib Desert. Dave Curtis. 2005. CC BY-NC-ND 2.0. https://flic.kr/p/4N5Fa
Figure 13.35: The Great Basin. Kmusser; adapted by Hike395. 2022. CC BY-SA 3.0. https://commons.wikimedia.org/wiki/File:Great_Basin_map.gif
Figure 13.36: Typical Basin and Range scene. Matt Affolter (QFL247). 2010. CC BY-SA 3.0. https://commons.wikimedia.org/wiki/File:RidgecrestCA.JPG
Figure 13.37: World map showing desertification vulnerability. USDA. 1998. Public domain. https://commons.wikimedia.org/wiki/File:Desertification_map.png
The measure of degrees north or south from the equator, which has a latitude of 0 degrees. The Earth's north and south poles have latitudes of 90 degrees north and south, respectively.
Breaking down rocks into small pieces by chemical or mechanical means.
The transport and movement of weathered sediments.
Sediment gathering together and collecting, typically in a topographic low point.
A large pile of sediment, deposited perpendicular to flow. Internal bedding in dunes dips toward flow direction (i.e. cross bedding). Formed in the upper part of the lower flow regime.
Term for the extensional tectonic province that extends from California’s Sierra Nevada Mountains in the west, to Utah’s Wasatch Mountains to the east, to southern Oregon and Idaho to the north, to northern Mexico to the south. Known as a wide rift, each graben (basin) is bounded by horsts (ranges).
Depositional environments that are on land.
The act of a solid coming out of solution, typically resulting from a drop in temperature or a decrease of the dissolving material.
The measure of the vibrational (kinetic) energy of a substance.
The gases that are part of the Earth, which are mainly nitrogen and oxygen.
Wind patterns that move from east to west near the equator, due to global circulation patterns.
Driest nonpolar desert on Earth, located in west-central South America.
Deserts formed by descending air at the poles.
The layers of igneous, sedimentary, and metamorphic rocks that form the continents. Continental crust is much thicker than oceanic crust. Continental crust is defined as having higher concentrations of very light elements like K, Na, and Ca, and is the lowest density rocky layer of Earth. Its average composition is similar to granite.
Angle from perpendicular to the ground surface at which light rays hit the ground. If the sun is directly above a point and light rays are hitting the ground directly, then the angle of incidence is 0.
A part of the global circulation system that rises at the equator and sinks at 30°.
Part of the global circulation pattern where air sinks at the poles (90° latitude) and rises at 60° latitude.
Winds that move from west to east between 30° and 60° latitude due to global circulation patterns.
Desert area stretching from California to the west, Utah to the east, and Idaho/Oregon to the north. Partially caused by latitude, partially caused by rain shadow.
The entire area which is related to land-sea interactions.
A down-warped feature in the crust.
Dividing two-dimensional line between the two sides of a fold.
The thin, outer layer of the Earth which makes up the rocky bottom of the ocean basins. Oceanic crust is much thinner (but denser) than continental crust. Oceanic crust is made of rocks similar to basalt and as it cools, becomes more dense.
Large circular ocean currents formed by global atmospheric circulation patters.
Current conditions within the atmosphere.
A channelled body of water.
Breaking down of mineral material via chemical methods, like dissolution and oxidation.
Water that flows over the surface.
A process where water freezes inside cracks in rocks, causing expansion and mechanical weathering.
Dangerous flooding that occurs in arid regions.
Dark mineralization that forms on rocks in desert environments.
A natural substance that is typically solid, has a crystalline structure, and is typically formed by inorganic processes. Minerals are the building blocks of most rocks.
Minerals in which ions are bonded to oxygen, such as hematite (Fe2O3).
Pieces of rock that have been weathered and possibly eroded.
Dust storms that occur in desert areas.
Wind-blown silt, mainly formed from glacial processes.
Thick glaciers that cover continents during ice ages.
A period of cooler temperatures on Earth in which ice sheets can grow on continents.
Sediment that large and dense, typically sits on the bottom of stream channels, and is only moved with higher-speed flows.
Bedload sediments that can be carried by higher-velocity flows.
Silt and sand that is lifted from the bed and transported for short distances.
Term for the underlying lithified rocks that make up the geologic record in an area. This term can sometimes refer to only the deeper, crystalline (non-layered) rocks.
The range of sediment sizes within a sediment or sediment within sedimentary rocks. Well sorted means the sediment has the same sizes, poorly sorted means many different sizes are present.
A slow and steady movement. Can occur as part of faults, mass wasting, and grain movement.
Pieces of rock that have been weathered and possibly eroded.
Rocks that move along thin ice sheets with high winds.
A dry lake bed in a desert valley.
Erosional rock face caused by sand abrasion.
Rock with abraded surfaces formed in deserts.
A depression in dune sediment formed because of a lack of anchoring vegetation.
Depositional environments that are associated with running water.
An interconnected set of parts that combine and make up a whole.
Place where rivers enter a large body of water, forming a triangular shape as the river deposits sediment and switches course.
Loose sediment deposited from running water.
A group of several alluvial fans that have come together and formed a single surface.
Isolated piece of bedrock which sticks above an alluvial surface.
A specific layer of rock with identifiable properties.
A stream or river that can be wet or dry depending on the season.
A unit of the geologic time scale; smaller than an era, larger than an epoch. We are currently in the Quaternary period.
A type of non-eroded sediment mixed with organic matter, used by plants. Many essential elements for life, like nitrogen, are delivered to organisms via the soil.
Planar flow of water over land surfaces.
Dry riverbed in an arid region.
The area within a topographic basin or drainage divide in which water collects.
A vast stretch of sand dunes.
Deposition with wind-blown sediment.
A sedimentary structure that has inclined layers within an overall layer. Forms commonly in dunes, larger in eolian dunes.
Slope angle where shear forces and normal forces are equal.
Meaning "middle life," it is the middle era of the Phanerozoic, starting at 252 million years ago and ending 66 million years ago. Known as the Age of Reptiles.
The second largest span of time recognized by geologists; smaller than an eon, larger than a period. We are currently in the Cenozoic era.
A rock primarily made of sand.
An extensive, distinct, and mapped set of geologic layers.
The middle period of the Mesozoic era, 201-145 million years ago.
SiO2. Transparent, but can be any color imaginable with impurities. No cleavage, hard, and commonly forms equant masses. Perfect crystals are hexagonal prisms topped with pyramidal shapes. One of the most common minerals, and is found in many different geologic settings, including the dominant component of sand on the surface of Earth. Structure is a three-dimensional network of silica tetrahedra, connected as much as possible to each other.
Rocks that are formed from liquid rock, i.e. from volcanic processes.
A term for the collective time before the Phanerozoic (pre-541 million years ago), including the Hadean, Archean, and Proterozoic. Known for a lack of easy-to-find fossils.
Dunes that are much longer than wide, forming from wind that varies in two opposite directions.
Dunes that form semicircular shapes due to anchoring vegetation.
Dunes that form from many different wind directions.
Uplifted mountain block caused by normal faulting.
A valley formed by normal faulting.
A dip-slip fault in which the hanging wall drops relative to the footwall, caused by extensional forces.
Stresses that pull objects apart into a larger surface area or volume; stretching forces.
The outermost physical layer of the Earth, made of the entire crust and upper mantle. It is brittle and broken into a series of plates, and these plates move in various ways (relative to one another), causing the features of the theory of plate tectonics.
An interpretation of the rock record which describes the cause of sedimentation (i.e. ancient beach, river, swamp, etc.).
Lakes that form via increased precipitation with glacial climate shifts.
Long term averages and variations within the conditions of the atmosphere.
Planar feature where two blocks of bedrock move past each other via earthquakes.
The process that turns non-desert land into desert.
Organic rich material found in soil.
Water that is below the surface.
Water that works its way down into the subsurface.
A process that exacerbates the effects of an input, amplifying the output. That is, a one-directional loop that self-reinforces change.
Deserts that form as air loses moisture traveling over mountains.
Any evidence of ancient life.
