16 Energy and Mineral Resources
Learning Objectives
By the end of this chapter, students should be able to:
- Describe how a renewable resource is different from a nonrenewable resource.
- Compare the pros and cons of extracting and using fossil fuels and conventional and unconventional petroleum sources.
- Describe how metallic minerals are formed and extracted.
- Understand how society uses nonmetallic mineral resources.
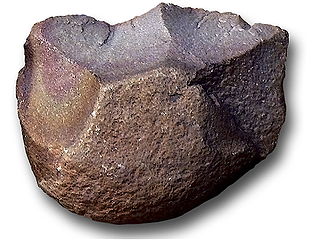
This text has previously discussed geology’s pioneers, such as scientists James Hutton and Charles Lyell, but the first real “geologists” were the hominids who picked up stones and began the stone age. Maybe stones were first used as curiosity pieces, maybe as weapons, but ultimately, they were used as tools. This was the Paleolithic Period, the beginning of geologic study, and it dates back 2.6 million years to east Africa.
In modern times, geologic knowledge is important for locating economically valuable materials for society’s use. In fact, all things we use come from only three sources: they are farmed, hunted or fished, or mined. At the turn of the twentieth century, speculation was rampant that food supplies would not keep pace with world demand, suggesting the need to develop artificial fertilizers. Sources of fertilizer ingredients are: nitrogen is processed from the atmosphere, using the Haber process for the manufacture of ammonia from atmospheric nitrogen and hydrogen; potassium comes from the hydrosphere, such as lakes or ocean evaporation; and phosphorus is mined from the lithosphere, such as minerals like apatite from phosphorite rock, which is found in Florida, North Carolina, Idaho, Utah, and around the world. Thus, without mining and processing of natural materials, modern civilization would not exist. Indeed, geologists are essential in this process.
16.1 Mining
Mining is defined as extracting valuable materials from the Earth for society’s use. Usually, these include solid materials such as gold, iron, coal, diamond, sand, and gravel, but materials can also include fluid resources such as oil and natural gas. Modern mining has a long relationship with modern society. The oldest mine dates back 40,000 years to the Lion Cavern in Swaziland where there is evidence of concentrated digging into the Earth for hematite, an important iron ore used as red dye. Resources extracted by mining are generally considered to be nonrenewable.
16.1.1 Renewable versus Nonrenewable Resources
Resources generally come in two major categories: renewable and nonrenewable. Renewable resources can be reused over and over or their availability replicated over a short human life span; nonrenewable resources cannot.
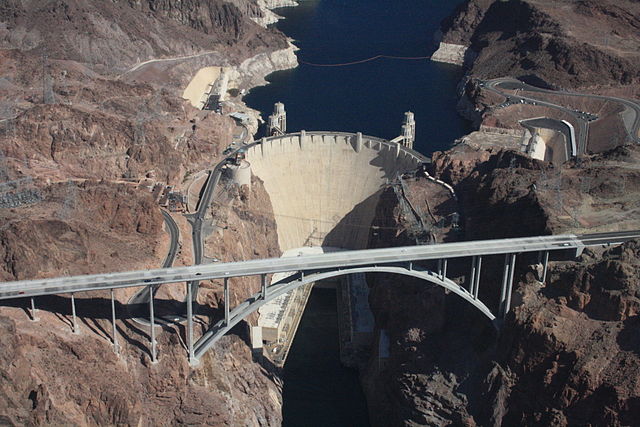
Renewable resources are materials present in our environment that can be exploited and replenished. Some common renewable energy sources are linked with green energy sources because they are associated with relatively small or easily remediated environmental impact. For example, solar energy comes from fusion within the Sun, which radiates electromagnetic energy. This energy reaches the Earth constantly and consistently and should continue to do so for about five billion more years. Wind energy, also related to solar energy, is maybe the oldest renewable energy and is used to sail ships and power windmills. Both solar and wind-generated energy are variable on Earth’s surface. These limitations are offset because we can use energy storing devices, such as batteries or electricity exchanges between producing sites. The Earth’s heat, known as geothermal energy, can be viable anywhere that geologists drill deeply enough. In practice, geothermal energy is more useful where heat flow is great, such as volcanic zones or regions with a thinner crust. Hydroelectric dams provide energy by allowing water to fall through the dam under gravity, which activates turbines that produce the energy. Ocean tides are also a reliable energy source. All of these renewable resources provide energy that powers society. Other renewable resources are plant and animal matter, which are used for food, clothing, and other necessities, but are being researched as possible energy sources.
Nonrenewable resources cannot be replenished at a sustainable rate. They are finite within human time frames. Many nonrenewable resources come from planetary, tectonic, or long-term biologic processes and include materials such as gold, lead, copper, diamonds, marble, sand, natural gas, oil, and coal. Most nonrenewable resources include specific concentrated elements listed on the periodic table; some are compounds of those elements. For example, if society needs iron (Fe) sources, then an exploration geologist will search for iron-rich deposits that can be economically extracted. Nonrenewable resources may be abandoned when other materials become cheaper or serve a better purpose. For example, coal is abundantly available in England and other nations, but because oil and natural gas are available at a lower cost and lower environmental impact, coal use has decreased. Economic competition among nonrenewable resources is shifting use away from coal in many developed countries.
16.1.2 Ore
Earth’s materials include the periodic table elements. However, it is rare that these elements are concentrated to the point where it is profitable to extract and process the material into usable products. Any place where a valuable material is concentrated is a geologic and geochemical anomaly. A body of material from which one or more valuable substances can be mined at a profit, is called an ore deposit. Typically, the term ore is used for only metal-bearing minerals, but it can be applied to valuable nonrenewable resource concentrations such as fossil fuels, building stones, and other nonmetal deposits, even groundwater. If a metal-bearing resource is not profitable to mine, it is referred to as a mineral deposit. The term natural resource is more common than the term ore for non-metal-bearing materials.
It is implicit that the technology to mine is available, economic conditions are suitable, and political, social and environmental considerations are satisfied in order to classify a natural resource deposit as ore. Depending on the substance, it can be concentrated in a narrow vein or distributed over a large area as a low-concentration ore. Some materials are mined directly from bodies of water (e.g. sylvite for potassium; water through desalination) and the atmosphere (e.g. nitrogen for fertilizers). These differences lead to various methods of mining, and differences in terminology depending on the certainty. Ore mineral resource is used for an indication of ore that is potentially extractable, and the term ore mineral reserve is used for a well defined (proven), profitable amount of extractable ore.
16.1.3 Mining Techniques
The mining style is determined by technology, social license, and economics. It is in the best interest of the company extracting the resources to do so in a cost-effective way. Fluid resources, such as oil and gas, are extracted by drilling wells and pumping. Over the years, drilling has evolved into a complex discipline in which directional drilling can produce multiple bifurcations and curves originating from a single drill collar at the surface. Using geophysical tools like seismic imaging, geologists can pinpoint resources and extract efficiently.
Solid resources are extracted by two principal methods of which there are many variants. Surface mining is used to remove material from the outermost part of the Earth. Open pit mining is used to target shallow, broadly disseminated resources.
Open pit mining requires careful study of the ore body through surface mapping and drilling exploratory cores. The pit is progressively deepened through additional mining cuts to extract the ore. Typically, the pit’s walls are as steep as can be safely managed. Once the pit is deepened, widening the top is very expensive. A steep wall is thus an engineering balance between efficient and profitable mining (from the company’s point of view) and mass wasting (angle of repose from a safety p0int of view) so that there is less waste to remove. The waste is called non-valuable rock or overburden and moving it is costly. Occasionally, landslides do occur, such as the very large landslide in the Kennecott Bingham Canyon mine, Utah, in 2013. These events are costly and dangerous. The job of engineering geologists is to carefully monitor the mine; when company management heeds their warnings, there is ample time and action to avoid or prepare for any slide.
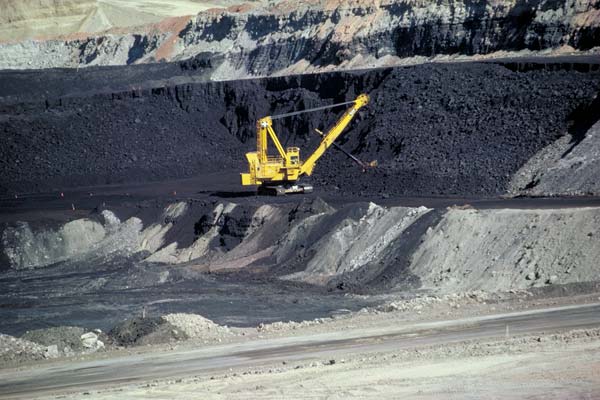
Strip mining and mountaintop mining are surface mining techniques that are used to mine resources that cover large areas, especially layered resources, such as coal. In this method, an entire mountaintop or rock layer is removed to access the ore below. Surface mining’s environmental impacts are usually much greater due to the large surface footprint that’s disturbed.
Underground mining is a method often used to mine higher-grade, more localized, or very concentrated resources. For one example, geologists mine some underground ore minerals by introducing chemical agents, which dissolve the target mineral. Then, they bring the solution to the surface where precipitation extracts the material. But more often, a mining shaft tunnel or a large network of these shafts and tunnels is dug to access the material. The decision to mine underground or from Earth’s surface is dictated by the ore deposit’s concentration, depth, geometry, land-use policies, economics, surrounding rock strength, and physical access to the ore. For example, to use surface mining techniques for deeper deposits might require removing too much material, or the necessary method may be too dangerous or impractical, or removing the entire overburden may be too expensive, or the mining footprint would be too large. These factors may prevent geologists from surface mining materials and cause a project to be mined underground. The mining method and its feasibility depends on the commodity’s price and the cost of the technology needed to remove it and deliver it to market. Thus, mines and the towns that support them come and go as the commodity price varies. And, conversely, technological advances and market demands may reopen mines and revive ghost towns.
16.1.4 Concentrating and Refining
All ore minerals occur mixed with less desirable components called gangue. The process of physically separating gangue minerals from ore bearing minerals is called concentrating. Separating a desired element from a host mineral by chemical means, including heating, is called smelting. Finally, taking a metal such as copper and removing other trace metals such as gold or silver is done through the refining process. Typically, refining is done one of three ways: 1. Materials can either be mechanically separated and processed based on the ore mineral’s unique physical properties, such as recovering placer gold based on its high density. 2. Materials can be heated to chemically separate desired components, such as refining crude oil into gasoline. 3. Materials can be smelted, in which controlled chemical reactions unbind metals from the minerals they are contained in, such as when copper is taken out of chalcopyrite (CuFeS2). Mining, concentrating, smelting, and refining processes require enormous energy. Continual advances in metallurgy- and mining-practice strive to develop ever more energy efficient and environmentally benign processes and practices.

Take this quiz to check your comprehension of this section.
If you are using an offline version of this text, access the quiz for section 16.1 via the QR code.
16.2 Fossil Fuels
Fossil fuels are extractable sources of stored energy that were created by ancient ecosystems. The natural resources that typically fall under this category are coal, oil, petroleum, and natural gas. These resources were originally formed via photosynthesis by living organisms such as plants, phytoplankton, algae, and cyanobacteria. This energy is actually fossil solar energy, since the sun’s ancient energy was converted by ancient organisms into tissues that preserved the chemical energy within the fossil fuel. Of course, as the energy is used, just like photosynthetic respiration that occurs today, carbon enters the atmosphere as CO2, causing climate consequences (see chapter 15). Today humanity uses fossil fuels for most of the world’s energy.
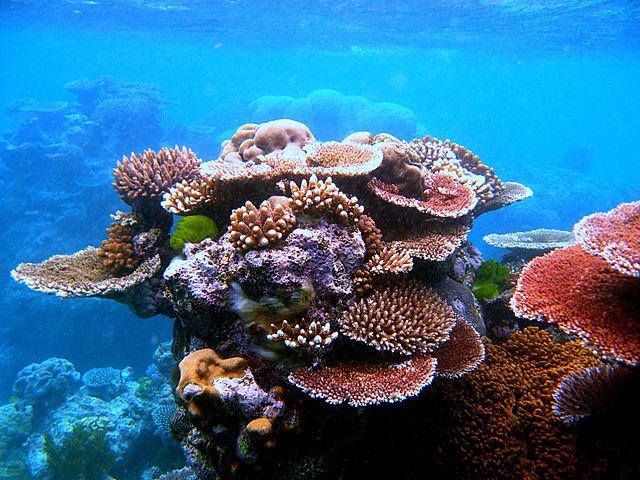
Converting solar energy by living organisms into hydrocarbon fossil fuels is a complex process. As organisms die, they decompose slowly, usually due to being buried rapidly, and the chemical energy stored within the organisms’ tissues is buried within surrounding geologic materials. All fossil fuels contain carbon that was produced in an ancient environment. In environments rich with organic matter such as swamps, coral reefs, and planktonic blooms, there is a higher potential for fossil fuels to accumulate. Indeed, there is some evidence that over geologic time, organic hydrocarbon fossil fuel material was highly produced globally. Lack of oxygen and moderate temperatures in the environment seem to help preserve these organic substances. Also, the heat and pressure applied to organic material after it is buried contribute to transforming it into higher quality materials, such as brown coal to anthracite and oil to gas. Heat and pressure can also cause mobile materials to migrate to conditions suitable for extraction.
16.2.1 Oil and Gas
Petroleum is principally derived from organic-rich shallow marine sedimentary deposits where the remains of micro-organisms like plankton accumulated in fine grained sediments. Petroleum’s liquid component is called oil, and its gas component is called natural gas, which is mostly made up of methane (CH4). As rocks such as shale, mudstone, or limestone lithify, increasing pressure and temperature cause the oil and gas to be squeezed out and migrate from the source rock to a different rock unit higher in the rock column. Similar to the discussion of good aquifers in chapter 11, if that rock is a sandstone, limestone, or other porous and permeable rock, and involved in a suitable stratigraphic or structural trapping process, then that rock can act as an oil and gas reservoir.
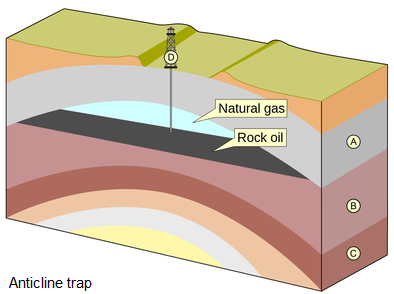
A trap is a combination of a subsurface geologic structure, a porous and permeable rock, and an impervious layer that helps block oil and gas from moving further, which concentrates it for humans to extract later. A trap develops due to many different geologic situations. Examples include an anticline or domal structure, an impermeable salt dome, or a fault bounded stratigraphic block, which is porous rock next to nonporous rock. The different traps have one thing in common: they pool fluid fossil fuels into a configuration in which extracting it is more likely to be profitable. Oil or gas in strata outside of a trap renders it less viable to extract.
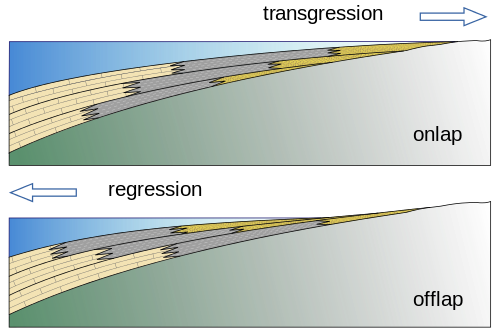
Sequence stratigraphy is a branch of geology that studies sedimentary facies both horizontally and vertically and is devoted to understanding how sea level changes create organic-rich shallow marine muds, carbonates, and sands in areas that are close to each other. For example, shoreline environments may have beaches, lagoons, reefs, nearshore and offshore deposits, all next to each other. Beach sand, lagoonal and nearshore muds, and coral reef layers accumulate into sediments that include sandstones—good reservoir rocks— next to mudstones, next to limestones, both of which are potential source rocks. As sea level either rises or falls, the shoreline’s location changes, and the sand, mud, and reef locations shift with it (see the figure). This places oil and gas producing rocks, such as mudstones and limestones next to oil and gas reservoirs, such as sandstones and some limestones. Understanding how the lithology and the facies/stratigraphic relationships interplay is very important in finding new petroleum resources. Using sequence stratigraphy as a model allows geologists to predict favorable locations of the source rock and reservoir.
16.2.2 Tar Sands
Conventional oil and gas, which is pumped from a reservoir, is not the only way to obtain hydrocarbons. There are a few fuel sources known as unconventional petroleum sources. However, they are becoming more important as conventional sources become scarce. Tar sands, or oil sands, are sandstones that contain petroleum products that are highly viscous, like tar, and thus cannot be drilled and pumped out of the ground readily like conventional oil. This unconventional fossil fuel is bitumen, which can be pumped as a fluid only at very low recovery rates and only when heated or mixed with solvents. So, using steam and solvent injections or directly mining tar sands to process later are ways to extract the tar from the sands. Alberta, Canada is known to have the largest tar sand reserves in the world. Note: as with ores, an energy resource becomes uneconomic if the total extraction and processing costs exceed the extracted material’s sales revenue. Environmental costs may also contribute to a resource becoming uneconomic.
16.2.3 Oil Shale
Oil shale, or tight oil, is a fine-grained sedimentary rock that has significant petroleum or natural gas quantities locked tightly in the sediment. Shale has high porosity but very low permeability and is a common fossil fuel source rock. To extract the oil directly from the shale, the material has to be mined and heated, which, like with tar sands, is expensive and typically has a negative environmental impact.
16.2.4 Fracking
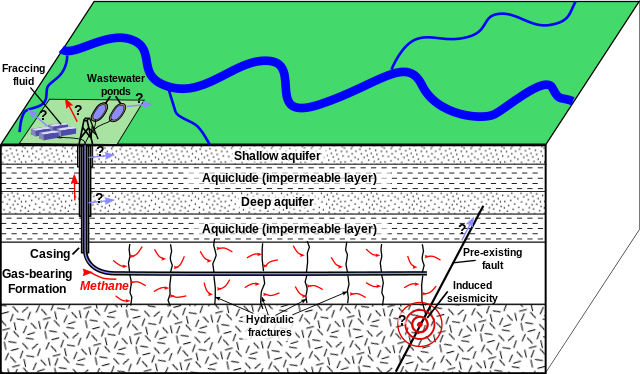
Another process used to extract the oil and gas from shale and other unconventional tight resources is called hydraulic fracturing, better known as fracking. In this method, high-pressure water, sand grains, and added chemicals are injected and pumped underground. Under high pressure, this creates and holds open fractures in the rocks, which help release the hard-to-access mostly natural gas fluids. Fracking is more useful in tighter sediments, especially shale, which has a high porosity to store the hydrocarbons but low permeability to allow transmission of the hydrocarbons. Fracking has become controversial because its methods contaminate groundwater and induce seismic activity. This has created much controversy between public concerns, political concerns, and energy value.
16.2.5 Coal
Coal comes from fossilized swamps, though some older coal deposits that predate terrestrial plants are presumed to come from algal buildups. Coal is chiefly carbon, hydrogen, nitrogen, sulfur, and oxygen, with minor amounts of other elements. As plant material is incorporated into sediments, heat and pressure cause several changes that concentrate the fixed carbon, which is the coal’s combustible portion. So, the more heat and pressure that coal undergoes, the greater is its carbon concentration and fuel value and the more desirable is the coal.
This is the general sequence of a swamp progressing through the various stages of coal formation and becoming more concentrated in carbon: Swamp => Peat => Lignite => Sub-bituminous => Bituminous => Anthracite => Graphite. As swamp materials collect on the swamp floor and are buried under accumulating materials, they first turn to peat.
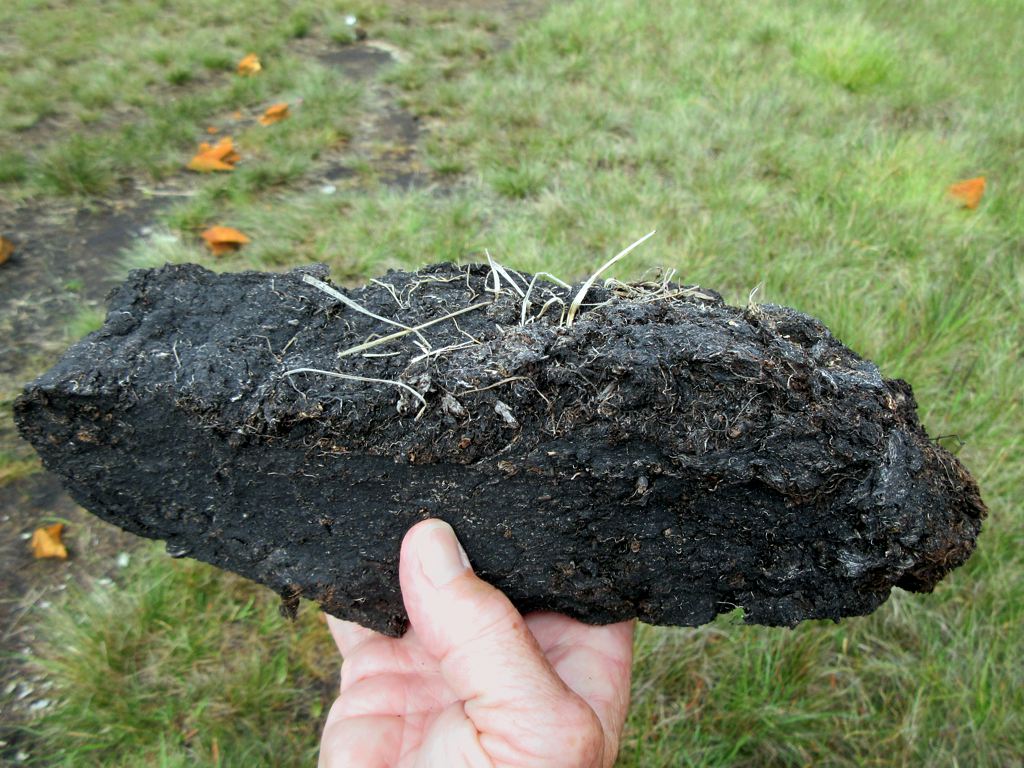
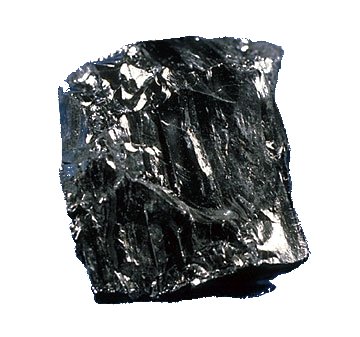
Peat itself is an economic fuel in some locations like the British Isles and Scandinavia. As lithification occurs, peat turns to lignite. With increasing heat and pressure, lignite turns to sub-bituminous coal, bituminous coal, and then, in a process like metamorphism, anthracite. Anthracite is the highest metamorphic grade and most desirable coal since it provides the highest energy output. With even more heat and pressure driving out all the volatiles and leaving pure carbon, anthracite can become graphite.
Humans have used coal for at least 6,000 years, mainly as a fuel source. Coal resources in Wales are often cited as a primary reason for Britain’s rise, and later, for the United States’ rise during the Industrial Revolution. According to the US Energy Information Administration, US coal production has decreased due to competing energy sources’ cheaper prices and due to society recognizing its negative environmental impacts, including increased very fine-grained particulate matter as an air pollutant, greenhouse gases, acid rain, and heavy metal pollution. Seen from this perspective, the coal industry as a source of fossil energy is unlikely to revive.
As the world transitions away from fossil fuels including coal, and manufacturing seeks strong, flexible, and lighter materials than steel including carbon fiber for many applications, current research is exploring coal as a source of this carbon.

Take this quiz to check your comprehension of this section.
If you are using an offline version of this text, access the quiz for section 16.2 via the QR code.
16.3 Mineral Resources
Mineral resources, while principally nonrenewable, are generally placed in two main categories: metallic, which contain metals, and nonmetallic, which contain other useful materials. Most mining has been traditionally focused on extracting metallic minerals. Human society has advanced significantly because we’ve developed the knowledge and technologies to yield metal from the Earth. This knowledge has allowed humans to build the machines, buildings, and monetary systems that dominate our world today. Locating and recovering these metals has been a key facet of geologic study since its inception. Every element across the periodic table has specific applications in human civilization. Metallic mineral mining is the source of many of these elements.
16.3.1 Types of Metallic Mineral Deposits
The various ways in which minerals and their associated elements concentrate to form ore deposits are too complex and numerous to fully review in this text. However, entire careers are built around them. In the following section, we describe some of the more common deposit types along with their associated elemental concentrations and world class occurrences.
Magmatic Processes
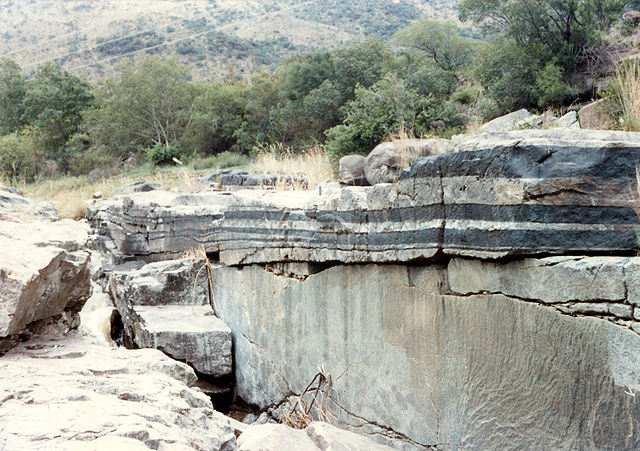
When a magmatic body crystallizes and differentiates (see chapter 4), it can cause certain minerals and elements to concentrate. Layered intrusions, typically ultramafic to mafic, can host deposits that contain copper, nickel, platinum, palladium, rhodium, and chromium. The Stillwater Complex in Montana is an example of economic quantities of layered mafic intrusion. Associated deposit types can contain chromium or titanium-vanadium. The largest magmatic deposits in the world are the chromite deposits in the Bushveld Igneous Complex in South Africa. These rocks have an areal extent larger than the state of Utah. The chromite occurs in layers, which resemble sedimentary layers, except these layers occur within a crystallizing magma chamber.

Water and other volatiles that are not incorporated into mineral crystals when a magma crystallizes can become concentrated around the crystallizing magma’s margins. Ions in these hot fluids are very mobile and can form exceptionally large crystals. Once crystallized, these large crystal masses are then called pegmatites. They form from magma fluids that are expelled from the solidifying magma when nearly the entire magma body has crystallized. In addition to minerals that are predominant in the main igneous mass, such as quartz, feldspar, and mica, pegmatite bodies may also contain very large crystals of unusual minerals that contain rare elements like beryllium, lithium, tantalum, niobium, and tin, as well as native elements like gold. Such pegmatites are ores of these metals.
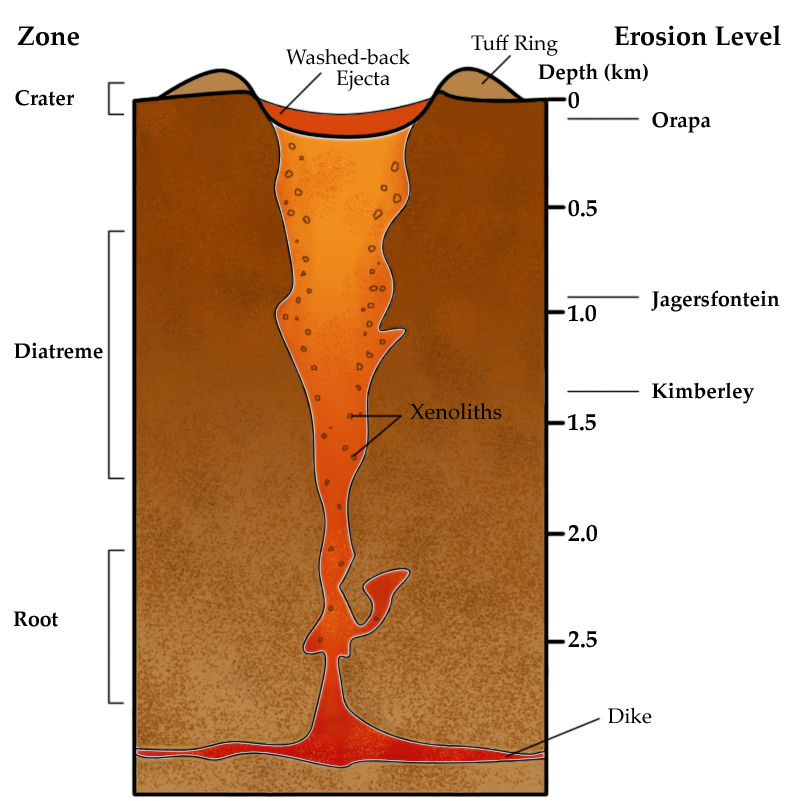
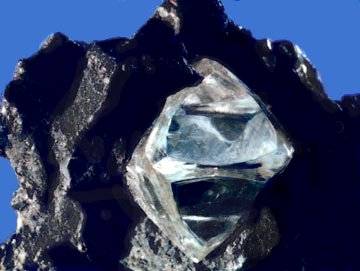
An unusual magmatic process is a kimberlite pipe, which is a volcanic conduit that transports ultramafic magma from within the mantle to the surface. Diamonds, which are formed at great temperatures and pressures of depth, are transported by a Kimberlite pipe to locations where they can be mined. The process that created these kimberlite ultramafic rocks is no longer common on Earth. Most known deposits are from the Archean Eon.
Hydrothermal Processes
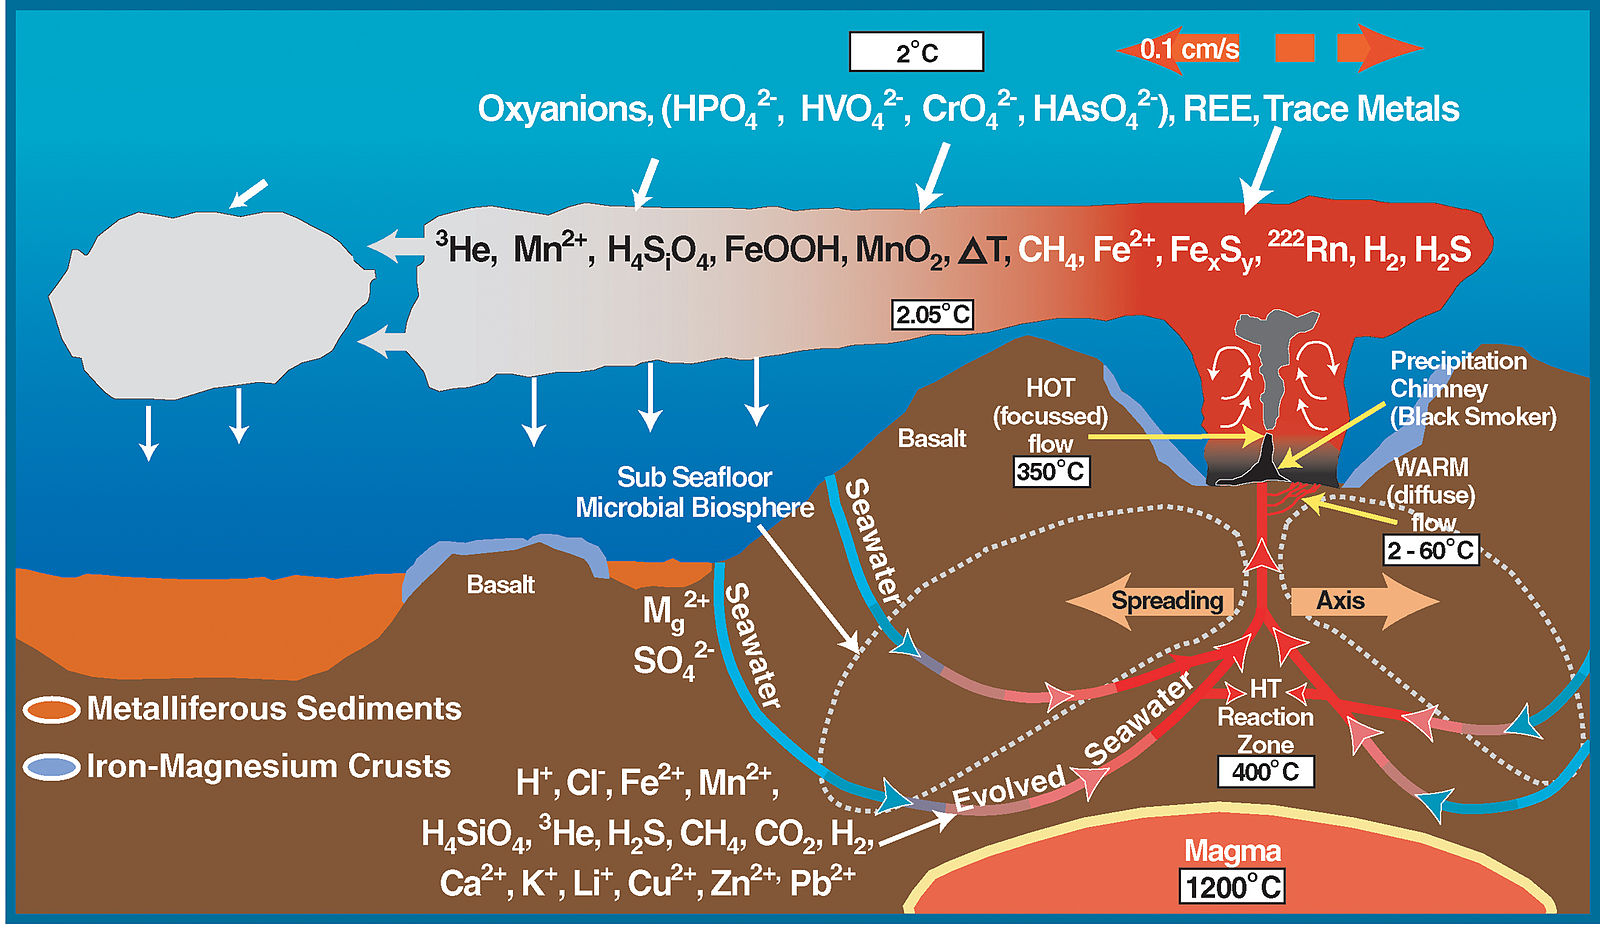
Fluids rising from crystallizing magmatic bodies or that are heated by the geothermal gradient cause many geochemical reactions that form various mineral deposits. The most active hydrothermal process today produces volcanogenic massive sulfide (VMS) deposits, which form from black smoker hydrothermal chimney activity near mid-ocean ridges all over the world. They commonly contain copper, zinc, lead, gold, and silver when found at the surface. Evidence from around 7000 BC in a period known as the Chalcolithic shows copper was among the earliest metals smelted by humans as means of obtaining higher temperatures were developed. The largest of these VMS deposits occur in Precambrian period rocks. The Jerome deposit in central Arizona is a good example.
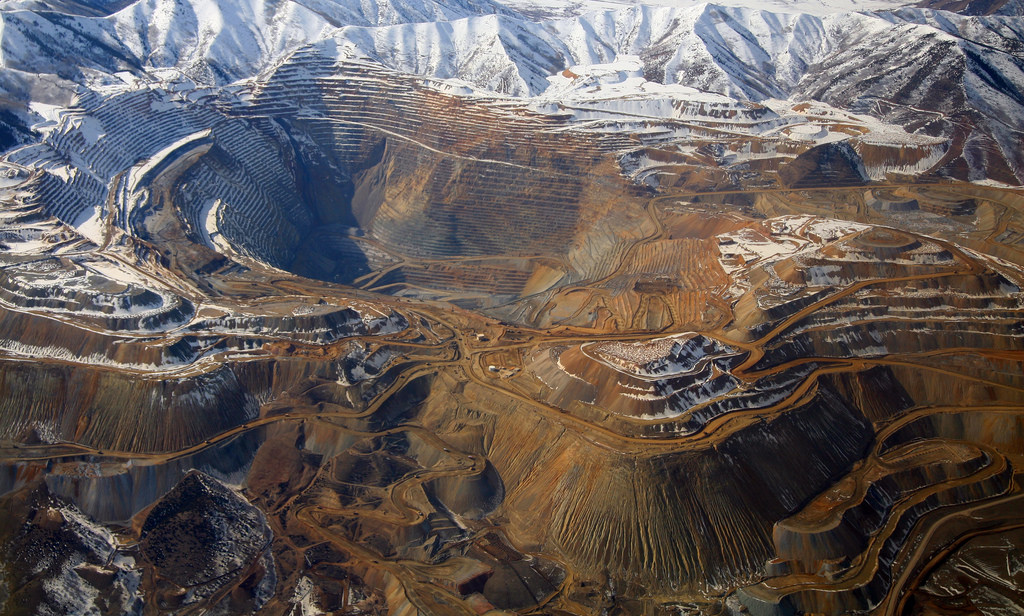
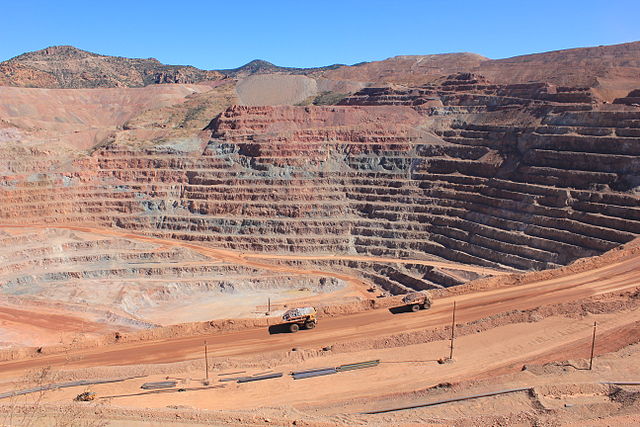
Another deposit type that draws on magma-heated water is a porphyry deposit. This is not to be confused with the porphyritic igneous texture, although the name is derived from the porphyritic texture that is nearly always present in the igneous rocks associated with a porphyry deposit. Several types of porphyry deposits exist, such as porphyry copper, porphyry molybdenum, and porphyry tin. These deposits contain low-grade disseminated ore minerals closely associated with intermediate and felsic intrusive rocks that are present over a very large area. Porphyry deposits are typically the largest mines on Earth. One of the largest, richest, and possibly best studied mine in the world is Utah’s Kennecott Bingham Canyon Mine. It’s an open pit mine, which, for over 100 years, has produced several elements including copper, gold, molybdenum, and silver. Underground carbonate replacement deposits produce lead, zinc, gold, silver, and copper. In the mine’s past, the open pit predominately produced copper and gold from chalcopyrite and bornite. Gold only occurs in minor quantities in the copper-bearing minerals, but because the Kennecott Bingham Canyon Mine produces on such a large scale, it is one of the largest gold mines in the US. In the future, this mine may produce more copper and molybdenum (molybdenite) from deeper underground mines.
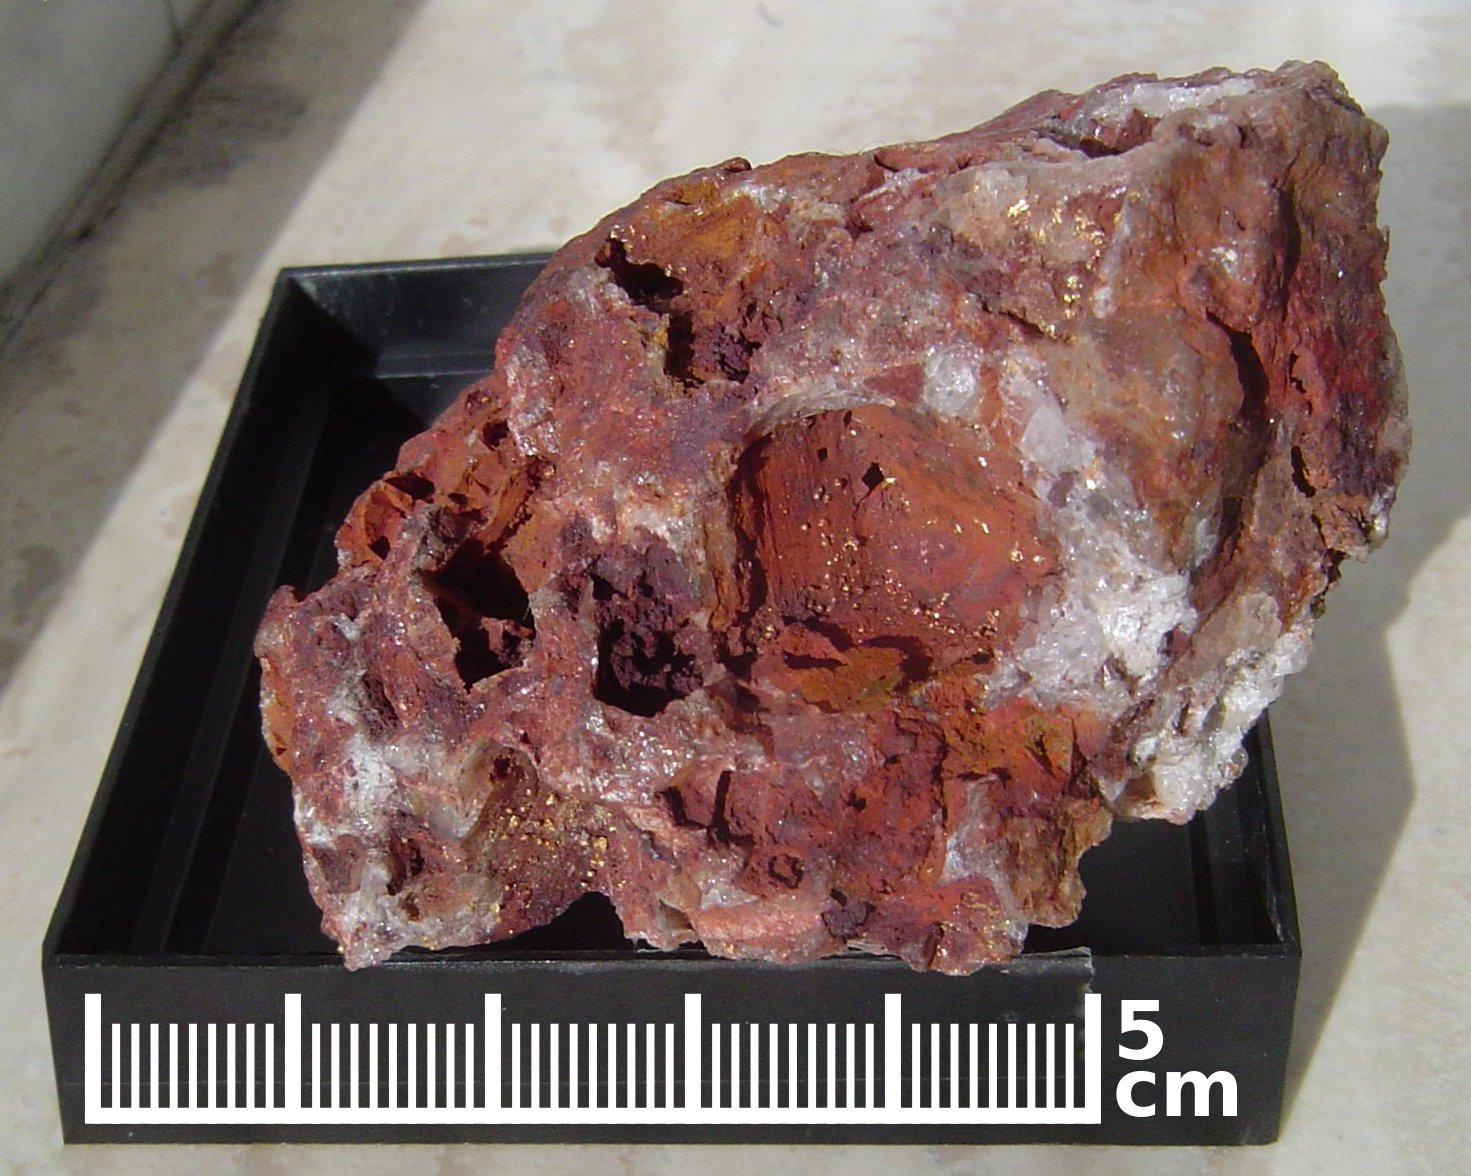
Most porphyry copper deposits owe their high metal content, and hence, their economic value to weathering processes called supergene enrichment which occurs when the deposit is uplifted, eroded, and exposed to oxidation. This process occurred millions of years after the initial igneous intrusion and hydrothermal expulsion ends. When the deposit’s upper pyrite-rich portion is exposed to rain, the pyrite in the oxidizing zone creates an extremely acid condition that dissolves copper out of copper minerals, such as chalcopyrite, and converts the chalcopyrite to iron oxides, such as hematite or goethite. The copper minerals are carried downward in water until they arrive at the groundwater table and an environment where the primary copper minerals are converted into secondary higher-copper content minerals. Chalcopyrite (35% Cu) is converted to bornite (63% Cu), and ultimately, chalcocite (80% Cu). Without this enriched zone, which is two to five times higher in copper content than the main deposit, most porphyry copper deposits would not be economic to mine.
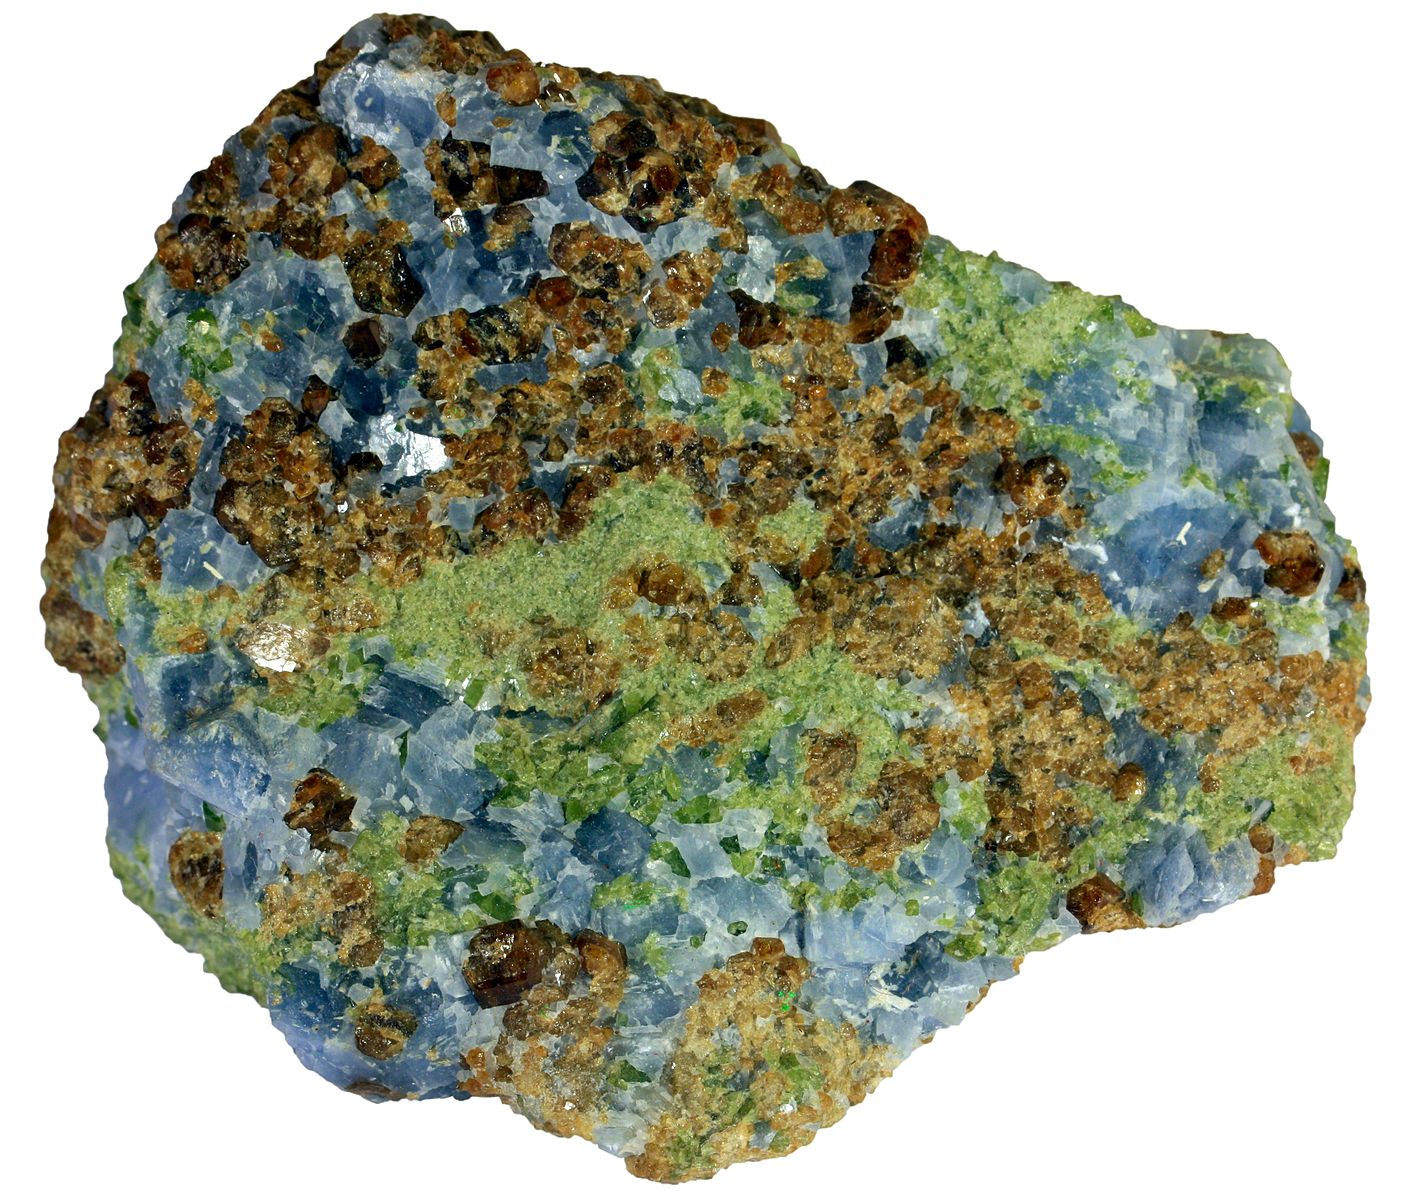
If limestone or other calcareous sedimentary rocks are near the magmatic body, then another type of ore deposit called a skarn deposit forms. These metamorphic rocks form as magma-derived, highly saline metalliferous fluids react with carbonate rocks to create calcium-magnesium-silicate minerals like pyroxene, amphibole, and garnet, as well as high-grade iron, copper, zinc minerals, and gold. Intrusions that are genetically related to the intrusion that made the Kennecott Bingham Canyon deposit have also produced copper-gold skarns, which were mined by the early European settlers in Utah. When iron and/or sulfide deposits undergo metamorphism, the grain size commonly increases, which makes separating the gangue from the desired sulfide or oxide minerals much easier.
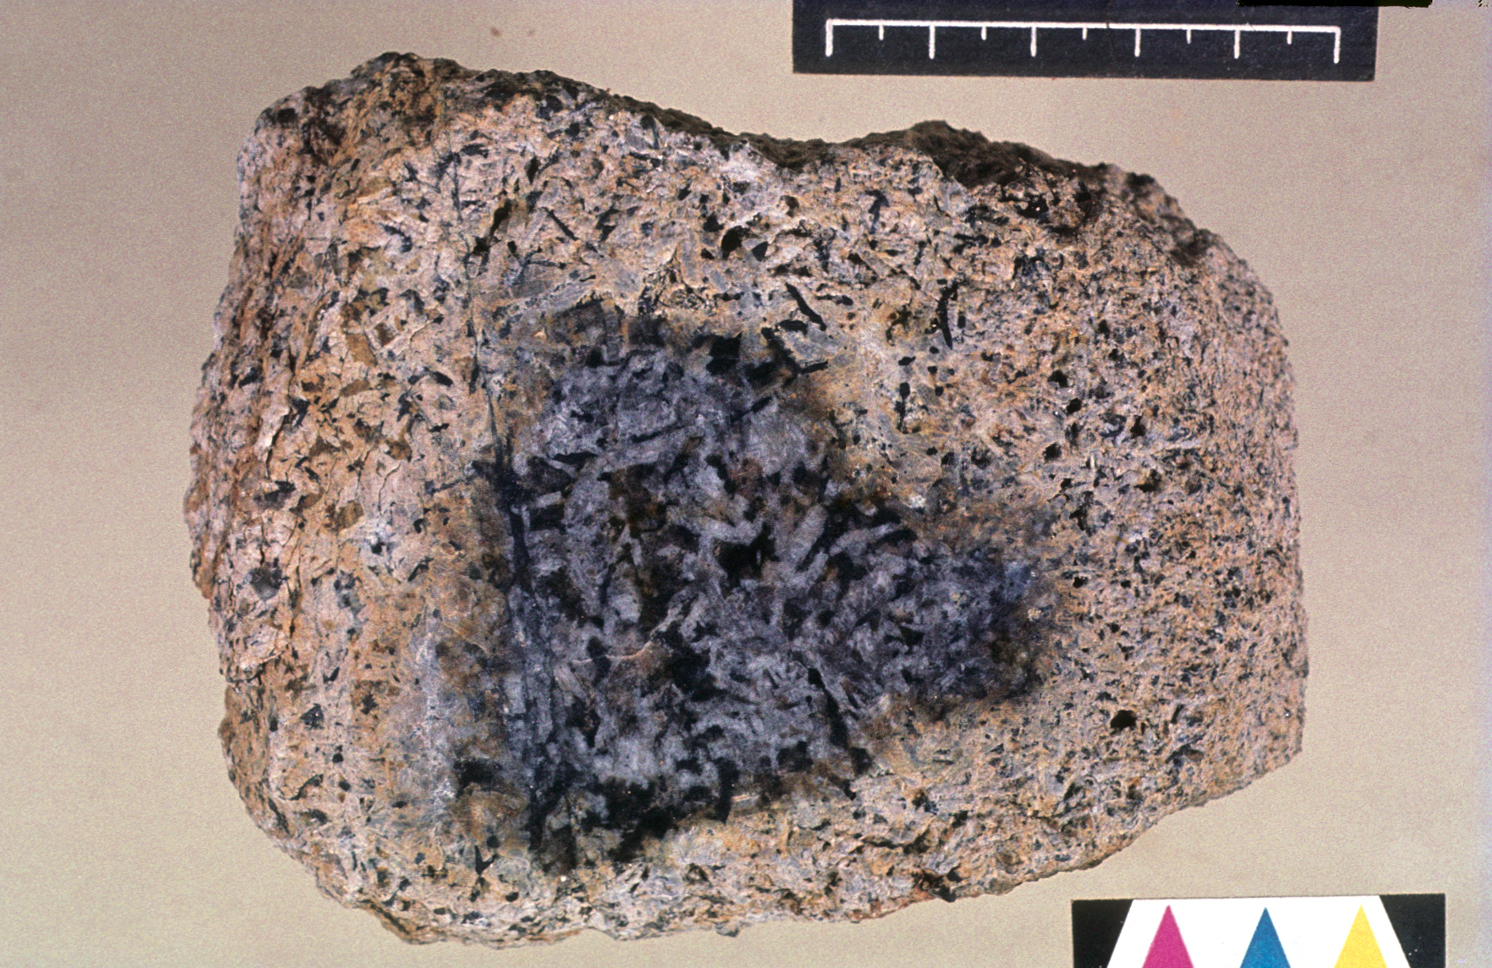
Sediment-hosted disseminated gold deposits consist of low concentrations of microscopic gold as inclusions and disseminated atoms in pyrite crystals. These are formed via low-grade hydrothermal reactions, generally in the realm of diagenesis, that occur in certain rock types, namely muddy carbonates and limey mudstones. This hydrothermal alteration is generally far removed from a magma source, but can be found in rocks situated with a high geothermal gradient. The Mercur deposit in Utah’s Oquirrh Mountains was this type’s earliest locally mined deposit. There, almost a million ounces of gold was recovered between 1890 and 1917. In the 1960s, a metallurgical process using cyanide was developed for these low-grade ore types. These deposits are also called Carlin-type deposits because the disseminated deposit near Carlin, Nevada, is where the new technology was first applied and where the first definitive scientific studies were conducted. Gold was introduced into these deposits by hydrothermal fluids that reacted with silty calcareous rocks, removing carbonate, creating additional permeability, and adding silica and gold-bearing pyrite in the pore space between grains. The Betze-Post mine and the Gold Quarry mine on the Carlin Trend are two of the largest disseminated gold deposits in Nevada. Similar deposits, but not as large, have been found in China, Iran, and Macedonia.
Non-magmatic Geochemical Processes
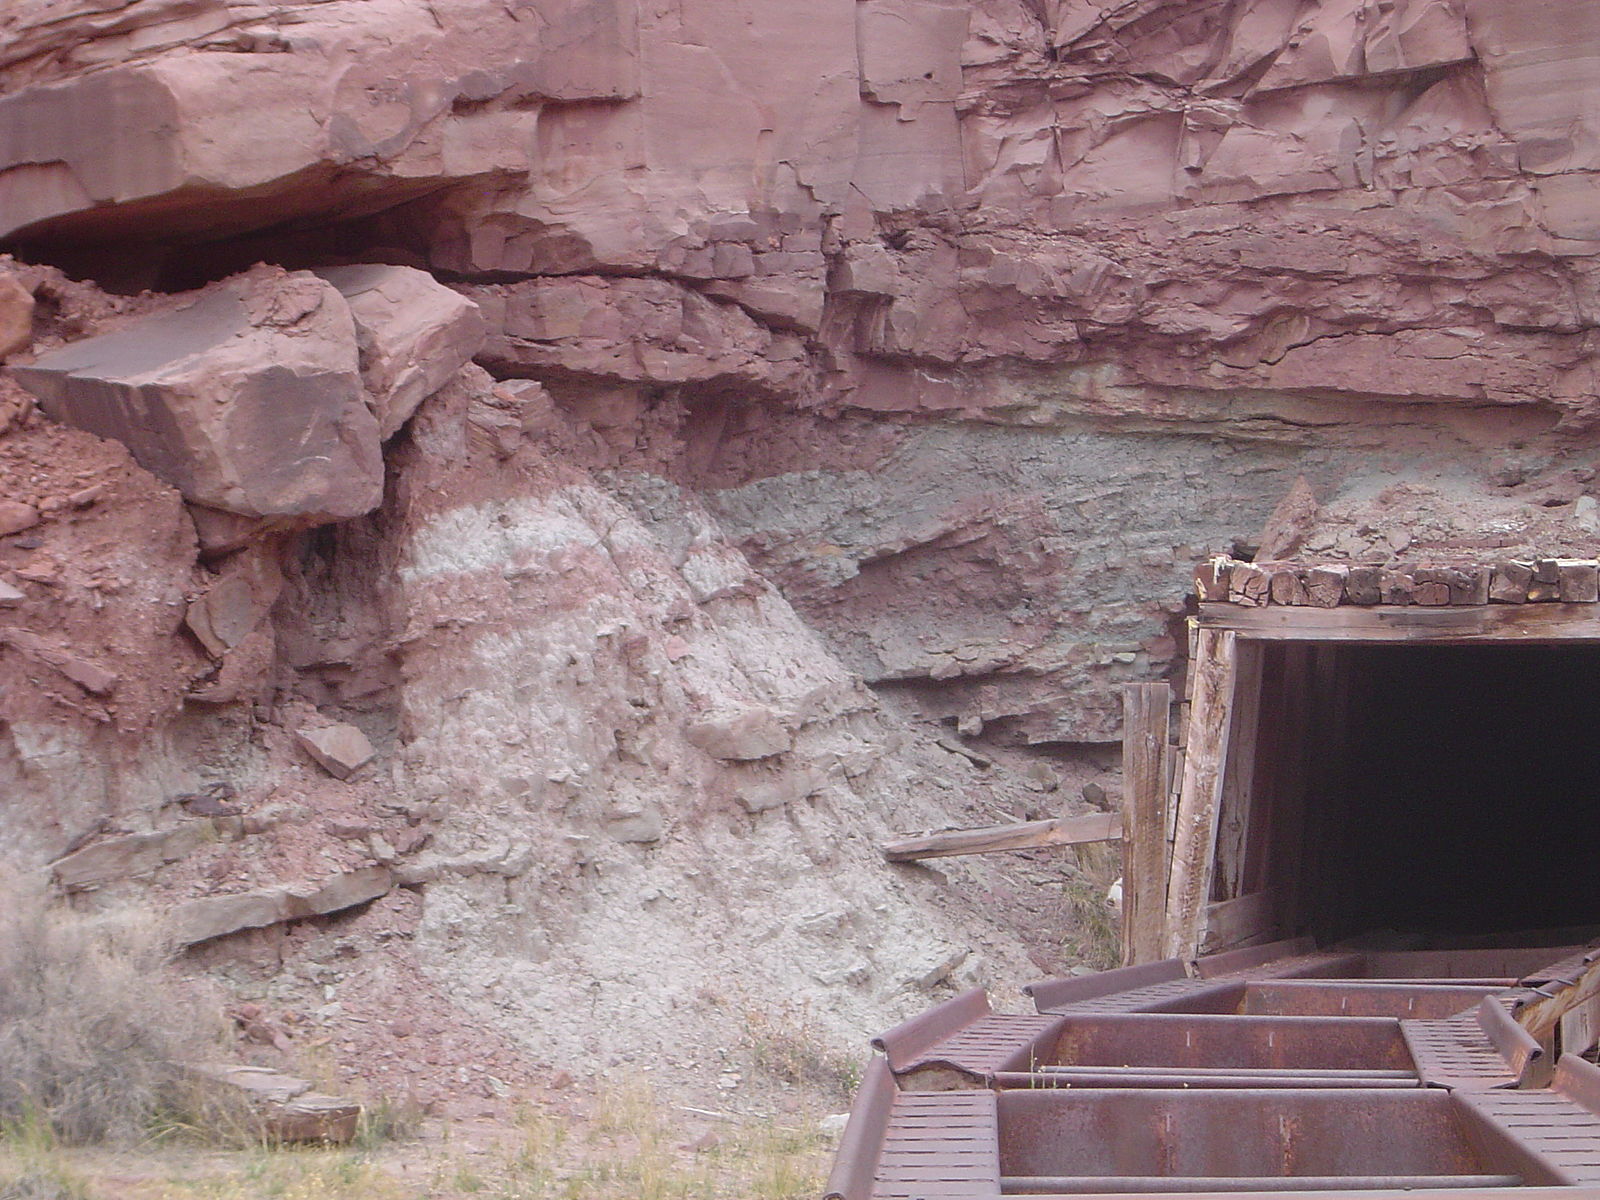
Geochemical processes that occur at or near the surface without magma’s aid also concentrate metals, but to a lesser degree than hydrothermal processes. One of the main reactions is redox, short for reduction/oxidation chemistry, which has to do with the amount of available oxygen in a system. Places where oxygen is plentiful, as in the atmosphere today, are considered oxidizing environments, while oxygen-poor places are considered reducing environments. Uranium deposits are an example of where redox concentrated the metal. Uranium is soluble in oxidizing groundwater environments and precipitates as uraninite when encountering reducing conditions. Many of the deposits across the Colorado Plateau, such as in Moab, Utah, were formed by this method.
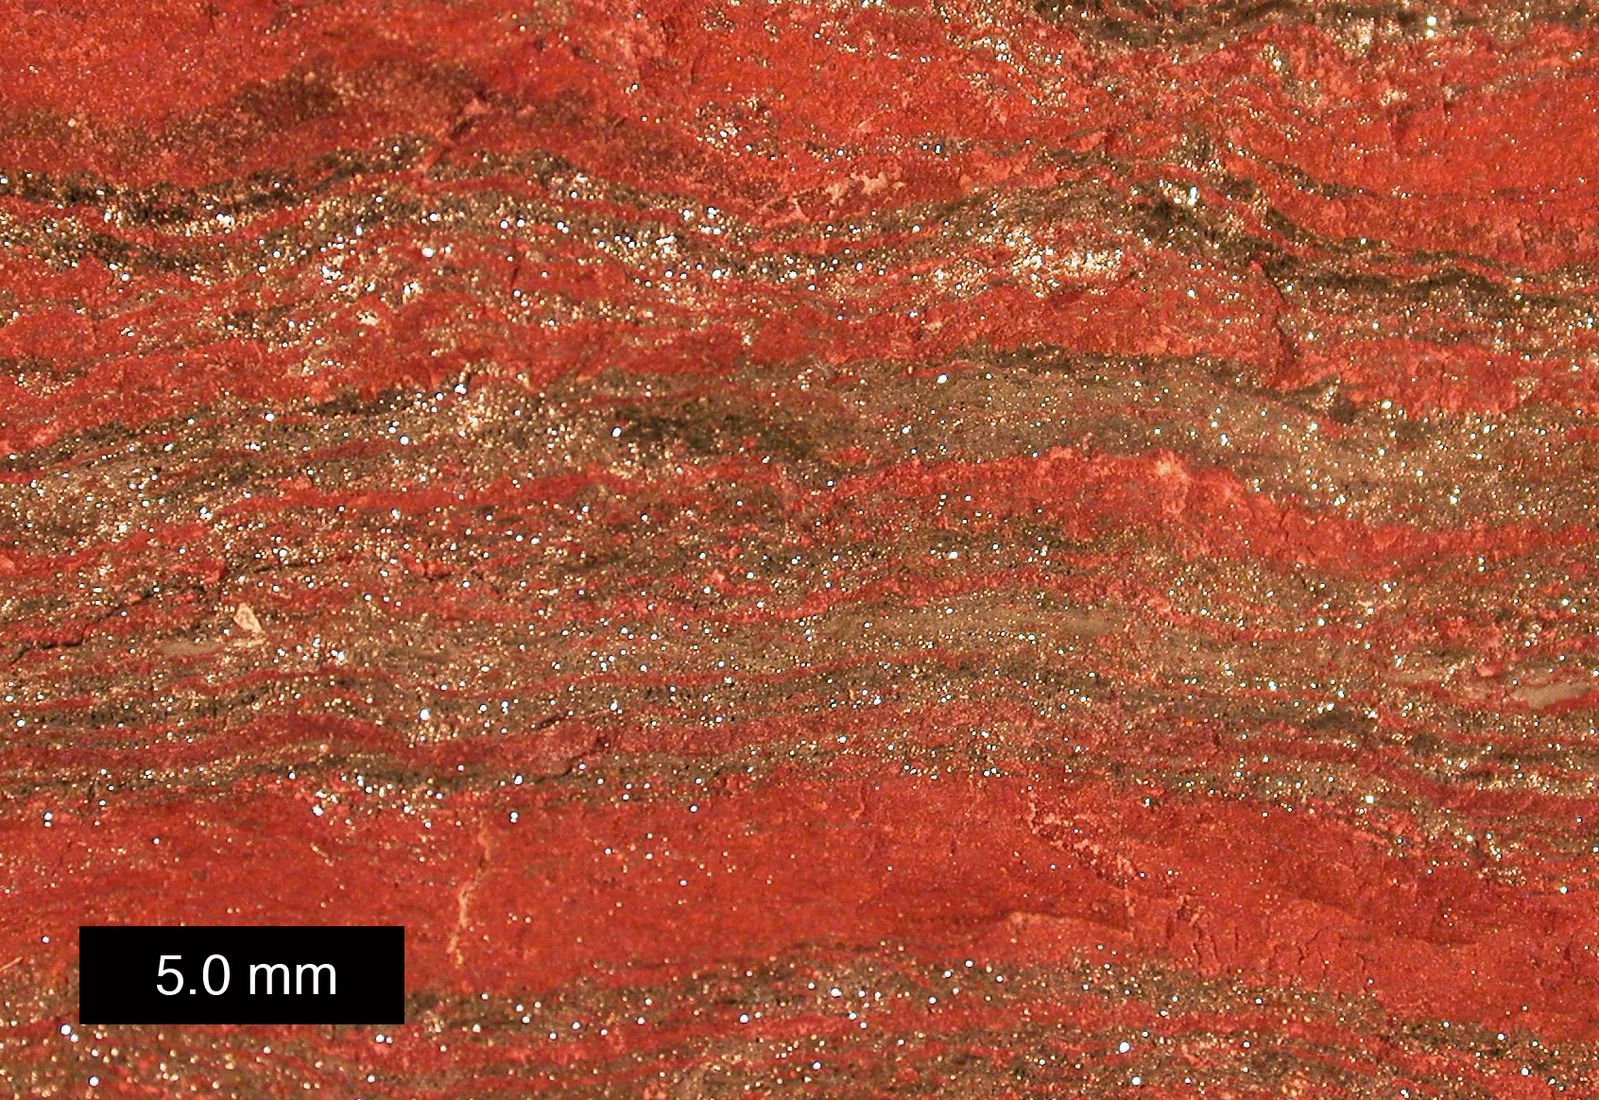
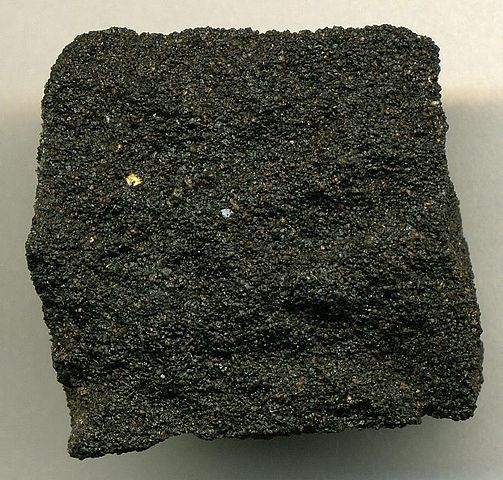
Redox reactions are also responsible for creating banded iron formations (BIFs), which are interbedded layers of iron oxide—hematite and magnetite, chert, and shale beds. These deposits formed early in the Earth’s history as the atmosphere was becoming oxygenated. Cycles of oxygenating iron-rich waters initiated precipitation of the iron beds. Because BIFs are generally Precambrian in age, happening at the event of atmospheric oxygenation, they are only found in some of the older exposed rocks in the United States, such as in Michigan’s upper peninsula and northeast Minnesota.
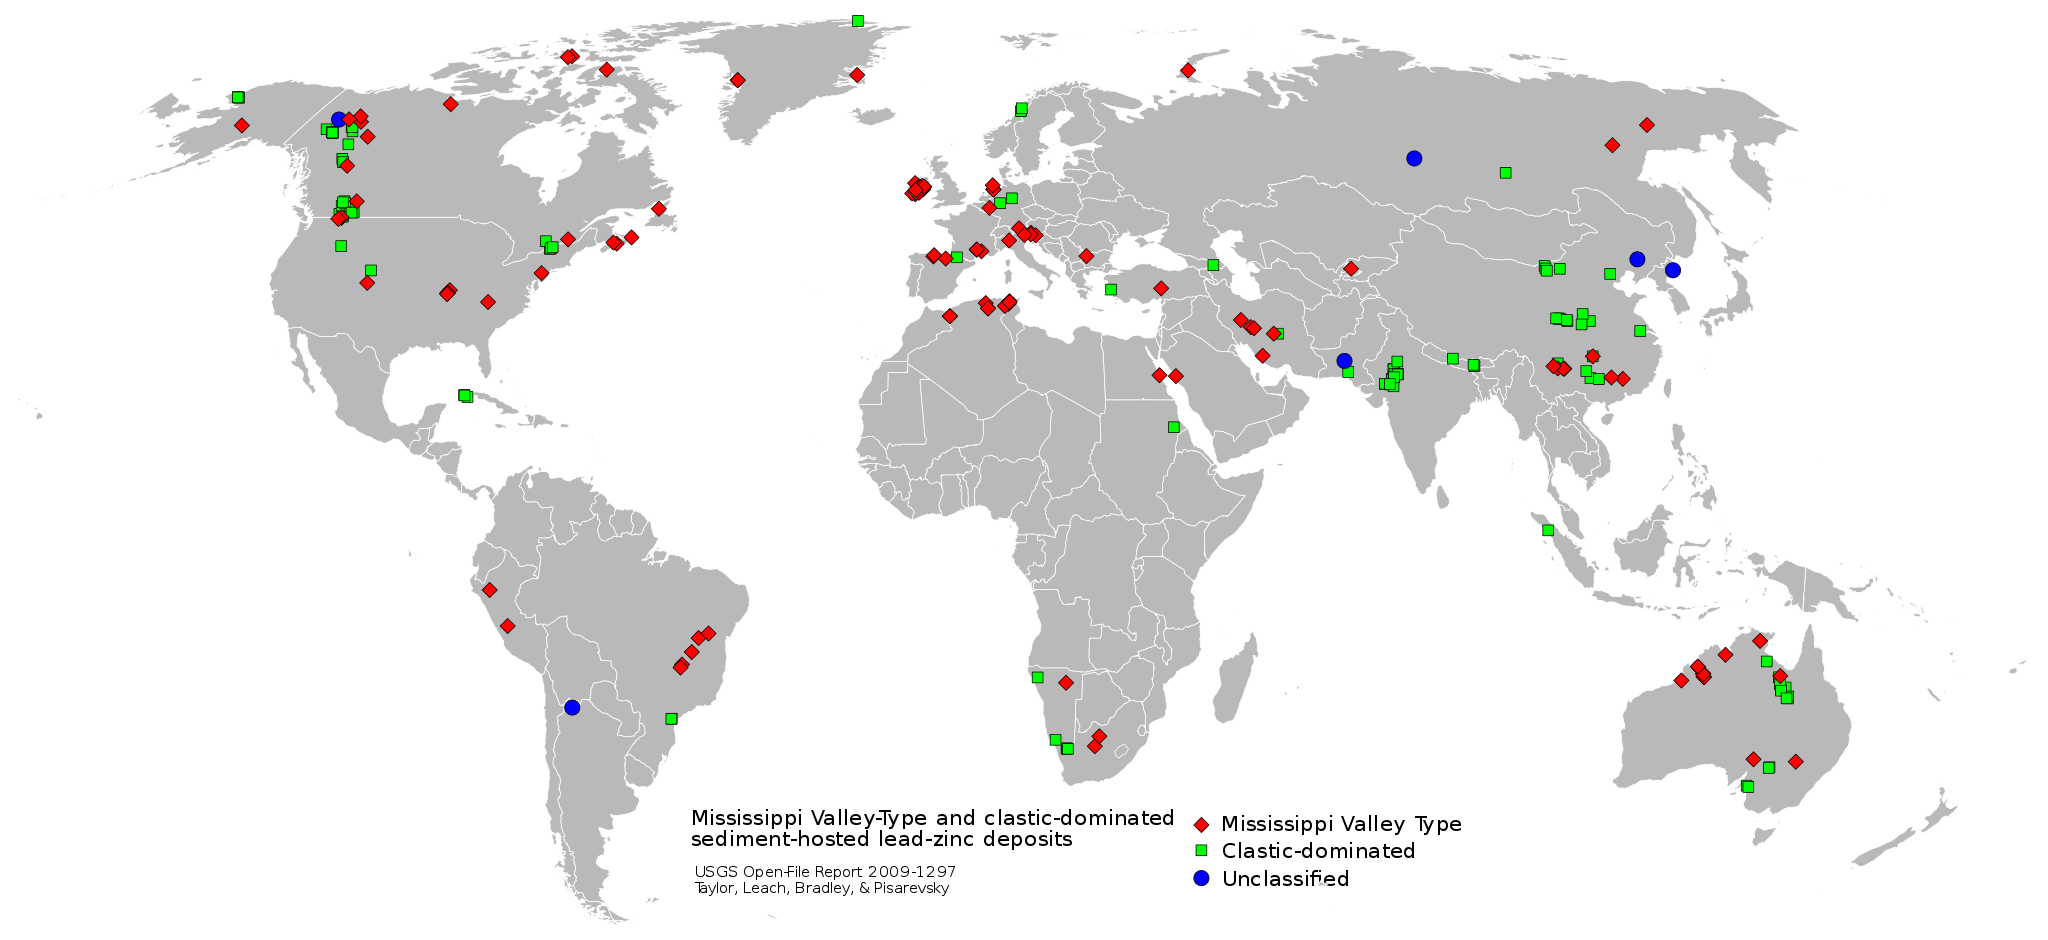
Deep, saline, connate fluids (trapped in pore spaces) within sedimentary basins may be highly metalliferous. When expelled outward and upward as basin sediments compacted, these fluids formed lead and zinc deposits in limestone by replacing or filling open spaces, such as caves and faults, and in sandstone by filling pore spaces. The most famous are called Mississippi Valley-type deposits. Also known as carbonate-hosted replacement deposits, they are large deposits of galena and sphalerite lead and zinc ores that form from hot fluids ranging from 100°C to 200°C (212°F to 392°F). Although they are named for occurring along the Mississippi River Valley in the US, they are found worldwide.
Sediment-hosted copper deposits occurring in sandstones, shales, and marls are enormous, and their contained resources are comparable to porphyry copper deposits. These deposits were most likely formed diagenetically by groundwater fluids in highly permeable rocks. Well-known examples are the Kupferschiefer in Europe, which has an areal coverage of >500,000 Km2, (310,685.596mi) and the Zambian Copper Belt in Africa.
Soils and mineral deposits that are exposed at the surface experience deep and intense weathering, which can form surficial deposits. Bauxite, an aluminum ore, is preserved in karst topography and laterites, which are soils formed in wet tropical environments. Soils containing aluminum concentrate minerals, such as feldspar, and ferromagnesian minerals in igneous and metamorphic rocks, undergo chemical weathering processes that concentrate the metals. Ultramafic rocks that undergo weathering form nickel-rich soils, and when the magnetite and hematite in banded iron formations undergo weathering, it forms goethite, a friable mineral that is easily mined for its iron content.
Surficial Physical Processes
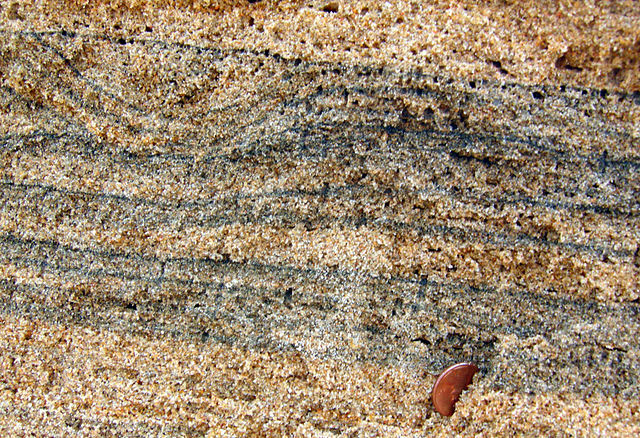
At the Earth’s surface, mass wasting and moving water can cause hydraulic sorting, which forces high-density minerals to concentrate. When these minerals are concentrated in streams, rivers, and beaches, they are called placer deposits, and occur in modern sands and ancient lithified rocks. Native gold, native platinum, zircon, ilmenite, rutile, magnetite, diamonds, and other gemstones can be found in placers. Humans have mimicked this natural process to recover gold manually by gold panning and by mechanized means such as dredging.
16.3.2 Environmental Impacts of Metallic Mineral Mining
Metallic mineral mining’s primary impact comes from the mining itself, including disturbing the land surface, covering landscapes with tailings impoundments, and increasing mass wasting by accelerating erosion. In addition, many metal deposits contain pyrite, an uneconomic sulfide mineral, that when placed on waste dumps, generates acid rock drainage (ARD) during weathering. In oxygenated water, sulfides such as pyrite react and undergo complex reactions to release metal ions and hydrogen ions, which lowers pH to highly acidic levels. Mining and processing of mined materials typically increase the surface area to volume ratio in the material, causing chemical reactions to occur even faster than would occur naturally. If not managed properly, these reactions lead to acidic streams and groundwater plumes that carry dissolved toxic metals. In mines where limestone is a waste rock or where carbonate minerals like calcite or dolomite are present, their acid neutralizing potential helps reduce acid rock drainage. Although this is a natural process too, it is very important to isolate mine dumps and tailings from oxygenated water, both to prevent the sulfides from dissolving and subsequently percolating the sulfate-rich water into waterways. Industry has taken great strides to prevent contamination in recent decades, but earlier mining projects are still causing problems with local ecosystems.
16.3.3 Nonmetallic Mineral Deposits
While receiving much less attention, nonmetallic mineral resources, also known as industrial minerals, are just as vital to ancient and modern society as metallic minerals. The most basic is building stone. Limestone, travertine, granite, slate, and marble are common building stones and have been quarried for centuries. Even today, building stones from slate roof tiles to granite countertops are very popular. Especially pure limestone is ground up, processed, and reformed as plaster, cement, and concrete. Some nonmetallic mineral resources are not mineral specific; nearly any rock or mineral can be used. This is generally called aggregate, which is used in concrete, roads, and foundations. Gravel is one of the more common aggregates.
Evaporites
Evaporite deposits form in restricted basins where water evaporates faster than it recharges, such as the Great Salt Lake in Utah, or the Dead Sea, which borders Israel and Jordan. As the waters evaporate, soluble minerals are concentrated and become supersaturated, at which point they precipitate from the now highly-saline waters. If these conditions persist for long stretches, thick rock salt, rock gypsum, and other mineral deposits accumulate (see chapter 5).
Evaporite minerals, such as halite, are used in our food as common table salt. Salt was a vitally important food preservative and economic resource before refrigeration was developed. While still used in food, halite is now mainly mined as a chemical agent, water softener, or road de-icer. Gypsum is a common nonmetallic mineral used as a building material; it is the main component in dry wall. It is also used as a fertilizer. Other evaporites include sylvite—potassium chloride, and bischofite—magnesium chloride, both of which are used in agriculture, medicine, food processing, and other applications. Potash, a group of highly soluble potassium-bearing evaporite minerals, is used as a fertilizer. In hyper-arid locations, even more rare and complex evaporites, like borax, trona, ulexite, and hanksite are mined. They can be found in places such as Searles Dry Lake and Death Valley, California, and in the Green River Formation’s ancient evaporite deposits in Utah and Wyoming.
Phosphorus
Phosphorus is an essential element that occurs in the mineral apatite, which is found in trace amounts in common igneous rocks. Phosphorite rock, which is formed in sedimentary environments in the ocean, contains abundant apatite and is mined to make fertilizer. Without phosphorus, life as we know it is not possible. Phosphorous is an important component of bone and DNA. Bone ash and guano are natural sources of phosphorus.

Take this quiz to check your comprehension of this section.
If you are using an offline version of this text, access the quiz for section 16.3 via the QR code.
Summary
Energy and mineral resources are vital to modern society, and it is the role of the geologist to locate these resources for human benefit. As environmental concerns have become more prominent, the value of the geologist has not decreased, as they are still vital in locating the deposits and identifying the least intrusive methods of extraction.
Energy resources are general grouped as being renewable or nonrenewable. Geologists can aid in locating the best places to exploit renewable resources (e.g. locating a dam), but are commonly tasked with finding nonrenewable fossil fuels. Mineral resources are also grouped in two categories: metallic and nonmetallic. Minerals have a wide variety of processes that concentrate them to economic levels, and are usually mined via surface or underground methods.

Take this quiz to check your comprehension of this chapter.
If you are using an offline version of this text, access the quiz for chapter 16 via the QR code.
Text References
- Ague, Jay James, and George H. Brimhall. 1989. “Geochemical Modeling of Steady State Fluid Flow and Chemical Reaction during Supergene Enrichment of Porphyry Copper Deposits.” Economic Geology and the Bulletin of the Society of Economic Geologists 84 (3). economicgeology.org: 506–28.
- Arndt, N. T. 1994. “Chapter 1 Archean Komatiites.” In Developments in Precambrian Geology, edited by K.C. Condie, 11:11–44. Elsevier.
- Bárdossy, György, and Gerardus Jacobus Johannes Aleva. 1990. Lateritic Bauxites. Vol. 27. Elsevier Science Ltd.
- Barrie, C. T. 1999. “Volcanic-Associated Massive Sulfide Deposits: Processes and Examples in Modern and Ancient Settings.” Reviews in Economic Geology, v. 8. https://www.researchgate.net/profile/Michael_Perfit/publication/241276560_Geologic_petrologic_and_geochemical_relationships_between_magmatism_and_massive_sulfide_mineralization_along_the_eastern_Galapagos_Spreading_Center/links/02e7e51c8707bbfe9c000000.pdf.
- Barrie, L. A., and R. M. Hoff. 1984. “The Oxidation Rate and Residence Time of Sulphur Dioxide in the Arctic Atmosphere.” Atmospheric Environment 18 (12). Elsevier: 2711–22.
- Bauquis, Pierre-René. 1998. “What Future for Extra Heavy Oil and Bitumen: The Orinoco Case.” In Paper Presented by TOTAL at the World Energy Congress, 13:18.
- Belloc, H. 1913. The Servile State. T.N. Foulis.
- Blander, M., S. Sinha, A. Pelton, and G. Eriksson. 2011. “Calculations of the Influence of Additives on Coal Combustion Deposits.” Argonne National Laboratory, Lemont, Illinois. enersol.pk, 315.
- Boudreau, Alan E. 2016. “The Stillwater Complex, Montana–Overview and the Significance of Volatiles.” Mineralogical Magazine 80 (4). Mineralogical Society: 585–637.
- Bromfield, C. S., A. J. Erickson, M. A. Haddadin, and H. H. Mehnert. 1977. “Potassium-Argon Ages of Intrusion, Extrusion, and Associated Ore Deposits, Park City Mining District, Utah.” Economic Geology and the Bulletin of the Society of Economic Geologists 72 (5). economicgeology.org: 837–48.
- Brown, Valerie J. 2007. “Industry Issues: Putting the Heat on Gas.” Environmental Health Perspectives 115 (2). ncbi.nlm.nih.gov: A76.
- Cabri, Louis J., Donald C. Harris, and Thorolf W. Weiser. 1996. “Mineralogy and Distribution of Platinum-Group Mineral (PGM) Placer Deposits of the World.” Exploration and Mining Geology 2 (5). infona.pl: 73–167.
- Crutzen, Paul J., and Jos Lelieveld. 2001. “Human Impacts on Atmospheric Chemistry.” Annual Review of Earth and Planetary Sciences 29 (1). Annual Reviews 4139 El Camino Way, PO Box 10139, Palo Alto, CA 94303-0139, USA: 17–45.
- Delaney, M. L. 1998. “Phosphorus Accumulation in Marine Sediments and the Oceanic Phosphorus Cycle.” Global Biogeochemical Cycles 12 (4). Wiley Online Library: 563–72.
- Demaison, G. J., and G. T. Moore. 1980. “Anoxic Environments and Oil Source Bed Genesis.” Organic Geochemistry 2 (1). Elsevier: 9–31.
- Dott, Robert H., and Merrill J. Reynolds. 1969. “Sourcebook for Petroleum Geology.” American Association of Petroleum Geologists Tulsa, Okla. http://archives.datapages.com/data/specpubs/methodo1/data/a072/a072/0001/0000/vi.htm.
- Duffield, Wendell A. 2005. “Volcanoes, Geothermal Energy, and the Environment.” Volcanoes and the Environment. Cambridge University Press, 304.
- Einaudi, Marco T., and Donald M. Burt. 1982. “Introduction; Terminology, Classification, and Composition of Skarn Deposits.” Economic Geology and the Bulletin of the Society of Economic Geologists 77 (4). economicgeology.org: 745–54.
- Gandossi, Luca. 2013. “An Overview of Hydraulic Fracturing and Other Formation Stimulation Technologies for Shale Gas Production.” Eur. Commisison Jt. Res. Cent. Tech. Reports. skalunudujos.lt. http://skalunudujos.lt/wp-content/uploads/an-overview-of-hydraulic-fracturing-and-other-stimulation-technologies.pdf.
- Gordon, Mackenzie, Jr, Joshua I. Tracey Jr, and Miller W. Ellis. 1958. “Geology of the Arkansas Bauxite Region.” pubs.er.usgs.gov. https://pubs.er.usgs.gov/publication/pp299.
- Gordon, W. Anthony. 1975. “Distribution by Latitude of Phanerozoic Evaporite Deposits.” The Journal of Geology 83 (6). journals.uchicago.edu: 671–84.
- Haber, Fritz. 2002. “The Synthesis of Ammonia from Its Elements Nobel Lecture, June 2, 1920.” Resonance 7 (9). Springer India: 86–94.
- Hawley, Charles Caldwell. 2014. A Kennecott Story: Three Mines, Four Men, and One Hundred Years, 1887-1997. University of Utah Press.
- Hirsch, Robert L., Roger Bezdek, and Robert Wendling. 2006. “Peaking of World Oil Production and Its Mitigation.” AIChE Journal. American Institute of Chemical Engineers 52 (1). Wiley Subscription Services, Inc., A Wiley Company: 2–8.
- Hitzman, M., R. Kirkham, D. Broughton, J. Thorson, and D. Selley. 2005. “The Sediment-Hosted Stratiform Copper Ore System.” Economic Geology and the Bulletin of the Society of Economic Geologists 100th . eprints.utas.edu.au. http://eprints.utas.edu.au/705/.
- Hofstra, Albert H., and Jean S. Cline. 2000. “Characteristics and Models for Carlin-Type Gold Deposits.” Reviews in Economic Geology 13. Society of Economic Geologists: 163–220.
- James, L. P. 1979. Geology, Ore Deposits, and History of the Big Cottonwood Mining District, Salt Lake County, Utah. Bulletin (Utah Geological and Mineral Survey). Utah Geological and Mineral Survey, Utah Department of Natural Resources.
- Kim, Won-Young. 2013. “Induced Seismicity Associated with Fluid Injection into a Deep Well in Youngstown, Ohio.” Journal of Geophysical Research, [Solid Earth] 118 (7). Wiley Online Library: 3506–18.
- Klein, Cornelis. 2005. “Some Precambrian Banded Iron-Formations (BIFs) from around the World: Their Age, Geologic Setting, Mineralogy, Metamorphism, Geochemistry, and Origins.” The American Mineralogist 90 (10). Mineralogical Society of America: 1473–99.
- Laylin, James K. 1993. Nobel Laureates in Chemistry, 1901-1992. Chemical Heritage Foundation.
- Leach, D. L., and D. F. Sangster. 1993. “Mississippi Valley-Type Lead-Zinc Deposits.” Mineral Deposit Modeling: Geological. researchgate.net. https://www.researchgate.net/profile/Elisabeth_Rowan/publication/252527999_Genetic_link_between_Ouachita_foldbelt_tectonism_and_the_Mississippi_Valley-type_Lead-zinc_deposits_of_the_Ozarks/links/00b7d53c97ac2d6fe7000000.pdf.
- Lehmann, Bernd. 2008. “Uranium Ore Deposits.” Rev. Econ. Geol. AMS Online 2008. kenanaonline.com: 16–26.
- London, David, and Daniel J. Kontak. 2012. “Granitic Pegmatites: Scientific Wonders and Economic Bonanzas.” Elements 8 (4). GeoScienceWorld: 257–61.
- Mancuso, Joseph J., and Ronald E. Seavoy. 1981. “Precambrian Coal or Anthraxolite; a Source for Graphite in High-Grade Schists and Gneisses.” Economic Geology and the Bulletin of the Society of Economic Geologists 76 (4). economicgeology.org: 951–54.
- McKenzie, Hermione, and Barrington Moore. 1970. “Social Origins of Dictatorship and Democracy.” JSTOR. http://www.jstor.org/stable/27856441.
- Needham, Joseph, Ling Wang, and Gwei Djen Lu. 1963. Science and Civilisation in China. Vol. 5. Cambridge University Press Cambridge.
- Nuss, Philip, and Matthew J. Eckelman. 2014. “Life Cycle Assessment of Metals: A Scientific Synthesis.” PloS One 9 (7). journals.plos.org: e101298.
- Orton, E. 1889. The Trenton Limestone as a Source of Petroleum and Inflammable Gas in Ohio and Indiana. U.S. Government Printing Office.
- Palmer, M. A., E. S. Bernhardt, W. H. Schlesinger, K. N. Eshleman, E. Foufoula-Georgiou, M. S. Hendryx, A. D. Lemly, et al. 2010. “Science and Regulation. Mountaintop Mining Consequences.” Science 327 (5962). science.sciencemag.org: 148–49.
- Pratt, Wallace Everette. 1942. Oil in the Earth. University of Kansas Press.
- Quéré, C. Le, Robert Joseph Andres, T. Boden, T. Conway, R. A. Houghton, Joanna I. House, Gregg Marland, et al. 2013. “The Global Carbon Budget 1959–2011.” Earth System Science Data 5 (1). Copernicus GmbH: 165–85.
- Richards, J. P. 2003. “Tectono-Magmatic Precursors for Porphyry Cu-(Mo-Au) Deposit Formation.” Economic Geology and the Bulletin of the Society of Economic Geologists 98 (8). economicgeology.org: 1515–33.
- Rui-Zhong, Hu, Su Wen-Chao, Bi Xian-Wu, Tu Guang-Zhi, and Albert H. Hofstra. 2002. “Geology and Geochemistry of Carlin-Type Gold Deposits in China.” Mineralium Deposita 37 (3-4). Springer-Verlag: 378–92.
- Schröder, K-P, and Robert Connon Smith. 2008. “Distant Future of the Sun and Earth Revisited.” Monthly Notices of the Royal Astronomical Society 386 (1). mnras.oxfordjournals.org: 155–63.
- Semaw, Sileshi, Michael J. Rogers, Jay Quade, Paul R. Renne, Robert F. Butler, Manuel Dominguez-Rodrigo, Dietrich Stout, William S. Hart, Travis Pickering, and Scott W. Simpson. 2003. “2.6-Million-Year-Old Stone Tools and Associated Bones from OGS-6 and OGS-7, Gona, Afar, Ethiopia.” Journal of Human Evolution 45 (2). Academic Press: 169–77.
- Tappan, Helen, and Alfred R. Loeblich. 1970. “Geobiologic Implications of Fossil Phytoplankton Evolution and Time-Space Distribution.” Geological Society of America Special Papers 127 (January). specialpapers.gsapubs.org: 247–340.
- Taylor, E. L., T. N. Taylor, and M. Krings. 2009. Paleobotany: The Biology and Evolution of Fossil Plants. Elsevier Science.
- Tissot, B. 1979. “Effects on Prolific Petroleum Source Rocks and Major Coal Deposits Caused by Sea-Level Changes.” Nature 277. adsabs.harvard.edu: 463–65.
- Vail, P. R., R. M. Mitchum Jr, S. Thompson III, R. G. Todd, J. B. Sangree, J. M. Widmier, J. N. Bubb, and W. G. Hatelid. 1977. “Seismic Stratigraphy and Global Sea Level Changes.” Seismic Stratigraphy-Applications to Hydrocarbon Exploration, Edited by Payton, CE, Tulsa, American Association of Petroleum Geologists Memoir 26: 49–212.
- Vogel, J. C. 1970. “Groningen Radiocarbon Dates IX.” Radiocarbon 12 (2). journals.uair.arizona.edu: 444–71.
- Willemse, J. 1969. “The Geology of the Bushveld Igneous Complex, the Largest Repository of Magmatic Ore Deposits in the World.” Economic Geology Monograph 4: 1–22.
- Wrigley, E. A. 1990. Continuity, Chance and Change: The Character of the Industrial Revolution in England. Ellen McArthur Lectures ; 1987. Cambridge University Press.
- Youngquist, Walter. 1998. “Shale Oil–The Elusive Energy.” Hubbert Center Newsletter 4.
Figure References
Figure 16.1: A Mode 1 Oldowan tool used for chopping. José-Manuel Benito Álvarez. 2007. Public domain. https://commons.wikimedia.org/wiki/File:Canto_tallado_2-Guelmim-Es_Semara.jpg
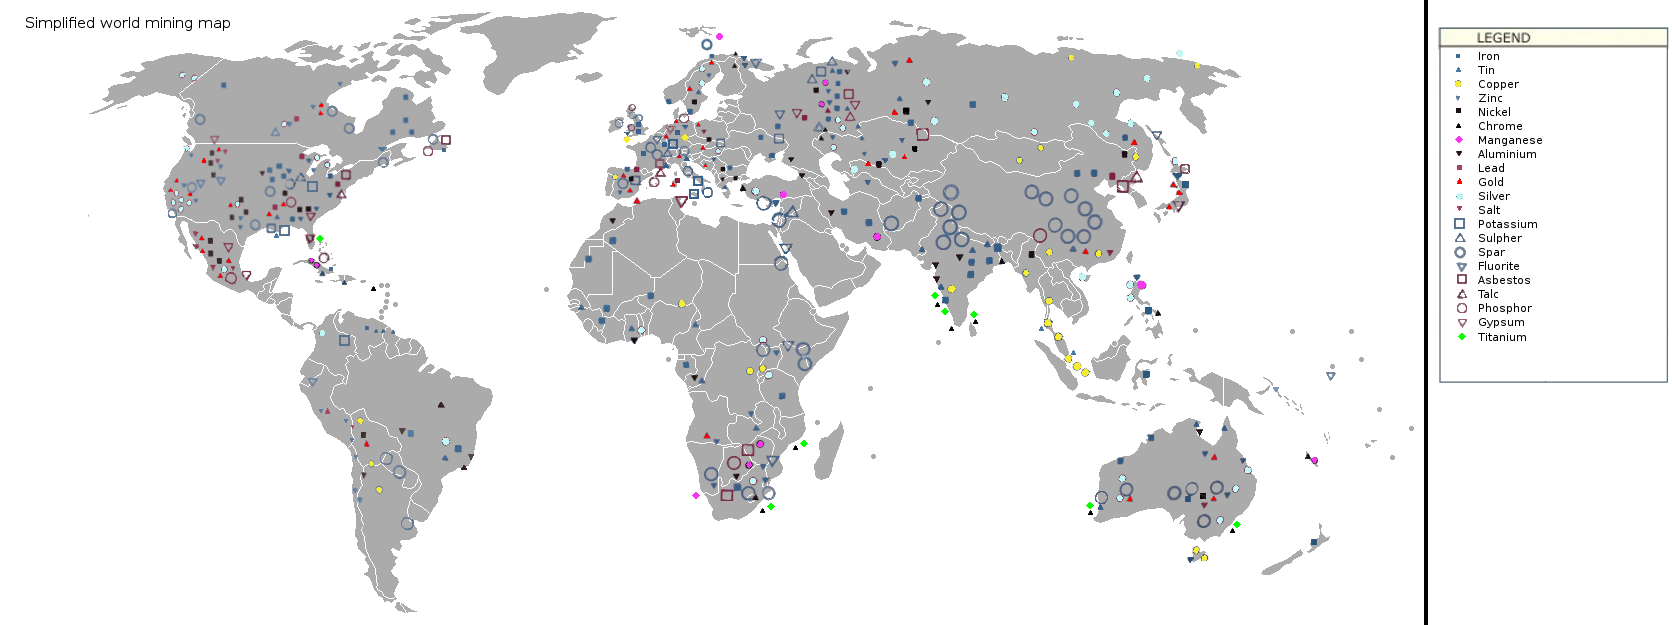
Figure 16.2: Map of world mining areas. KVDP. 2009. Public domain. https://commons.wikimedia.org/wiki/File:Simplified_world_mining_map_1.png
Figure 16.3: Hoover Dam provides hydroelectric energy and stores water for southern Nevada. Ubergirl. 2012. CC BY-SA 3.0. https://commons.wikimedia.org/wiki/File:Hoover_Dam,_Colorado_River.JPG
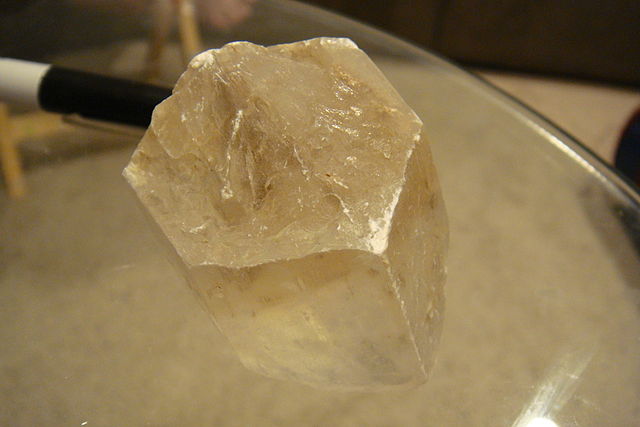
Figure 16.4: Natural, octahedral shape of diamond. USGS. 2003. Public domain. https://commons.wikimedia.org/wiki/File:Rough_diamond.jpg
Figure 16.5: Banded-iron formations are an important ore of iron (Fe). Wilson44691. 2008. Public domain. https://commons.wikimedia.org/wiki/File:MichiganBIF.jpg
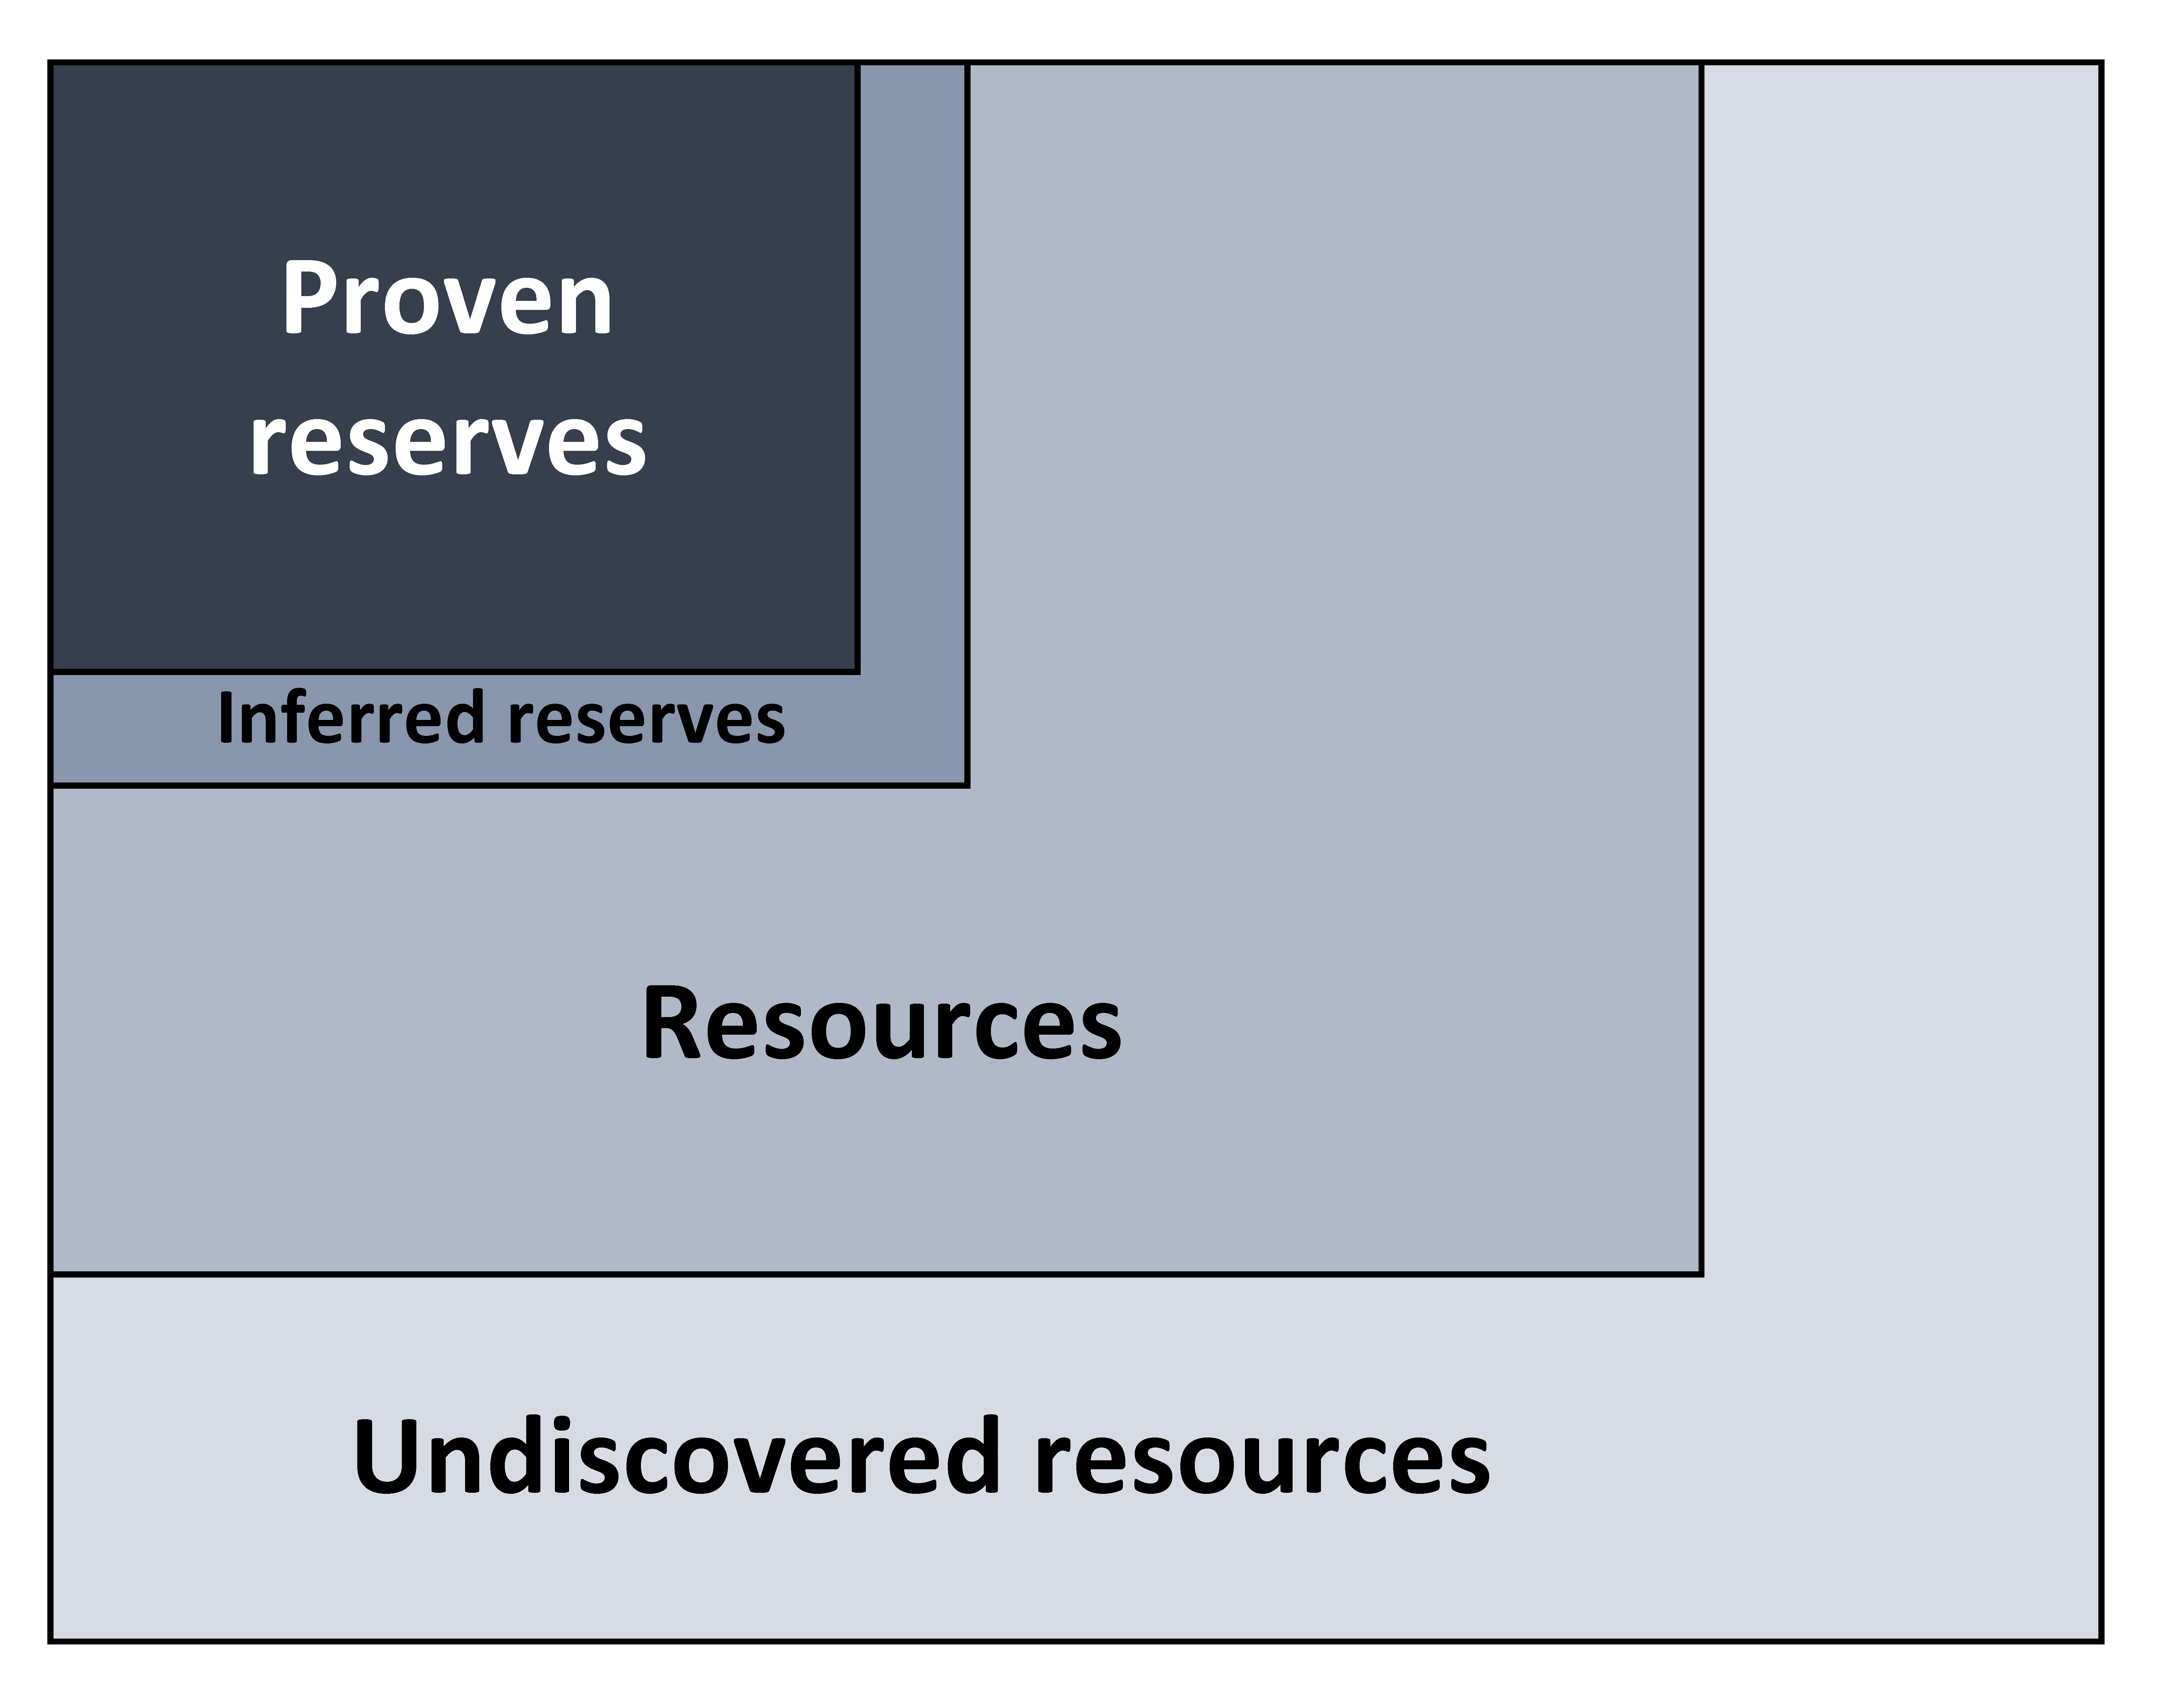
Figure 16.6: Diagram illustrating the relative abundance of proven reserves, inferred reserves, resources, and undiscovered resources. Kindred Grey. 2022. CC BY 4.0.
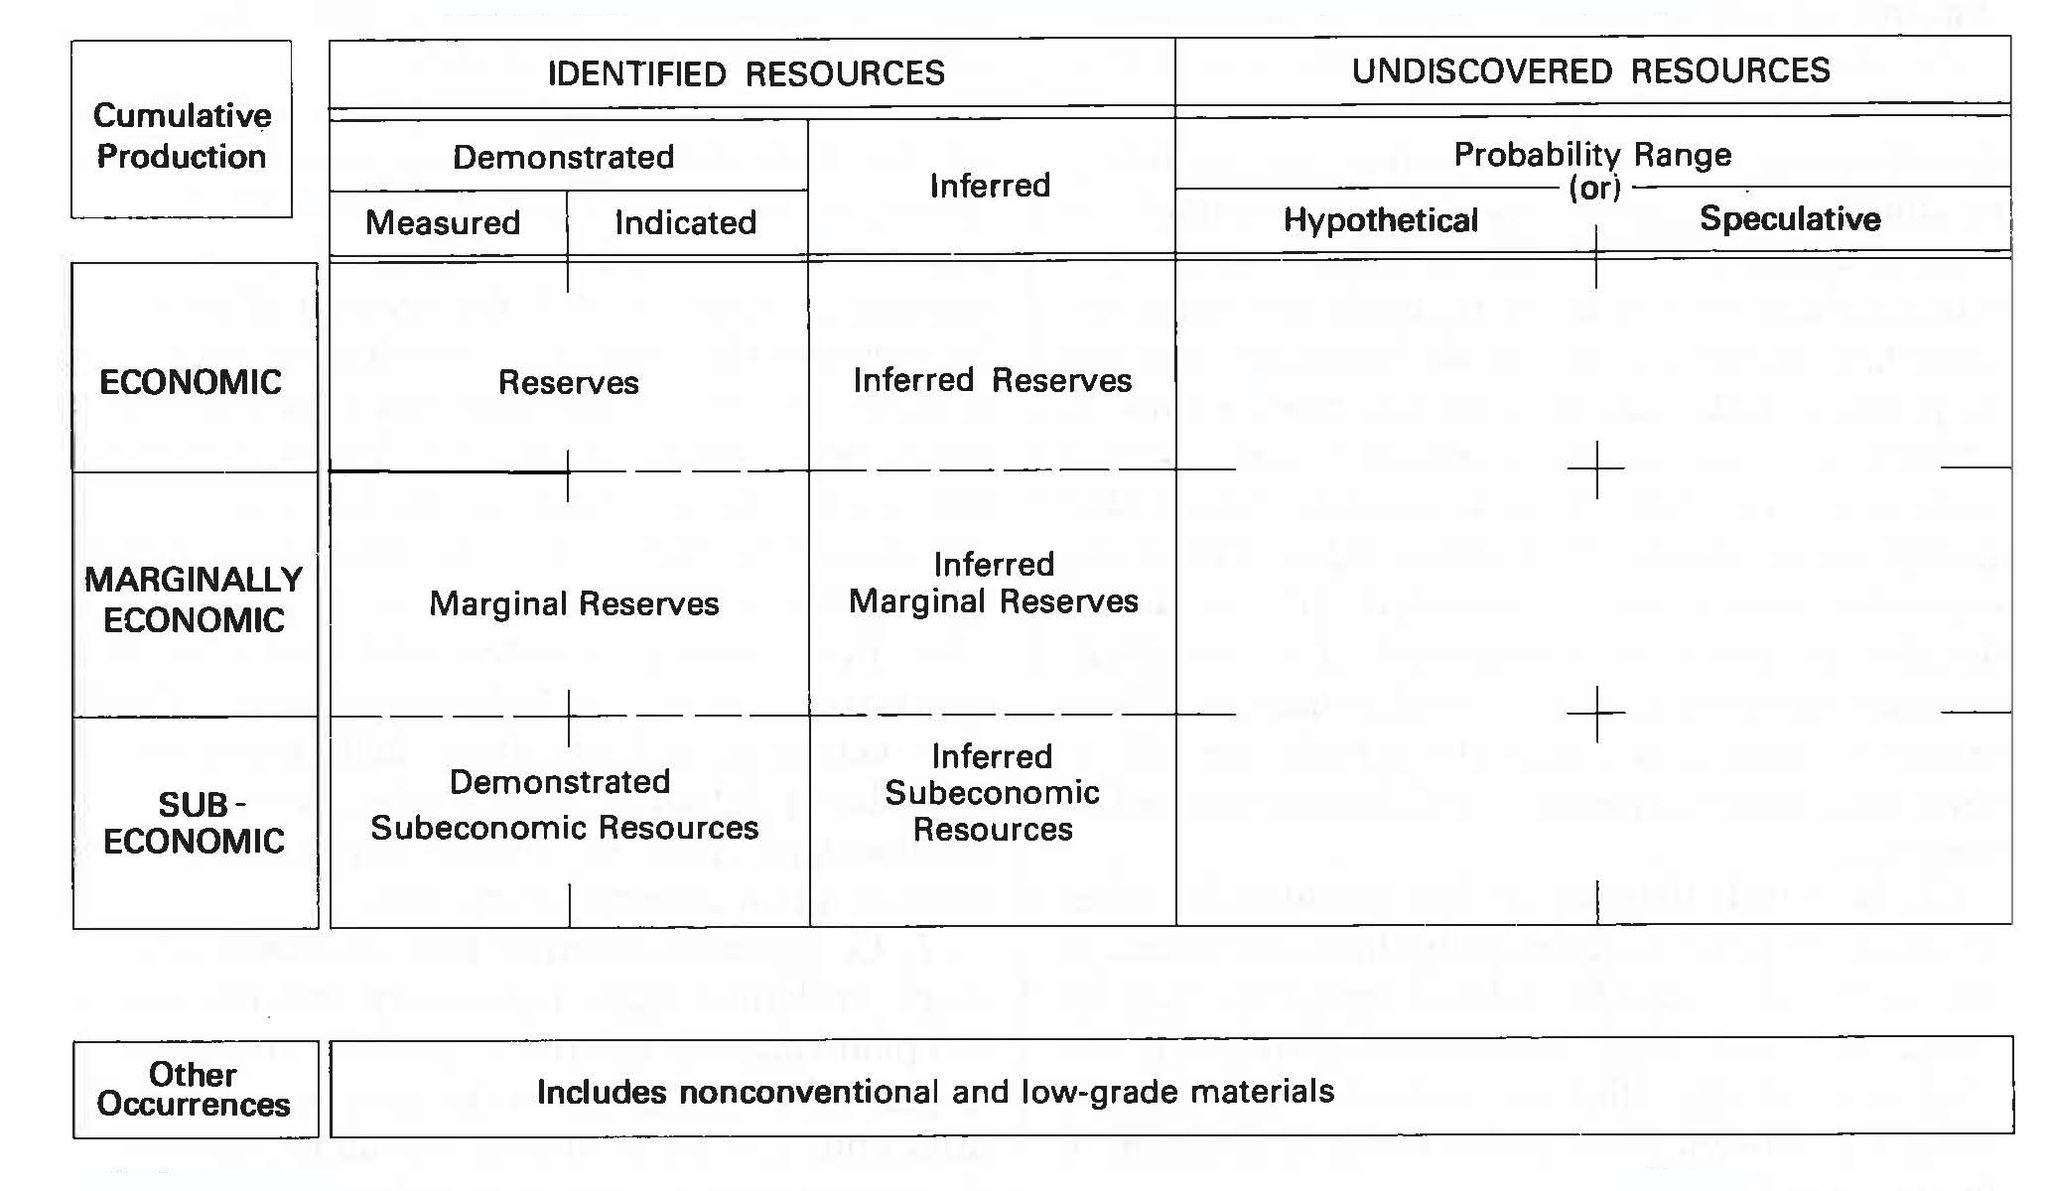
Figure 16.7: McKelvey diagram showing different definitions for different degrees of concentration and understanding of mineral deposits. USGS. 1980. Public domain. https://commons.wikimedia.org/wiki/File:McKelveyDiagram.jpg
Figure 16.8: Bingham Canyon Mine, Utah. Doc Searls. 2016. CC BY 2.0. https://commons.wikimedia.org/wiki/File:Bingham_Canyon_mine_2016.jpg
Figure 16.9: A surface coal mine in Wyoming. Bureau of Land Management. Unknown date. Public domain. https://www.usgs.gov/news/science-snippet/earthword-thermal-maturity
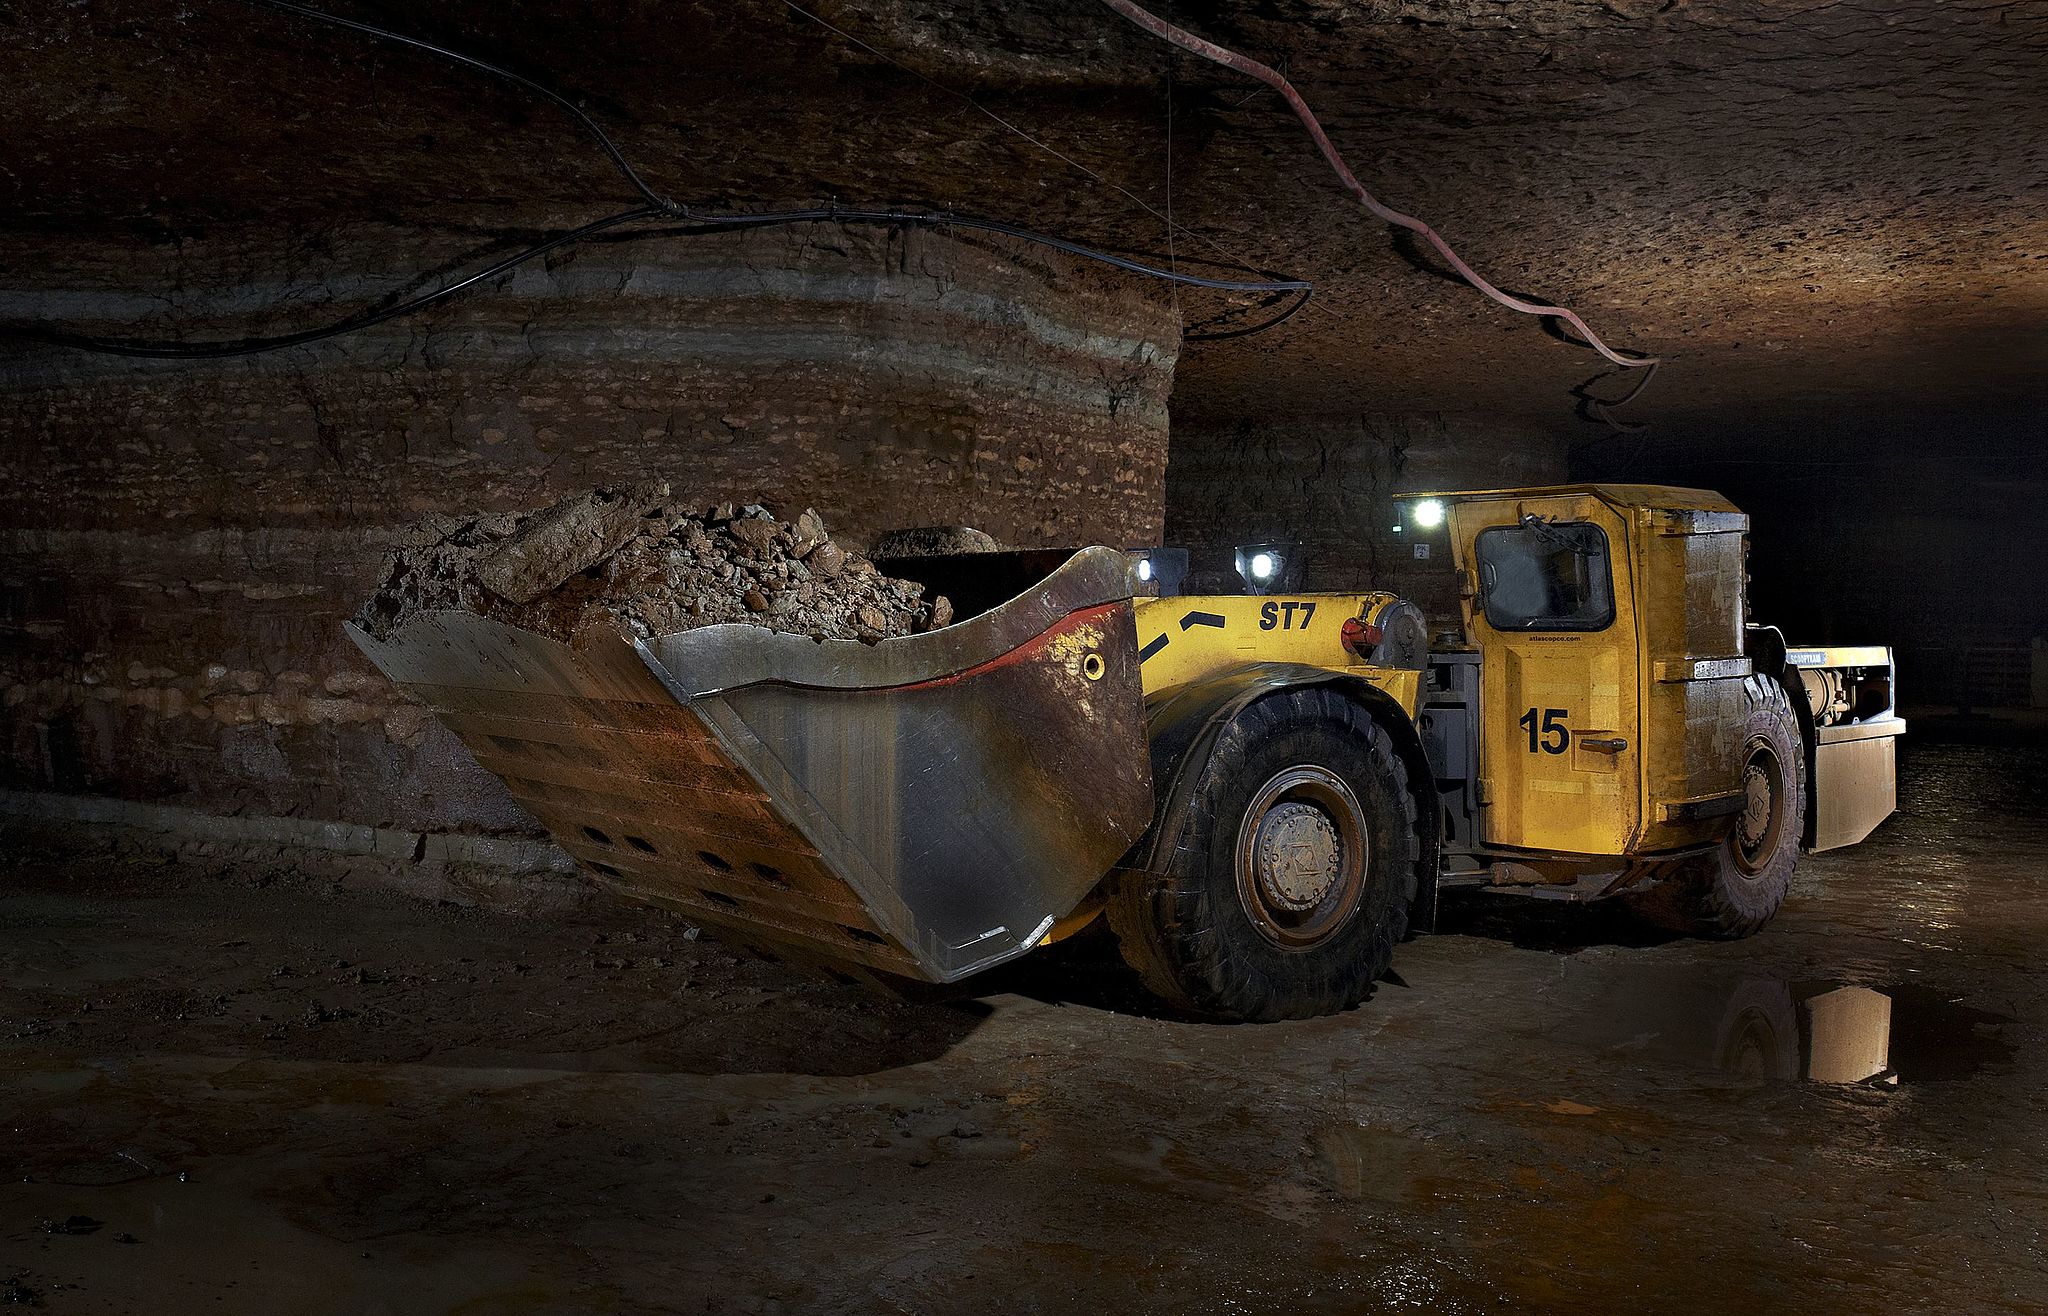
Figure 16.10: Underground mining in Estonia of oil shale. Kaupo Kikkas. 2011. CC BY-SA 4.0. https://commons.wikimedia.org/wiki/File:VKG_Ojamaa_kaevandus.jpg
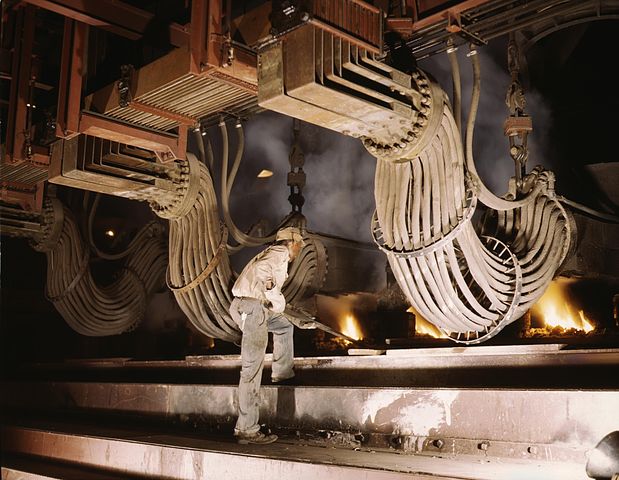
Figure 16.11: A phosphate smelting operation in Alabama, 1942. Alfred T. Palmer. 1942. Public domain. https://commons.wikimedia.org/wiki/File:TVA_phosphate_smelting_furnace.jpg
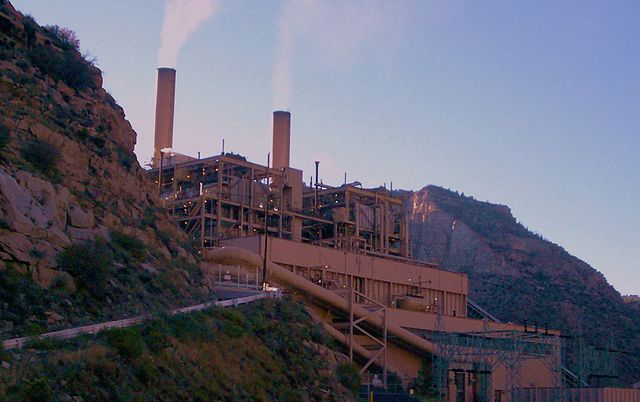
Figure 16.12: Coal power plant in Helper, Utah. David Jolley. 2007. CC BY-SA 3.0. https://commons.wikimedia.org/wiki/File:Castle_Gate_Power_Plant,_Utah_2007.jpg
Figure 16.13: Modern coral reefs and other highly-productive shallow marine environments are thought to be the sources of most petroleum resources. Toby Hudson. 2010. CC BY-SA 3.0. https://commons.wikimedia.org/wiki/File:Coral_Outcrop_Flynn_Reef.jpg
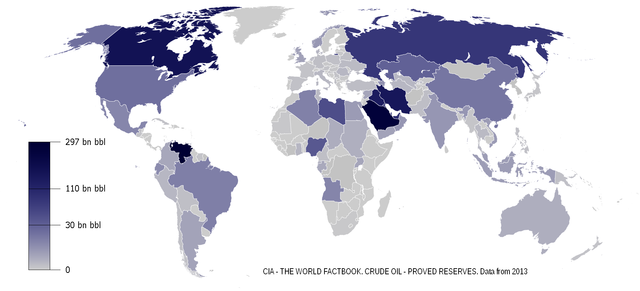
Figure 16.14: World oil reserves in 2013. GunnMap; generated with settings from Emilfaro and A5b. 2014. CC BY-SA 1.0. https://commons.wikimedia.org/wiki/File:Oil_Reserves.png
Figure 16.15: Examples of different forms of hydrocarbon traps: in the core region of anticlines. MagentaGreen. 2014. CC BY-SA 4.0. https://commons.wikimedia.org/wiki/File:Anticlinal_Oil_trap.png
Figure 16.16: The rising sea levels of transgressions create onlapping sediments, regressions create offlapping. Woudloper. 2009. CC BY-SA 1.0. https://commons.wikimedia.org/wiki/File:Offlap_%26_onlap_EN.svg
Figure 16.17: Tar sandstone from the Miocene Monterey Formation of California. James St. John. 2015. CC BY 2.0. https://flic.kr/p/rECMTD
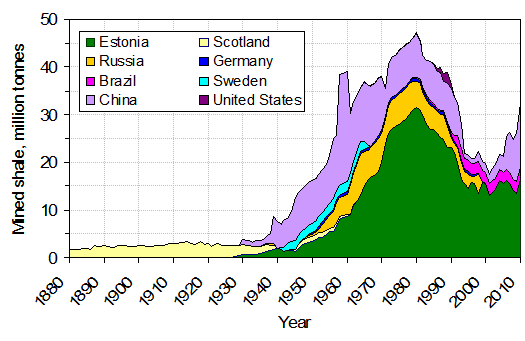
Figure 16.18: Global production of oil shale, 1880-2010. USGS. 2011. Public domain. https://commons.wikimedia.org/wiki/File:Production_of_oil_shale.png
Figure 16.19: Schematic diagram of fracking. Mikenorton. 2012. CC BY-SA 3.0. https://en.wikipedia.org/wiki/File:HydroFrac.png
Figure 16.20: USGS diagram of different coal rankings. USGS. 2009. Public domain. https://commons.wikimedia.org/wiki/File:Coal_Rank_USGS.png
Figure 16.21: Peat (also known as turf) consists of partially decayed organic matter. David Stanley. 2019. CC BY 2.0. https://commons.m.wikimedia.org/wiki/File:Peat_(49302157252).jpg
Figure 16.22: Anthracite coal, the highest grade of coal. USGS. 2007. Public domain. https://commons.wikimedia.org/wiki/File:Coal_anthracite.jpg
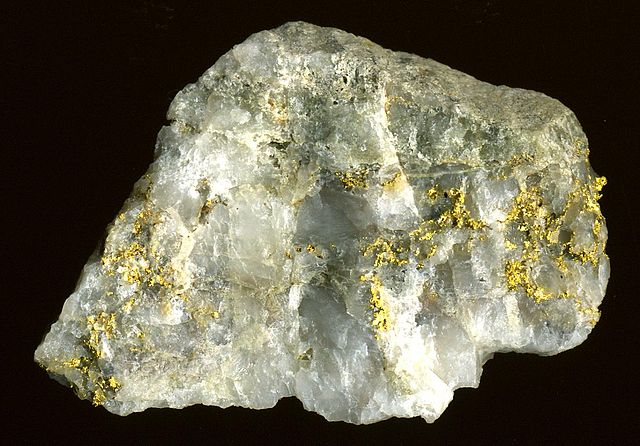
Figure 16.23: Gold-bearing quartz vein from California. James St. John. 2014. CC BY 2.0. https://commons.wikimedia.org/wiki/File:Mother_Lode_Gold_OreHarvard_mine_quartz-gold_vein.jpg
Figure 16.24: Layered intrusion of dark chromium-bearing minerals, Bushveld Complex, South Africa. kevinzim / Kevin Walsh. 2006. CC BY 2.0. https://commons.wikimedia.org/wiki/File:Chromitite_Bushveld_South_Africa.jpg
Figure 16.25: This pegmatite contains lithium-rich green elbaite (a tourmaline) and purple lepidolite (a mica). Parent Géry. 2011. CC BY-SA 3.0. https://commons.wikimedia.org/wiki/File:Elba%C3%AFte_et_mica_(Br%C3%A9sil)_1.JPG
Figure 16.26: Schematic diagram of a kimberlite pipe. Asbestos. 2005. CC BY-SA 3.0. https://commons.wikimedia.org/wiki/File:VolcanicPipe.jpg
Figure 16.27: The complex chemistry around mid-ocean ridges. NOAA. 2011. Public domain. https://commons.wikimedia.org/wiki/File:Deep_Sea_Vent_Chemistry_Diagram.svg
Figure 16.28: The Morenci porphyry is oxidized toward its top (as seen as red rocks in the wall of the mine), creating supergene enrichment. Stephanie Salisbury. 2012. CC BY 2.0. https://commons.wikimedia.org/wiki/File:Morenci_Mine_2012.jpg
Figure 16.29: Garnet-augite skarn from Italy. Siim Sepp. 2012. CC BY-SA 3.0. https://commons.wikimedia.org/wiki/File:00031_6_cm_grossular_calcite_augite_skarn.jpg
Figure 16.30: In this rock, a pyrite cube has dissolved (as seen with the negative “corner” impression in the rock), leaving behind small specks of gold. Matt Affolter (QFL247). 2009. CC BY-SA 3.0. https://commons.wikimedia.org/wiki/File:GoldinPyriteDrainage_acide.JPG
Figure 16.31: Underground uranium mine near Moab, Utah. Matt Affolter. 2010. CC BY-SA 3.0. https://commons.wikimedia.org/wiki/File:UraniumMineUtah.JPG
Figure 16.32: Map of Mississippi-Valley type ore deposits. Kbh3rd. 2010. CC BY 3.0. https://commons.wikimedia.org/wiki/File:MV-Type_and_clastic_sediment-hosted_lead-zinc_deposits.svg
Figure 16.33: A sample of bauxite. Werner Schellmann. 1965. CC BY-SA 2.5. https://commons.wikimedia.org/wiki/File:Bauxite_with_unweathered_rock_core._C_021.jpg
Figure 16.34: Lithified heavy mineral sand (dark layers) from a beach deposit in India. Photograph taken by Mark A. Wilson (Department of Geology, The College of Wooster). 2008. Public domain. https://commons.wikimedia.org/wiki/File:HeavyMineralsBeachSand.jpg
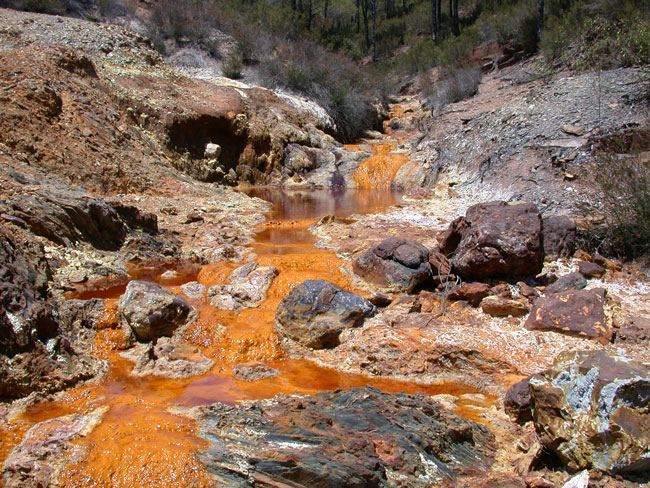
Figure 16.35: Acid mine drainage in the Rio Tinto, Spain. Carol Stoker, NASA. 2002. Public domain. https://commons.wikimedia.org/wiki/File:Rio_tinto_river_CarolStoker_NASA_Ames_Research_Center.jpg
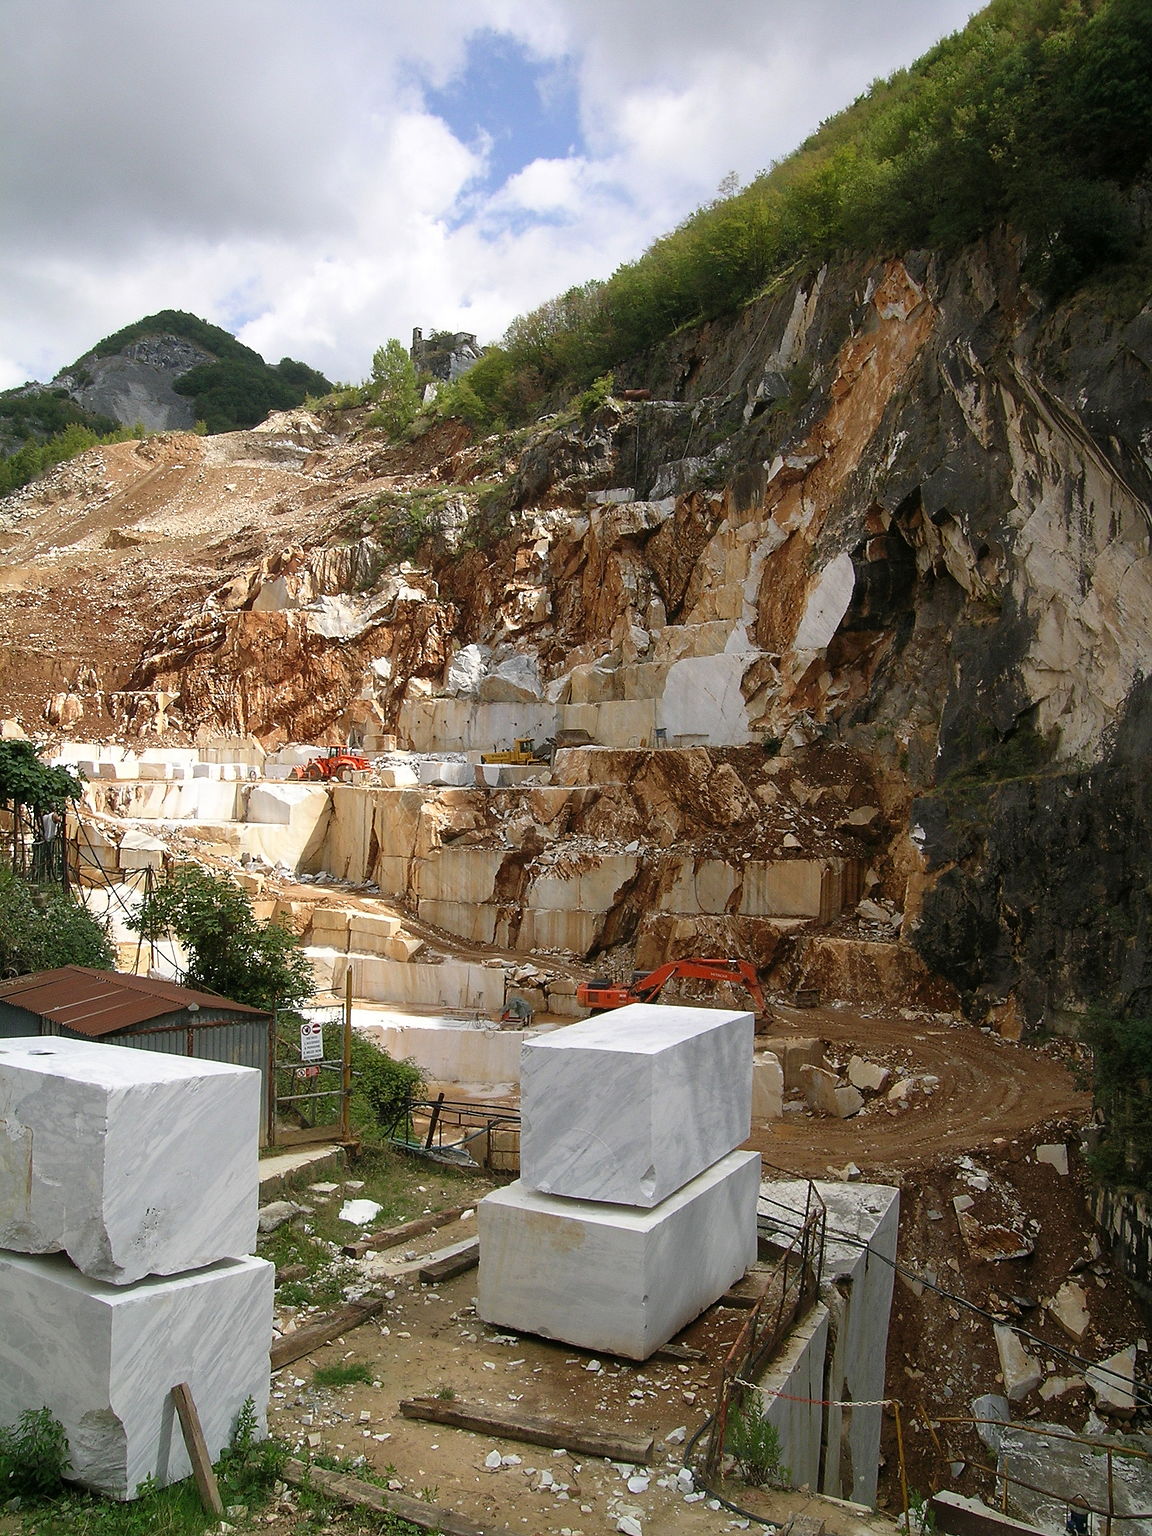
Figure 16.36: Carrara marble quarry in Italy, source to famous sculptures like Michelangelo’s David. Michele~commonswiki. 2006. CC BY-SA 3.0. https://commons.wikimedia.org/wiki/File:Carrara_Marble_quarry.jpg
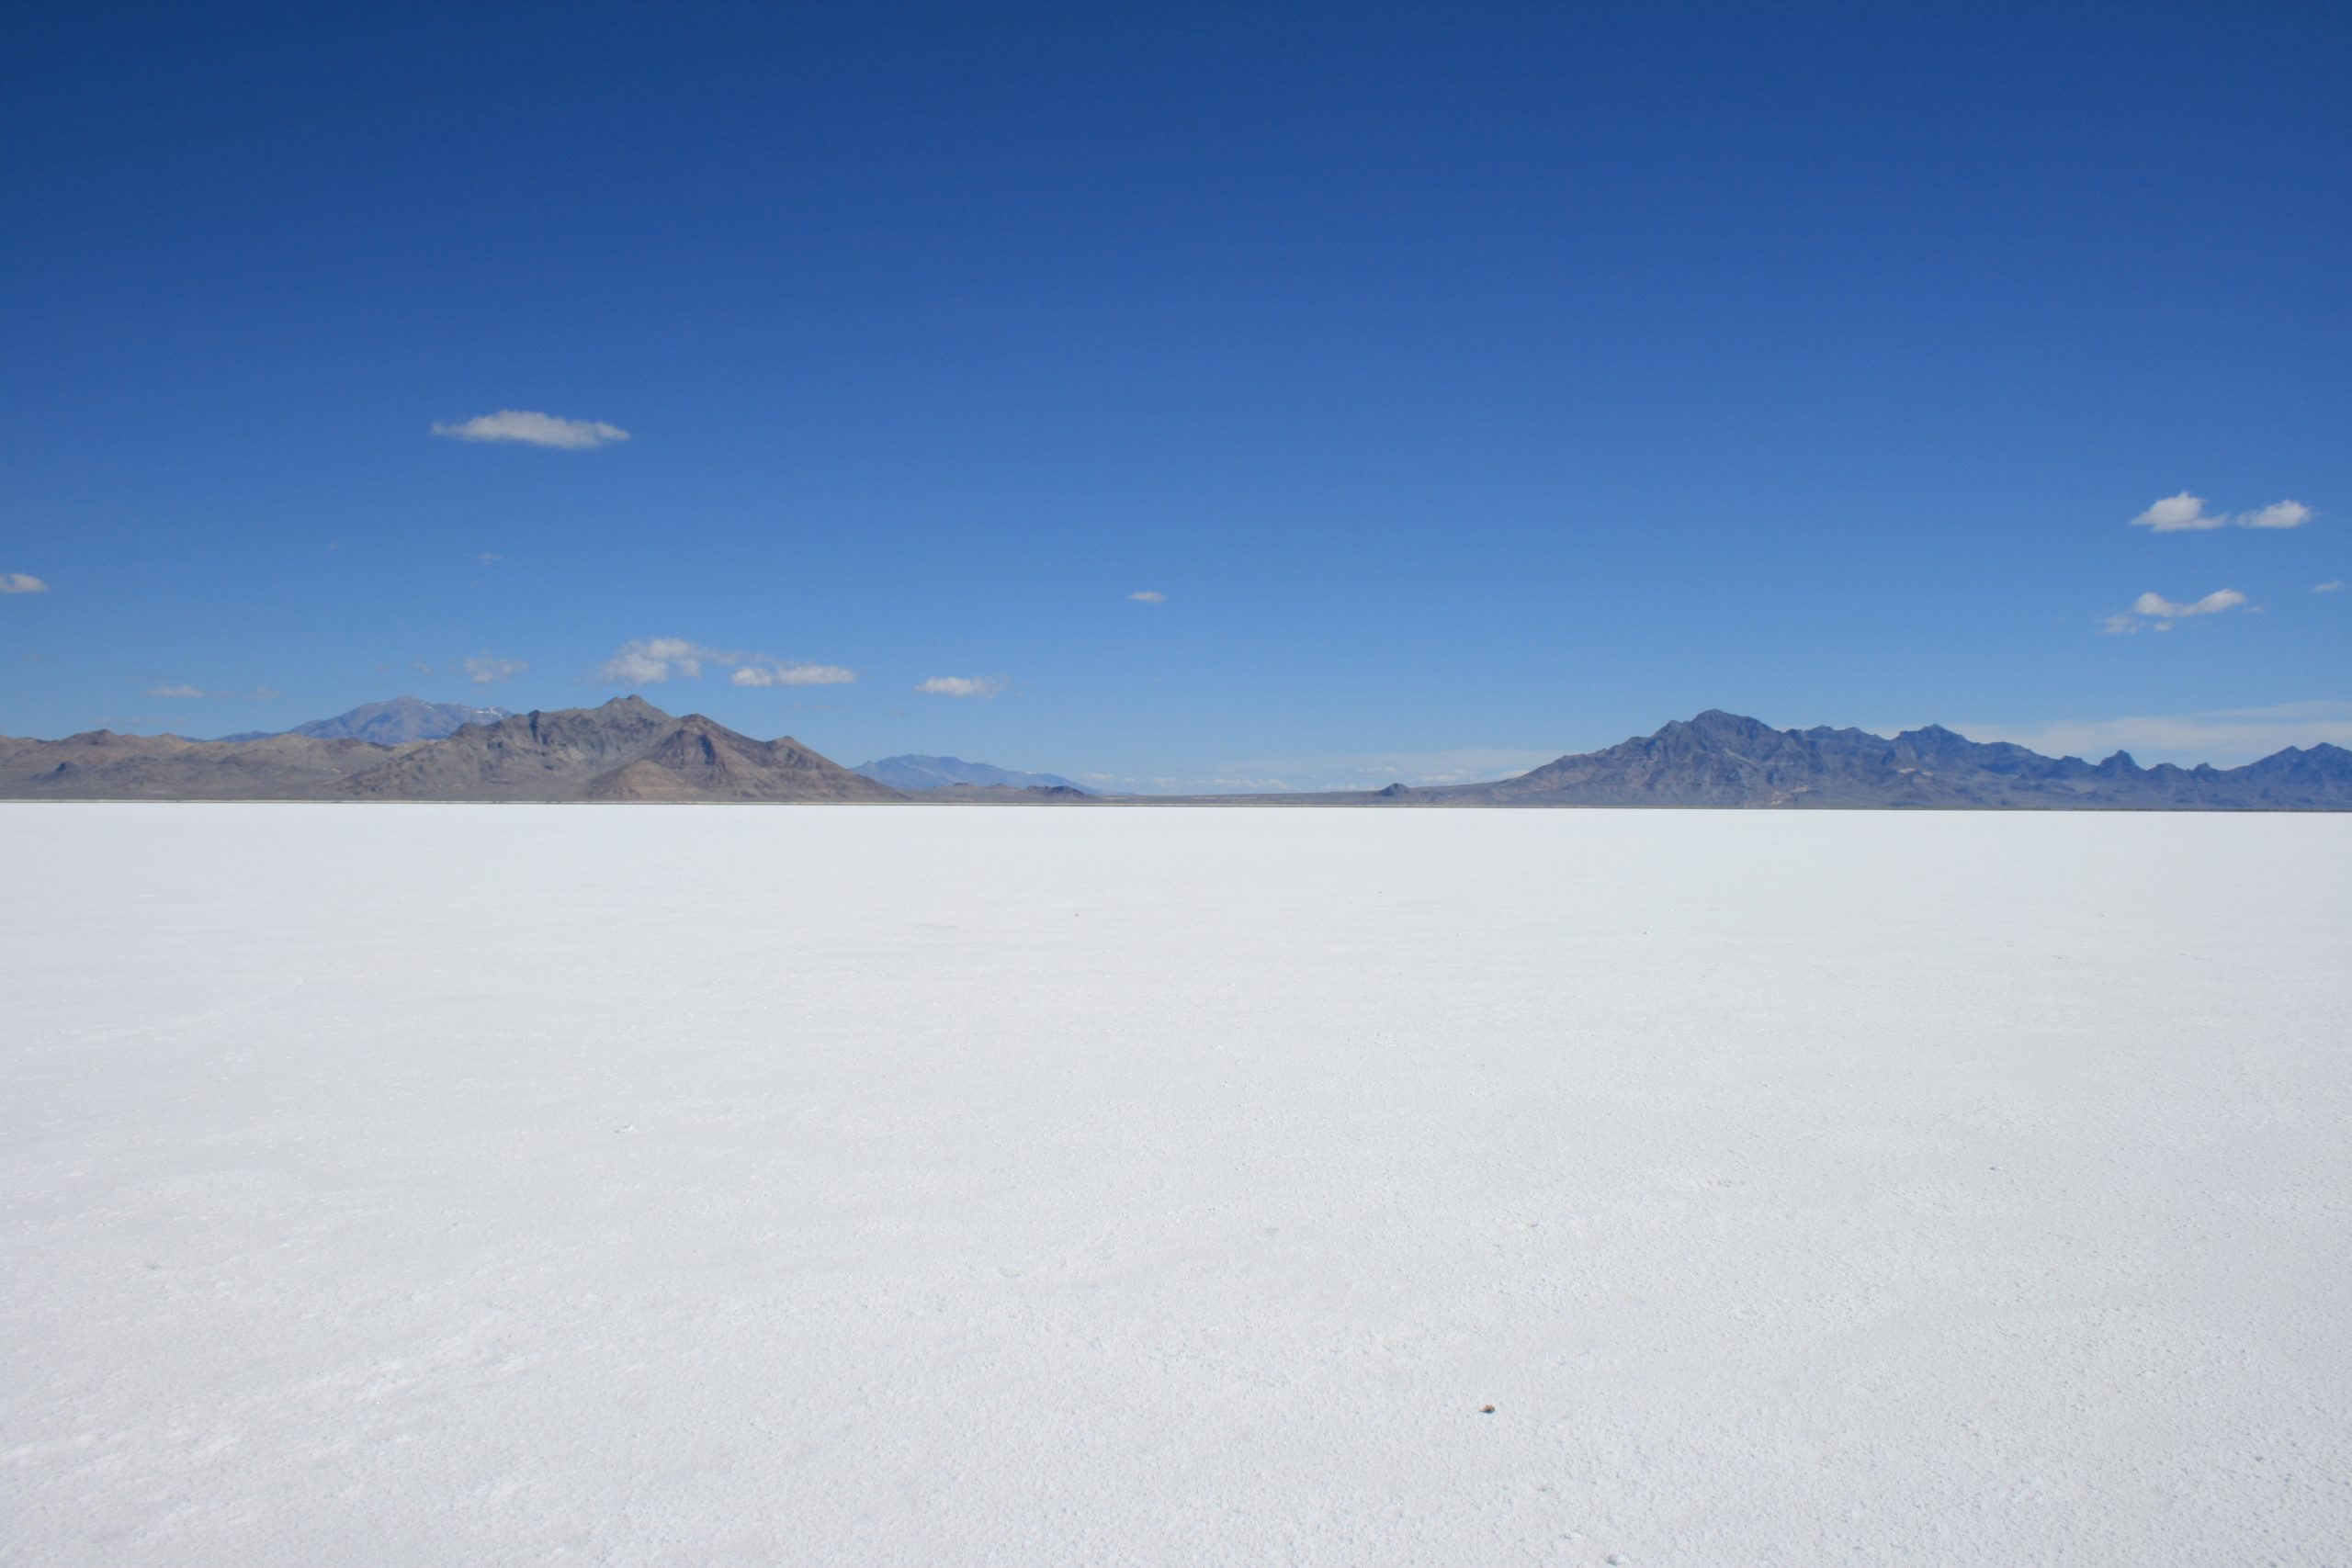
Figure 16.37: Salt-covered plain known as the Bonneville Salt Flats, Utah. Michael Pätzold. 2008. CC BY-SA 4.0. https://commons.wikimedia.org/wiki/File:Bonneville_salt_flats_pilot_peak.jpg
Figure 16.38: Hanksite, Na22K(SO4)9(CO3)2Cl, one of the few minerals that is considered a carbonate and a sulfate. Matt Affolter(QFL247). 2009. CC BY-SA 3.0.
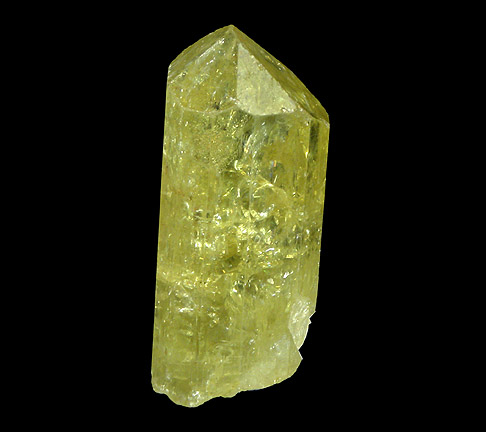
Figure 16.39: Apatite from Mexico. Robert M. Lavinsky. Before March 2010. CC BY-SA 3.0. https://commons.wikimedia.org/wiki/File:Apatite-(CaF)-280343.jpg
A resource which is replaced on human time scales.
A resource that is not able to be replaced on human time scales.
Energy resources (typically hydrocarbons) derived from ancient chemical energy preserved in the geologic record. Includes coal, oil, and natural gas.
A liquid fossil fuel derived from shallow marine rocks (also known as crude oil).
Minerals with a luster similar to metal and contain metals, including valuable elements like lead, zinc, copper, tin, etc.
A natural substance that is typically solid, has a crystalline structure, and is typically formed by inorganic processes. Minerals are the building blocks of most rocks.
Minerals that have a luster that is not similar to metal. Divided into subtypes based on the way light reflects (or doesn't), including glassy/vitreous, greasy, pearly, dull, etc.
A unit of the geologic time scale; smaller than an era, larger than an epoch. We are currently in the Quaternary period.
Place where material is extracted from the Earth for human use.
The gases that are part of the Earth, which are mainly nitrogen and oxygen.
The water part of the Earth, as a solid, liquid, or gas.
The outermost physical layer of the Earth, made of the entire crust and upper mantle. It is brittle and broken into a series of plates, and these plates move in various ways (relative to one another), causing the features of the theory of plate tectonics.
Former swamp-derived (plant) material that is part of the rock record.
A dark liquid fossil fuel derived from petroleum.
Gaseous fossil fuel derived from petroleum, mostly made of methane.
Valuable material in the Earth, typically used for metallic mineral resources.
A process inside stars where smaller atoms combine and form larger atoms.
Amount of movement during a faulting event.
Place where lava is erupted at the surface.
The outermost chemical layer of the Earth, defined by its low density and higher concentrations of lighter elements. The crust has two types: continental, which is the thick, more ductile, and lowest density, and oceanic, which is higher density, more brittle, and thinner.
The theory that the outer layer of the Earth (the lithosphere) is broken in several plates, and these plates move relative to one another, causing the major topographic features of Earth (e.g. mountains, oceans) and most earthquakes and volcanoes.
A metamorphosed limestone.
A group of all atoms with a specific number of protons, having specific, universal, and unique properties.
Data which is out of the ordinary and does not fit previous trends.
Water that is below the surface.
Items that are found within Earth that are valuable and limited. Examples include coal, water, and gold.
Energy that radiates from fault movement via earthquakes.
Mining that occurs near the Earth's surface.
Large surface mine with opening carved into the ground.
Any downhill movement of material, caused by gravity.
Slope angle where shear forces and normal forces are equal.
General term for sudden material falling (sliding) down a slope due to gravity.
Mining that occurs as entire layers of ore and gangue are removed.
Mining that occurs within tunnels and shafts inside the Earth.
A qualitative measure of the amount of metamorphism that has occurred or the amount of a resource present in an ore.
The process in which solids (like minerals) are disassociated and the ionic components are dispersed in a liquid (usually water).
The act of taking a solid and dissolving it into a liquid. This commonly occurs with salts and other minerals in water.
The act of a solid coming out of solution, typically resulting from a drop in temperature or a decrease of the dissolving material.
Material found around ore which is less valuable and needs to be removed in order to obtain ore.
A mechanical process which takes ore and separates it from gangue material.
A process which chemically separates desired element(s) from ore minerals.
Removing trace elements from desired elements.
Deposit of heavy ores in stream or beach sediments.
Any evidence of ancient life.
Long term averages and variations within the conditions of the atmosphere.
A topographic high found away from the beach in deeper water, but still on the continental shelf. Typically, these are formed in tropical areas by organisms such as corals.
Places that are under ocean water at all times.
Pieces of rock that have been weathered and possibly eroded.
A very fine-grained rock with very thin layering (fissile).
A rock made of primarily mud, i.e. particles smaller than sand (≤0.064 mm).
A chemical or biochemical rock made of mainly calcite.
The measure of the vibrational (kinetic) energy of a substance.
A rock that contains material which can be turned into petroleum resources. Organic-rich muds form good source rocks.
A rock or sediment that has good permeability and porosity, and allows water to move easily, making it possible to get water for human use.
A rock primarily made of sand.
The study of rock layers and their relationships to each other within a specific area.
Rocks which allow petroleum resources to collect or move.
A geologic circumstance (such as a fold, fault, change in lithology, etc.) which allows petroleum resources to collect.
Downward-facing fold, that has older rock in its core.
A rock up-warping of symmetrical anticlines.
Planar feature where two blocks of bedrock move past each other via earthquakes.
Discernible layers of rock, typically from a sedimentary rock.
The study of changes in the rock record caused by changing sea level over time.
A specific set of features that are tied together in an interpretive group. Facies can be based on mineralogy, biologic factors, fossils, rock types, etc.
Mineral group in which the carbonate ion, CO3-2, is the building block. This can also refer to the rocks that are made from these minerals, namely limestone and dolomite (dolostone).
The part of the coastline which is directly related to water-land interaction, specifically the tidal zone and the range of wave base.
Interior body of ocean water, at least partially cut off from the main ocean water.
Shore area between low tide and storm wave base. Upper part is dominated by fair weather wave base, lower part is dominated by storm wave base.
The part of the coastline which is below any wave base action.
Sands or sandstones that contain high-viscosity petroleum.
The resistance of a fluid to flow, where a high value means a fluid which does not like to flow (like toothpaste), and a low value means a fluid which flows easily (like water).
Oil which is found in low-permeability, high-porosity rocks such as shale.
Rocks that are formed by sedimentary processes, including sediments lithifying and precipitation from solution.
Amount of empty space within a rock or sediment, including space between grains, fractures, or voids.
The ability for a fluid to travel between pores, or, how connected the pores are within a rock or sediment.
A process of injecting pressurized fluids into the ground to aid in hydrocarbon migration.
A break within a rock that has no relative movement between the sides. Caused by cooling, pressure release, tectonic forces, etc.
Depositional environments that are on land.
An extensive, distinct, and mapped set of geologic layers.
The process of turning sediment into sedimentary rock, including deposition, compaction, and cementation.
Rocks and minerals that change within the Earth are called metamorphic, changed by heat and pressure. Metamorphism is the name of the process.
Components of magma which are dissolved until it reaches the surface, where they expand. Examples include water and carbon dioxide. Volatiles also cause flux melting in the mantle, causing volcanism.
An igneous rock with extremely low silica composition, being made of almost all olivine and pyroxene. Ultramafic rocks contain very low amount of silica and are common in the mantle. Primary ultramafic rocks are komatiite (extrusive) and peridotite (intrusive).
Can refer to a volcanic rock with lower silica composition, or the minerals that make up those rocks, namely olivine, pyroxene, amphibole, and biotite. Mafic rocks are darker in color and contain more minerals that are dark in color, but can contain some plagioclase feldspar. Primary mafic rocks are basalt (extrusive) and gabbro (intrusive).
A reservoir of magma below a volcano.
Liquid rock within the Earth.
A rock (or texture within a rock) with unusually-large crystals, minerals with rare trace element concentrations, and/or unusual minerals, typically forming in veins as the last dredges of magma crystallize.
Rocks that are formed from liquid rock, i.e. from volcanic processes.
SiO2. Transparent, but can be any color imaginable with impurities. No cleavage, hard, and commonly forms equant masses. Perfect crystals are hexagonal prisms topped with pyramidal shapes. One of the most common minerals, and is found in many different geologic settings, including the dominant component of sand on the surface of Earth. Structure is a three-dimensional network of silica tetrahedra, connected as much as possible to each other.
Consisting of three end members: potassium feldspar (K-spar, KAlSi3O8), plagioclase with calcium (CaAl2Si2O8, called anorthite), and plagioclase with sodium (NaAlSi3O8, called albite). Commonly blocky, with two cleavages at ~90°. Plagioclase is typically more dull white and gray, and K-spar is more vibrant white, orange, or red.
X1A2-3Z4O10(OH, F)2, where commonly X=K, Na, Ca; A=Al, Mg, Fe; Z=Si, Al. Has two more-common occurrences, light-colored (translucent and pearly tan) muscovite, and dark-colored biotite. Has one strong cleavage, and is typically seen as sheets, in stacks or "books." Common in many igneous and metamorphic rocks. Structure is two-dimensional sheets of silica tetrahedra in a hexagonal network.
Minerals made from just a single element, bonded to itself. Examples include gold, silver, copper, and diamond, which is a native version of carbon.
An ultramafic rock from deep volcanic vents that can contain diamonds.
Pipe that connects the magma chamber to the volcanic vent.
Middle chemical layer of the Earth, made of mainly iron and magnesium silicates. It is generally denser than the crust (except for older oceanic crust) and less dense than the core.
Eon defined as the time between 4 billion years ago to 2.5 billion years ago. Most of the oldest rocks on Earth, including large portions of the continents, formed at this time.
The largest span of time recognized by geologists, larger than an era. We are currently in the Phanerozoic eon. Rocks of a specific eon are called eonotherms.
The average change in temperature that is experienced as material moves into the Earth. Near the surface, this rate is about 25°C/km.
Metamorphism which occurs with hot fluids going within rocks, altering and changing the rocks.
Metallic mineral deposit which forms near mid-ocean ridges.
Mineral chimneys that form at hydrothermal vents.
A divergent boundary within an oceanic plate, where new lithosphere and crust is created as the two plates spread apart. Mid-ocean ridge and spreading center are synonyms.
A term for the collective time before the Phanerozoic (pre-541 million years ago), including the Hadean, Archean, and Proterozoic. Known for a lack of easy-to-find fossils.
Large metallic mineral deposit that forms near magma bodies like plutons. Commonly contains copper, lead, zinc, molybdenum, and gold.
An igneous rock with two distinctive crystal sizes.
Arrangement of minerals within a rock.
A volcanic rock with medium silica composition, equally rich in felsic minerals (feldspar) and mafic minerals (amphibole, biotite, pyroxene). Intermediate rocks are grey in color and contain somewhat equal amounts of minerals that are light and dark in color. Primary intermediate rocks are andesite (extrusive) and diorite (intrusive).
Can refer to a volcanic rock with higher silica composition, or the minerals that make up those rocks, namely quartz, feldspar, and muscovite mica. Felsic rocks are lighter in color and contain more minerals that are light in color. Primary felsic rocks are rhyolite (extrusive) and granite (intrusive).
Igneous rock cooling, and thus forming, inside of the Earth, i.e. under the surface.
Breaking down rocks into small pieces by chemical or mechanical means.
Oxidation that occurs in sulfide deposits which can concentrate valuable elements like copper.
Certain metallic elements (like iron) take in oxygen, causing reactions like rust.
Minerals in which ions are bonded to oxygen, such as hematite (Fe2O3).
Carbonate rock that reacts with hot magmatic fluids, creating concentrated ore deposits, which include copper, iron, zinc, and gold.
Mineral group in which the silica tetrahedra, SiO4-4, is the building block.
XY(Al,Si)2O6, in which X typically equals Na, Ca, Mg, or Fe and Y typically equals Mg, Fe, or Al. Typically black to dark green, blocky, with two cleavages at ~90°. Common in mafic igneous rocks and some metamorphic rocks. Structure is a single chain of silica tetrahedra.
A group of chain silicate minerals that form needlelike or prismatic crystals. Can be many colors but the most common form, hornblende, is dark brown to black. Has oblique cleavages at 54° and 126°. Common in many igneous rocks and some metamorphic rocks.
Minerals bonded via a sulfur (S-2) atom.
The average diameter of a grain of sediment, ranging from small, also known as fine-grained (e.g. clay, silt) to large, also known as coarse-grained (e.g. boulder).
Low grade, broad deposits of microscopic gold found in sedimentary rocks with diagenetic alteration.
A piece of a rock that is caught up inside of another rock.
Changes in sedimentary rocks due to increased (but low when compared to metamorphism) temperatures and pressures. This can include deposition of new minerals (e.g. limestone converting to dolomite) or dissolution of existing minerals.
Empty space in a geologic material, either within sediments, or within rocks. Can be filled by air, water, or hydrocarbons.
Reactions that are related to the availability of oxygen. Many minerals or ions change their solubility based on redox conditions.
An interconnected set of parts that combine and make up a whole.
A sedimentary rock that formed long ago as free oxygen changed the solubility of iron, causing layers of iron rich and iron-poor sediments to form in thin layers, or bands.
A very fine grained version of silica deposited with or without microfossils.
A specific layer of rock with identifiable properties.
Original water trapped inside a forming rock.
A local or regional depression which allows sediments to accumulate.
A down-warped feature in the crust.
Metallic mineral deposit of mainly lead and zinc from groundwater movements within sedimentary rocks.
Diagenetic copper deposit within sedimentary rocks.
A type of non-eroded sediment mixed with organic matter, used by plants. Many essential elements for life, like nitrogen, are delivered to organisms via the soil.
A highly weathered soil deposit that consists of aluminum ores.
Carbonate rocks which dissolve, leaving behind caverns and holes which affect the landscape.
Breaking down of mineral material via chemical methods, like dissolution and oxidation.
The range of sediment sizes within a sediment or sediment within sedimentary rocks. Well sorted means the sediment has the same sizes, poorly sorted means many different sizes are present.
A channelled body of water.
ZrSiO4. Relatively chemically inert with a hardness of 8.5. Common accessory mineral in igneous and metamorphic rocks, as well as detrital sediments. Uranium can substitute for zirconium, making zircon a valuable mineral in radiometric dating.
The transport and movement of weathered sediments.
Toxic waters rich in heavy metals and often of low pH that come from unregulated mining districts.
CaCO3. Pure form is clear, but can take on many different colors with impurities. It is soft, fizzes in acid, and has three cleavages that are not at 90°.
Minerals bonded via a sulfate ion, SO4-2.
Porous, concentric, or layered variety of carbonate that forms with often heated water in springs and/or caves.
General name of a felsic rock that is intrusive. Has more felsic minerals than mafic minerals.
Metamorphic rock with a strong foliation but no visible minerals, derived from mudstones or shales.
A chemical sedimentary rock that forms as water evaporates.
Area where water infiltrates into the ground and adds to the overall groundwater.
An evaporite mineral, CaSo4•2H2O. Has one cleavage, hardness of 2. Typically clear or white.
Also known as rock salt, or table salt. 3 cleavages at 90°, cubic crystal habit. Typically clear or white, hardness of 3.
Volcanic tephra that is less than 2 mm in diameter.
