10 Mass Wasting
Learning Objectives
By the end of this chapter, students should be able to:
- Explain what mass wasting is and why it occurs on a slope.
- Explain the basic triggers of mass-wasting events and how they occur.
- Identify types of mass wasting.
- Identify risk factors for mass-wasting events.
- Evaluate landslides and their contributing factors.
This chapter discusses the fundamental processes driving mass-wasting, types of mass wasting, examples and lessons learned from famous mass-wasting events, how mass wasting can be predicted, and how people can be protected from this potential hazard. Mass wasting is the downhill movement of rock and soil material due to gravity. The term landslide is often used as a synonym for mass wasting, but mass wasting is a much broader term referring to all movement downslope. Geologically, landslide is a general term for mass wasting that involves fast-moving geologic material. Loose material along with overlying soils are what typically move during a mass-wasting event. Moving blocks of bedrock are called rock topples, rock slides, or rock falls, depending on the dominant motion of the blocks. Movements of dominantly liquid material are called flows. Movement by mass wasting can be slow or rapid. Rapid movement can be dangerous, such as during debris flows. Areas with steep topography and rapid rainfall, such as the California coast, Rocky Mountain Region, and Pacific Northwest, are particularly susceptible to hazardous mass-wasting events.
10.1 Slope Strength
Mass wasting occurs when a slope fails. A slope fails when it is too steep and unstable for existing materials and conditions. Slope stability is ultimately determined by two principal factors: the slope angle and the strength of the underlying material. Force of gravity, which plays a part in mass wasting, is constant on the Earth’s surface for the most part, although small variations exist depending on the elevation and density of the underlying rock. In the figure, a block of rock situated on a slope is pulled down toward the Earth’s center by the force of gravity (fg). The gravitational force acting on a slope can be divided into two components: the shear or driving force (fs) pushing the block down the slope, and the normal or resisting force (fn) pushing into the slope, which produces friction. The relationship between shear force and normal force is called shear strength. When the normal force, i.e., friction, is greater than the shear force, then the block does not move downslope. However, if the slope angle becomes steeper or if the earth material is weakened, shear force exceeds normal force, compromising shear strength, and downslope movement occurs.
In the figure, the force vectors change as the slope angle increases. The gravitational force doesn’t change, but the shear force increases while the normal force decreases. The steepest angle at which rock and soil material is stable and will not move downslope is called the angle of repose. The angle of repose is measured relative from the horizontal. When a slope is at the angle of repose, the shear force is in equilibrium with the normal force. If the slope becomes just slightly steeper, the shear force exceeds the normal force, and the material starts to move downhill. The angle of repose varies for all material and slopes depending on many factors such as grain size, grain composition, and water content. The figure shows the angle of repose for sand that is poured into a pile on a flat surface. The sand grains cascade down the sides of the pile until coming to rest at the angle of repose. At that angle, the base and height of the pile continue to increase, but the angle of the sides remains the same.
Water is a common factor that can significantly change the shear strength of a particular slope. Water is located in pore spaces, which are empty air spaces in sediments or rocks between the grains. For example, assume a dry sand pile has an angle of repose of 30 degrees. If water is added to the sand, the angle of repose will increase, possibly to 60 degrees or even 90 degrees, such as a sandcastle being built at a beach. But if too much water is added to the pore spaces of the sandcastle, the water decreases the shear strength, lowers the angle of repose, and the sandcastle collapses.
Another factor influencing shear strength are planes of weakness in sedimentary rocks. Bedding planes (see chapter 5) can act as significant planes of weakness when they are parallel to the slope but less so if they are perpendicular to the slope. At locations A and B, the bedding is nearly perpendicular to the slope and relatively stable. At location D, the bedding is nearly parallel to the slope and quite unstable. At location C, the bedding is nearly horizontal, and the stability is intermediate between the other two extremes. Additionally, if clay minerals form along bedding planes, they can absorb water and become slick. When a bedding plane of shale (clay and silt) becomes saturated, it can lower the shear strength of the rock mass and cause a landslide, such as at the 1925 Gros Ventre, Wyoming rock slide. See the case studies section for details on this and other landslides.

Take this quiz to check your comprehension of this section.
If you are using an offline version of this text, access the quiz for section 10.1 via the QR code.
10.2 Mass-Wasting Triggers & Mitigation
Mass-wasting events often have a trigger: something changes that causes a landslide to occur at a specific time. It could be rapid snowmelt, intense rainfall, earthquake shaking, volcanic eruption, storm waves, rapid-stream erosion, or human activities, such as grading a new road. Increased water content within the slope is the most common mass-wasting trigger. Water content can increase due to rapidly melting snow or ice or an intense rain event. Intense rain events can occur more often during El Niño years. Then, the west coast of North America receives more precipitation than normal, and landslides become more common. Changes in surface-water conditions resulting from earthquakes, previous slope failures that dam up streams, or human structures that interfere with runoff, such as buildings, roads, or parking lots can provide additional water to a slope. In the case of the 1959 Hebgen Lake rock slide, Madison Canyon, Montana, the shear strength of the slope may have been weakened by earthquake shaking. Most landslide mitigation diverts and drains water away from slide areas. Tarps and plastic sheeting are often used to drain water off of slide bodies and prevent infiltration into the slide. Drains are used to dewater landslides and shallow wells are used to monitor the water content of some active landslides.
An oversteepened slope may also trigger landslides. Slopes can be made excessively steep by natural processes of erosion or when humans modify the landscape for building construction. An example of how a slope may be oversteepened during development occurs where the bottom of the slope is cut into, perhaps to build a road or level a building lot, and the top of the slope is modified by depositing excavated material from below. If done carefully, this practice can be very useful in land development, but in some cases, this can result in devastating consequences. For example, this might have been a contributing factor in the 2014 North Salt Lake City, Utah landslide. A former gravel pit was regraded to provide a road and several building lots. These activities may have oversteepened the slope, which resulted in a slow moving landslide that destroyed one home at the bottom of the slope. Natural processes such as excessive stream erosion from a flood or coastal erosion during a storm can also oversteepen slopes. For example, natural undercutting of the riverbank was proposed as part of the trigger for the famous 1925 Gros Ventre, Wyoming rock slide.
Slope reinforcement can help prevent and mitigate landslides. For rockfall-prone areas, sometimes it is economical to use long steel bolts. Bolts, drilled a few meters into a rock face, can secure loose pieces of material that could pose a hazard. Shockcrete, a reinforced spray-on form of concrete, can strengthen a slope face when applied properly. Buttressing a slide by adding weight at the toe of the slide and removing weight from the head of the slide, can stabilize a landslide. Terracing, which creates a stairstep topography, can be applied to help with slope stabilization, but it must be applied at the proper scale to be effective.
A different approach in reducing landslide hazard is to shield, catch, and divert the runout material. Sometimes the most economical way to deal with a landslide hazard is to divert and slow the falling material. Special stretchable fencing can be applied in areas where rockfall is common to protect pedestrians and vehicles. Runout channels, diversion structures, and check dams can be used to slow debris flows and divert them around structures. Some highways have special tunnels that divert landslides over the highway. In all of these cases the shielding has to be engineered to a scale that is greater than the slide, or catastrophic loss in property and life could result.

Take this quiz to check your comprehension of this section.
If you are using an offline version of this text, access the quiz for section 10.2 via the QR code.
10.3 Landslide Classification & Identification
Mass-wasting events are classified by type of movement and type of material, and there are several ways to classify these events. The figure and table show terms used. In addition, mass-wasting types often share common morphological features observed on the surface, such as the head scarp—commonly seen as crescent shapes on a cliff face; hummocky or uneven surfaces; accumulations of talus—loose rocky material falling from above; and toe of slope, which covers existing surface material.
10.3.1 Types of Mass Wasting
The most common mass-wasting types are falls, rotational and translational slides, flows, and creep. Falls are abrupt rock movements that detach from steep slopes or cliffs. Rocks separate along existing natural breaks such as fractures or bedding planes. Movement occurs as free-falling, bouncing, and rolling. Falls are strongly influenced by gravity, mechanical weathering, and water. Rotational slides commonly show slow movement along a curved rupture surface. Translational slides often are rapid movements along a plane of distinct weakness between the overlying slide material and more stable underlying material. Slides can be further subdivided into rock slides, debris slides, or earth slides depending on the type of the material involved (see table).
| Type of movement | Primary material type and common name of slide | ||
|---|---|---|---|
| Bedrock | Soil: mostly coarse-grained | Soil: mostly fine-grained | |
| Falls | Rock fall | ||
| Rock avalanche | Rock avalanche | ||
| Rotational slide (slump) | Rotational debris slide (slump) | Rotational Earth slide (slump) | |
| Transitional slide | Transitional rock slide | Transitional debris slide | Transitional Earth slide |
| Flows | Debris flow | Earth flow | |
| Soil creep | Creep | Creep | |
Table 10.1: Mass wasting types.
Flows are rapidly moving mass-wasting events in which the loose material is typically mixed with abundant water, creating long runouts at the slope base. Flows are commonly separated into debris flow (coarse material) and earthflow (fine material) depending on the type of material involved and the amount of water. Some of the largest and fastest flows on land are called sturzstroms, or long runout landslides. They are still poorly understood, but are known to travel for long distances, even in places without significant atmospheres like the Moon.
Creep is the imperceptibly slow downward movement of material caused by a regular cycle of nighttime freezing followed by daytime thawing in unconsolidated material such as soil. During the freeze, expansion of ice pushes soil particles out away from the slope, while the next day following the thaw, gravity pulls them directly downward. The net effect is a gradual movement of surface soil particles downhill. Creep is indicated by curved tree trunks, bent fences or retaining walls, tilted poles or fences, and small soil ripples or ridges. A special type of soil creep is solifluction, which is the slow movement of soil lobes on low-angle slopes due to soil seasonally freezing and thawing in high-latitude, typically sub-Arctic, Arctic, and Antarctic locations.

Video 10.1: Landslide hazards.
If you are using an offline version of this text, access this YouTube video via the QR code.
10.3.2 Parts of a Landslide
Landslides have several identifying features that can be common across the different types of mass wasting. Note that there are many exceptions, and a landslide does not have to have these features. Displacement of material by landslides causes the absence of material uphill and the deposition of new material downhill, and careful observation can identify the evidence of that displacement. Other signs of landslides include tilted or offset structures or natural features that would normally be vertical or in place.
Many landslides have escarpments or scarps. Landslide scarps, like fault scarps, are steep terrain created when movement of the adjacent land exposes a part of the subsurface. The most prominent scarp is the main scarp, which marks the uphill extent of the landslide. As the disturbed material moves out of place, a step slope forms and develops a new hillside escarpment for the undisturbed material. Main scarps are formed by movement of the displaced material away from the undisturbed ground and are the visible part of slide rupture surface.

Complete this interactive activity to check your understanding.
If you are using an offline version of this text, access this interactive activity via the QR code.
The slide rupture surface is the boundary of the body of movement of the landslide. The geologic material below the slide surface does not move, and is marked on the sides by the flanks of the landslide and at the end by the toe of the landslide.
The toe of the landslide marks the end of the moving material. The toe marks the runout, or maximum distance traveled, of the landslide. In rotational landslides, the toe is often a large, disturbed mound of geologic material, forming as the landslide moves past its original rupture surface.
Rotational and translational landslides often have extensional cracks, sag ponds, hummocky terrain and pressure ridges. Extensional cracks form when a landslide’s toe moves forward faster than the rest of landslide, resulting in tensional forces. Sag ponds are small bodies of water filling depressions formed where landslide movement has impounded drainage. Hummocky terrain is undulating and uneven topography that results from the ground being disturbed. Pressure ridges develop on the margins of the landslide where material is forced upward into a ridge structure.

Take this quiz to check your comprehension of this section.
If you are using an offline version of this text, access the quiz for section 10.3 via the QR code.
10.4 Examples of Landslides
10.4.1 Landslides in United States
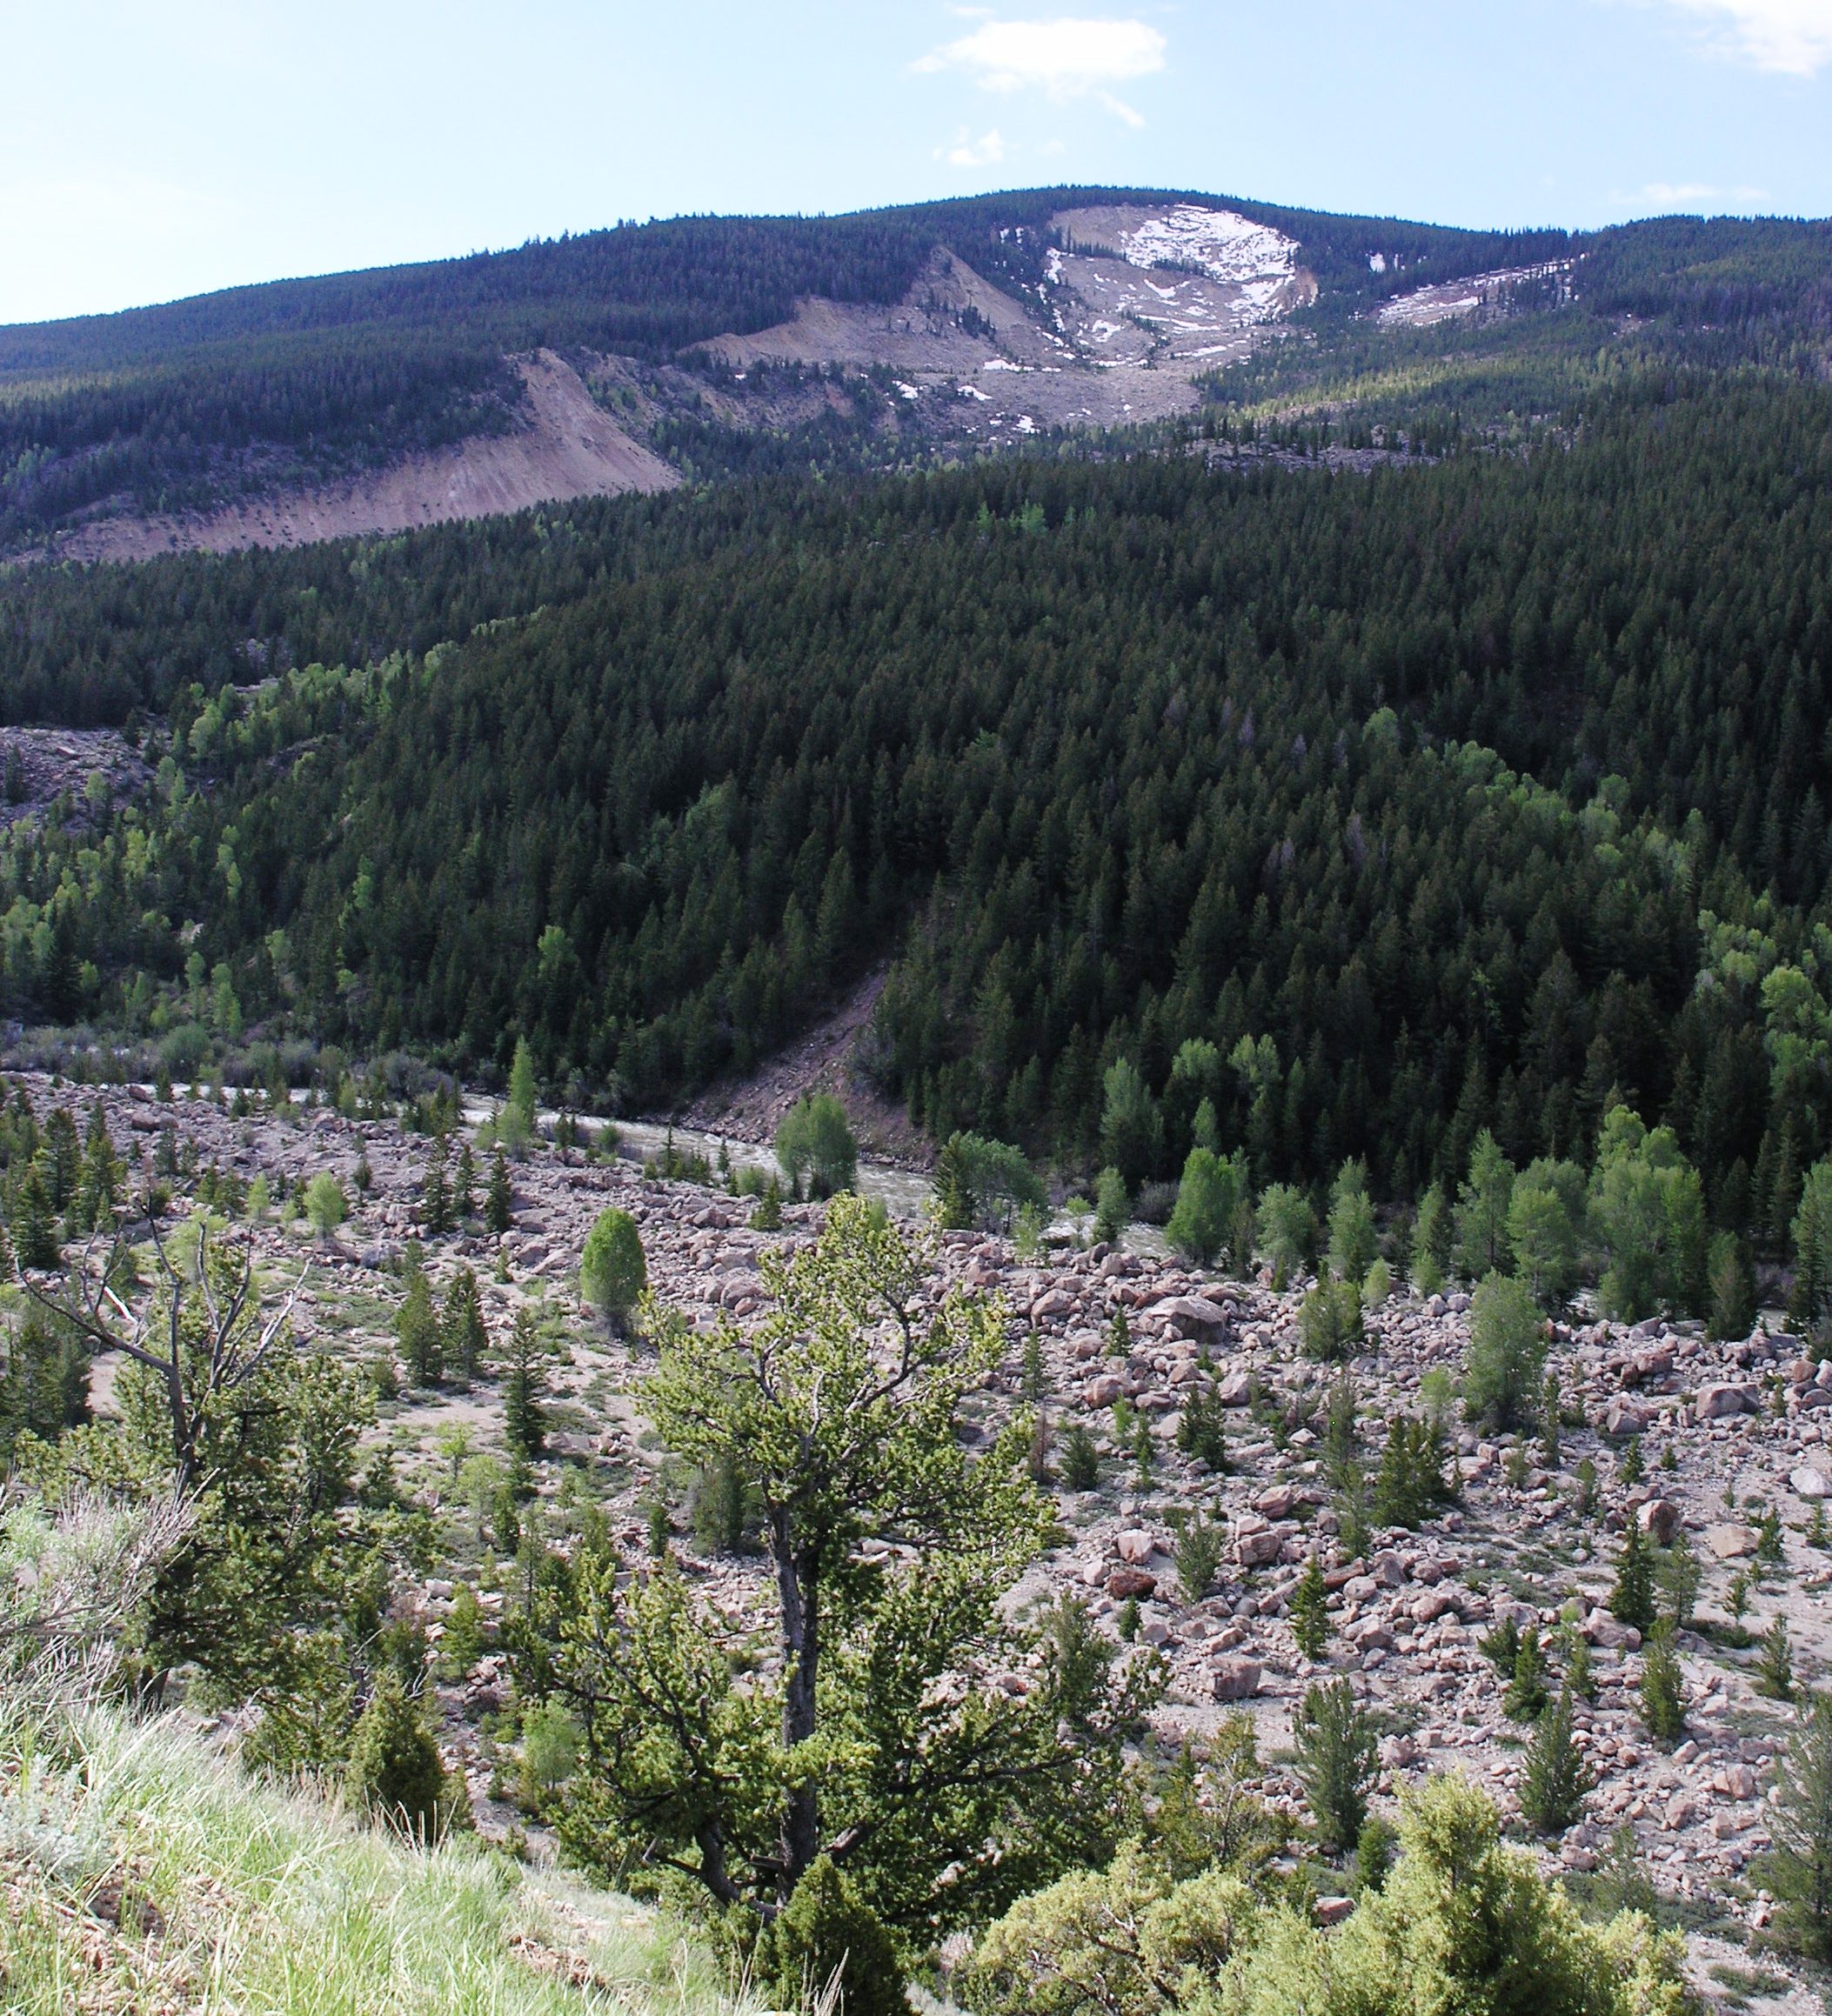
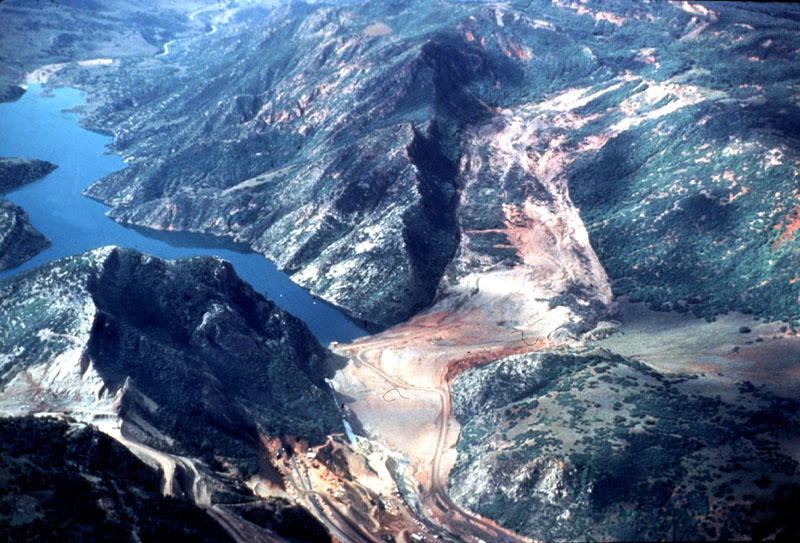
Gros Ventre, Wyoming (1925): On June 23, 1925, a 38 million cubic meter (50 million cu yd) translational rock slide occurred next to the Gros Ventre River (pronounced “grow vont”) near Jackson Hole, Wyoming. Large boulders dammed the Gros Ventre River and ran up the opposite side of the valley several hundred vertical feet. The dammed river created Slide Lake, and two years later in 1927, lake levels rose high enough to destabilize the dam. The dam failed and caused a catastrophic flood that killed six people in the small downstream community of Kelly, Wyoming.
A combination of three factors caused the rock slide: 1) heavy rains and rapidly melting snow saturated the Tensleep sandstone causing the underlying shale of the Amsden Formation to lose its shear strength, 2) the Gros Ventre River cut through the sandstone creating an oversteepened slope, and 3) soil on top of the mountain became saturated with water due to poor drainage. The cross-section diagram shows how the parallel bedding planes between the Tensleep sandstone and Amsden Formation offered little friction against the slope surface as the river undercut the sandstone. Lastly, the rockslide may have been triggered by an earthquake.
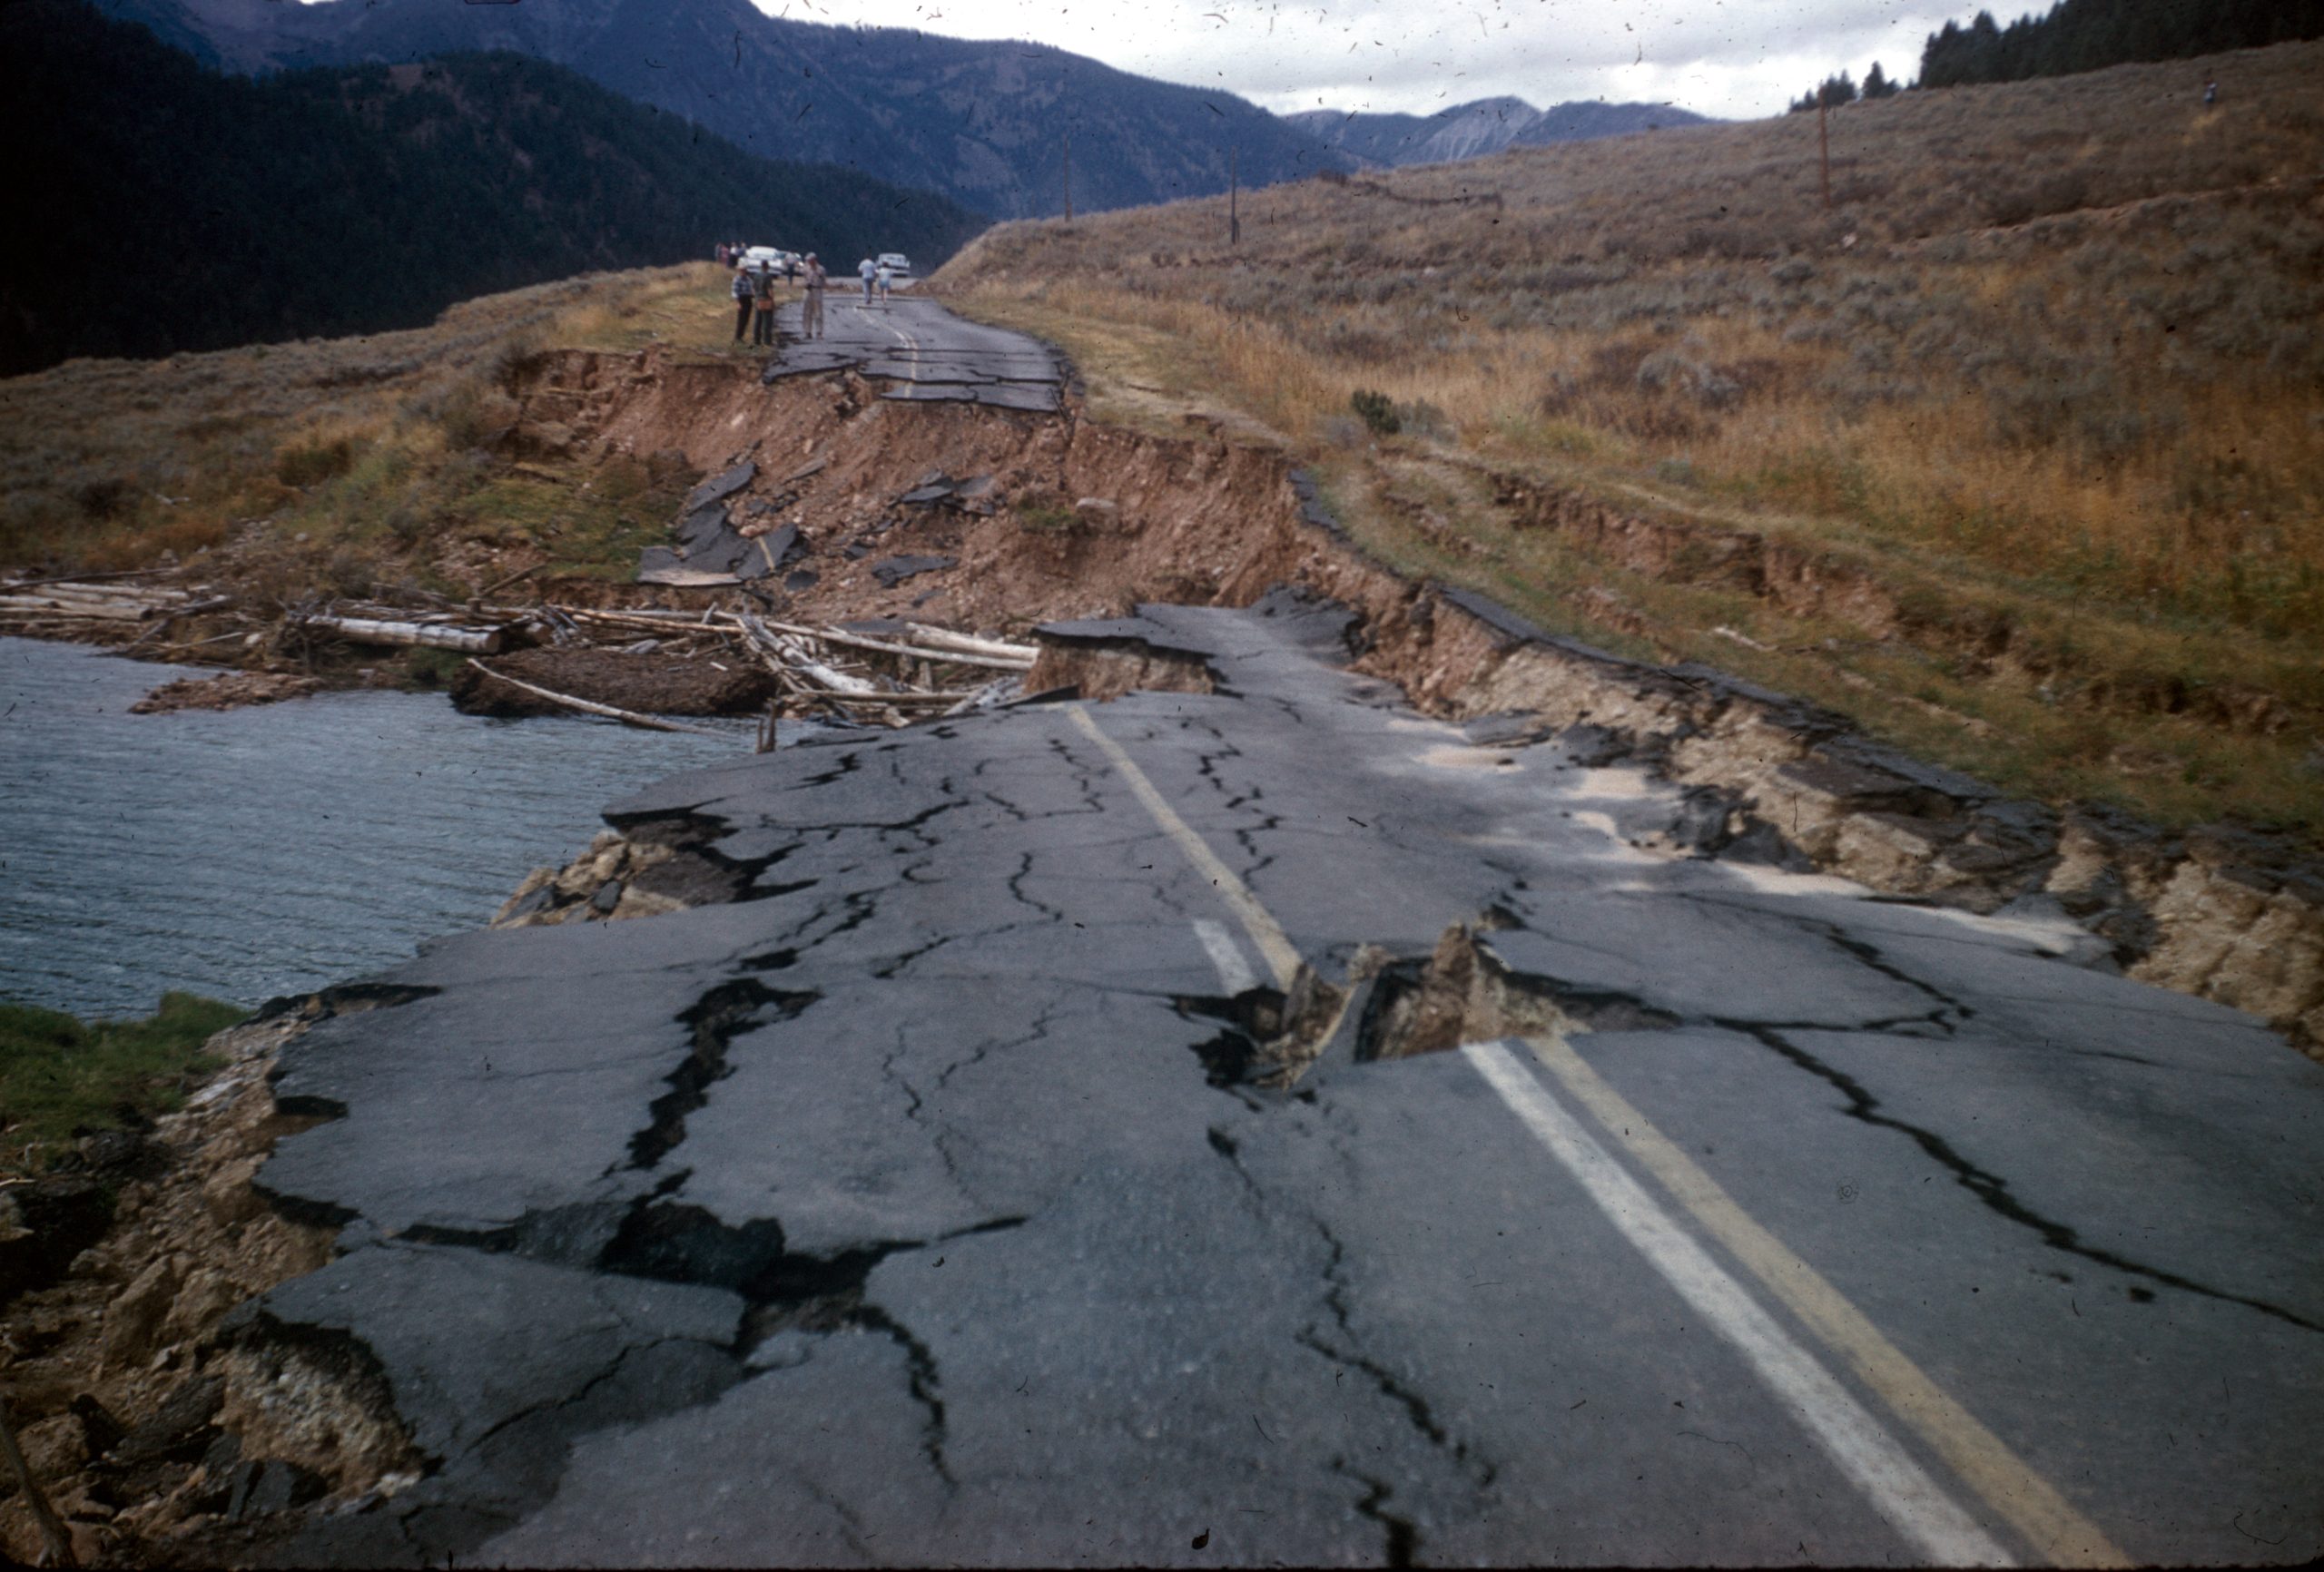
Madison Canyon, Montana (1959): In 1959, the largest earthquake in Rocky Mountain recorded history, magnitude 7.5, struck the Hebgen Lake, Montana area, causing a destructive seiche on the lake (see chapter 9). The earthquake caused a rock avalanche that dammed the Madison River, creating Quake Lake, and ran up the other side of the valley hundreds of vertical feet. Today, there are still house-sized boulders visible on the slope opposite their starting point. The slide moved at a velocity of up to 160.9 kph (100 mph), creating an incredible air blast that swept through the Rock Creek Campground. The slide killed 28 people, most of whom were in the campground and remain buried there. In a manner like the Gros Ventre slide, foliation planes of weakness in metamorphic rock outcrops were parallel with the surface, compromising shear strength.
Mount Saint Helens, Washington (1980): On May 18, 1980 a 5.1-magnitude earthquake triggered the largest landslide observed in the historical record. This landslide was followed by the lateral eruption of Mount Saint Helens volcano, and the eruption was followed by volcanic debris flows known as lahars. The volume of material moved by the landslide was 2.8 cubic kilometers (0.67 mi3).
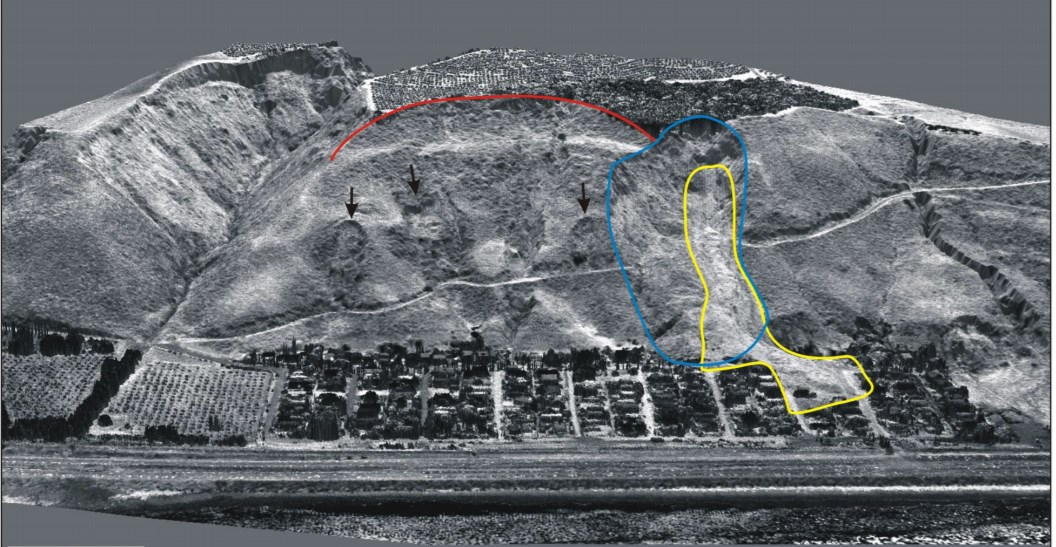
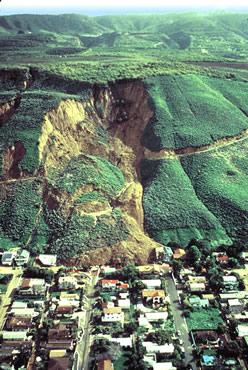
La Conchita, California (1995 and 2005): On March 4, 1995, a fast-moving earthflow damaged nine houses in the southern California coastal community of La Conchita. A week later, a debris flow in the same location damaged five more houses. Surface-tension cracks at the top of the slide gave early warning signs in the summer of 1994. During the rainy winter season of 1994/1995, the cracks grew larger. The likely trigger of the 1995 event was unusually heavy rainfall during the winter of 1994/1995 and rising groundwater levels. Ten years later, in 2005, a rapid-debris flow occurred at the end of a 15-day period of near-record rainfall in southern California. Vegetation remained relatively intact as it was rafted on the surface of the rapid flow, indicating that much of the landslide mass simply was being carried on a presumably much more saturated and fluidized layer beneath. The 2005 slide damaged 36 houses and killed 10 people.
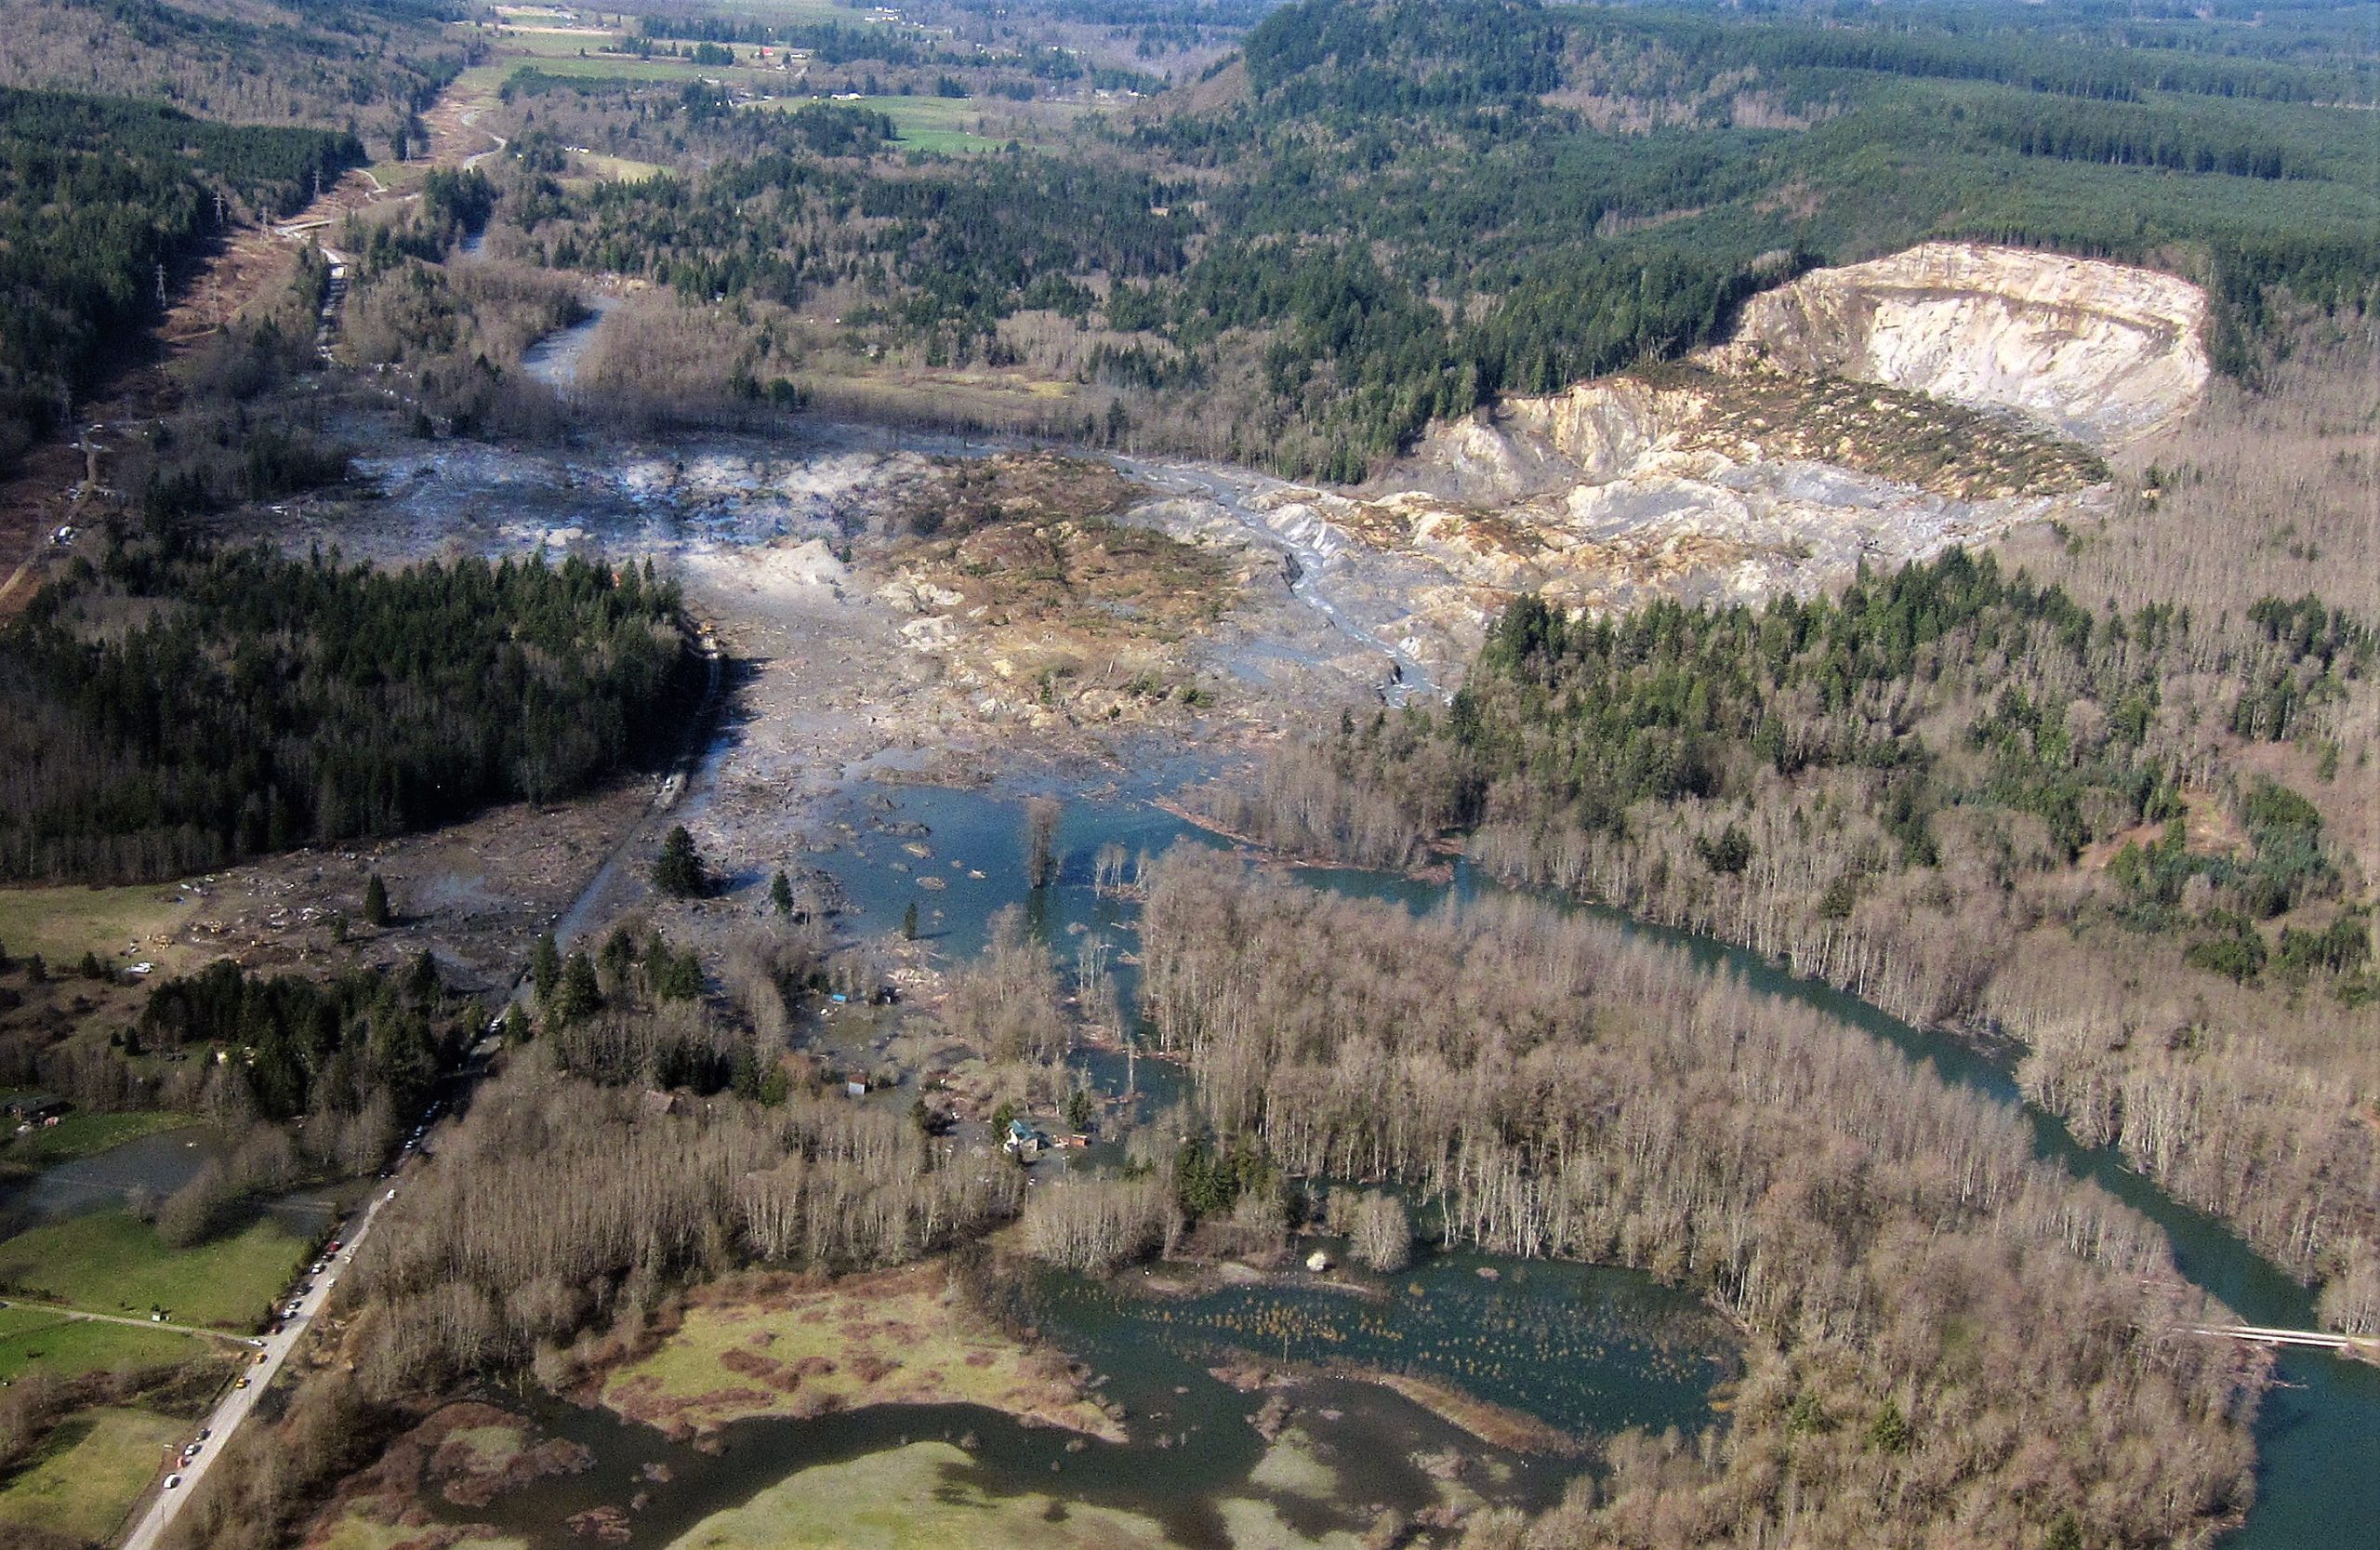
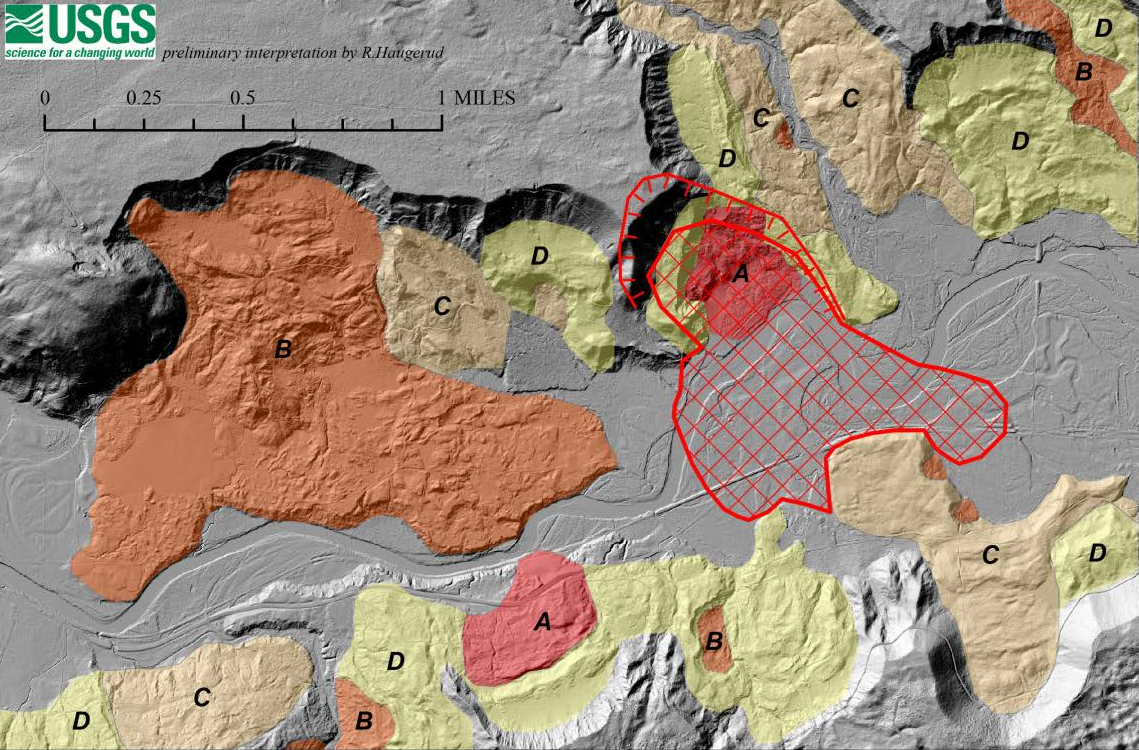
Oso Landslide, Washington (2014): On March 22, 2014, a landslide of approximately 18 million tons (10 million yd3) traveled at 64 kph (40 mph), extended for nearly a 1.6 km (1 m), and dammed the North Fork of the Stillaguamish River. The landslide covered 40 homes and killed 43 people in the Steelhead Haven community near Oso, Washington. It produced a volume of material equivalent to 600 football fields covered in material 3 m (10 ft) deep. The winter of 2013-2014 was unusually wet with almost double the average amount of precipitation. The landslide occurred in an area of the Stillaguamish River Valley historically active with many landslides, but previous events had been small.
Yosemite National Park Rock Falls: The steep cliffs of Yosemite National Park cause frequent rock falls. Fractures created to tectonic stresses and exfoliation and expanded by frost wedging can cause house-sized blocks of granite to detach from the cliff-faces of Yosemite National Park. The park models potential runout, the distance landslide material travels, to better assess the risk posed to the millions of park visitors.

Video 10.2: Rock fall in Yosemite.
If you are using an offline version of this text, access this YouTube video via the QR code.
10.4.2 Landslides in Utah
Markagunt Gravity Slide: About 21–22 million years ago, one of the biggest land-based landslides yet discovered in the geologic record displaced more than 1,700 cu km (408 cu mi) of material in one relatively fast event. Evidence for this slide includes breccia conglomerates (see chapter 5), glassy pseudotachylytes, (see chapter 6), slip surfaces (similar to faults) see chapter 9), and dikes (see chapter 7). The landslide is estimated to encompass an area the size of Rhode Island and to extend from near Cedar City, Utah to Panguitch, Utah. This landslide was likely the result of material released from the side of a growing laccolith (a type of igneous intrusion) see chapter 4), after being triggered by an eruption-related earthquake.
Thistle Slide (1983): Starting in April of 1983 and continuing into May of that year, a slow-moving landslide traveled 305 m (1,000 ft) downhill and blocked Spanish Fork Canyon with an earthflow dam 61 m (200 ft) high. This caused disastrous flooding upstream in the Soldier Creek and Thistle Creek valleys, submerging the town of Thistle. As part of the emergency response, a spillway was constructed to prevent the newly formed lake from breaching the dam. Later, a tunnel was constructed to drain the lake, and currently the river continues to flow through this tunnel. The rail line and US-6 highway had to be relocated at a cost of more than $200 million.
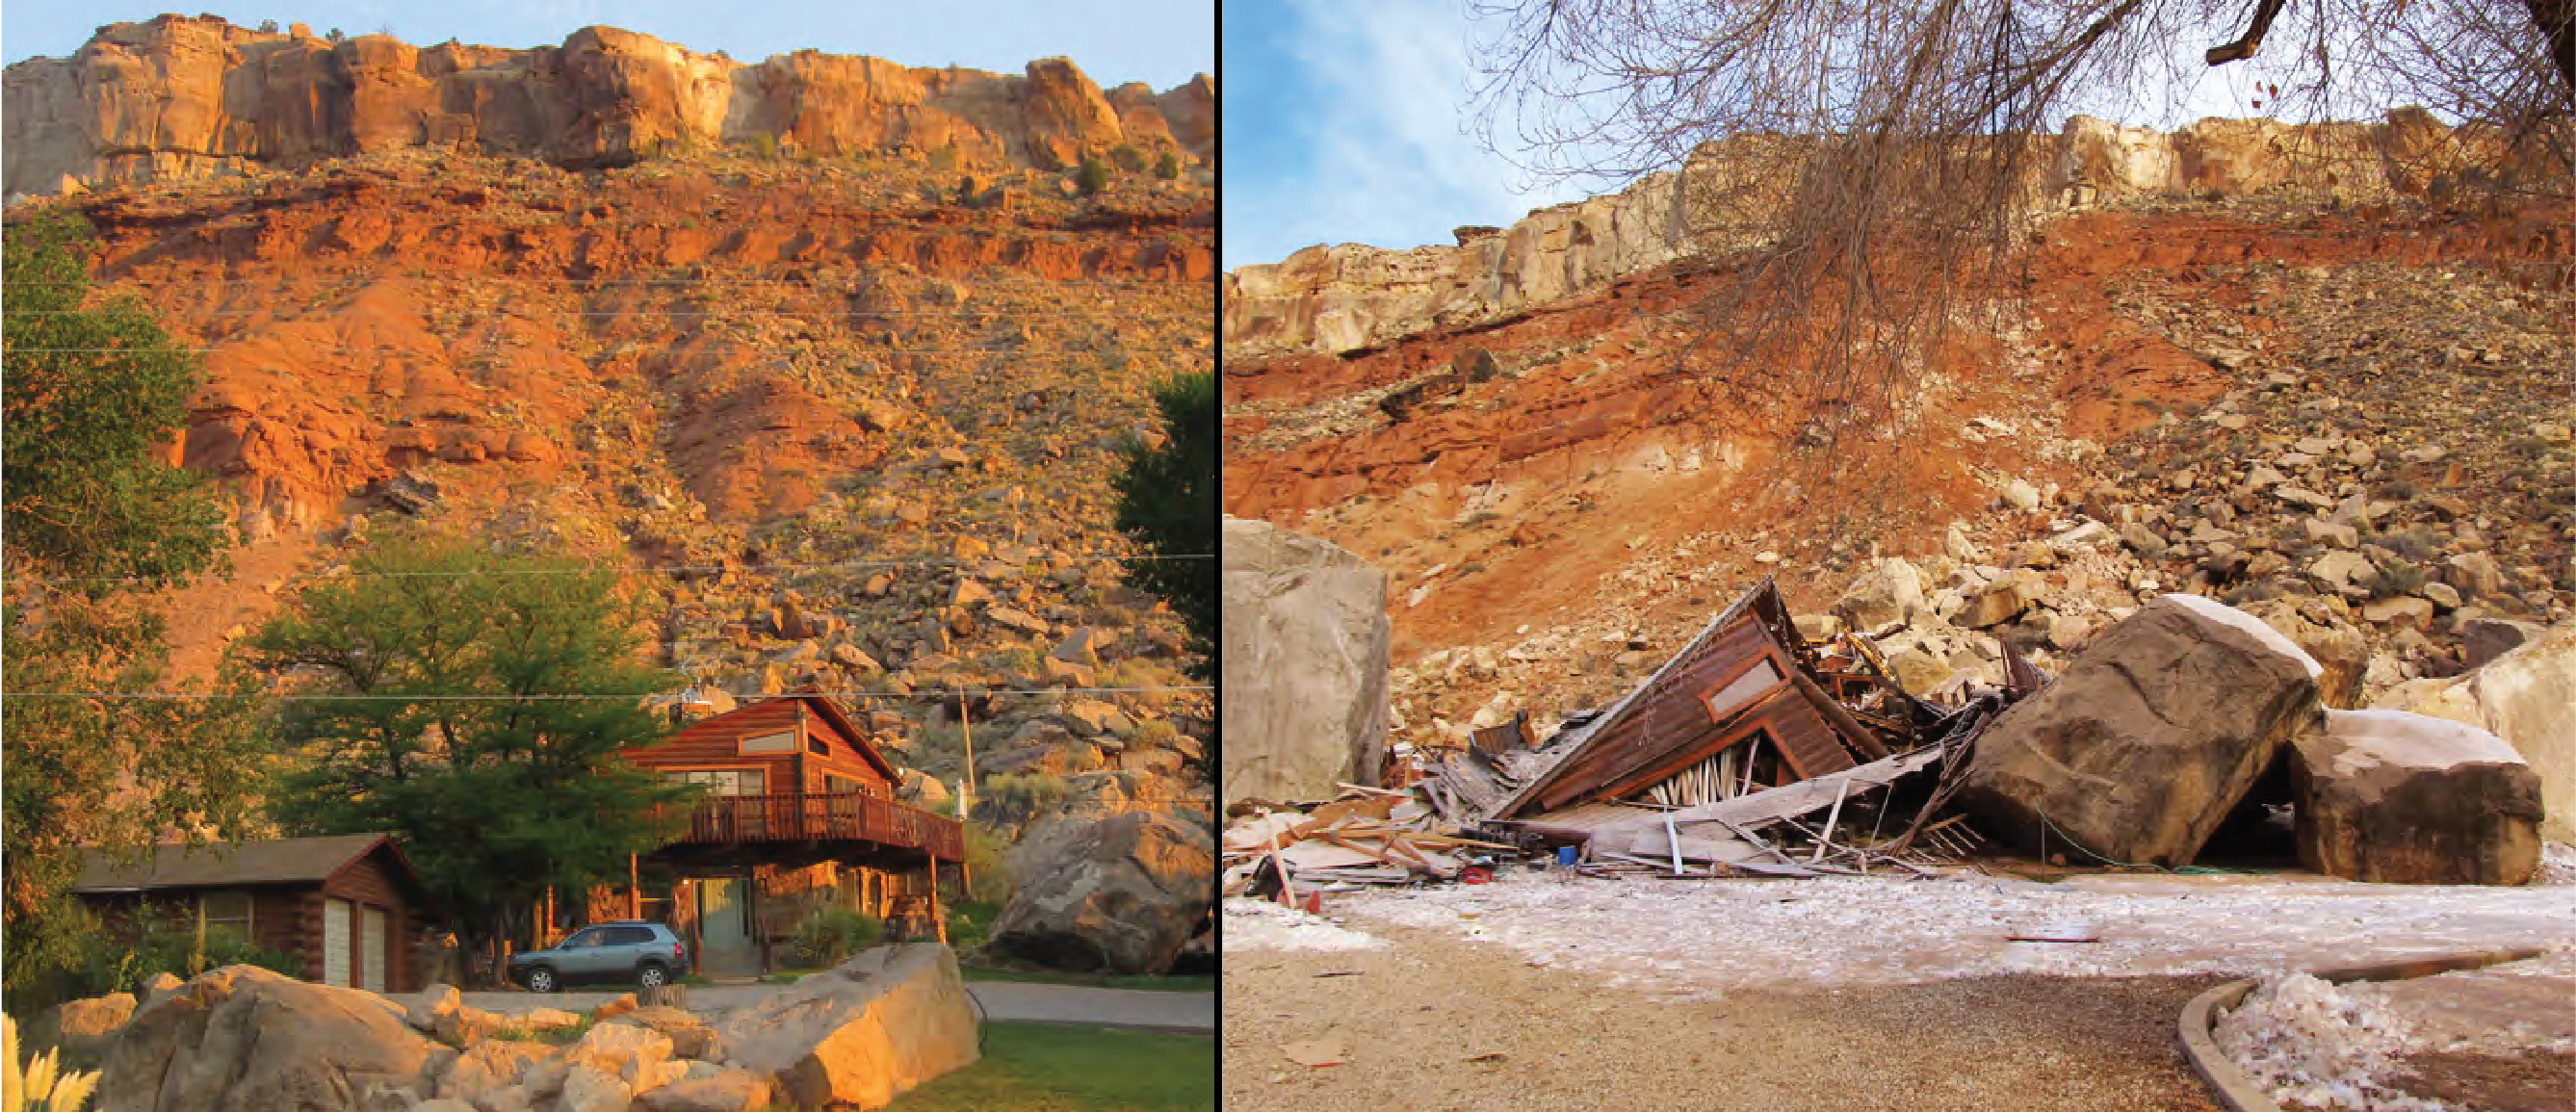
Rockville Rock Fall (2013): Rockville, Utah is a small community near the entrance to Zion National Park. In December of 2013, a 2,700 ton (1,400 yd3) block of Shinarump Conglomerate fell from the Rockville Bench cliff, landed on the steep 35-degree slope below, and shattered into several large pieces that continued downslope at a high speed. These boulders completely destroyed a house located 375 feet below the cliff (see the before and after photographs) and killed two people inside the home. The topographic map shows other rock falls in the area prior to this catastrophic event.
North Salt Lake Slide (2014): In August 2014 after a particularly wet period, a slow moving rotational landslide destroyed one home and damaged nearby tennis courts.
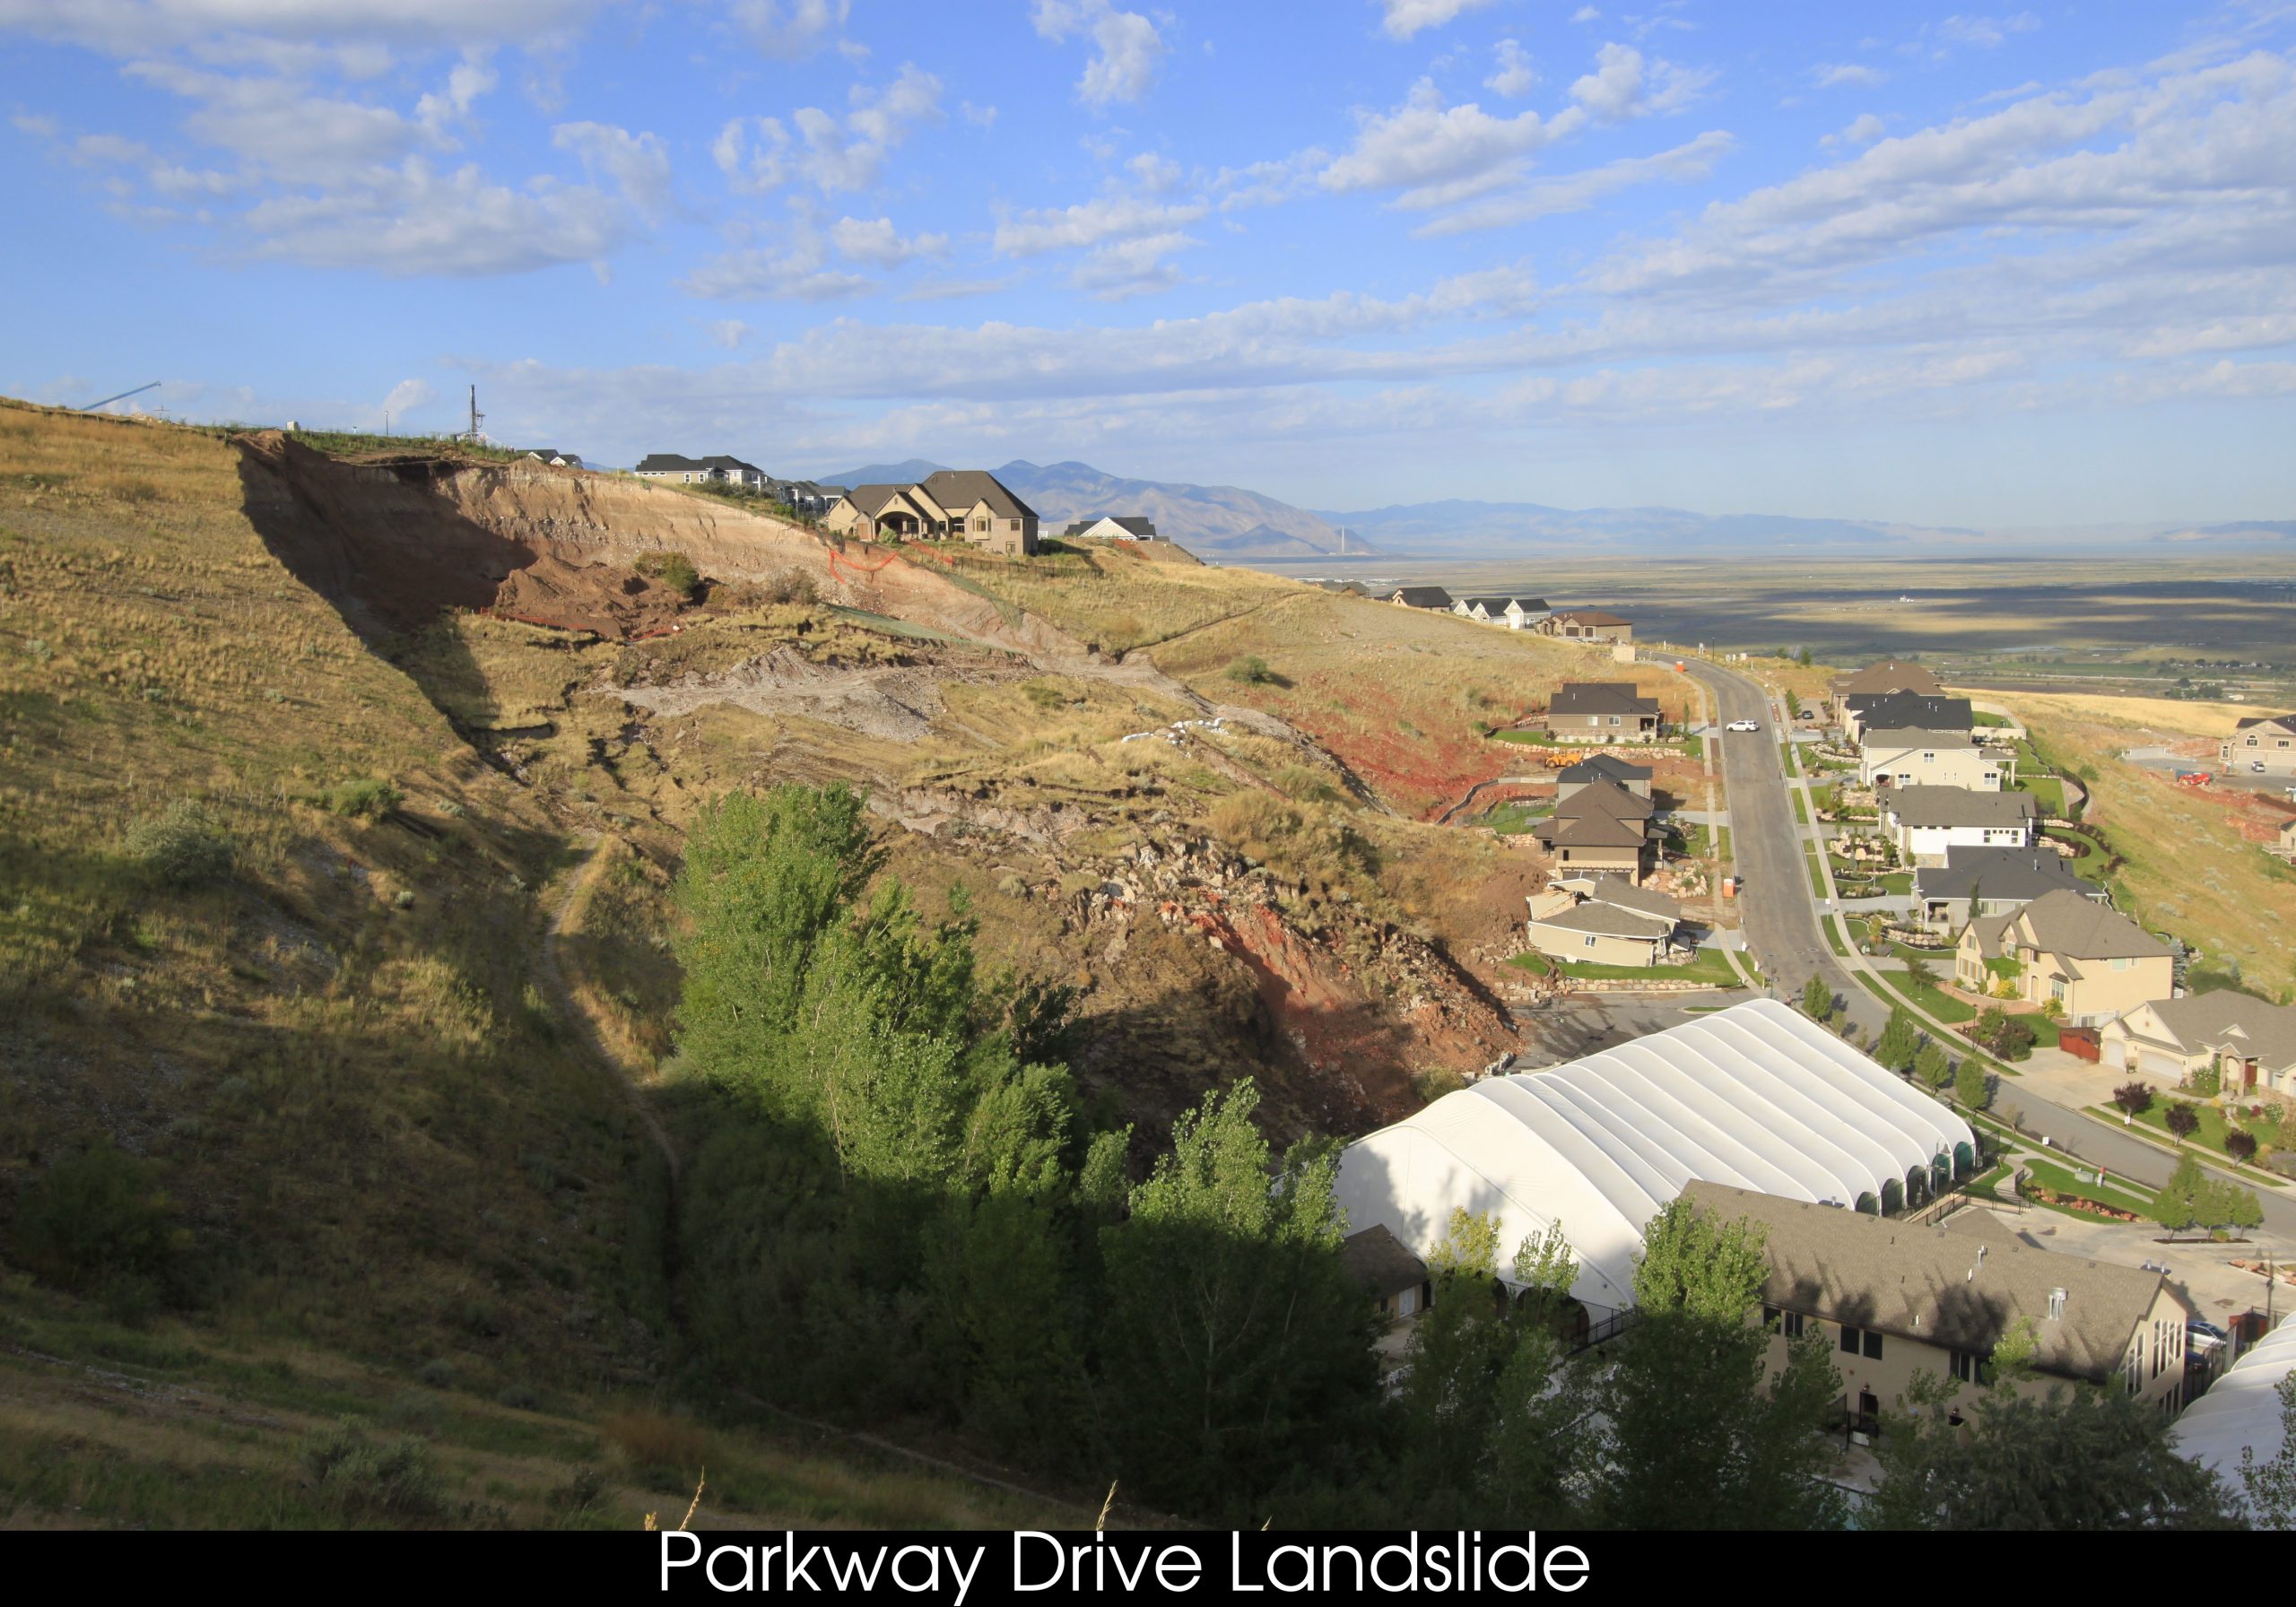
Reports from residents suggested that ground cracks had been seen near the top of the slope at least a year prior to the catastrophic movement. The presence of easily-drained sands and gravels overlying more impermeable clays weathered from volcanic ash, along with recent regrading of the slope, may have been contributing causes of this slide. Local heavy rains seem to have provided the trigger. In the two years after the landslide, the slope has been partially regraded to increase its stability. Unfortunately, in January 2017, parts of the slope have shown reactivation movement. Similarly, in 1996 residents in a nearby subdivision started reporting distress to their homes. This distress continued until 2012 when 18 homes became uninhabitable due to extensive damage and were removed. A geologic park was constructed in the now vacant area.

Video 10.3: North Salt Lake landslide.
If you are using an offline version of this text, access this YouTube video via the QR code.
Bingham Canyon Copper Mine Landslide, Utah (2013): At 9:30 pm on April 10, 2013, more than 65 million cubic meters of steep terraced mine wall slid down into the engineered pit of Bingham Canyon mine, making it one of the largest historic landslides not associated with volcanoes. Radar systems maintained by the mine operator warned of movement of the wall, preventing the loss of life and limiting the loss of property.

Complete this interactive activity to check your understanding.
If you are using an offline version of this text, access this interactive activity via the QR code.

Take this quiz to check your comprehension of this section.
If you are using an offline version of this text, access the quiz for section 10.4 via the QR code.
Summary
Mass wasting is a geologic term describing all downhill rock and soil movement due to gravity. Mass wasting occurs when a slope is too steep to remain stable with existing material and conditions. Loose rock and soil, called regolith, are what typically move during a mass-wasting event. Slope stability is determined by two factors: the angle of the slope and the shear strength of the accumulated materials. Mass-wasting events are triggered by changes that oversteepen slope angles and weaken slope stability, such as rapid snow melt, intense rainfall, earthquake shaking, volcanic eruption, storm waves, stream erosion, and human activities. Excessive precipitation is the most common trigger. Mass-wasting events are classified by their type of movement and material, and they share common morphological surface features. The most common types of mass-wasting events are rockfalls, slides, flows, and creep.
Mass-wasting movement ranges from slow to dangerously rapid. Areas with steep topography and rapid rainfall, such as the California coast, Rocky Mountain Region, and Pacific Northwest, are particularly susceptible to hazardous mass-wasting events. By examining examples and lessons learned from famous mass-wasting events, scientists have a better understanding of how mass-wasting occurs. This knowledge has brought them closer to predicting where and how these potentially hazardous events may occur and how people can be protected.

Take this quiz to check your comprehension of this chapter.
If you are using an offline version of this text, access the quiz for chapter 10 via the QR code.
Text References
- Haugerud, R.A., 2014, Preliminary interpretation of pre-2014 landslide deposits in the vicinity of Oso, Washington: US Geological Survey.
- Highland, L., 2004, Landslide types and processes: pubs.er.usgs.gov.
- Highland, L.M., and Bobrowsky, P., 2008, The Landslide Handbook – A Guide to Understanding Landslide: U.S. Geological Survey USGS Numbered Series 1325, 147 p.
- Highland, L.M., and Schuster, R.L., 2000, Significant landslide events in the United States: United States Geological Survey.
- Hildenbrand, T.G., and Hendricks, J.D., 1995, Geophysical setting of the Reelfoot rift and relations between rift structures and the New Madrid seismic zone: U.S. Geological Survey Professional Paper 1538-E, 36 p.
- Hungr, O., Leroueil, S., and Picarelli, L., 2013, The Varnes classification of landslide types, an update: Landslides, v. 11, no. 2, p. 167–194.
- Jibson, R.W., 2005, Landslide hazards at La Conchita, California: United States Geological Survey Open-File Report 2005-1067.
- Lipman, P.W., and Mullineaux, D.R., 1981, The 1980 eruptions of Mount St. Helens, Washington: US Geological Survey USGS Numbered Series 1250, 844 p., doi: 10.3133/pp1250.
- Lund, W.R., Knudsen, T.R., and Bowman, S.D., 2014, Investigation of the December 12, 2013, Fatal Rock Fall at 368 West Main Street, Rockville, Utah: Utah Geological Survey 273, 24 p.
- United States Forest Service, 2016, A Brief History of the Gros Ventre Slide Geological Site: United States Forest Service.
Figure References
Figure 10.1: Forces on a block on an inclined plane (fg = force of gravity; fn = normal force; fs = shear force). Kindred Grey. 2022. CC BY 4.0. Includes crate by Andrew Doane from Noun Project (Noun Project license).
Figure 10.2: As slope increases, the force of gravity (fg) stays the same and the normal force decreases while the shear force proportionately increases. Kindred Grey. 2022. CC BY 4.0. Includes crate by Andrew Doane from Noun Project (Noun Project license).
Figure 10.3: Angle of repose in a pile of sand. Captain Sprite. 2007. CC BY-SA 2.5. https://en.wikipedia.org/wiki/File:Angleofrepose.png
Figure 10.4: Locations A and B have bedding nearly perpendicular to the slope, making for a relatively stable slope. Location D has bedding nearly parallel to the slope, increasing the risk of slope failure. Location C has bedding nearly horizontal and the stability is relatively intermediate. Kindred Grey. 2022. CC BY 4.0.
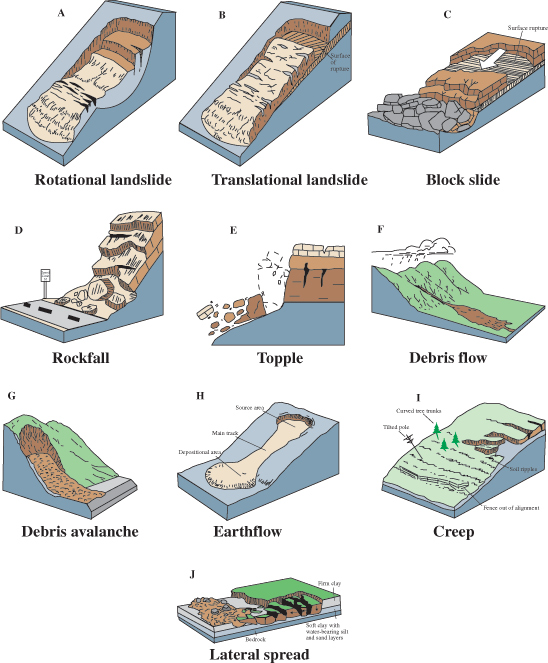
Figure 10.5: Examples of some of the types of landslides. R.L. Schuster, U.S. Geological Survey. 2004. Public domain. https://pubs.usgs.gov/fs/2004/3072/fs-2004-3072.html
Figure 10.6: Scar of the Gros Ventre landslide in background with landslide deposits in the foreground. Daniel Mayer. 2006. CC BY-SA 3.0. https://commons.wikimedia.org/wiki/File:Gros_Venture_Slide.JPG
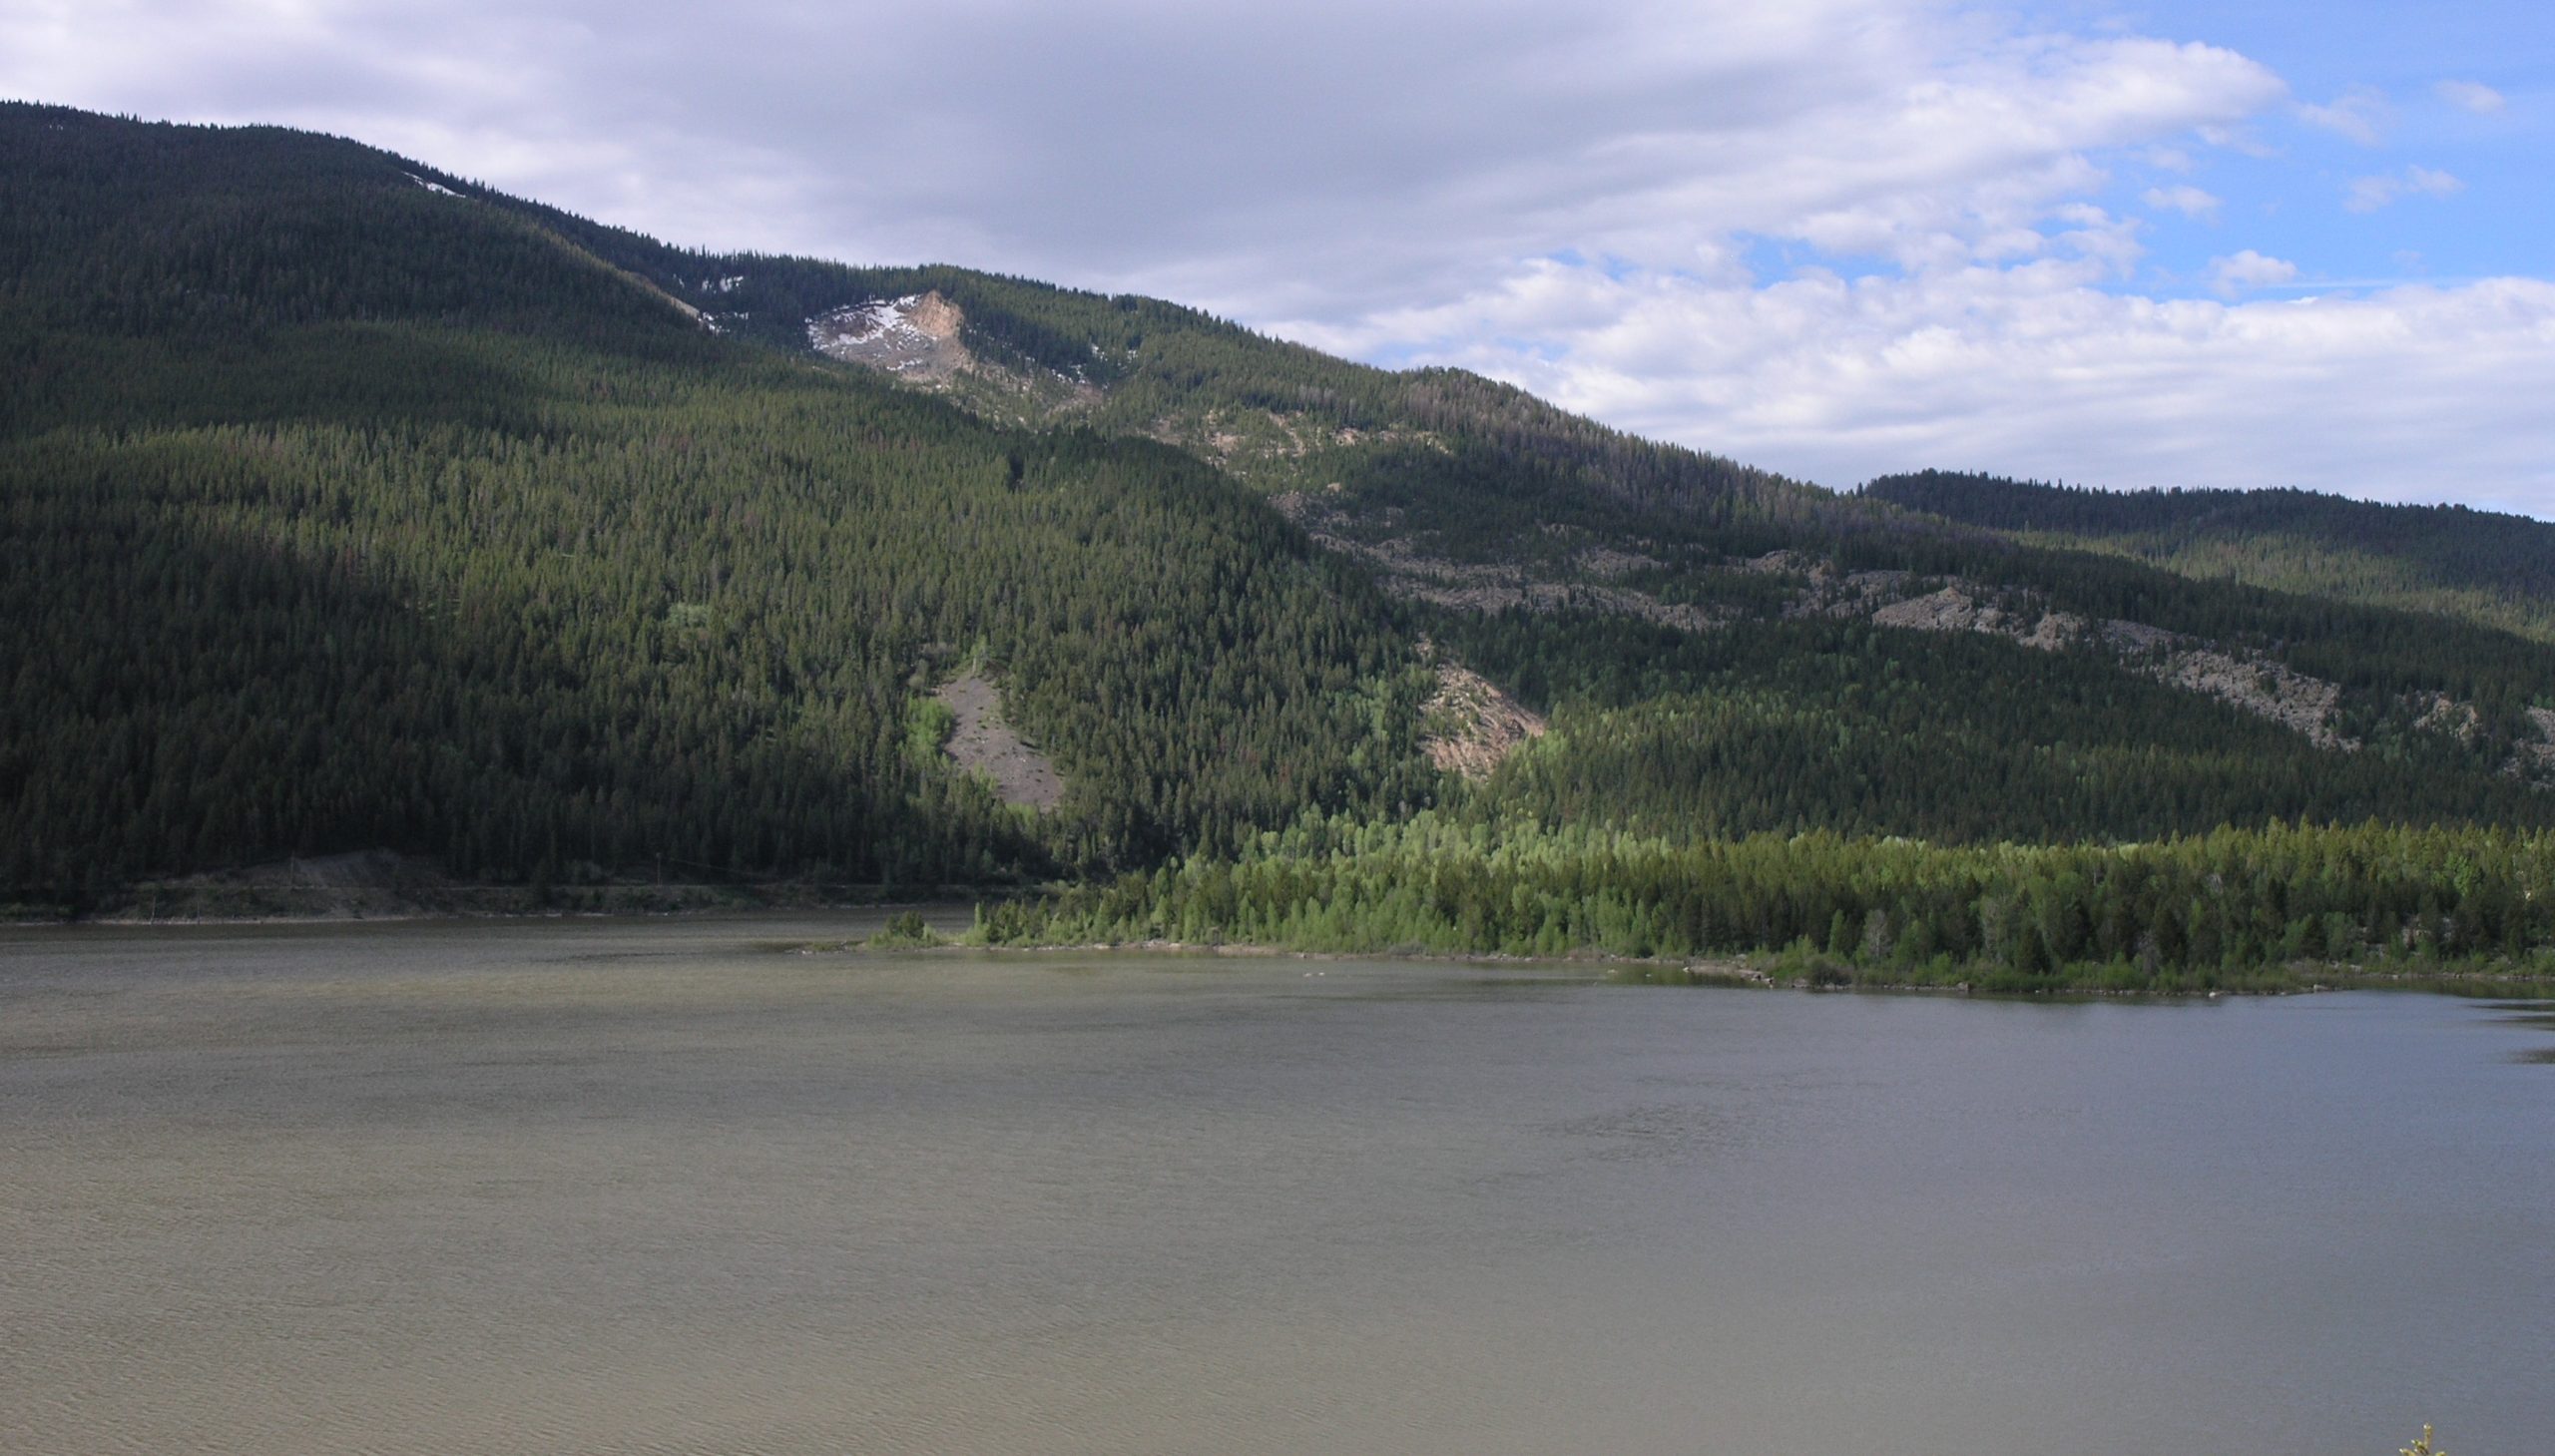
Figure 10.7: Grand Teton National Park showing sedimentary layers parallel with the surface and undercutting (oversteepening) of the slope by the river. Daniel Mayer. 2006. CC BY-SA 3.0. https://commons.wikimedia.org/wiki/File:Lower_Slide_Lake.JPG
Figure 10.8: Road damage from the August 1959 Hebgen Lake (Montana-Yellowstone) earthquake. R.B. Colton via USGS. 1959. Public domain. https://commons.wikimedia.org/wiki/File:Roaddamage59quake.JPG
Figure 10.9: Oblique LIDAR image of La Conchita after the 2005 landslide. Todd Stennett via USGS. 2016. Public domain. https://www.usgs.gov/media/images/la-conchita
Figure 10.10: 1995 La Conchita slide. USGS. 2005. Public domain. https://commons.wikimedia.org/wiki/File:Laconchita1995landslide.jpg
Figure 10.11: 2014 Oso slide in Washington killed 43 people and buried many homes. Mark Reid, USGS. 2014. Public domain. https://commons.wikimedia.org/wiki/File:Oso_Landslide_aerial.jpg
Figure 10.12: Annotated Lidar map of 2014 Oso slide in Washington. USGS. 2014. Public domain. https://commons.wikimedia.org/wiki/File:Oso_landslide_geomorphology_map.png
Figure 10.13: Approximate extent of Markagunt gravity slide. Used under fair use from THE EARLY MIOCENE MARKAGUNT MEGABRECCIA: UTAH’S LARGEST CATASTROPHIC LANDSLIDE by Robert F. Biek. https://geology.utah.gov/map-pub/survey-notes/the-early-miocene-markagunt-megabreccia/
Figure 10.14: The 1983 Thistle landslide (foreground) dammed the Spanish Fork river creating a lake. R.L. Schuster, U.S. Geological Survey. 1983. Public domain. https://en.wikipedia.org/wiki/File:Thistlelandslideusgs.jpg
Figure 10.15: House before and after destruction from 2013 Rockville rockfall. Used under fair use from INVESTIGATION OF THE DECEMBER 12, 2013,FATAL ROCK FALL AT 368 WEST MAIN STREET, ROCKVILLE, UTAH by William R. Lund, Tyler R. Knudsen, and Steve D. Bowman. https://ugspub.nr.utah.gov/publications/reports_of_investigations/ri-273.pdf
Figure 10.16: Scarp and displaced material from the North Salt Lake (Parkview) slide of 2014. Used under fair use from PARKWAY DRIVE LANDSLIDE, NORTH SALT LAKE. https://geology.utah.gov/hazards/landslides/parkway_drive_landslide/
Any downhill movement of material, caused by gravity.
General term for sudden material falling (sliding) down a slope due to gravity.
A type of non-eroded sediment mixed with organic matter, used by plants. Many essential elements for life, like nitrogen, are delivered to organisms via the soil.
Term for the underlying lithified rocks that make up the geologic record in an area. This term can sometimes refer to only the deeper, crystalline (non-layered) rocks.
Detached, free-falling rocks from very steep slopes.
A mixture of coarse material and water, channeled and flowing downhill rapidly.
Stress within an object that causes a side-to-side movement within an internal fabric or weakness.
Component of the gravitational force which pushes material downslope.
Component of the gravitational force which holds material on a slope.
The relationship between shear force and normal force in a block of material on a slope. When shear force is greater than normal force, mass wasting can occur.
Slope angle where shear forces and normal forces are equal.
The average diameter of a grain of sediment, ranging from small, also known as fine-grained (e.g. clay, silt) to large, also known as coarse-grained (e.g. boulder).
The mineral makeup of a rock, i.e. which minerals are found within a rock.
Empty space in a geologic material, either within sediments, or within rocks. Can be filled by air, water, or hydrocarbons.
Pieces of rock that have been weathered and possibly eroded.
Discernible layers of rock, typically from a sedimentary rock.
A volcanic rock with medium silica composition, equally rich in felsic minerals (feldspar) and mafic minerals (amphibole, biotite, pyroxene). Intermediate rocks are grey in color and contain somewhat equal amounts of minerals that are light and dark in color. Primary intermediate rocks are andesite (extrusive) and diorite (intrusive).
A natural substance that is typically solid, has a crystalline structure, and is typically formed by inorganic processes. Minerals are the building blocks of most rocks.
A very fine-grained rock with very thin layering (fissile).
A solution that has the maximum allowed dissolved component, and is unable to dissolve more.
An event that causes a landslide event. Water is a common trigger.
Place where lava is erupted at the surface.
The transport and movement of weathered sediments.
A sequence of layers in which the sediment changes linearly in size, either getting coarser or finer.
The act of a solid coming out of solution, typically resulting from a drop in temperature or a decrease of the dissolving material.
A channelled body of water.
Water that flows over the surface.
Water that works its way down into the subsurface.
A slope, that by natural or human activity, becomes steeper than the angle of repose.
An exposed part of a craton.
Loose blocks of rock that fall down from steep surfaces and cover slopes.
A landslide that moves along an internal plane of weakness.
A slow and steady movement. Can occur as part of faults, mass wasting, and grain movement.
A break within a rock that has no relative movement between the sides. Caused by cooling, pressure release, tectonic forces, etc.
The physical breakdown (weathering) of bedrock by processes such as pressure, ice expansion, etc.
Movement of regolith along a curved slip plane.
Plastic moving, fine-grained type of flow.
Large and mysterious landslides that travel for long distances.
Ridges of sediment that form perpendicular to flow in the lower part of the lower flow regime.
Very slow movement of the soil downhill.
The measure of degrees north or south from the equator, which has a latitude of 0 degrees. The Earth's north and south poles have latitudes of 90 degrees north and south, respectively.
Sediment gathering together and collecting, typically in a topographic low point.
The act of gathering new information from the senses or from a scientific instrument.
Amount of movement during a faulting event.
Place where fault movement cuts the surface of the Earth.
Stresses that pull objects apart into a larger surface area or volume; stretching forces.
The area within a topographic basin or drainage divide in which water collects.
A rock primarily made of sand.
A measure of earthquake strength. Scales include Richter and Moment.
A planar alignment of minerals and textures within a rock.
Rocks formed via heat and/or pressure which change the minerals within the rock.
A type of volcanic mudslide, in which rain or snowmelt accumulates volcanic ash of the slopes of steep volcanoes or other mountains and then wash downhill, causing damaging flooding.
Water that is below the surface.
A unit of the geologic time scale; smaller than an era, larger than an epoch. We are currently in the Quaternary period.
The theory that the outer layer of the Earth (the lithosphere) is broken in several plates, and these plates move relative to one another, causing the major topographic features of Earth (e.g. mountains, oceans) and most earthquakes and volcanoes.
Force applied to an object, typically dealing with forces within the Earth.
A type of mechanical weathering in which outer layers of rock, approximately parallel to the surface, fracture off.
A process where water freezes inside cracks in rocks, causing expansion and mechanical weathering.
General name of a felsic rock that is intrusive. Has more felsic minerals than mafic minerals.
A sedimentary rock with rounded, larger (≥2 mm) clasts.
Planar feature where two blocks of bedrock move past each other via earthquakes.
A narrow igneous intrusion that cuts through existing rock, not along bedding planes.
Large igneous intrusion that is wedged between sedimentary layers, bulging upwards. Called a lopolith if bulging downward.
Rocks that are formed from liquid rock, i.e. from volcanic processes.
Volcanic tephra that is less than 2 mm in diameter.
Place where material is extracted from the Earth for human use.
Loose material that is a mixture of soil components and weathered bedrock sediments.
