Chapter 2: Soils and Nutrient Management
Chapter Contents:
Soil is formed when rock (parent material) is broken down by climate and vegetation over a period of time. Soil is weathered rock fragments and decaying remains of plants and animals (organic matter). It also contains varying amounts of air, water, and microorganisms. It furnishes mechanical support and nutrients for growing plants.
Components of Soil
A desirable surface soil in good condition for plant growth contains approximately 50% solid material and 50% open pore space. Most of the soil solids are a mineral component, which is usually made up of many different kinds and sizes of particles, ranging from those visible to the unaided eye to particles so small that they can only be seen with the aid of a very powerful (electron) microscope. This mineral material comprises about 45% to 48% of the total volume. Organic matter makes up about 2% to 5% of the volume and may contain both plant and animal material in varying stages of decomposition. Under ideal or near-ideal moisture conditions for growing plants, soil pore spaces contain about 25% air and 25% water based on the total volume of soil.![]()
The percentage of mineral matter and organic matter in a cubic foot of surface soil varies from one soil to another and within the same soil, depending on the kinds of crops grown, frequency of tillage, and wetness or drainage of the soil. Content of organic matter will usually be high in soils that have not been cultivated over long periods of time. Soils that are tilled frequently and have relatively small amounts of plant residues worked into the soil are usually low in organic matter. Plowing and tilling the soil increases the amount of air in the soil, which increases the rate of organic matter decomposition. Soils with poor drainage or high water tables usually have a higher organic matter content than those that are well drained, because water excludes air from the soil mass.
Since either air or water fills pore spaces, the amount of air in a soil at a particular time depends on the amount of water present in the pore spaces. Immediately after a rain, there is more water and less air in the pore spaces. Conversely, in dry periods, a soil contains more air and less water. Increasing organic matter content usually increases water-holding capacity, but adding large amounts of undecomposed organic material reduces water-holding capacity until the material has partially decomposed.
Organic Matter
Organic matter in soil consists of the remains of plants and animals. When temperature and moisture conditions are favorable in the soil, earthworms, insects, bacteria, fungi, and other types of plants and animals use the organic matter as food, breaking it down into humus (the portion of organic matter that remains after most decomposition has taken place) and soil nutrients. Through this process, materials are made available for use by growing plants.
The digested and decomposing organic material also helps develop good air-water relationships. In very sandy soil, organic material occupies some of the space between the sand grains, binding them together, and increasing water-holding capacity. In a finely textured soil (e.g., loam, clay loam), organic material creates aggregates of the fine soil particles, allowing water to move more rapidly around these larger particles. This grouping of the soil particles into aggregates, or peds, makes it easier to work.
Organic matter content depends primarily on the kinds of plants that have been growing in a soil, the long-term management practices, temperature, and drainage. Soils that have native grass cover for long periods usually have a relatively high organic matter content in the surface area. Those that have native forest cover usually have relatively low organic matter content. In either case, if the plants are grown on a soil that is poorly drained, the organic matter content is usually higher than where the same plants are grown on a well-drained soil. This is due to differences in available oxygen and other substances needed by the organisms that attack and decompose the organic material. Soils in a cool climate often have more organic matter than those in a warm climate.
Water and Air
All water in the soil ultimately comes from precipitation (rain, snow, hail, or sleet), entering the soil through cracks, holes, and openings between the soil particles. As the water enters, it pushes the air out. Oxygen is taken up by plant roots for respiration. If air is unavailable for too long, the roots will die.
Some water is used by plants, some is lost by evaporation, and some moves so deep into the soil that plant roots cannot reach it. If it rains very hard or for a long time, some of the water is lost through run-off.
When organic matter decomposes in the soil, it gives off carbon dioxide. This carbon dioxide replaces some of the oxygen in the soil pores. As a result, soil air contains less oxygen and more carbon dioxide than the air above the soil surface.
Carbon dioxide is dissolved by water in the soil to form a weak acid. This solution reacts with the minerals in the soil to form compounds that can be taken up and used as nutrients by the plants.
Table 2-1: A Guide for Estimating Moisture Content of Soil
Adapted from: Craig, C.L. 1976. "Strawberry Culture in Eastern Canada." Agric. Canada Publication 1585:19. Observations based on soil sample from 4 to 6 inch depth. For an explanation of sand, silt, loam, and clay, see "Texture" under "Physical Properties of Soil" below.
| % of Field Capacity | Adequacy of Soil Moisture for Plant Growth | Response to Physical Manipulation: Loamy sand, sandy loam | Response to Physical Manipulation: Silt loam, loam | Response to Physical Manipulation: Silty clay loam |
|---|---|---|---|---|
| 100 plus | Saturated soil - too much moisture and too little air in the soil; can damage plants if this condition persists | Free water appears on soil when squeezed | Same as sandy loam | Same as sandy loam |
| 100 | Excess moisture has drained into subsoil after rainfall or irrigation and optimum amounts are available in the root zone for plant growth | When squeezed, no free water appears on the surface, but it leaves a wet outline on your hand. Forms weak ball; usually breaks when bounced in hand, will not stick |
Same as sandy loam. Forms a very pliable ball; sticks readily |
Same as sandy loam. Ribbons out (can be formed into a thin strand when rolled between thumb and forefinger), has a slick feeling. |
| 75 | Adequate moisture for plant growth. (As field capacity drops below 75%, it reaches marginal moisture for plant growth.) | Tends to ball under pressure, but breaks easily when bounced in hand | Forms a ball, somewhat plastic, sticks slightly with pressure | Forms a ball, ribbons out between thumb and forefinger, has slick feeling. |
| 50 | Inadequate moisture for plant growth | Appears too dry; will not form a ball with pressure | Somewhat crumbly, but holds together with pressure | Somewhat pliable, balls under pressure |
| 25 | Moisture in soil unavailable for plant growth | Dry, loose, falls through fingers | Powdery, sometimes crusty, but easily broken down into a powdery condition | Hard, cracked, difficult to break down to powdery condition |
Plant Nutrients
Plants need 16 elements for normal growth. Carbon, hydrogen, and oxygen (which come from air and water) and nitrogen (which is in the soil) make up 95% of plant solids. Although the atmosphere is 78% nitrogen, it is unavailable for plant use. However, certain bacteria that live in nodules on the roots of legumes are able to fix (convert) nitrogen from the air into a form available to plants.
The other 12 essential elements are phosphorus, potassium, calcium, magnesium, sulphur, iron, copper, manganese, zinc, boron, chlorine, and molybdenum. These elements come from the soil. With the exception of phosphorus, potassium, calcium, and magnesium, there is usually a large enough quantity of each of these elements in the soil for cultivation of crops.
Table 2-2: Macronutrient Elements
| Element | Symbol | Chemical form most frequently absorbed |
|---|---|---|
| Carbon | C | |
| Hydrogen | H | |
| Oxygen | O | O2 |
| Nitrogen | N | NO3- NH4+ |
| Potassium | K | K+ |
| Calcium | Ca | Ca++ |
| Phosphorus | P | H2PO4- HPO4+ |
| Magnesium | Mg | Mg++ |
| Sulfur | S | SO4+ |
Table 2-3: Micronutrient Elements
| Element | Symbol | Chemical form most frequently absorbed |
|---|---|---|
| Molybdenum | Mo | MoO42- |
| Copper | Cu | Cu+ Cu++ |
| Zinc | Zn | Zn++ |
| Manganese | Mn | Mn++ |
| Iron | Fe | Fe++ Fe+++ |
| Boron | B | BO3- B4O7- |
| Chlorine | Cl | Cl- |
Soil Horizons
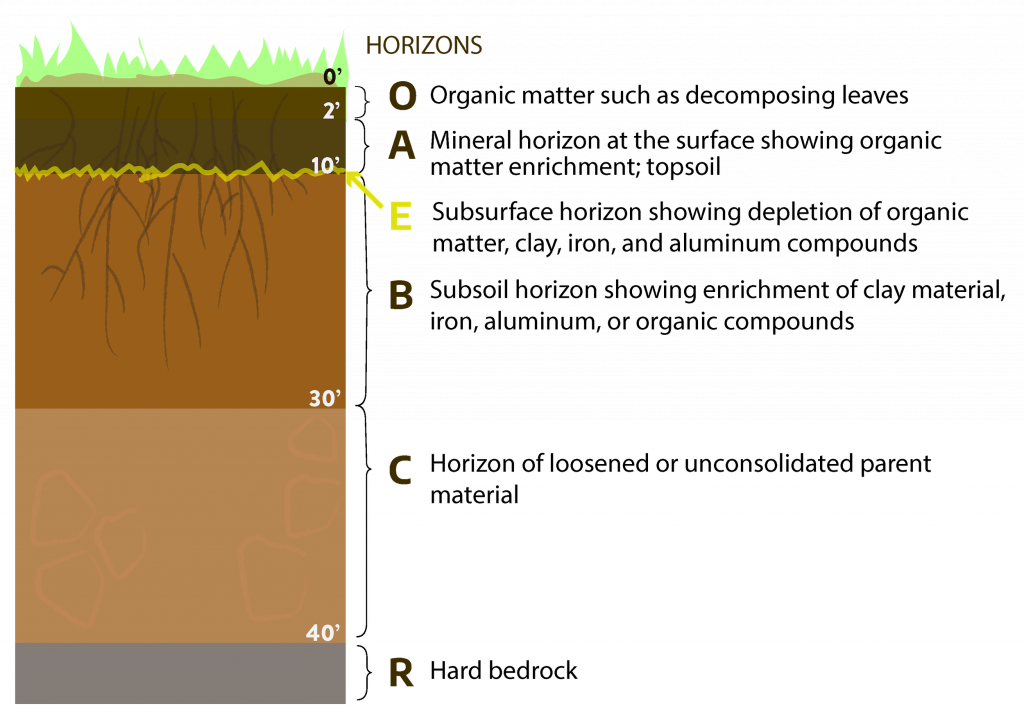
Most soils have four distinct principal layers or horizons. Each layer can have two or more sub-horizons. The principal horizons (collectively called the soil profile) are: O – leaf litter, A – surface soil or topsoil, E – the subsurface, and B – the subsoil. Beneath the soil profile lies: C – the parent material, and R -rock, similar to that from which the soil developed. Horizons usually differ in color, texture, consistency, and structure. In addition, there are usually considerable differences in chemical characteristics or composition.
The surface horizon and subsurface are usually the coarsest layers. The surface soil contains more organic matter than the other soil layers. Organic matter gives a gray, dark-brown, or black color to the surface horizon, the color imparted depending largely upon the amount of organic matter present. Soils that are highest in organic matter usually have the darkest surface colors. The surface layer is usually most fertile and has the greatest concentration of plant roots; plants obtain much of their nutrients and water from the surface soil.
The subsoil layer is usually finer and firmer than the surface soil. Organic matter content of the subsoil is usually much lower than that of the surface layer. Subsoil colors are strong and bright; shades of red, brown, and yellow are frequently observed. The subsoil supports the surface soil and may be considered the soil reservoir, providing storage space for water and nutrients for plants, aiding in temperature regulation of the soil, and supplying air for the roots of plants.
The bottom horizon, or parent material, is decomposed rock that has acquired some characteristics of the subsoil and retained some characteristics of the rock from which it weathered. It is not hard, like rock, but may show the form or structure of the original rocks or layering if it is in a water-laid deposit. The parent material influences soil texture, natural fertility, rate of decomposition (and thus rate of soil formation), acidity, depth, and in some cases, topography (or lay of the land) on which the soil is formed.
Physical Properties of Soils
There are physical, chemical, and biological aspects of soil. The physical properties of soil are those characteristics which can be seen with the eye or felt between the thumb and fingers. They are the result of soil parent materials being acted upon by climatic factors (such as rainfall and temperature), and affected by topography (slope and direction, or aspect) and vegetation (kind and amount, such as forest or grass) over a period of time. A change in any one of these influences usually results in a difference in the type of soil formed. Important physical properties of a soil are color, texture, structure, drainage, depth, and surface features (stoniness, slope, and erosion).
Both the physical properties and chemical composition largely determine the suitability of a soil for its planned use and the management requirements to keep it most productive. Soil physical properties usually control the suitability of soil as growth medium; chemical composition is also important in determining fertility (the ability of soil to sustain plant growth).
Color
When soil is examined, color is one of the first things noticed. It indicates extremely important soil conditions. It can indicate if soil is dry or saturated or if there are excess minerals; for example, clay soils contain an excess of iron oxide that gives them a red color. In general, soil color is determined by: (1) organic matter content, (2) drainage conditions, and (3) degree of oxidation (extent of weathering).
Surface soil colors vary from almost white, through shades of brown and gray, to black. Light colors indicate a low organic matter content and dark colors can indicate a high content. Light or pale colors in the surface soil are frequently associated with relatively coarse texture, highly leached conditions, and high annual temperatures. Dark colors may result from high water table conditions (poor drainage), low annual temperatures, or other influences that induce high organic matter content and, at the same time, slow the oxidation of organic materials. However, soil coloration may be due to the colors imparted by the parent material. Shades of red or yellow, particularly where associated with relatively fine textures, usually indicate that subsoil material has been incorporated in the surface layer.
Subsoil colors, in general, are indications of air, water, and soil relationships and the degree of oxidation of certain minerals in the soil. Red and brown subsoil colors indicate relatively free movement of air and water allowed by the soil. If these or other bright colors persist throughout the subsoil, aeration is favorable. Some well-aerated subsoils will appear mottled (have mixed colors), in shades of red and brown.
Yellow-colored subsoils usually indicate some drainage impediment. Most mottled subsoils, especially those where gray predominates, have too much water and too little air (oxygen) much of the time. The red-to-brown color of subsoils comes from iron coatings under well-aerated conditions. In wet soils with low oxygen levels, the iron coatings are chemically and biologically removed, and the gray color of background soil minerals shows.
Drainage
Soil drainage is defined as the rate and extent of water movement in the soil, including movement across the surface as well as downward through the soil. Slope is a very important factor in soil drainage. Other factors include texture, structure, and physical condition of surface and subsoil layers. Soil drainage is indicated by soil color.
Clear, bright subsoil colors indicate well-drained soils. Mixed, drab, and dominantly gray colors indicate imperfection in drainage. Low-lying areas within the landscape receive run-off water. Frequently, the water from these areas must escape by lateral movement through the soil or by evaporation from the surface, as poor structure and other physical influences do not allow drainage.
Too much or too little water in the soil is equally undesirable. With too much water, most plants will suffocate. Where there is too little water, plants will wilt and eventually die. The most desirable soil moisture situation is one in which approximately 1/2 of the pore space of the surface soil is occupied by water.
Texture
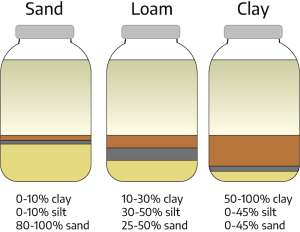
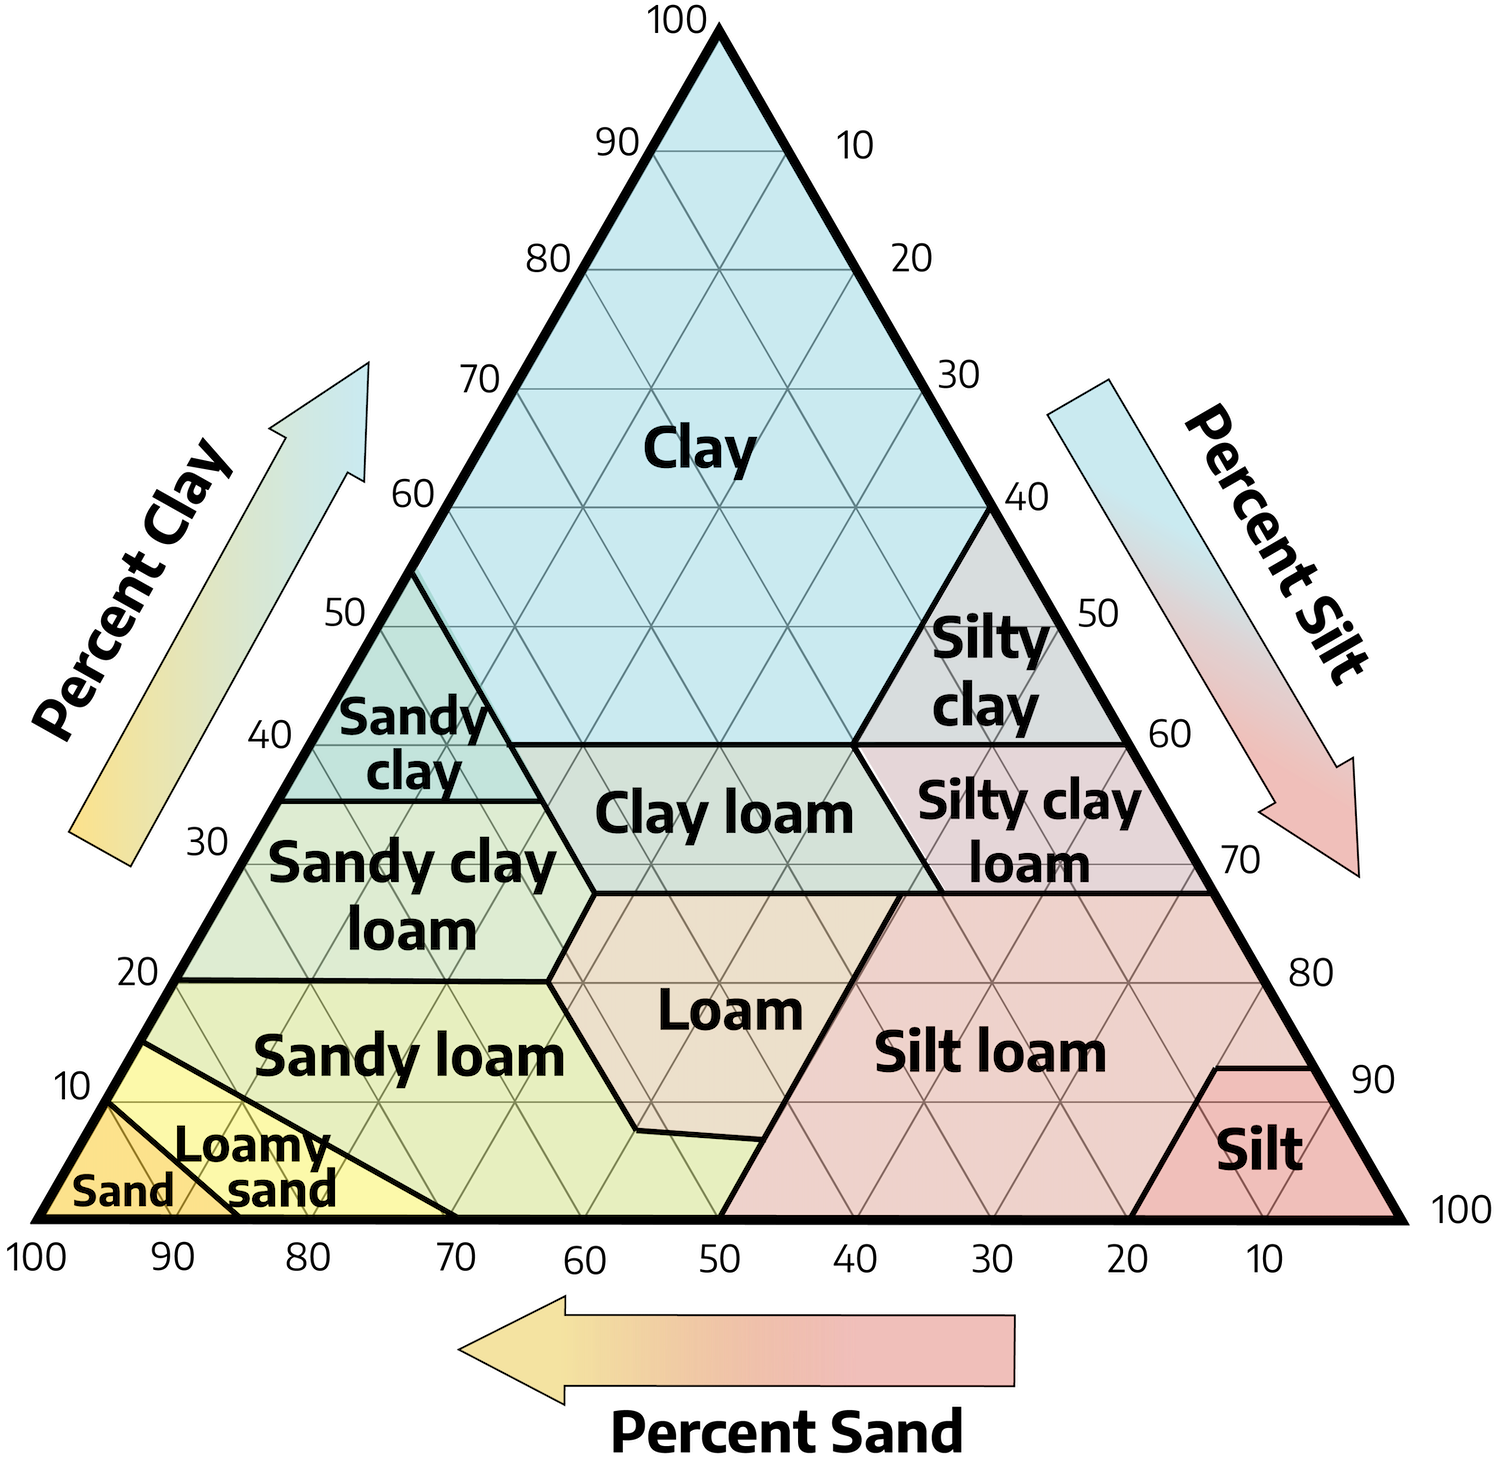
Texture refers to the relative amounts of differently sized soil particles (i.e., percent sand, silt, and clay), or the fineness/coarseness of the mineral particles in the soil. In each texture class, there is a range in the amount of sand, silt, and clay that class contains.
Sand is the coarser mineral particles of the soil. These particles vary in size. Most sand particles can be seen without a magnifying glass. All feel rough when rubbed between the thumb and fingers.
Silt are relatively fine soil particles that feel smooth and floury. When wet, silt feels smooth but is not slick or sticky. When dry, it is smooth, and if pressed between the thumb and finger, will retain the imprint. Silt particles are so fine that they cannot usually be seen by the unaided eye and are best seen with a microscope.
Clays are the finest soil particles. Clay particles can be seen only with the aid of a very powerful (electron) microscope. They feel extremely smooth when dry, and become slick and sticky when wet. Clay will hold the form into which it is molded.
Loam is a textural class of soil that has moderate amounts of sand, silt, and clay. Loam contains approximately 7% to 27% clay, 28% to 50% silt, and 23% to 50% sand. Loams are desirable for plant growth.
Determining soil texture
Soil texture (the proportions of sand, silt, and clay particles) can be accurately determined by a lab. A fairly good estimate can be made at home, however, using the texture-by-feel method. The first part of this test determines the amount of clay in your soil. Take a small amount of soil from your representative sample, moisten it, and knead it into a smooth, walnut-sized ball in your hand. If it is impossible to form a ball, it is a sand soil. Using your thumb, gently push a ribbon of soil of even thickness out between your thumb and crooked forefinger. A loamy sand soil will form no ribbon at all. A ribbon less than 1 inch indicates a loam, 1 to 2 inches, a clay loam, and more than 2 inches, a clay soil.
The second part of the test will further qualify the soil texture as sandy or silty, if necessary. Take a pinch of soil, place it in your palm, and thoroughly wet it. Rub your finger in the soil and note if it feels very smooth and floury (silty), very gritty (sandy), or equally smooth and gritty (no further qualification of the texture you determined in the first part of the test is needed). For example, if your soil forms a 1.5 inch ribbon (a clay loam), and feels very smooth and floury in the second part of the test (silty), then your soil texture is a silty clay loam.
Although there are approximately 20 classes of soil texture, most surface soils in Virginia fall into five general textural classes. Each class name indicates the size of the mineral particles that are dominant in the soil. Texture is determined in the field by rubbing moist-to-wet soil between the thumb and fingers. These observations can be checked in the laboratory by mechanical analysis or by separation into clay, silt, and various sized sand groups. Regardless of textural class, all soils in Virginia contain sand, silt, and clay, although the amount of a particular particle class may be small.
Principal soil classes found in Virginia:
- Loam – When rubbed between the thumb and fingers, approximately equal influence of sand, silt, and clay is felt.
- Sandy loam – Varies from very fine loam to very coarse. Feels quite sandy or rough, but contains some silt and a small amount of clay. The amount of silt and clay is sufficient to hold the soil together when moist.
- Silt loam – Silt is the dominant particle in silt loam, which feels quite smooth or floury when rubbed between the thumb and fingers.
- Silty clay loam – Noticeable amounts of both silt and clay are present in silty clay loam, but silt is a dominant part of the soil. It is smooth to the touch when dry, but when moist, it becomes somewhat slick/sticky.
- Clay loam – Clay dominates a clay loam, which is smooth when dry and slick/sticky when wet. Silt and sand are usually present in noticeable amounts in this texture of soil, but are overshadowed by clay.
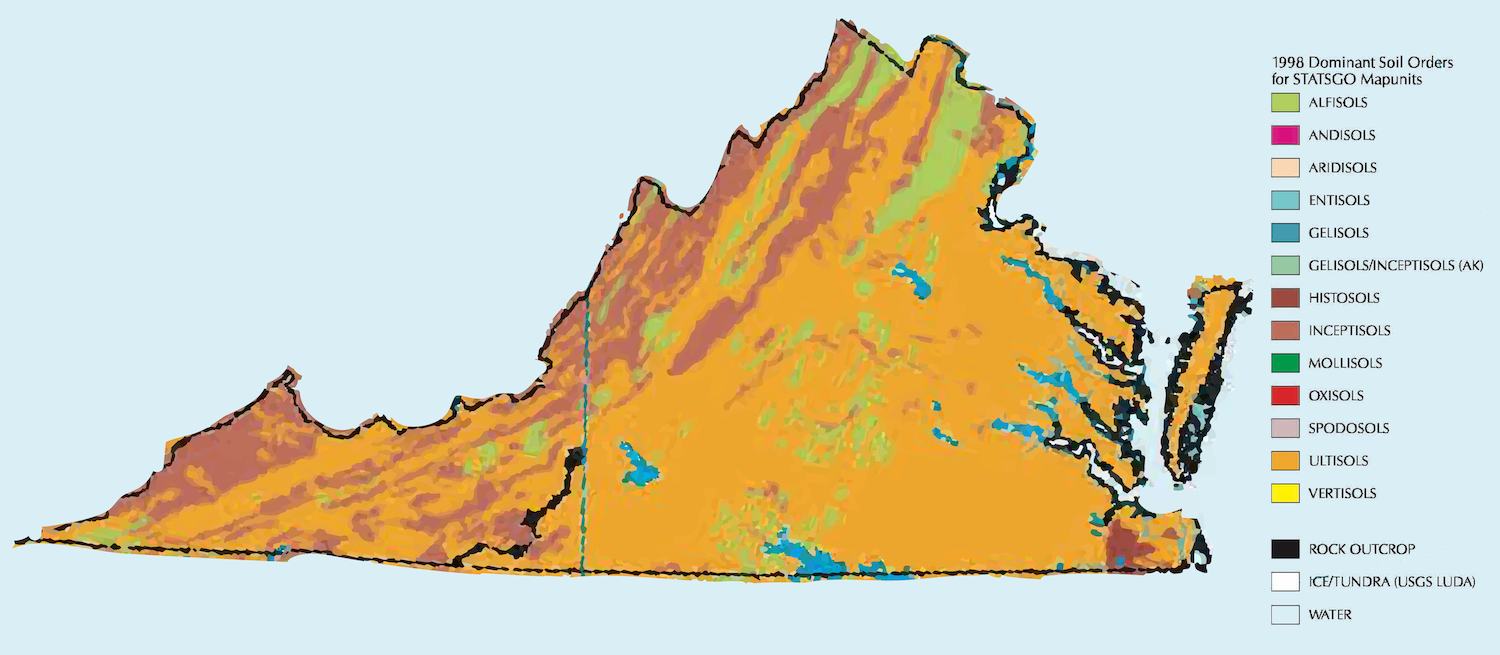
Soil orders found in Virginia
Soil orders are based on two or more physical or chemical characteristics that differentiate them from one another. Soil surveys of the state’s naturally occurring soils indicate 7 of the 12 USDA, NRCS soil orders are prevalent throughout the state. These are in the order of occurrence in Virginia by percentage:
- Ultisols (last formed) are highly weathered and strongly leached, infertile mineral soils with significant subsoil clay accumulation that formed under deciduous, coniferous, or mixed forest and woodland vegetation. Farming, silvopasture, and silviculture requires inputs of lime and fertilizer.
- Alfisols are moderately leached soils with significant subsoil clay accumulation and relatively high natural fertility. These soils have mainly formed under forest and have a subsurface horizon in which clays have accumulated. The higher mineral content results in a more productive soil and permits a greater variety of crops than Ultisols.
- Inceptisols (beginning) are mineral soils relatively new in origin and are characterized by having subsoil horizons just beginning to exhibit a moderate degree of soil development. Inceptisols lack significant clay accumulation in the subsoil and may be naturally fertile or infertile.
- Entisols (newly formed) exhibit little soil development other than the presence of an identifiable topsoil horizon. These soils occur in unstable environments of recently deposited sediments such as active flood plains, dunes, and landslide areas. They may be naturally fertile or infertile.
- Mollisols (soft, deep, fertile) are the soils forming in alluvium eroded from limestone and dolomite bedrock. They are characterized by a thick, dark surface horizon which results from the long-term addition of organic matter. Mollisols are extensively used for forests in Virginia but are among the most productive and fertile soils of the world. They occur in flood plains draining limestone and dolomite such as those around the the Shenandoah, Roanoke, and James Rivers.
- Spodosols (sandy, acidic) have a strongly leached surface layer and a subsoil in which an amorphous mixture of organic matter and aluminum, with or without iron, accumulates in a subsoil horizon. Most Spodosols have little silicate clay and have the appearance of white sugar sand. These are soils formed under coniferous forests such as the longleaf pine growing near Zuni.
- Histosols (organic, wet) are deep, poorly drained organic soils consisting of muck, peat, or mucky peat. They are usually highly deficient in plant nutrients and often highly acidic. Most of these soils are saturated year-round and occur in marshes and low-energy swamps along some estuaries.
Other textural designations of surface soils are sands, loamy sands, sandy clay loams, and clays. In each textural class there is a range in the amount of sand, silt, or clay that class may contain. The composition of each textural class does not allow for overlap from one class to another.
Texture of soil influences many different characteristics. A brief comparison between sandy and clay soils will highlight these points. Coarse-textured or sandy soils allow water to enter at a faster rate and to move more freely than in a clay. In addition, the relatively low water-holding capacity and the large amount of air present in sandy soils allows them to warm up faster than fine-textured soils. Sandy soils are also more easily tilled. They are well-suited for the production of special crops such as vegetables, flue-cured tobacco, peanuts, and certain fruits.
Structure
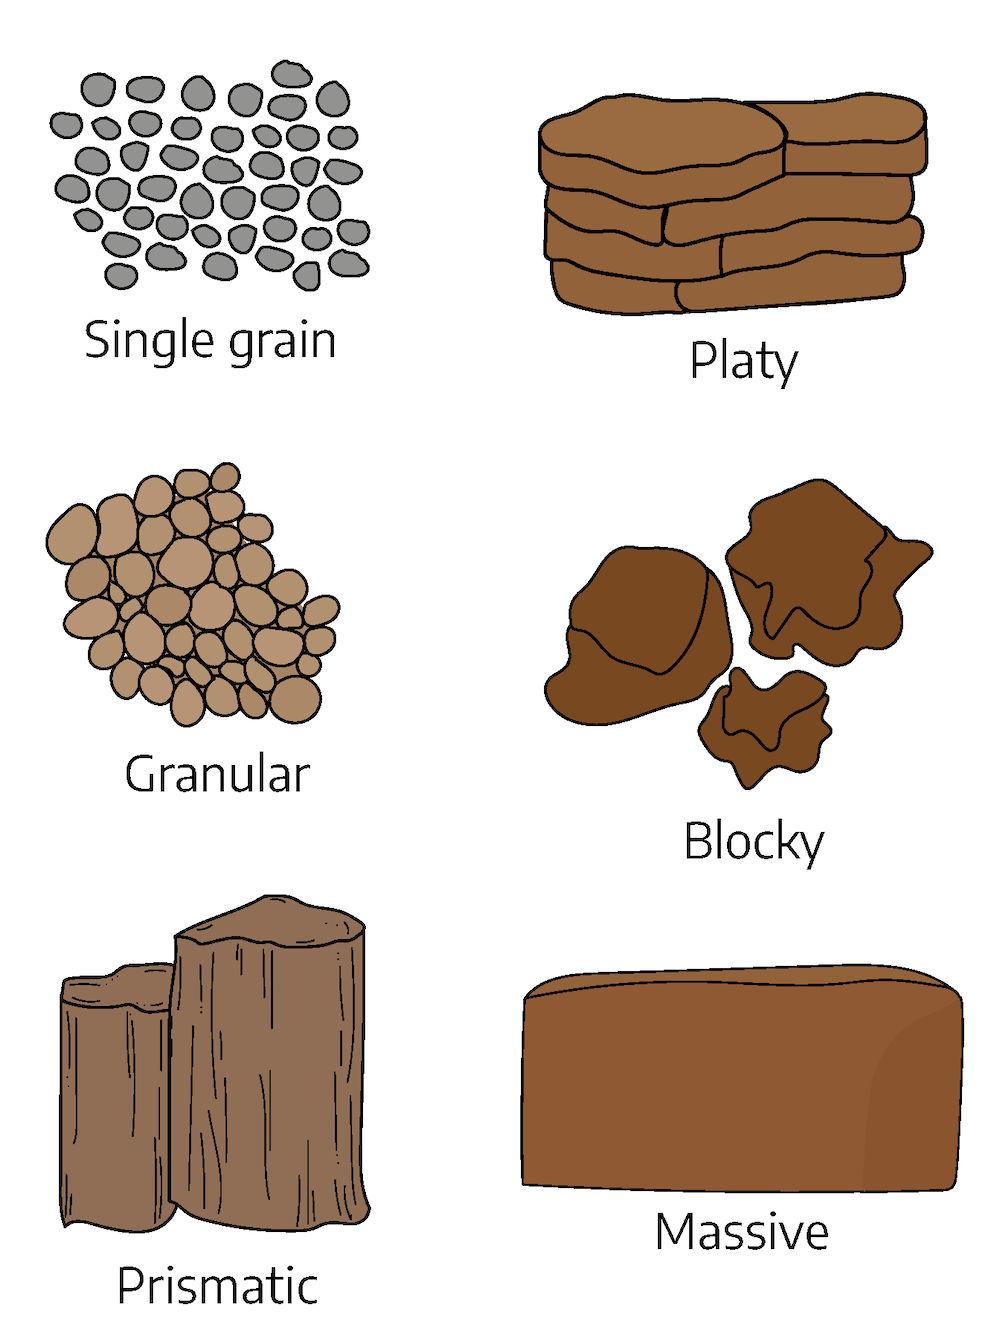
Soil particles are grouped together to form structural pieces called peds or aggregates. In surface soil, the structure will usually be granular unless it is disrupted. The soil aggregates will be rounded and vary in size from that of a very small shot pellet to that of a large pea. If organic matter content is low and the soil has been under continuous cultivation, the soil structure may be quite indistinct. If the soil is fine-textured, it may have a blocky subsoil structure.
Air and water movement within the soil is closely related to its structure. Good structure allows rapid movement of air and water, while poor structure slows down this movement. Water can enter a surface soil that has granular structure more rapidly than one that has little structure. Since plant roots move through the same channels in the soil as air and water, good structure allows extensive root development while poor structure discourages it. Water, air, and plant roots move more freely through subsoils that have blocky structure than those with a platy horizontal structure. Good structure of the surface soil is promoted by an adequate supply of organic matter, and by working the soil only when moisture conditions are correct.
Plant root growth also changes the soil structure, sending roots into the soil for mechanical support and to gather water and nutrients. As they grow, the roots of plants tend to enlarge the openings in the soil. When they die and decay, they leave channels for movement of air and water. In addition to the plants that we see, there are bacteria, molds, fungi, and other very small plants growing in the soil which can be seen only with the aid of a microscope. These organisms also enrich the soil as they die.
Table 2-4: Examples of soil structure
| Name | Description | Where commonly found in soils |
|---|---|---|
| Single Grain | Usually individual sand grains not held together | Sandy or loamy textures |
| Granular | Porous granules held together by organic matter and some clay | “A” horizons with some organic matter |
| Platy | Aggregates that have a thin vertical dimension with respect to lateral dimensions | Compacted layers and sometimes “E” horizons |
| Blocky | Roughly equidimensional peds usually higher in clay than other structural aggregates | “B” horizons with clay |
| Prismatic | Structural aggregates that have a much greater vertical than lateral dimension | In some “B” horizons |
| Massive | No definite structure or shape; usually hard | “C” horizons or compact transported material |
Depth
The effective depth of a soil for plant growth is the vertical distance into the soil from the surface to a layer that essentially stops the downward growth of plant roots. The barrier layer may be rock, sand, gravel, heavy clay, or a partially cemented layer.
- Very shallow: Soil surface is less than 10 inches from a layer that retards root development
- Shallow: Soil surface is 10 to 20 inches from a layer that retards root development
- Moderately deep: Soil surface is 20 to 36 inches from a layer that retards root development
- Deep: Soil surface is 36 to 60 inches from a layer that retards root development
- Very deep: Soil surface is more than 60 inches from a layer that retards root development
Soils that are deep, well drained, and have desirable texture and structure are suitable for the production of most crops. Deep soils can hold more plant nutrients and water than can shallow soils with similar textures. The depth of a soil and its capacity for nutrients and water frequently determine the yield from a crop, particularly annual crops grown through the summer months. Gardeners with very shallow soil often benefit from establishing raised beds.
Plants growing on shallow soils also have less mechanical support than those growing in deep soils. Trees growing in shallow soils are more frequently blown over by wind than are those growing in deep soils.
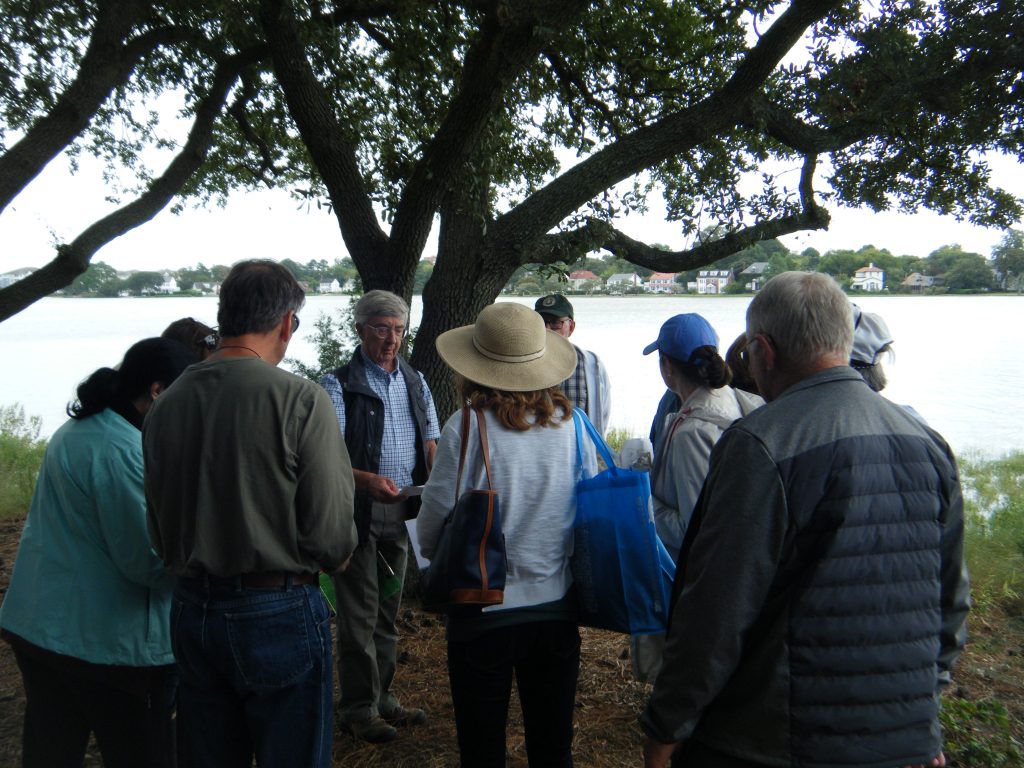
Northern Neck Shoreline Evaluation Program
By Ian Cheyne, Extension Master Gardener, Northern Neck
In the early 2000s, Northern Neck Master Gardeners (NNMG) began to engage in living shoreline installations. They recognized that, in the right situations, this was a way for homeowners to protect their property and also contribute to the restoration of the Chesapeake Bay. Where homeowners and plants are involved, Extension Master Gardeners (EMGs) should be too.
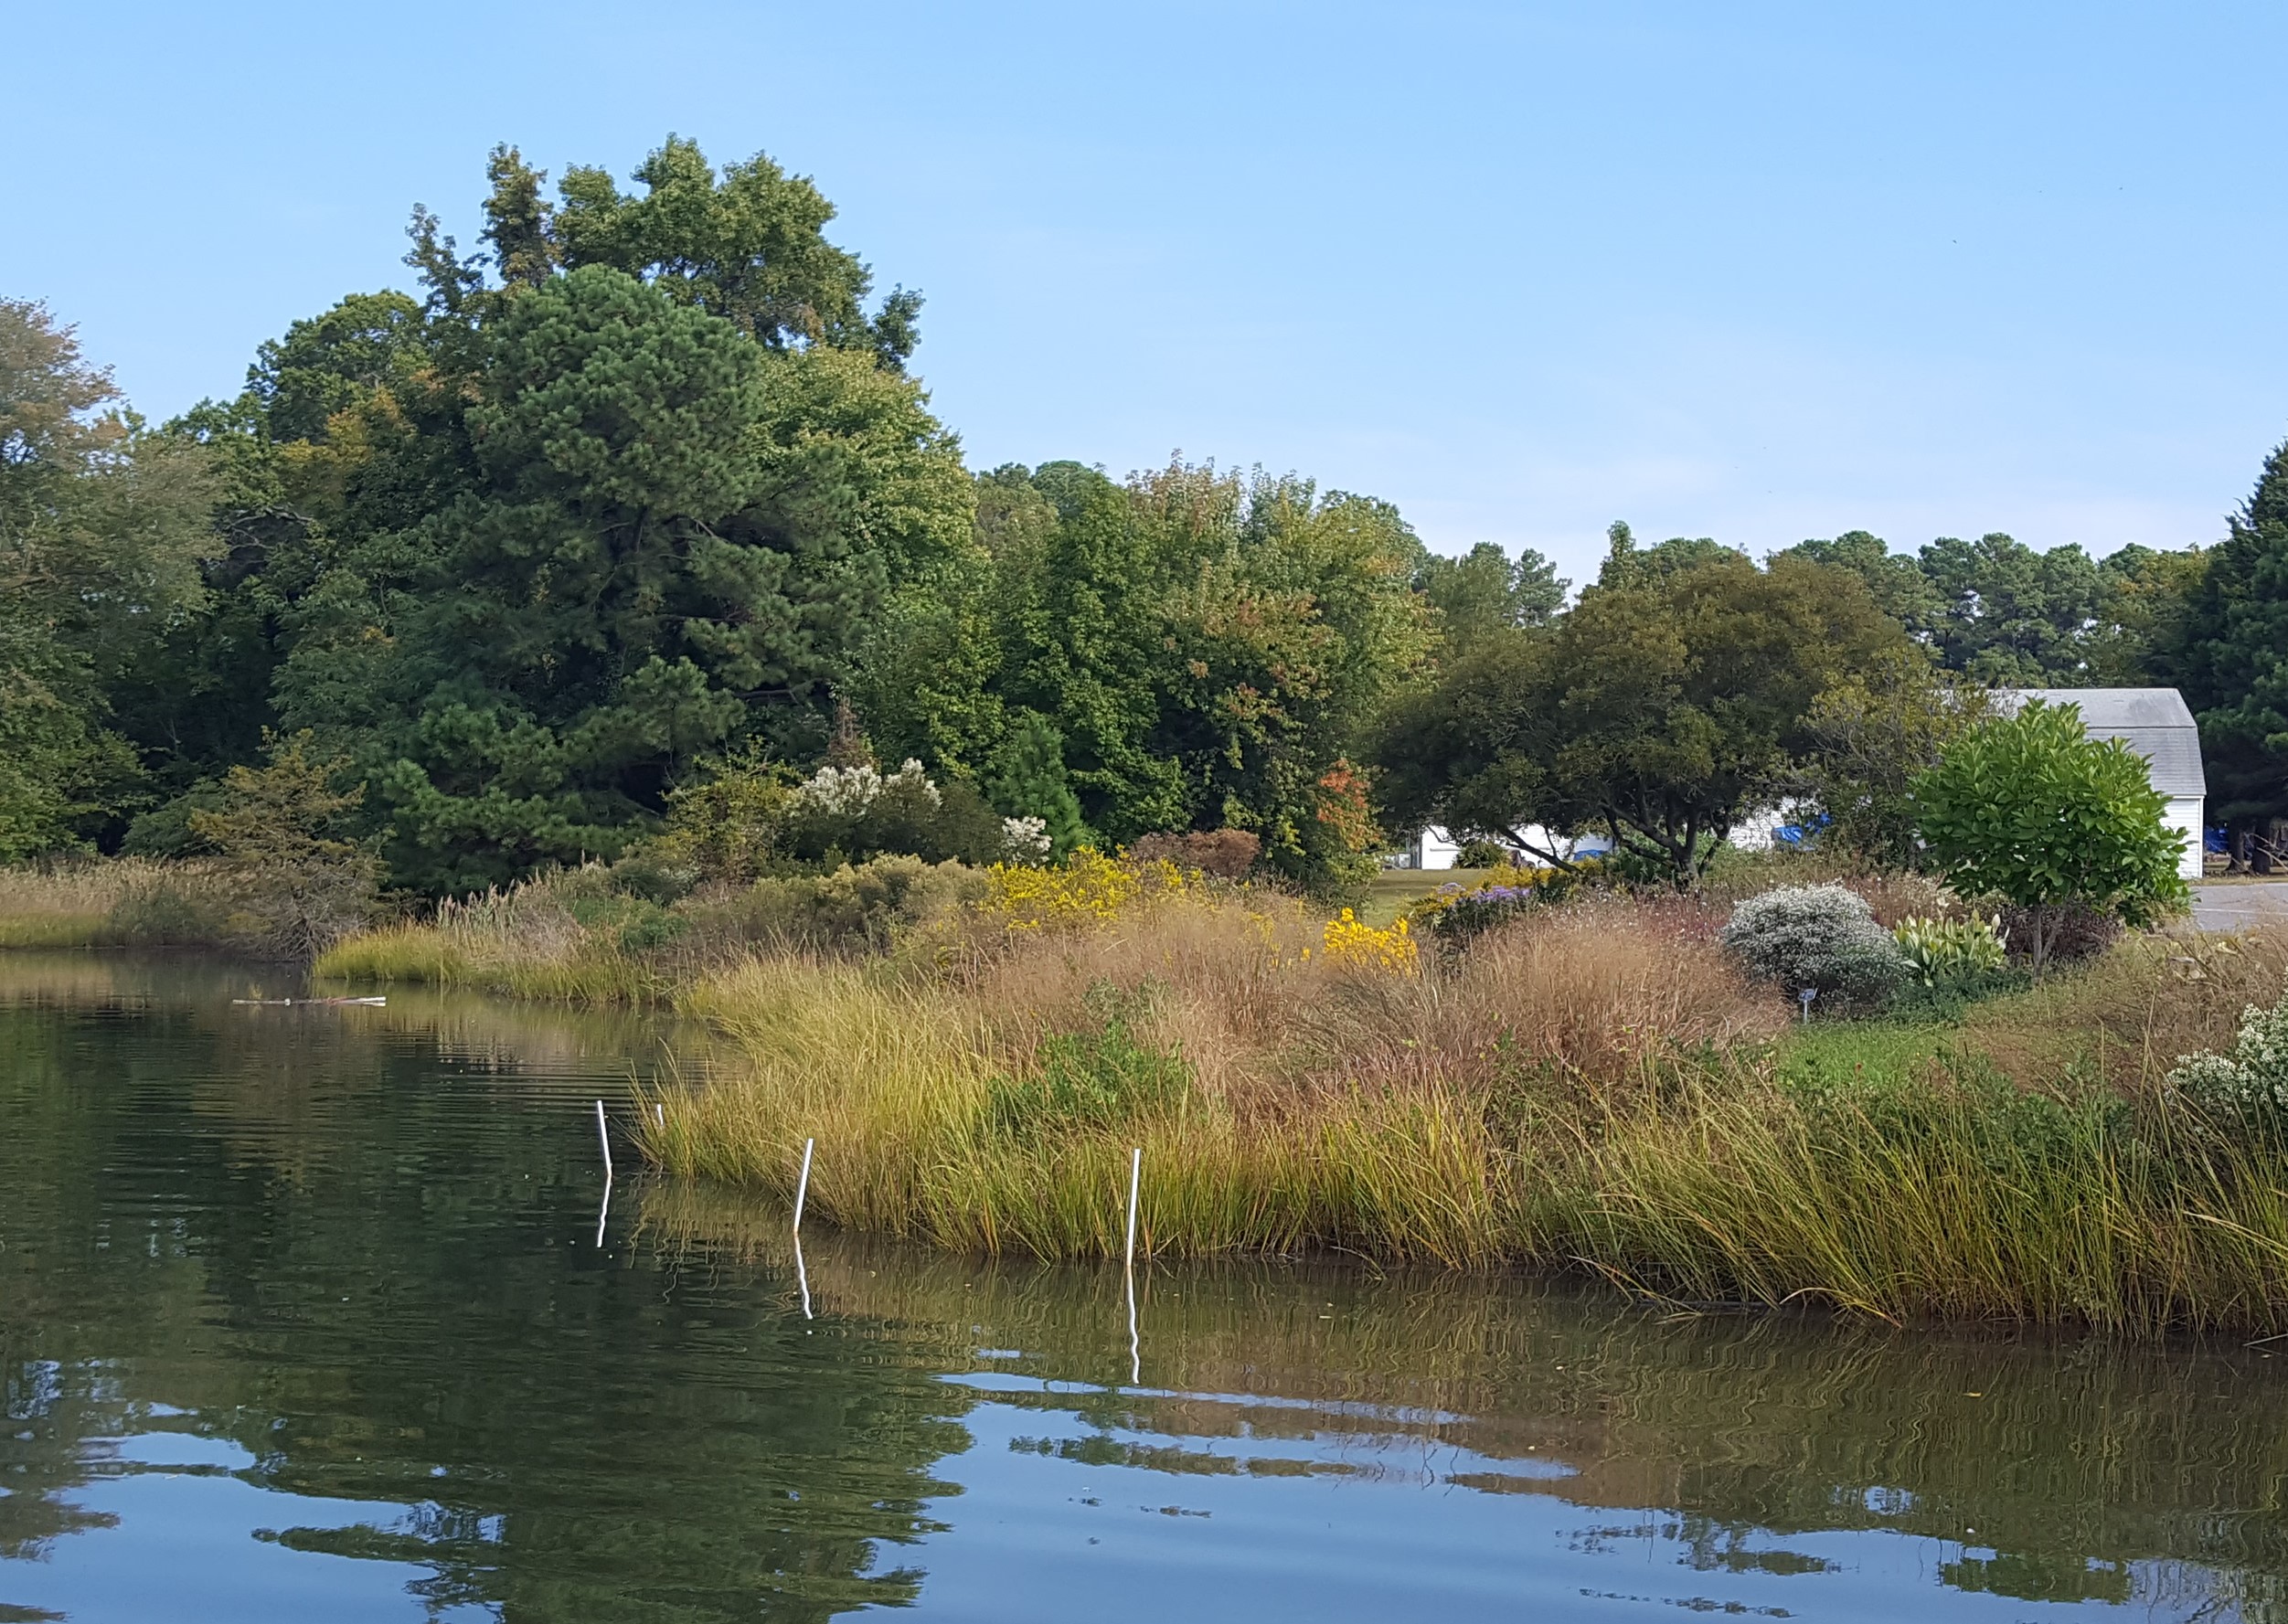
In 2004, the opportunity arose to participate in a project to install a demonstration living shoreline in Reedville in Northumberland County. The project involved Bethany United Methodist Church’s waterfront property adjacent to the Reedville Fishermen’s Museum. The eroding shoreline and stormwater runoff from the church and its parking lot were contaminating the adjacent creek. To address these issues, a living shoreline was proposed. The implementation was a collaboration among between the church, the Fishermen’s Museum, the Virginia Institute of Marine Science (VIMS), NNMG, and several other local non-profits. The project was successfully completed in 2005 and has been maintained by NNMG volunteers since then. The installation demonstrates the benefits and beauty of a living shoreline.
Enthused by their initial involvement, the EMGs wondered how they could do more. Then opportunity struck. In 2009, the Great Recession resulted in state budget cuts and one victim was the VIMS homeowner shoreline advisory service. Seeing an opportunity and already having a relationship with VIMS, the EMGs proposed to offer a similar service on the Northern Neck. VIMS welcomed the idea and agreed to provide training and consulting support. Thus, the Shoreline Evaluation Program (SEP) was conceived.
Before the program launched in 2012, the SEP team received training from VIMS and also qualified as EMG Water Stewards, an advanced training available to current Extension Master Gardeners. They documented necessary procedures, performed practice evaluations around the Northern Neck, and developed a strategic plan.
The SEP mission is to encourage homeowners to adopt shoreline protection methods that also protect habitats and their adjacent waters. To that end, SEP offers shoreline management advice through individual on-site evaluations and educational outreach to the public.
The educational outreach includes an annual shoreline management seminar, presentations to individual community groups, and a presence at farmers markets and other local events. To date, SEP has conducted over 300 individual shoreline evaluations and interacts directly with approximately 600 people each year through its evaluations, seminars, and outreach. The program is also continually adapting to changing legislation and the growing effects of climate change.
Collaboration has been a key ingredient to the program’s success. The living shoreline project was a collaboration. The relationship with VIMS continues as a collaboration. Recently, the James City County Williamsburg Master Gardeners in partnership with the Colonial Soil and Water Conservation District decided to launch SEP in their district. NNMG has played a role in training and transferring know-how to the new program, and the groups will maintain a collaborative relationship.
It has been a tremendously rewarding experience to see attitudes towards waterfront property management gradually change as homeowners realize they can protect their property in ways that can also contribute to the restoration of the Chesapeake Bay.
Soil Testing
The purpose of a soil test is to supply the homeowner with enough information to make wise decisions about the purchase and application of lime and fertilizer. A soil test from Virginia Tech will provide information on the soil pH and the plant available levels of phosphorus, potassium and seven other essential elements or nutrients. A Virginia Tech Soil Test report will also provide an estimated Cation Exchange Capacity (CEC), which gives an indication of a soil’s ability to retain nutrients (Ca++, Mg++ & K+) against leaching. Soil tests should be performed if such tests have never before been conducted or if past soil test results are unavailable. A soil test is unnecessary more often than every 3-4 years.
The accuracy of the soil test is a reflection of the sample taken. Be sure the sample is representative of the area to be treated; sampling should be specific and occur for one landscape type or use (e.g. vegetable garden, turf, landscape bed). Sample the soil from 10 or more random areas of the garden to a depth of 6 inches. Avoid sampling unusual areas such as those near gravel roads, manure or compost spots, brush piles, or under eaves. Place the samples in a clean plastic pail or container, and mix the soil thoroughly. Contact your local Extension office for soil sampling boxes and proper sampling procedures. For more information, visit the Soil Testing Lab website.
A soil test is the only way to determine if nutrients must be added or if a pH adjustment is needed. The soil test results suggest how much of each nutrient to add. Without a soil test, any application of fertilizer could be detrimental to the landscape and surrounding environment or ecosystem. Over-application or application of unneeded materials could result in salt injury to plants, cause nutrient imbalances unsuitable for plant growth, and has the potential to become an environmental pollutant.
Most nutrients move very slowly through the soil profile, so to be most effective, they should be incorporated into the top 4-6 inches. However, these elements can be surface applied, but the nutrients will be less readily available to the plants.
Magnesium may be deficient, especially in low pH soils. If magnesium levels and soil pH are low, dolomitic limestone can be used to raise the pH and supply the needed magnesium. To add magnesium without affecting the pH, Epsom salts (MgSO4) can be applied, either by incorporating into soil or as a soil drench (dissolved in water and applied near roots). Potassium can be surface applied, if needed. It is possible to over-apply potassium which can lead to deficiencies of other nutrients, particularly magnesium, so follow soil test recommendations closely.
Nitrogen is the nutrient that most frequently limits plant growth, and is often the only nutritional element that accelerates the growth of ornamental plants.
Unfortunately, nitrogen is also the most challenging nutrient to manage. Unlike other nutrients, it is not possible to accurately determine from a soil test how much nitrogen will be available during a plant’s growth. Nitrogen readily moves or leaches in the soil. The challenge is to provide adequate nitrogen levels when needed to meet the plant growth requirements. A soil test will recommend the amount and time to apply nitrogen based upon established annual requirements for the specified plant to be grown.
Nitrogen can be supplied with two different approaches and both work very well. Nitrogen can be applied as (1) a water soluble form which includes liquid feed and granular fertilizers or (2) slow release forms. See chapters on specific plant groups (i.e., lawns, woody ornamentals, etc.) and the chapter on water quality for more information on fertilizer application.
Cation Exchange Capacity (CEC)
The cation exchange capacity (CEC) is a measure of the net negative charge per unit of clay. Nutrient cations (such as CA++, Mg++, K+), which have a positive charge, are readily attracted to clay particles which have a net negative charge. A water molecule’s positive polar ends are also attracted to clay. Humus also has a high CEC and may also be adsorbed to clay. If the CEC is too low, cations and water are not adsorbed strongly and are easily drained or leached away. Soils with little clay, such as sand textures, and highly weathered clays and oxides have very low CEC. The CEC determines a soil’s ability to adsorb nutrients, and is related to potential fertility. Although many factors affect cation exchange between the clays or humus and the plants, we are most interested when nutrient cations and anions (which have a negative charge) are exchanged across root cell walls and taken into the root. The plant root releases hydrogen ions (H+), which then replaces the cations in the soil for uptake into the plant. Uptake of phosphate anions requires some energy expenditure by the plant.
Watch: Understanding and interpreting soil test results with Scott Baker, Extension Agent, Bedford
Soil pH
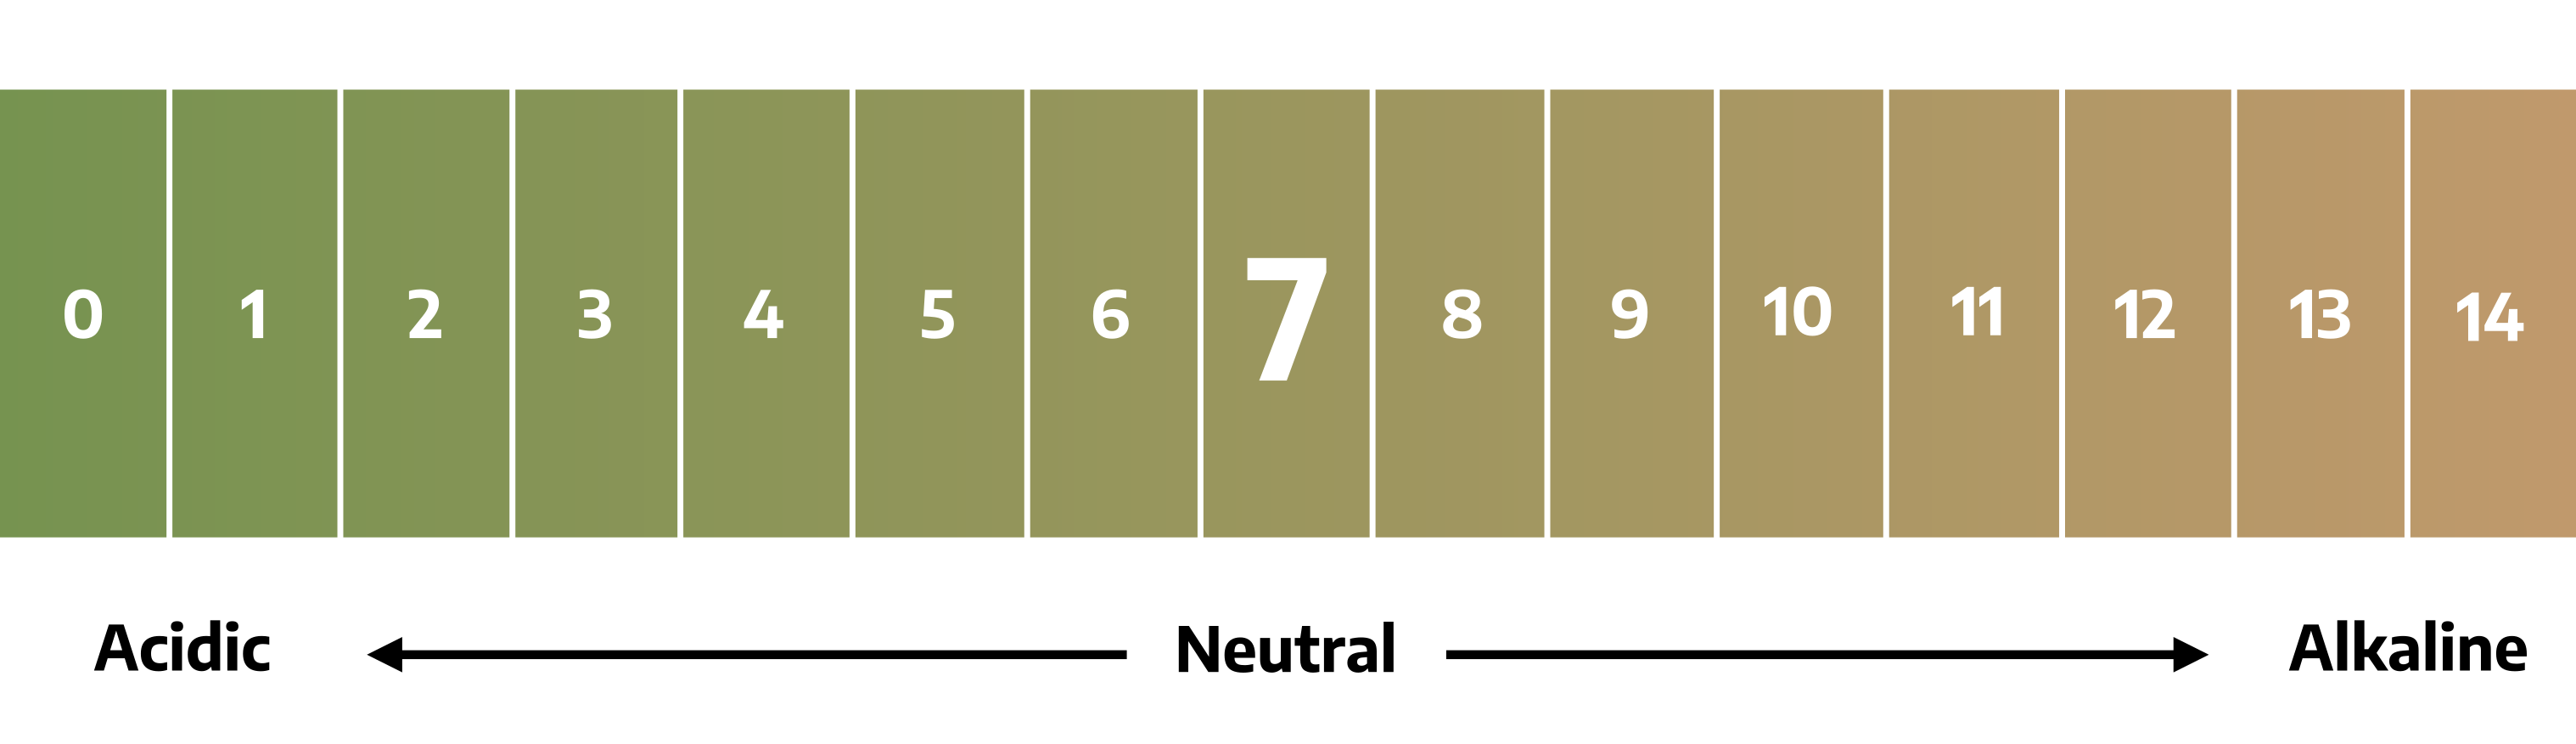
A pH is a reading taken from a scale that measures the hydrogen (acid-forming) ion activity of soil or growth media. The reading expresses the degree of acidity or alkalinity in terms of pH values. The scale of measuring acidity or alkalinity contains 14 divisions known as pH units. It is centered around pH 7 which is neutral. Values below 7 constitute the acid range of the scale and values above 7 make up the alkaline range.
The measurement scale is not a linear scale but a logarithmic scale. That is, a soil with a pH of 8.5 is ten times more alkaline than a soil with a pH of 7.5, and a soil with a pH of 4.5 is ten times more acid than a soil with a pH of 5.5.
The pH condition of soil is one of a number of environmental conditions that affects the quality of plant growth. A near-neutral or slightly acidic soil is generally considered ideal for most plants. Some types of plant growth can occur anywhere in a 3.5 to 10.0 range. With some notable exceptions, a soil pH of 6.0 to 7.0 requires no modification of soil pH to improve plant growth.
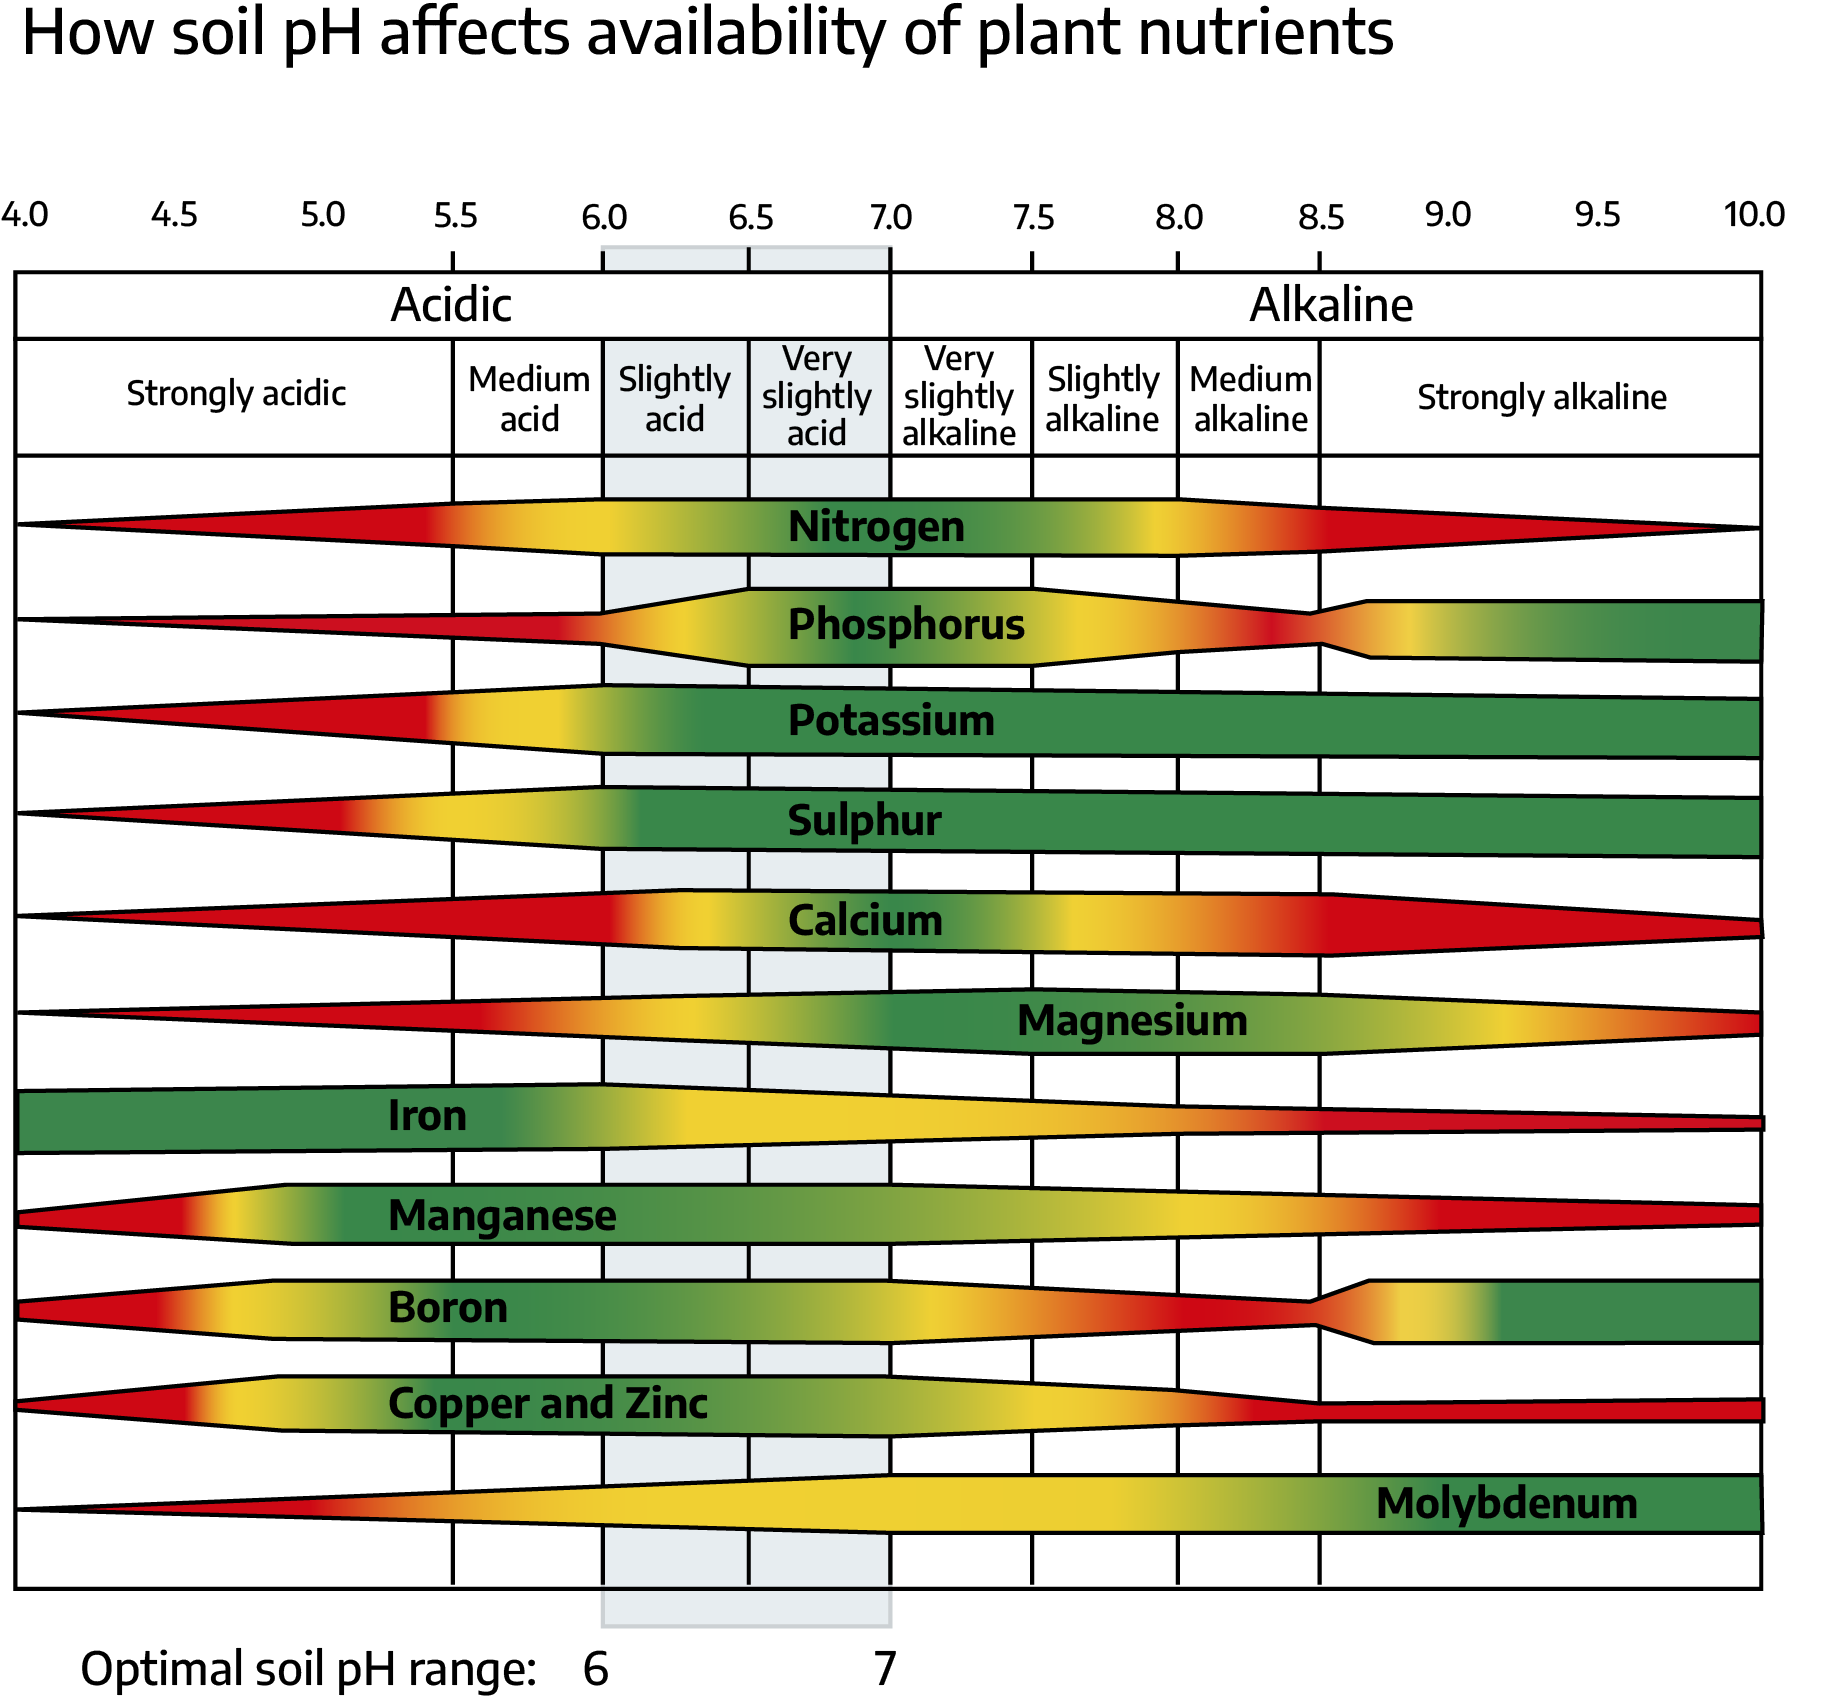
The major impact that pH extremes have on plant growth is the availability of plant nutrients and concentration of the plant-toxic minerals. In highly acidic soils, calcium, phosphorous, and magnesium become tied up and unavailable, and manganese can be available in toxic levels. At pH values of 7 and above, phosphorus, iron, copper, zinc, boron, and manganese become less available.
Ground limestone and rarely sulfur are used to adjust pH that is not in the ideal range for plant growth. Limestone raises pH and sulfur lowers it. To avoid under or over applying these materials, applications should be based on a soil test. Preferably, any applied lime should be thoroughly tilled into the soil prior to planting.
Table 2-5 presents some approximate amounts of ground limestone needed to increase the pH of five soil types. Table 2-6 presents some approximate amounts of ground sulfur needed too decrease the pH of two soil types. These values are only representative and should not be taken as recommendations. To avoid under or over applying liming material, applications should be based on a soil test. In order to ascertain a more precise lime requirement recommendation, the Virginia Tech Soil Testing Laboratory not only performs a soil pH using distilled water, but it also determines a pH using a buffered solution to measure the total (active plus reserve) acidity and buffering capacity for a particular soil sample. Preferably, any applied lime should be thoroughly tilled into the soil prior to planting. As with soil testing for fertilizer needs, amendments to improve aeration and/or drainage should be applied prior to testing soil pH.
Table 2-5: Approximate amount of limestone needed to increase the pH of the upper 7 inches of soil to 6.5
Table shows the amount of lime to apply in lbs./1000 square feet. Lime recommendations are based on using a ground limestone with a neutralizing value of 90%
| Soil texture (Upper 7 inches) |
pH range 4.5 to 4.9 | pH range 5.0 to 5.4 | pH range 5.5 to 5.9 | pH range 6.0 to 6.4 |
|---|---|---|---|---|
| Sand | 115 | 92 | 69 | 23 |
| Loamy sand | 138 | 115 | 92 | 46 |
| Sandy loam | 184 | 138 | 115 | 69 |
| Clay and silty clay | 270 | 230 | 184 | 92 |
| Clay loam and loam | 230 | 184 | 138 | 92 |
Table 2-6: Approximate amount of ground sulfur needed to decrease the pH of the soil to 6.5
Sulfur recommendations are based on using a ground sulfur material containing 95% S.
This information was provided by D.A. Bailey, Department of Horticulture Science, NCSU
| Soil Texture | pH range 7.0 to 7.5 | pH range 7.6 to 8.0 | pH range 8.1 to 8.5 | pH range 8.6 to 9.0 |
|---|---|---|---|---|
| Sandy soils | 9-13 | 22-34 | 34-45 | 45-68 |
| Clay soils | 18-22 | 34-45 | 34-45 | ---- |
If the soil pH is too high and must be lowered, elemental sulfur or aluminum sulfate can be incorporated into the soil to reduce alkalinity. If only a small decrease in pH is required, acid-forming fertilizer such as ammonium nitrate can be used as a nitrogen source.
Most ornamental plants require slightly to strongly acidic soil. When grown in soils in the alkaline range, these species may develop trace metal deficiencies (such as iron or manganese, trace metal deficiency symptoms will first appear on new leaves).
While there is likely plenty of iron in the soil, when the pH is not in a favorable range for the plant being grown, the iron is unavailable to the plant. This problem can be corrected by applying chelated iron. The term chelate comes from the Greek word for claw. Chelates are chemical claws that help hold metal ions, such as iron, in solution, so that the plant can absorb them. Different chemicals can act as chelates, from relatively simple natural chelates like citrate to more complex, manufactured chemicals. When a chelated metal is added to the soil, the nutrient held by the chelate will remain available to the plant for a longer period of time than if added as a salt form such as iron sulfate.
Most nutrients do not require the addition of a chelate to help absorption. Only a few of the metals, such as iron, benefit from the addition of chelates.
Building Healthy Soil
Well-formed soil structure can have a positive impact on nutrient retention. Organic matter is a great soil improver for both clay and sandy soils. Good sources of organic matter include manures, leaf mold, sawdust, and straw. These materials are decomposed by soil organisms. Various factors such as moisture, temperature, and nitrogen availability determine the rate of decomposition through their effects on these organisms. Adequate water must be present, and warm temperatures will increase the rate at which the microbes work. The proper balance of carbon and nitrogen is needed for rapid decomposition. Fresh green wastes, such as grass clippings, are higher in nitrogen than dry material. The addition of nitrogen may be necessary if large amounts of undecomposed high-carbon substances such as dried leaves, straw, or sawdust are used. In the process of breaking down the organic matter. Nitrogen is used by the microbes and, therefore, may become deficient in the plants.
Tilling
Tilling is a good way to loosen soil and break up soil clods in new beds as well as in the yearly preparation of annual flower and vegetable gardens. It is also a good opportunity to incorporate organic matter and nutrients into the soil, though excessive tillage can be detrimental to soil organisms and soil structure. The best time to till is when soil is very slightly moist. Tilling in the fall for spring planting helps kill insects and weeds and allows winter freezing and thawing to help build soil structure.
However, tillage of the soil, especially deep tilling practices, can negatively affect the physical and biological properties of the soil. For more about alternatives to tilling, see “No-till or low-till methods” in Chapter 9 “The Vegetable Garden.”
Compost
Organic matter should make up 5% or more (by weight) of a healthy soil. Many Virginia soils, especially urban soils, are low in organic matter. The regular application of compost to lawns and landscape beds will add organic matter and improve the overall health of the soil.
The carbon in compost feeds a variety of beneficial bacteria, fungi and other organisms. As these organisms feed they convert nutrients into plant available forms. For example, nitrogen in ammonium (NH4+) and ammonia (NH3–) is converted to the more plant available form of nitrate (NO3–).
Some specialized fungi form symbiotic relationships with plants that provide plants with nutrients and water, essentially acting as an extension of the root system.
As compost-fed soil organisms thrive they break up compacted soil and exude natural glues that allow soil particles to form aggregates. These aggregates help preserve pore space that allows for the passage of water, gasses and roots.
The organic matter in compost can also act as a reserve for food and water. This is especially important in sandy soils where high infiltration rates and low cation exchange capacities would otherwise require frequent applications of water and fertilizer.
The quality of compost is not uniform. Both home-made and commercial compost can vary in chemistry from batch to batch. While there is an effort to standardize commercial compost, it is not mandatory and does not cover home-made compost.
Compost should be dark, brown, fluffy, and crumbly with an earthy odor when ready to use. It should not be moldy, have a rotten smell, or be decomposed to a point of being powdery. Except for some woody pieces, the source materials that went into the compost should not be recognizable and finished compost should have a stable pH near neutral and be low in soluble salts.
Cover Crops
Another source of inexpensive soil improvement that should not be underestimated is the cover crop. Cover crops, sometimes called green manures, can be used to increase organic matter, break up hard soils, suppress weeds, prevent erosion, and hold and increase soil nutrients. Most cover crops have multiple uses. Cereal rye, for example, can absorb soil nutrients and hold them over the winter while also suppressing weeds.
The best time to seed a cover crop depends on the species being planted and when the previous crop is harvested. Often, cover crops are planted in the garden in the fall for incorporation in the spring. In a fall garden, plant cover crops between the rows and in any cleared areas. Cover crops can also be used in late spring and summer to suppress weeds or provide a nitrogen boost before the next crop is planted.
Cover cropping provides additional organic matter, holds nutrients that might have been lost over the winter, and helps reduce erosion and loss of topsoil. Legume cover crops can increase the amount of nitrogen in the soil and reduce fertilizer needs over time. A deep-rooted cover crop allowed to grow for a season in problem soil can help break up a hardpan and greatly improve soil tilth. Planting multiple species of cover crops together has shown to increase the diversity of soil organism communities.
Incorporate green manures at least 2 weeks before planting vegetables. In most cases, cover crops should not be allowed to go to seed.
The regular addition of manures, compost, cover crops, and other organic materials can raise the soil nutrient level to a point where the need for synthetic fertilizers is greatly reduced. This highly desirable soil quality does not come about after a single or even several additions of organic material and requires a serious soil-building program. For more information, see Chapter 9: “The Vegetable Garden.”
Table 2-7: Table of common cover crops
| Type | Legume (L)/Non-Legume (N) | Amount to Sow/100 ft2 (Oz.) | When to Sow | When to Turn Under | Effects | Notes |
|---|---|---|---|---|---|---|
| Alfalfa (spring sow) | L | 0.5 | Spring Late Summer |
Fall Spring |
Fixes 150-250 lbs. N/ac./yr; deep roots break up hard soil, trace elements to surface. | Loam, fairly fertile soil; needs warm temps. for germination. Lime if pH is low. Hardy. In mountains sow by Aug 10. Drought tolerant. Inoculate. |
| Barley | N | 4 | Fall Spring |
Spring Fall |
Adds organic matter; improves soil aggregation. | Prefers medium-rich, loam soil. Lime if pH is low. Not as hardy as rye. Tolerates drought. |
| Buckwheat | N | 2.5 | Spring Summer |
Summer Fall |
Mellows soil; rich in potassium | Must leave part of garden in cover crop during season. Grows quickly. Not hardy. |
| Crimson Clover | L | 0.33 | Spring Fall |
Fall Spring |
Fixes 100-150 lbs. N/ac./yr. | Not reliably hardy. Sow before mid-Sept. in Piedmont and mountains. Not drought tolerant. Lime if pH is low. White clover is a bit hardier. |
| Fava Beans | L | Plant 8” apart | Early Spring Late Summer |
Early Summer Fall |
Some types fix 70-100 lbs. N/ac./yr in as little as 6 weeks. Use small seeded rather than large seeded table types. | Will grow on many soil types. Medium drought tolerance. Likes cool growing weather. Good for mountain areas. If planted in early spring can grow late vegetables. Inoculate with same bacteria as hairy vetch. |
| Forage Radish | N | Plant 4” apart with 15” row spacing, | Fall, 4-10 weeks before expected killing frost | Spring | Reduces soil compaction, suppresses weeds, increase soil infiltration, captures and holds up to 170 lb N/ac/yr | Will die off once the temperature reaches 25°F but roots will slowly decompose leaving open channels that will help infiltration |
| Oats | N | 4 | Spring Fall |
Summer Spring |
Adds organic matter; improves soil aggregation. | Needs adequate manganese. Not hardy; tolerates low pH |
| Rye, winter | N | 3.5 | Fall | Spring | Adds organic matter; improves soil aggregation. | Very hardy. Can plant until late October. |
| Vetch, hairy | L | 2.5 | Early Fall | Spring | Fixes 80-100 lbs. N/ac./yr. | Inoculate; slow to establish. Fairly hardy. Till under before it seeds; can become a weed. |
| Wheat, winter | N | 4 | Fall | Spring | Adds organic matter; improves soil aggregation. | Prefers medium-rich, loam soil. Lime if pH is low. Not as hardy as rye. Tolerates drought. |
Watch: Cover crops and soil health with Mark Reiter
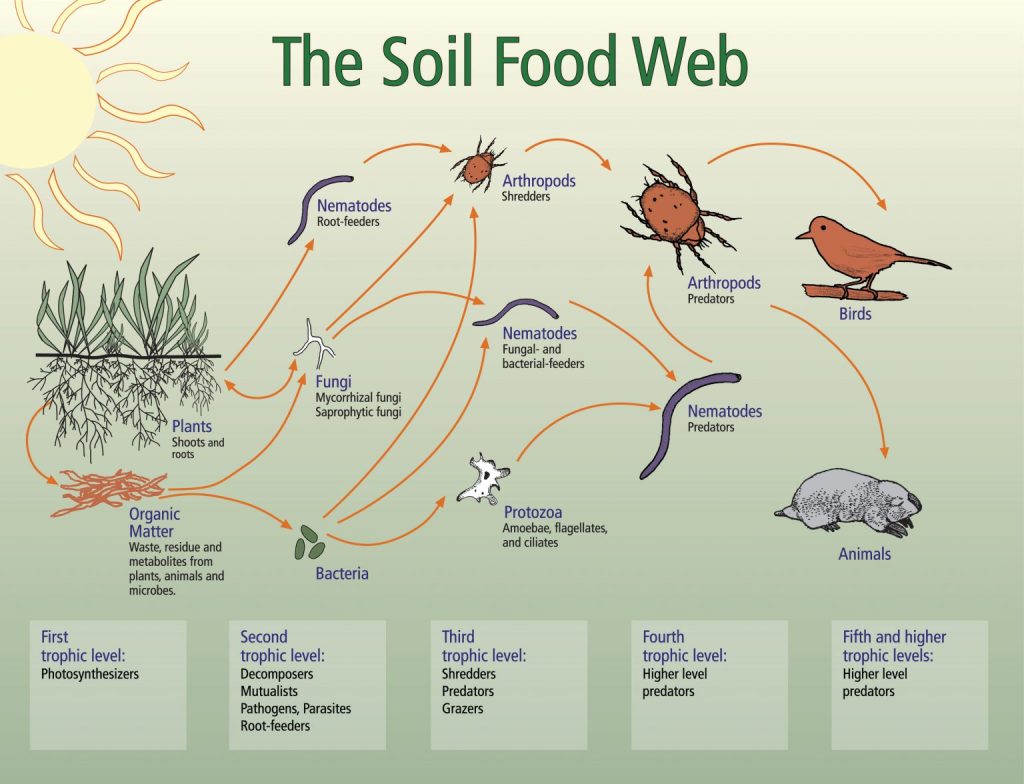
Soil Food Web
The soil food web is built of a wide range of organisms. This complex system includes organisms such as bacteria, algae, fungi, protozoa, nematodes and micro-arthropods, as well as earthworms, insects, small vertebrates, and plants. From the microscopic to the visible, each organism plays an important role in this ecosystem. Decomposition of organic matter, sequestration of nitrogen, fixing of nitrogen from the atmosphere to make it available for plants, and aerating the soil are just a few of the specific tasks these organisms can play in the soil food web.
Understanding Fertilizers
There are 16 elements essential to plant growth, as described in Table 2-2 and 2-3. Carbon, hydrogen, and oxygen come from air and/or water. Nitrogen, phosphorous and potassium are considered fertilizer macronutrients because plants require them in a relatively large quantity for maximum growth. Calcium, magnesium, and sulfur are secondary macronutrients but usually are either present in sufficient quantities or are added coincidentally with other materials (e.g., lime). The other seven nutrients, called micronutrients, are just as important but are required in smaller amounts. To review the roles of the elements in plant growth, please see the section, “Physiological and Biochemical Functions of Essential Elements in Plants” in Chapter 5 “Abiotic Stress.”
If plants are low in any of these elements, they exhibit signs of nutrient deficiency. High levels may contribute to nutrient toxicity. Some of these symptoms are given in the discussion of nutrients in Chapter 5 “Abiotic Stress.”
Fertilizer Analysis
Some fertilizer packaging includes an analysis of nutrient content, represented by three numbers which refer to the percentage by weight of nitrogen (N), phosphate (P2O5), and potash (K2O) respectively.
Often, to simplify matters, these numbers are said to represent nitrogen, phosphorus, and potassium, or N-P-K. We should remember that it is not N-P-K, but N-P2O5-K2O. For example, a bag of 10-10-10 fertilizer contains 10% N, 10% P2O5, and 10% K2O by weight. For example, if we have a 100-pound bag of this fertilizer labeled 10-10-10, there are 10 pounds of N, 10 pounds of P2O5, and 10 pounds of K2O in that bag.
In some fertilizers, a filler is sometimes added to bulk up the fertilizer. This is done to lower the analysis, or dilute the concentration, allowing a more even spreading pattern as compared to trying to spread a small amount of a high analysis fertilizer over an area. A filler is generally an inert material such as sand or ground corn cobs. Some fillers are used to enhance the fertilizer’s handling qualities.
The information contained on fertilizer labels has been well standardized, and the consumer is protected by state laws requiring manufacturers to guarantee the claimed nutrients. In some cases, a fertilizer will contain secondary nutrients or micronutrients not listed on the label because the manufacturer does not want to guarantee their exact amounts.
On fertilizer labels, the initials WIN and WSN stand for Water Insoluble Nitrogen and Water Soluble Nitrogen. Water soluble nitrogen (WSN) dissolves readily and is usually in a simple form, such as ammoniacal nitrogen (ammonium, NH4+) or nitrate (NO3–) nitrogen. Nitrogen, which will not dissolve readily, may exist in other forms in the fertilizer. Water insoluble nitrogen (WIN) is referred to as a slow-release nitrogen (SRN) source and delivers nitrogen at different rates according to the amount and kind of material in its composition. WIN is also sometimes referred to as slowly-available nitrogen (SAN).
The best fertilizer to use depends on many factors, such as the nutrients needed, soil structure, soil chemistry, and method of applying the fertilizer.
Complete versus Incomplete
A complete fertilizer contains nitrogen, phosphorus, and potassium. Common examples of complete fertilizers are 10-10-10 and 20-10-5. An incomplete fertilizer is missing one or two of the major components. Examples of incomplete fertilizers are indicated on the following chart.
Manufacturers can blend different incomplete fertilizers to create many different fertilizer ratios found on store shelves.
The fertilizer ratio indicates the proportion of nitrogen, phosphate, and potash contained in the fertilizer. The specific fertilizer ratio you will need depends on the soil nutrient level, and the plants being grown.
Table 2-8: Common incomplete (agricultural) fertilizers
| Type of fertilizer | % Nitrogen | % Phosphate (P2O5) | % Potash (K2O) |
|---|---|---|---|
| Ammonium nitrate | 34 | 0 | 0 |
| Ammonium sulfate | 21 | 0 | 0 |
| Monoammomium phosphate | 11 | 48 | 0 |
| Muriate of potash (Potassium chloride) | 0 | 0 | 60 |
| Potassium sulfate | 0 | 0 | 52 |
| Superphosphate | 0 | 20 | 0 |
| Triple superphosphate | 0 | 46 | 0 |
| Urea | 46 | 0 | 0 |
| Ureaformaldehyde (Urea form) | 38 | 0 | 0 |
Fertilizer Formulation
Fertilizer formulation determines how quickly nutrients will be available to plants. Some of the formulations available to the homeowner are: water-soluble powders, slow-release pellets, slow-release collars or spikes, liquids, tablets, and granular solids.
Liquid fertilizers come in a variety of different formulations, including complete formulas, special incomplete formulations, and types that offer just one or two micronutrients. All liquid fertilizers are made to be diluted with water, some are concentrated liquids, and others are powder or pellets. Growers of container plants often use liquid fertilizers (which typically contain more WSN) at half concentration twice as frequently, so that the plants receive a more continuous supply of nutrients.
Special-Purpose Fertilizers
When shopping for fertilizer, you will find fertilizers packaged for certain uses or types of plants such as Camellia Food, Rhododendron and Azalea Food, or Rose Food. Some of the compounds used in these fertilizers are chosen because they have an acid reaction, or provide the plant with its preferred nutrient source, such as ammoniacal N, so they are especially beneficial to acid-loving plants where soil is naturally neutral or alkaline.
A soil test should be performed before the purchase of any expensive, special-purpose fertilizers. It is not possible to make a blanket statement that one fertilizer is best for every area. It is true that different plants use different nutrients at different rates. What is unknown is the reserve of nutrients already in the soil. This will change with soil type and location.
Slow-release fertilizers
Plants can absorb nutrients continuously, so it is beneficial to provide them with a balance of nutrients throughout their growth. Perhaps the most efficient way to achieve this is to apply a slow-release fertilizer, which releases nutrients at a rate that makes them available to the plants over a long period. Slow-release fertilizers contain one or more essential elements and can be categorized according to their release mechanism. The three major types of nutrient release mechanisms are: (1) materials that dissolve slowly, (2) materials requiring microorganisms to release nitrogen, and (3) granular materials with membranes made of resin or sulfur to control the rate of nutrient release into the soil.
Sulfur-coated urea is a slow-release fertilizer with a covering of sulfur around each urea particle. The rate of nitrogen release is determined by the thickness of the coating. Sulfur-coated urea applied to the soil’s surface releases nitrogen more slowly than if incorporated into the soil. This material generally costs less than other slow-release fertilizers, and it supplies the essential element sulfur.
When fertilizer products coated with multiple layers of resin come into contact with water, the layers swell and increase the pore size in the resin so that the dissolved fertilizer can move into the soil. Release rate depends on the coating thickness, temperature, and water content of the soil. There is often a large release of fertilizer during the first 2 or 3 days after application. Release timing can be from 0 to 6 months, depending on the coating.
Slow-release fertilizers need not be applied as frequently as other fertilizers, and higher amounts can be applied without danger of burning. Plants may use the nitrogen in slow-release fertilizers more efficiently than nitrogen in other forms, since it is released over a longer period of time and in smaller quantity. Slow-release fertilizers are generally more expensive than other types, but they require much less frequent application than conventional fertilizers.
Urea formaldehyde and sulfur-coated urea have been used as turf fertilizer, while resin-coated fertilizers are predominantly used in container growing.
Caution should be used when applying slow-release fertilizers around trees or shrubs as this can encourage late summer growth that may not harden off completely, exposing the plant to winter damage.
Table 2-9: Comparison of slow-release fertilizers, conventional fertilizers, and manure or sludge
| Type of Fertilizer | Advantages | Disadvantages |
|---|---|---|
| Slow-Release Fertilizers | - Fewer applications - Low burn potential - Release rate varies depending on fertilizer characteristics - Comparatively slow release rate |
- Unit cost is high - Availability is limited |
| Conventional Fertilizers | - Fast-acting - Some are acid-forming - Lower cost |
- Greater burn potential - Solidifies in the bag when wet - Nitrogen leaches readily |
| Manure or Sewage Sludge | - Low burn potential - Relatively slow release - Contains micronutrients - Conditions the soil |
- Salt could be a problem (except for fresh chicken manure) - Bulky, hard to handle - Odor - Expensive per pound of actual nutrient - Weed seeds are a problem - Cannot select a needed formulation; usually low in N, high in P, and sometimes high in K. Best applied based on P needs (add additional conventional fertilizer for any remaining N needs) - Heavy metals may be present in sewage sludge from large cities or industrial areas |
Organic fertilizers
Although compost is fertilizer, home gardeners might seek additional sources of organic fertilizer. The nutrients in organic fertilizers are derived solely from the remains or by-products of a once-living organism (and not necessarily “organic” in the sense of the term used in organic gardening). Cottonseed meal, blood meal, bone meal, hoof and horn meal, and all manures are examples of organic fertilizers. When packaged as fertilizers, these products will have the fertilizer ratios included on the label. Some organic materials, particularly composted manures and sludge, are sold as soil conditioners and do not have a nutrient guarantee, although small amounts of nutrients are present. Some are fortified with nitrogen, phosphorus, or potash for a higher analysis. In general, organic fertilizers release nutrients over a fairly long period, first releasing quickly available nutrients and then additional mineral nutrients become available later via decomposition. The potential drawback is that they may not release enough of their principal nutrient at a time to give the plant what it needs for best growth. Organic fertilizers depend on soil organisms to break them down to release nutrients, so most are only effective when soil is moist and warm enough for the soil organisms to be active.
Cottonseed meal is a by-product of cotton manufacturing and is frequently used for fertilizing acid-loving plants such as azaleas, camellias, and rhododendrons. Formulas vary slightly, but generally contain 6% nitrogen, 3% phosphate, and 2% potash. Cottonseed meal is readily available to plants in warm soils, and there is little danger of burn. For general garden use, apply 2 to 5 pounds per 1000 square feet.
Blood meal is dried, powdered blood collected from beef processors. It is a rich source of nitrogen — so rich, in fact, that it may do harm if used in excess. The gardener must be careful not to use more than the amount recommended on the label. In addition to supplying nitrogen, blood meal supplies many of the essential trace elements, including iron.
Urea is a synthetic organic fertilizer, an organic substance manufactured from inorganic materials.
Fish emulsion, a complete fertilizer, is a partially decomposed blend of finely pulverized fish. No matter how little is used, the odor is intense — but it dissipates within a day or two. Fish emulsion is high in nitrogen and is a source of several trace elements. In the late spring, when garden plants have sprouted, an application of fish emulsion followed by a deep watering will boost the plant’s early growth spurt. Contrary to popular belief, too strong a solution of fish emulsion can burn plants, particularly those in containers.
Manure is also a complete fertilizer and varies in nutrient content depending on the animal and its diet, but a fertilizer ratio of 1-1-1 is typical. Manures are best used as soil conditioners instead of nutrient sources. Commonly available manures include horse, cow, pig, chicken, and sheep. The actual nutrient content varies widely, but is highest when manures are fresh. Fresh manure should not be used where it will contact tender plant roots. As it is aged, leached, or composted, nutrient content is reduced. However, the subsequent reduction in salts will reduce the chances of burning plants. Typical rates of manure applications vary from a moderate 70 pounds per 1,000 square feet to as much as half a ton per 1,000 square feet.
Compared to synthetic fertilizer formulations, organic fertilizers contain relatively low concentrations of actual nutrients, but they perform other important functions which the synthetic formulations do not. Some of these functions are: increasing organic content of the soil, improving physical structure of the soil, adding micronutrients, and increasing bacterial and fungal activity.
Fertilizer application rate examples
Example 1
Determine the amount of ammonium sulfate needed by a 5000 square-foot lawn if 1 pound of nitrogen per 1000 square feet is recommended.
- Lawn: 5000 square feet
- Fertilizer: ammonium sulfate (21-0-0)
- Rate: 1 pound of nitrogen per 1000 square feet
Since we need 1 pound of nitrogen for every 1000 square feet and we have 5000 square feet, we need 5 pounds of nitrogen.
Ammonium sulfate is 21% nitrogen (round to 20%).
20% is the same as 0.20 or 1/5 . This means that we need 5 pounds of fertilizer to get 1 pound of nitrogen.
Since we need 5 pounds of nitrogen, 5 x 5 = 25 pounds of fertilizer.
Total fertilizer needed =
Example 2
Determine how much 10-10-10 needs to be applied to ensure 2 pounds of nitrogen per thousand square feet in a garden that measures 20 x 10 feet.
Garden: 20 x 10 = 200 square feet
Fertilizer: 10-10-10 = 10 percent nitrogen
Rate: 2 pounds of nitrogen per 1000 square feet
Total fertilizer needed =
Fertilizers Combined With Pesticides
Fertilizers can be combined with pesticides by the manufacturer or the applicator but must be applied at the appropriate time and rate. Always read the label carefully.
Applying Fertilizer
Fertilizer Application Rate
The amount of fertilizer applied is determined by the amount of nitrogen because it is the nutrient most easily lost from the soil. In the following chart, you can see how the amount to be applied decreases as the percentage of nitrogen increases.
Nitrogen fertilizers do not burn or damage plants if they are applied correctly. Fertilizers are salts, much like our familiar table salt, except that they contain various plant nutrients. Salts in the fertilizer begin to diffuse or move away from the place where they had been applied. This dilutes the fertilizer and distributes it through a much larger area. If tender plant roots are close to the area where the fertilizer is placed, water will be drawn from these roots and from the surrounding soil. The more salt or fertilizer applied, the more water will be drawn from nearby roots. As water is drawn from the roots, plant cells begin to dehydrate and collapse, and the plant roots burn or dehydrate to a point from which they cannot recover. If soil moisture is limited, most of the water drawn towards the salt will come from plant roots and the damage will be more severe.
Two rules should be kept in mind when applying a fertilizer during hot weather when soil moisture is limited: 1) do not over-apply nitrogen fertilizers, and 2) make sure adequate moisture is present after applying fertilizers high in salts.
Soluble salts accumulate when fertilizer is applied repeatedly without sufficient water to leach or wash the old fertilizer’s salts through the soil. It also occurs when water evaporates from the soil and leaves previously dissolved salts behind. Soluble salts will accumulate on top of the soil in a container and form a yellow-to-white crust. A ring of salt deposits may form around the pot at the soil line or around the drainage hole. Salts may also build up on the outside of clay pots.
As the salts in the soil become more concentrated, plants find it harder to take up water. If salts build up to an extremely high level, water can be taken out of the root tips, causing them to die.
Table 2-10: Fertilizer application rates as determined by goal N content
| Formula | Lbs. Fertilizer applied per 1000 square feet |
|---|---|
| 5-10-10 | 3.5 |
| 6-18-6 | 2.9 |
| 8-12-4 | 2.2 |
| 10-10-10 | 1.8 |
| 12-6-6 | 1.5 |
| 16-16-16 | 1.1 |
Timing and Method of Application
Soil type dictates the frequency of fertilizer application. Sandy soils require more frequent applications of nitrogen and other nutrients than do clay-type soils. Factors affecting the type and rate of fertilizer application include: the type of crop, the level of crop productivity required, frequency and amount of water applied, and the type of fertilizer applied and its release rate.
Timing
The type of crop influences timing and frequency of application since some crops are heavier feeders of particular nutrients than others. Root crops (such as carrots) require less nitrogen fertilization than do leafy crops (such as greens). Corn is a heavy feeder of nitrogen, while most trees and shrubs are generally light nitrogen-feeders. A general rule of thumb is that nitrogen is for leafy top growth, phosphorus is for root and fruit production, and potassium is for cold hardiness, disease resistance, and general durability.
Proper use of nutrients can control plant growth rate and character. Nitrogen is the most critical nutrient in this regard. If tomatoes are fertilized too heavily with a nitrogen fertilizer or side-dressed before fruit set, the plants may be all vegetative (shoot, stem, leaf) and no fruit. This is also the case with potatoes, which will show excess vining and poor tuber formation. If slow-release fertilizers or heavy amounts of manure are used on crops that form fruit or vegetables, vegetative growth will continue into late summer, and fruit and vegetable development will occur very late in the season. Late nitrogen fertilization can also prevent perennial plants from becoming cold-hardy, inducing cold weather injury.
Remember that a nitrogen application will have its greatest effect for 3-4 weeks after application. If tomatoes are fertilized heavily on June 1, there may be no flower production until July 1, which will, in turn, delay fruit ripening until late August. For this reason, it is important to plant crops with similar fertilizer needs close together to avoid improper rates of application.
Late fertilization (after July 1) of trees and shrubs can cause new flushes of growth to occur on woody plants that are normally adjusting themselves for the coming winter. This may delay dormancy of woody plants and cause severe winter dieback in new growth. Gardeners should be aware that individual species within these groups vary considerably. Refer to Chapter 17: “Water Quality and Conservation,” for information on fertilizer use and water quality.
Application methods
There are different methods of applying fertilizer depending on its formulation and the crop needs.
Broadcasting
A recommended rate of fertilizer is spread over the entire growing area and left to filter into the soil or incorporated into the soil with a roto tiller or spade. Broadcasting is used over large garden areas or when time or labor is limited.
Banding
Narrow bands of fertilizer are applied in furrows 2 to 3 inches from the garden seeds and 1 to 2 inches deeper than the seeds or plants. Careless placement of the fertilizer band too close to the seeds will burn the roots of the seedlings. The best technique is to stretch a string where the seed row is to be planted. With a corner of a hoe, dig a furrow 3 inches deep, 3 inches to one side, and parallel with the string. Spread half the suggested rate of the fertilizer in the furrow and cover it with soil. Repeat the banding operation on the other side of the string, then sow seeds underneath the string.
For widely spaced plants, such as tomatoes, fertilizers can be placed in bands 6 inches long for each plant or in a circle around the plant. Place the bands 4 inches from the plant base. If used in the planting hole, place the fertilizer at the bottom of the hole, work it into the soil, and add a layer of soil about 2 inches deep over the fertilized soil before putting the plant in the hole.
Banding is one way to satisfy the needs of many plants (especially tomatoes) for phosphorus as the first roots develop. When fertilizers are broadcast and worked into soil, much of the phosphorus is locked up by the soil and is not immediately available to the plant. By concentrating the phosphorus in the band, the plant is given what it needs even though much of the phosphorus stays locked up.
Starter solutions
Another way to satisfy the need for phosphorus when setting out transplants of vegetables and flowers is through the use of a liquid fertilizer high in phosphorus as a starter solution. Follow directions on the label.
Side-dressing
Dry fertilizer is applied as a side dressing after annuals are up and growing. Scatter fertilizer on both sides of the row 6 to 8 inches from the plants. Rake it into the soil and water thoroughly.
Foliar feeding
Foliar feeding (spray of fertilizer applied to foliage) is used when insufficient fertilizer was used before planting, when a quick growth response is wanted, when micronutrients (such as iron or zinc) are locked into the soil, or when the soil is too cold for the plants to use the fertilizer applied to the soil. Foliar-applied nutrients are absorbed and used by the plant quite rapidly. Absorption begins within minutes after application and, with most nutrients, it is completed within 1 to 2 days.
Foliar nutrition can be a supplement to soil nutrition at a critical time for the plant, but not a substitute. At transplanting time, an application of phosphorus spray will help in the establishment of the young plant in cold soils. For perennial plants, early spring growth is usually limited by cold soil, even when the air is warm. Under such conditions, soil microorganisms are not active enough to convert nutrients into forms available for roots to absorb; yet, if the nutrients were available, the plants could grow. A nutrient spray to the foliage will provide the needed nutrients immediately, allowing the plants to begin growth.
Soil and Nutrient Problems
Erosion
- Insufficient vegetative cover
- Overexposure through the use of cultivated crops on soils not suited to cultivation
- Improper equipment and methods used in preparation and tillage of the soil.
- Producing crops to which the soil is suited
- Mulching
- Thorough soil preparation
- Proper tillage methods
- Adequate fertilization and liming to promote vigorous growth of plants

Nutrients as Pollutants
Nitrogen and phosphorus are currently major sources of pollution in our waterways. Excess nutrients come from sewage treatment plants, automobile exhaust, animal wastes, excess nutrients applied to agricultural fields, excess nutrients applied to home lawns and gardens or failing septic fields. These pollutants can come from organic or synthetic sources. Once these nutrients are in the water, they become available for algae growth. A large, quick growth of algae is referred to as an algae bloom. Once the algae has used up the available flush of nitrogen and phosphorus, it quickly dies and bacteria begins to break it down. This bacteria uses oxygen to help break down the algae, causing oxygen levels in the water to crash. Water low in dissolved oxygen causes fish and other aquatic animals to perish.
Nitrogen is mobile in the soil. It can easily leach out of the soil or run off the soil surface with the movement of water and easily end up in waterways where it contributes to algae blooms. Phosphorus on the other hand is not usually mobile in the soil. Phosphorus binds with clay particles and organic matter in the soil. Plants are then able to use the phosphorus associated with organic material and soil particles. Phosphorus usually becomes a pollutant in our waterways when it is washed into streams, and creeks while attached to a soil particle. Thus it is important to limit the amount of soil erosion. Another factor that makes phosphorus toxic to our waterways is the fact that algae are much more responsive to phosphorus than to nitrogen. Thus, a small amount of phosphorus can trigger the same algae bloom as a much larger amount of nitrogen.
Since nitrogen and phosphorus have been identified as pollutants, one might expect Virginia Cooperative Extension to recommend not using fertilizers on lawns and gardens in the future. The answer is much more nuanced than this. When plants have the nutrients they need available to them, they are healthier, grow thicker and denser, and their roots are stronger. They hold soil better and limit erosion. Thus, these plants help to limit the amount of nitrogen and phosphorus that end up in our waterways. Conversely, if plants don’t have enough nutrients to thrive and stay healthy, they are often spindly and small, and they may not be able to hold soils in place as well as we would like and may contribute to soil erosion. Thus, the results of a soil test are invaluable to help determine the need for nutrient amendments, as well as the form and amount needed. Nutrients applied correctly are beneficial. When misapplied, they can become pollutants.
Our communities are making concerted efforts to help limit the excess nutrients that end up in our waterways. Virginia law prohibits the sale of synthetic fertilizers with phosphorus for maintenance purposes. Phosphorus fertilizers are, however, allowed to be used for establishing new plantings or for use on sites that are low in phosphorus according to a soil test.
Areas inappropriate for fertilizer application
Some locations are inappropriate for fertilizer application. They create a high potential for runoff and/or leaching, in which case the fertilizer then becomes an environmental pollutant. Detailed information on each of these types of locations is given below.
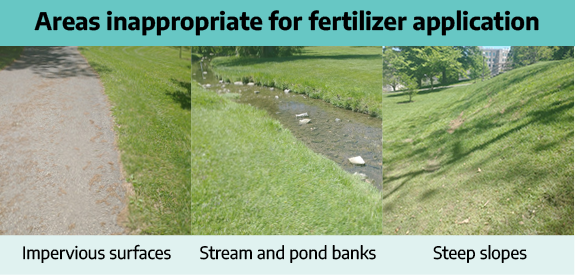
- Impervious surfaces: Driveways, sidewalks and other paved areas should not have fertilizers applied to them. During lawn fertilization some fertilizer may spread to these areas and this fertilizer should be swept or blown back into the planting areas. Fertilizers should not be used as deicers in the winter.
- Soils with high water table: Fertilizer is more likely to move into water where there are soils that do not drain well or there is a high water table. Individuals should be cautious about applying fertilizers in these areas.
- Stream and pond banks: In places where a lawn goes directly to the edge of a stream or pond, a buffer should be left in place. An area of turf grass that is 20 feet from the water should not be fertilized and ideally there is an area of vegetation that is thicker and taller than a lawn that is typically mowed weekly during the growing season.
- Well heads and rock outcroppings: Both of these sites have the potential to take surface water directly into local ground water. And as such a buffer or no fertilization zone should be left around these sites.
- Karst bedrock: Many areas of Virginia have limestone based bedrock. This limestone dissolves over time and often there are channels or sinkholes that provide immediate movement of surface water into ground water. Use fertilizers in these areas cautiously.
- Steep slopes: Steep slopes have a high potential to have fertilizers wash away. Slow release fertilizers work best in these situations.
Keeping soils covered with healthy plants is the best way to limit the amount of nutrients that end up in local waterways. But where plants are absent it is helpful to have the soil covered. Hardwood or pine bark mulch and other plant based mulches can be helpful to limit erosion and nutrients reaching water.
Compaction
Compaction is the process in which a stress applied to a soil causes loss of pore space, such as equipment traffic on wet soils. The measure of soil bulk density, which is the ratio of dry weight of a soil sample divided by its volume, determines the bulk density or compaction. As the dry weight increases relative to the volume, porosity in the soil decreases and compaction increases. This situation restricts root, air and water movement and leads to plant stress. Urban soils tend to be moderately to heavily compacted because of the amount of traffic they receive during construction or landscaping.
Urban Soils
Soils in urban environments provide unique challenges. One primary challenge is to provide the functions of the natural environment in a built environment. While some plants are adaptable to a fairly wide range of environmental conditions, others have a narrow range in which they will grow well. For example, urban soils will often have a higher pH than surrounding rural areas due to limestone-containing materials in the urban environment (Bassuk, Curtis, Marranca, and Neal). For plants that require a specific pH range in order to thrive, the higher pH of urban soils can cause stress to the plant. Other challenges of urban soil are compaction and the removal of topsoil during construction. For more about urban soils, see the VCE Master Gardener Tree Steward Manual.
Salinity
Soil salinity falls into two categories:
Primary salinity is the result of natural processes such as erosion. It can also be seen in land near the ocean, where salts are accumulated through salt spray brought by wind and deposited in the soil by rain. Primary salinity can occur over very long periods of time.
Secondary salinity results from human activity and occurs more quickly than primary salinity. Continuous irrigation and fertilization of agricultural areas results in a buildup of salts in the top layers of the soil. Removal of natural vegetation to make space for annual agricultural crops destroys perennials that have adapted to their environment. Removing perennials and planting annuals often requires irrigation that can expose plants to higher salinities. For more information about salinity and the problems it can cause plants, see Chapter 5 “Abiotic Stress Effects on Plant Growth and Development.”
Additional Resources
- Virginia Tech Soil Testing Lab
- “Making Compost from Yard Waste” 426-703
- “Compost – What Is It and What Is It to You” 452-231
- Shrivastava, P., & Kumar, R. (2015). Soil salinity: A serious environmental issue and plant growth promoting bacteria as one of the tools for its alleviation. Saudi journal of biological sciences, 22(2), 123–131. https://doi.org/10.1016/j.sjbs.2014.12.001
- USDA NRCS Soil Health information
- USDA NRCS Soil Classification educational website
References
“Soil Food Web” section adapted from “Soil Food Web” By Elaine R. Ingham, USDA Natural Resources Conservation Service. https://www.nrcs.usda.gov/wps/portal/nrcs/detailfull/soils/health/biology/?cid=nrcs142p2_053868
“Urban Soils” section adapted from VCE Master Gardener Tree Steward Manual Chapter 6: Soil Properties and Management by Gwen Harris and Cherilyn Kern.
“Salinity” section adapted from Chapter 5: Abiotic Stress by David Orcutt
“Soil orders found in Virginia” section from VCE Master Gardener Tree Steward Manual Chapter 6: Soil Properties and Management by Gwen Harris and Cherilyn Kern.
Citations
Bassuk, N., Curtis, D., Marranca, B.Z., Neal, B. (n.d.) Recommended Urban Trees: Site Assessment and Tree Selection for Stress Tolerance. Urban Horticulture Institute, Department of Horticulture, Cornell University. http://www.hort.cornell.edu
Attributions
Adapted from the Soils and Nutrient Management chapters in the 2015 Extension Master Gardener Handbook.
- Mimi Rosenthal, Norfolk Extension Master Gardener (2021 reviser and contributor)
- Ralph Morini, Albemarle/Charlottesville Extension Master Gardener (2021 reviser)
- Doug Levin, Washington County Extension Master Gardener (2021 reviser)
- Paige Thacker, Extension Agent, Agriculture and Natural Resources (Prepared 2015 Nutrient Management chapter)
- Thomas Bolles, Environmental Educator (Prepared 2015 Nutrient Management chapter)
- Tim Ohlwiler, Extension Agent, Agriculture and Natural Resources (Prepared 2015 Nutrient Management chapter)
- Jim Owen, Assistant Professor of Agriculture (2015 Nutrient Management chapter reviewer)
- Dan Nortman, Extension Agent, Agriculture and Natural Resources (2015 Soils chapter reviser)
- Pattie Bland, Urban Conservationist, Hanover-Caroline Soil and Water Conservation District (2015 Soils chapter reviewer)
- Stephen J. Donahue, Extension Specialist, Soil Testing and Plant Analysis (2009 Soils chapter reviser)
- Steve Heckendorn, Laboratory Manager, Virginia Tech Department of Crop and Soil Environmental Science (2009 Soils chapter reviser)
- Louis Judson, VCE Master Gardener (2009 Soils chapter reviser)
Image Attributions
- Figure 2-1: Soil composition. Johnson, Devon. 2022. CC BY-NC-SA 4.0.
- Figure 2-2: Effects of texture on capacity of soils to hold water. Grey, Kindred. 2022. CC BY-NC-SA 4.0.
- Figure 2-3: Soil horizon diagram. Johnson, Devon. 2022. CC BY-NC-SA 4.0.
- Figure 2-4: Soil composition diagram. Johnson, Devon. 2022. CC BY-NC-SA 4.0.
- Figure 2-5: Soil texture triangle. Johnson, Devon. 2022. CC BY-NC-SA 4.0.
- Figure 2-6: Virginia’s dominant soil orders. USDA-NRCS. [ArchivedPage] Public Domain.
- Figure 2-7: Soil structure. Johnson, Devon. 2022. CC BY-NC-SA 4.0.
- Figure 2-8: Reedville Demonstration Living Shoreline. Cheyne, Ian. 2021. CC BY-NC-SA 4.0.
- Figure 2-9: EMGs conduct a shoreline management class. Duhring, Karen. 2021. CC BY-NC-SA 4.0.
- Figure 2-10: pH range. Grey, Kindred. 2022. CC BY-NC-SA 4.0.
- Figure 2-11: Nutrient availability by pH. Johnson, Devon. 2022. CC BY-NC-SA 4.0.
- Figure 2-12: Soil food web. USDA-NRCS. Public Domain.
- Figure 2-13: Fertilizer will be labeled with three numbers giving percentage by weight of nitrogen, phosphate, and potash. Johnson, Devon. 2022. CC BY-NC-SA 4.0.
- Figure 2-14: Drainage slopes. Grey, Kindred. 2022. CC BY-NC-SA 4.0.
- Figure 2-15: Areas inappropriate for fertilizer application include impervious surfaces (sweep any fertilizer back into planting area), stream banks, and steep slopes. Johnson, Devon. 2022. CC BY-NC-SA 4.0.
Plant and animal material in varying stages of decomposition present in soil.
The portion of organic matter that remains after most decomposition has taken place
Peds are made up of mineral particles (clay, silt, sand) and organic matter; held together by the electrical charges on the surfaces of the minerals and organic matter
Contains more organic matter than the other soil layers. Organic matter gives a gray, dark-brown, or black color to the surface horizon
Usually finer and firmer than the surface soil. Organic matter content of the subsoil is usually much lower than that of the surface layer.
Bottom soil horizon, decomposed rock that has acquired some characteristics of the subsoil and retained some characteristics of the rock from which it weathered.
The ability of soil to sustain plant growth
Coarser mineral particles of the soil
Relatively fine soil particles that feel smooth and floury. When wet, silt feels smooth but is not slick or sticky.
The finest soil particles
A textural class of soil that has moderate amounts of sand, silt, and clay
A measure of the total negative charges within the soil that adsorb plant nutrient cations
Chemical claws that help hold metal ions, such as iron, in solution, so that the plant can absorb them
