14 Linkage Studies, Pedigrees, and Population Genetics
Learning Objectives
Linkage studies and pedigrees
- Interpret a pedigree for type of inheritance.
- Describe how Mendelian disease genes are identified by linkage mapping.
Population genetics
- Perform simple Hardy-Weinberg calculations for autosomal recessive disease.
- Recognize populations that are not in Hardy-Weinberg equilibrium.
- Understand the following terms related to genetic variation: polymorphism, SNP, haplotype, HapMap.
About this Chapter
Single gene inheritance is also referred to as Mendelian inheritance and follows transmission patterns he observed in his research on peas. These are the most basic patterns of inheritance, and within each category, there can be nuances of disease presentation. The frequency of these disorders in populations can be determined using Hardy-Weinberg calculations.
It is important to remember that these inheritance patterns are not characteristic of all genetic traits, and there are many factors that influence an individual’s phenotype.
14.1 Mendelian Inheritance
There are four basic types of Mendelian inheritance patterns: autosomal dominant, autosomal recessive, X-linked recessive, and X-linked dominant. Autosomal inheritance patterns suggest that the gene responsible for the phenotype is located on one of the twenty-two pairs of autosomes (non-sex determining chromosomes). This is in contrast to X-linked traits where the gene that encodes for the trait is located on the X chromosome.
Traits can be either dominant or recessive in nature such that in the case of dominant traits conditions manifest in heterozygotes (individuals with just one copy of the mutant allele).
Recessive traits
- Recessive conditions are expressed in individuals who have two copies of the mutant allele. Keep in mind, the two recessive alleles may have two different mutations to produce a recessive individual (heteroallelic).
- When just one copy of the mutant allele is present, an individual is a carrier of the mutation but does not develop the condition.
- Females and males are affected equally by traits transmitted by autosomal recessive inheritance.
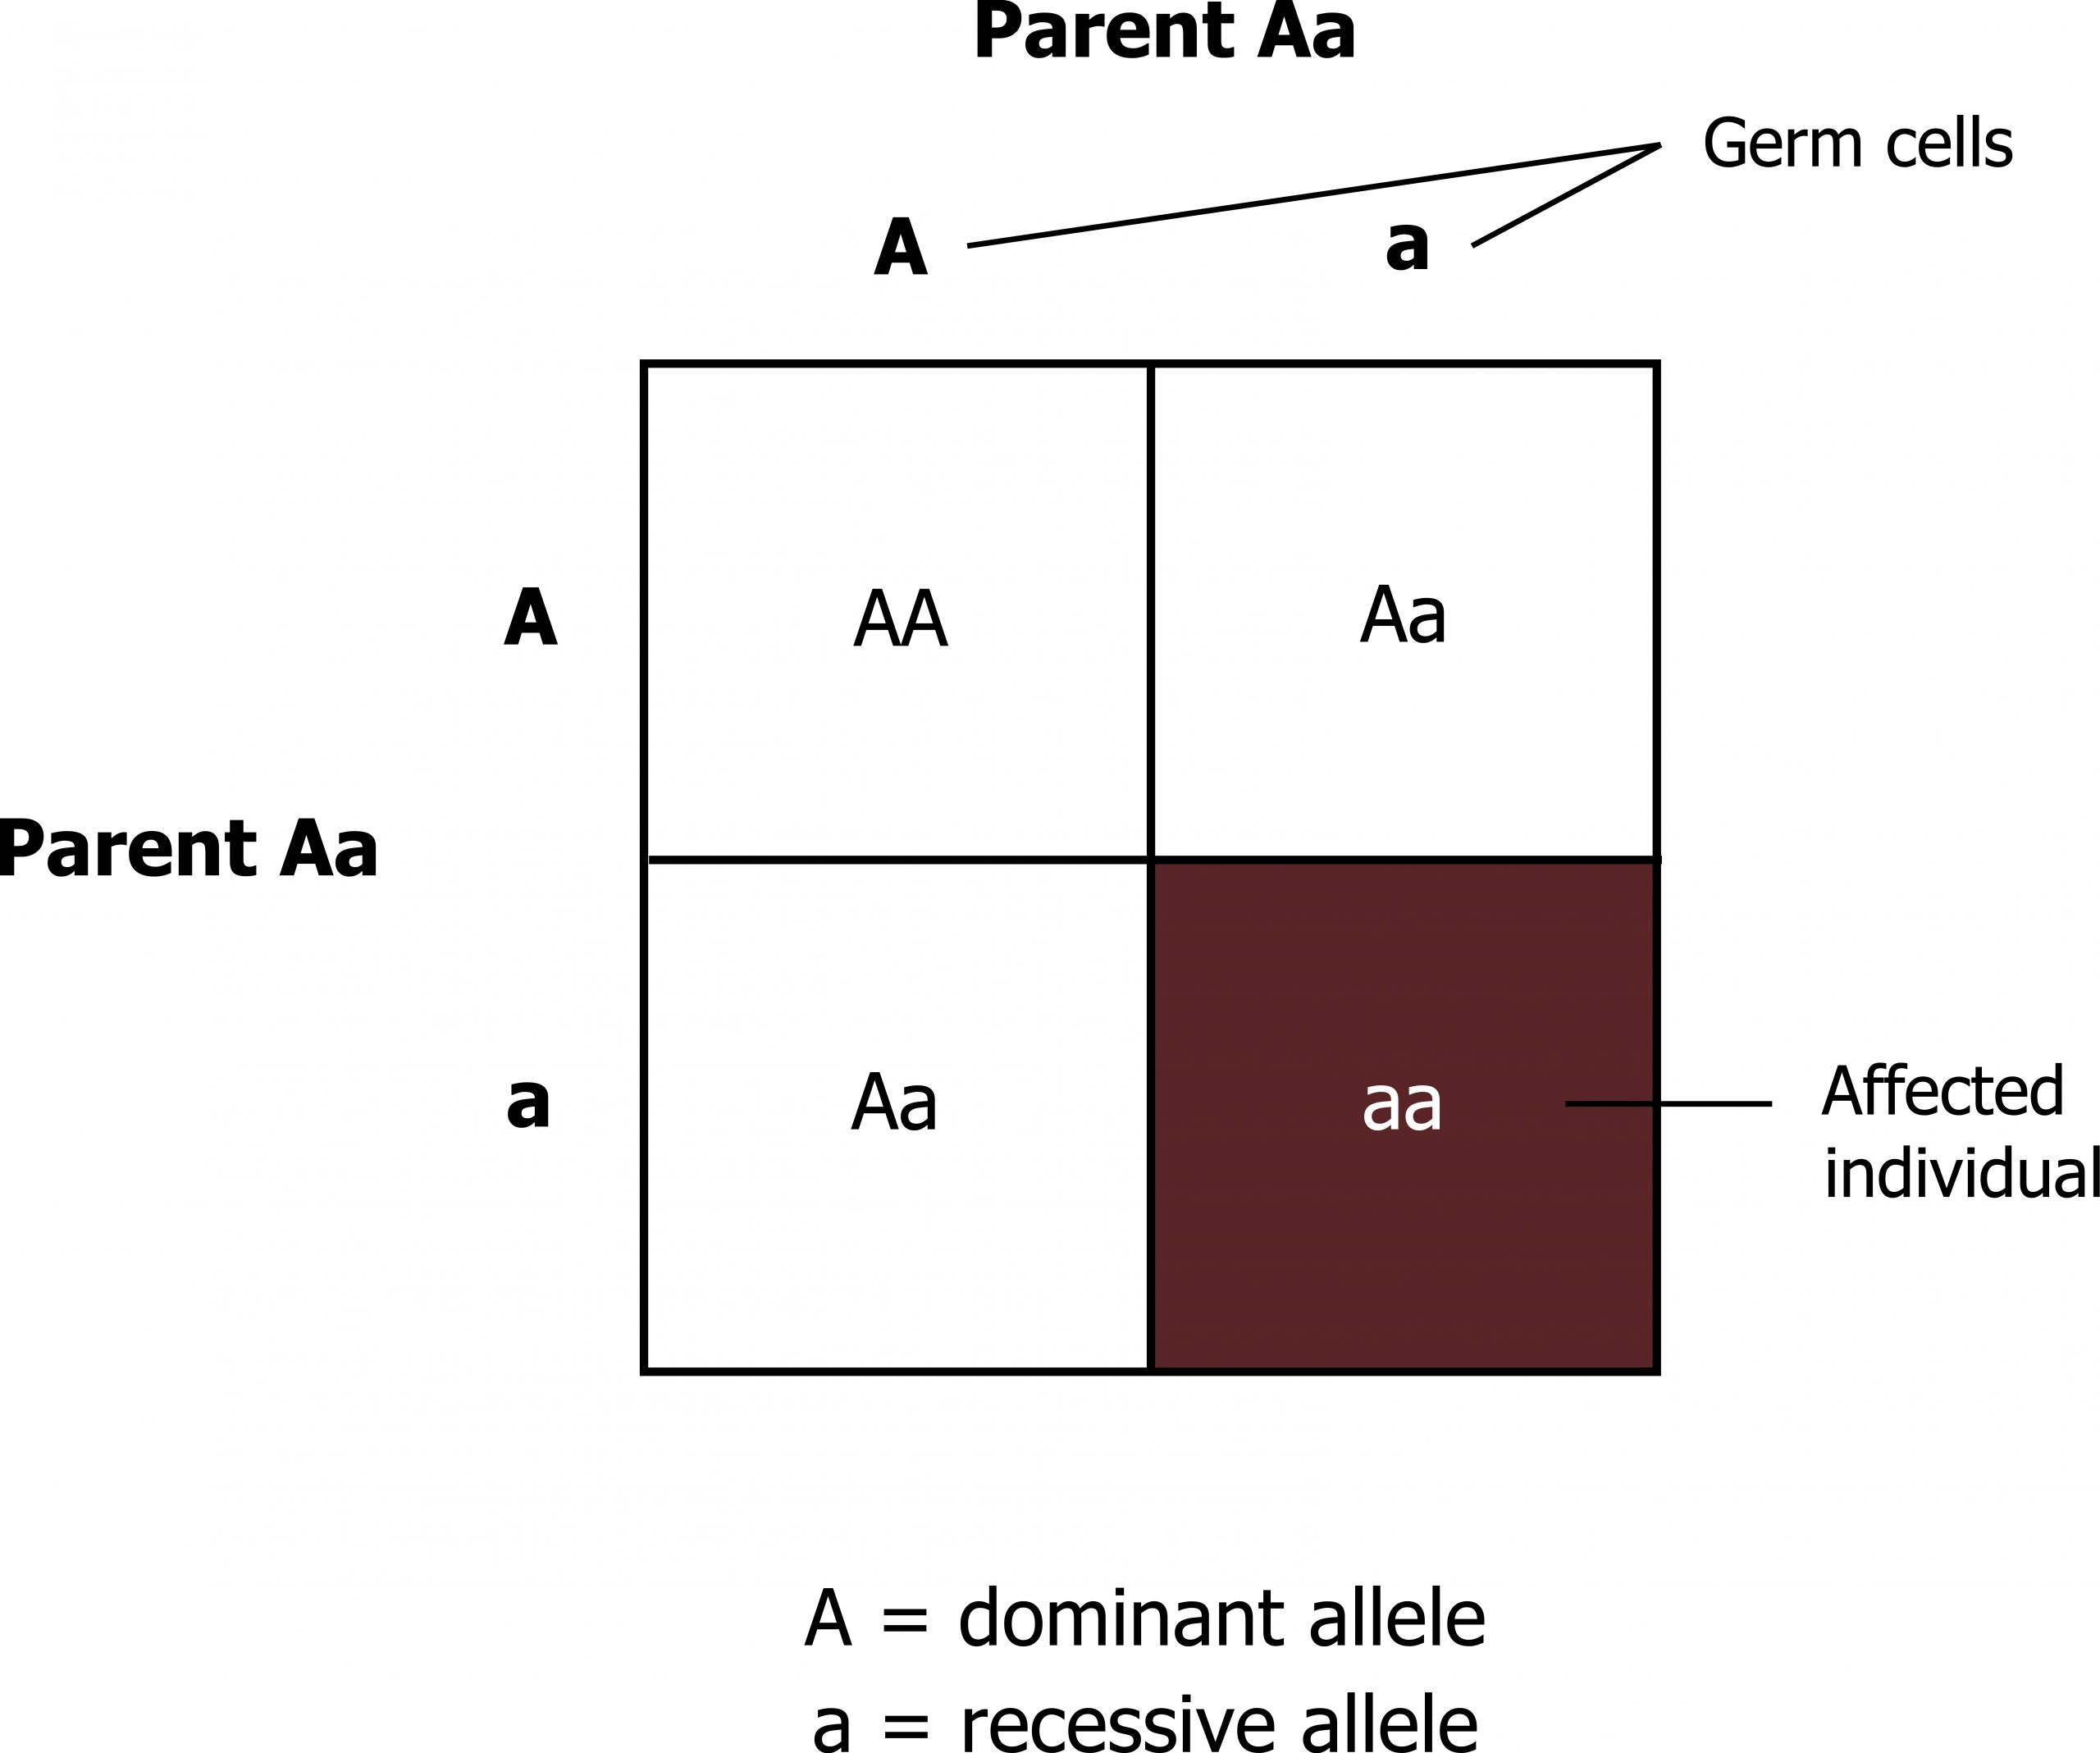
- A heterozygous carrier for a recessive mutation has a 50 percent probability of transmitting this mutation to a child (figure 14.1).
- If both partners are heterozygous carriers for the same autosomal recessive disease, the risk for transmission to offspring is as follows:
- 25 percent of the offspring of the couple will be homozygous (or compound heterozygous) for the disease-causing allele and thus be affected by the disorder.
- 50 percent of the offspring will be healthy heterozygous carriers just as their parents.
- 25 percent will be homozygous for the wild-type allele.
When speaking of the children of carrier parents, two-thirds of the healthy siblings of an affected child are heterozygous carriers.
If an individual with an autosomal recessive disorder has children, a disease-causing mutation will be transmitted to all of them (either of the two mutant alleles). The consequences for the child depends on this individual’s partner. If the partner is homozygous for the normal allele of the respective gene (as in the majority of cases), all offspring will be nonaffected heterozygous carriers. If the partner, however, is a carrier (the likelihood is approximately 0.5 to 1 percent for the more frequent recessive disorders), statistically, half of the offspring will be affected (homozygous or compound heterozygous), and the other half will be carriers. If both partners should have the same recessive disorder (caused by mutations in the same gene), all offspring will be homozygous/compound heterozygous and affected.
Dominant traits
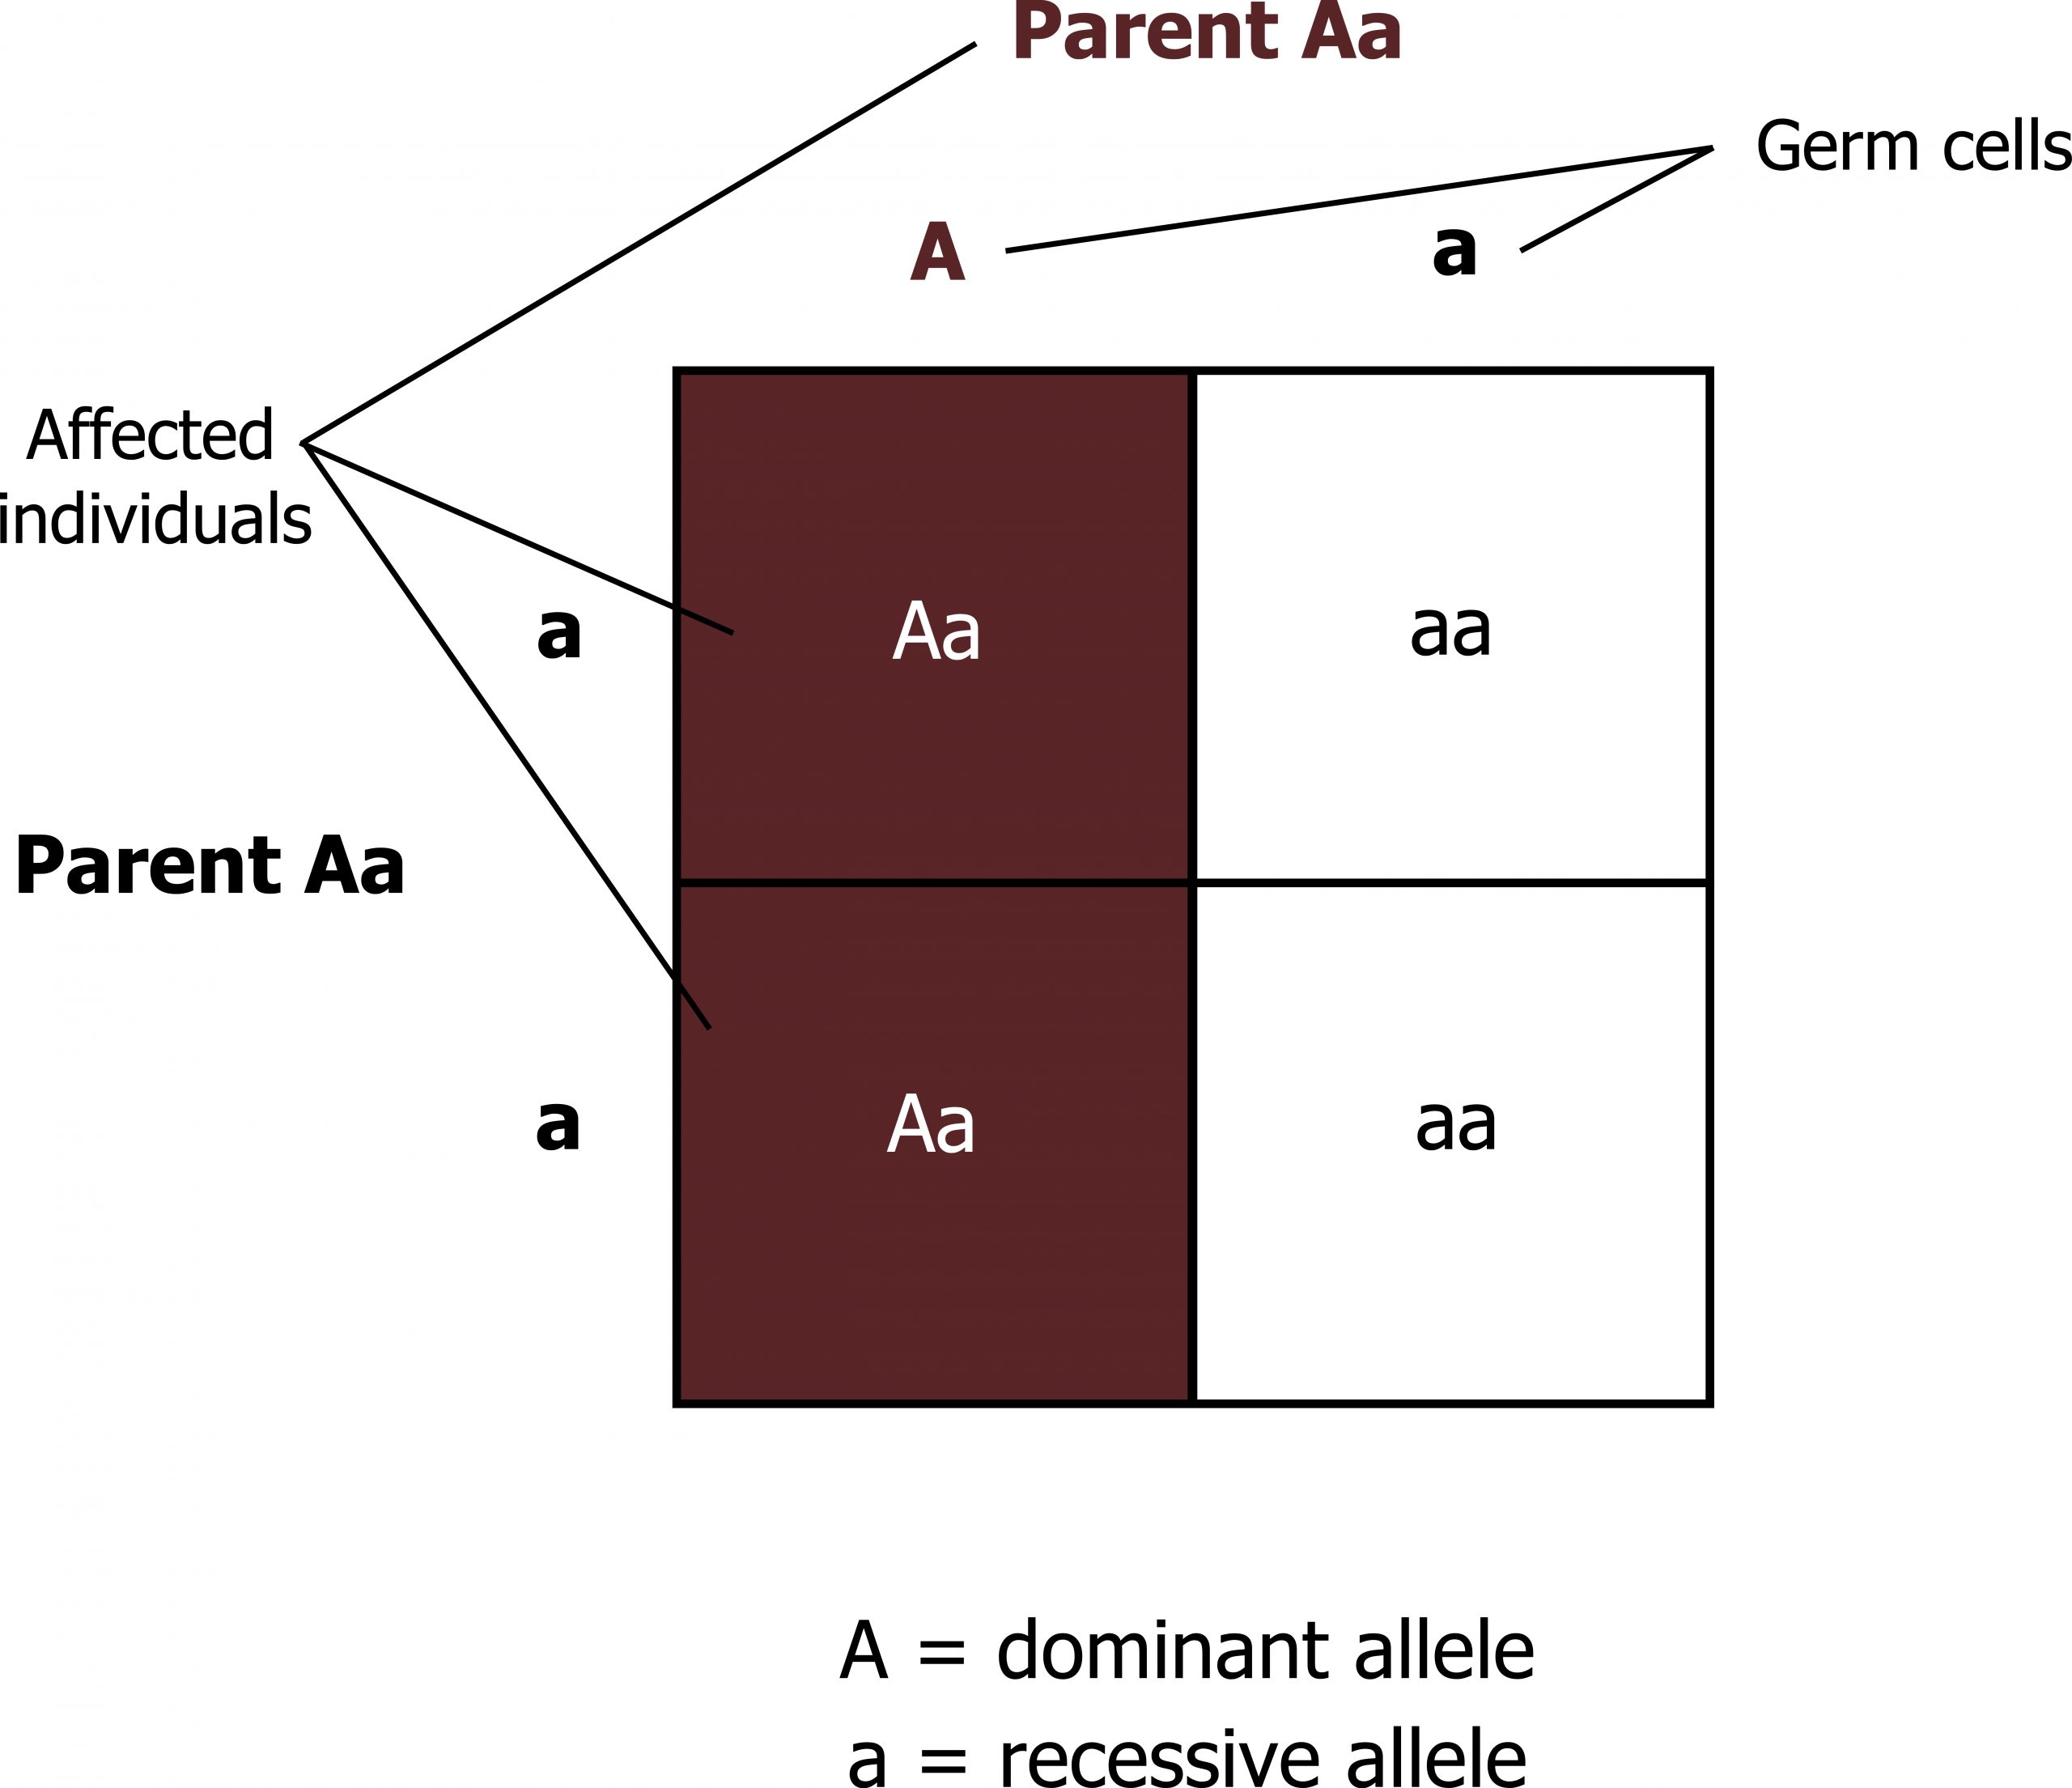
- Dominant conditions are expressed in individuals who have just one copy of the mutant allele.
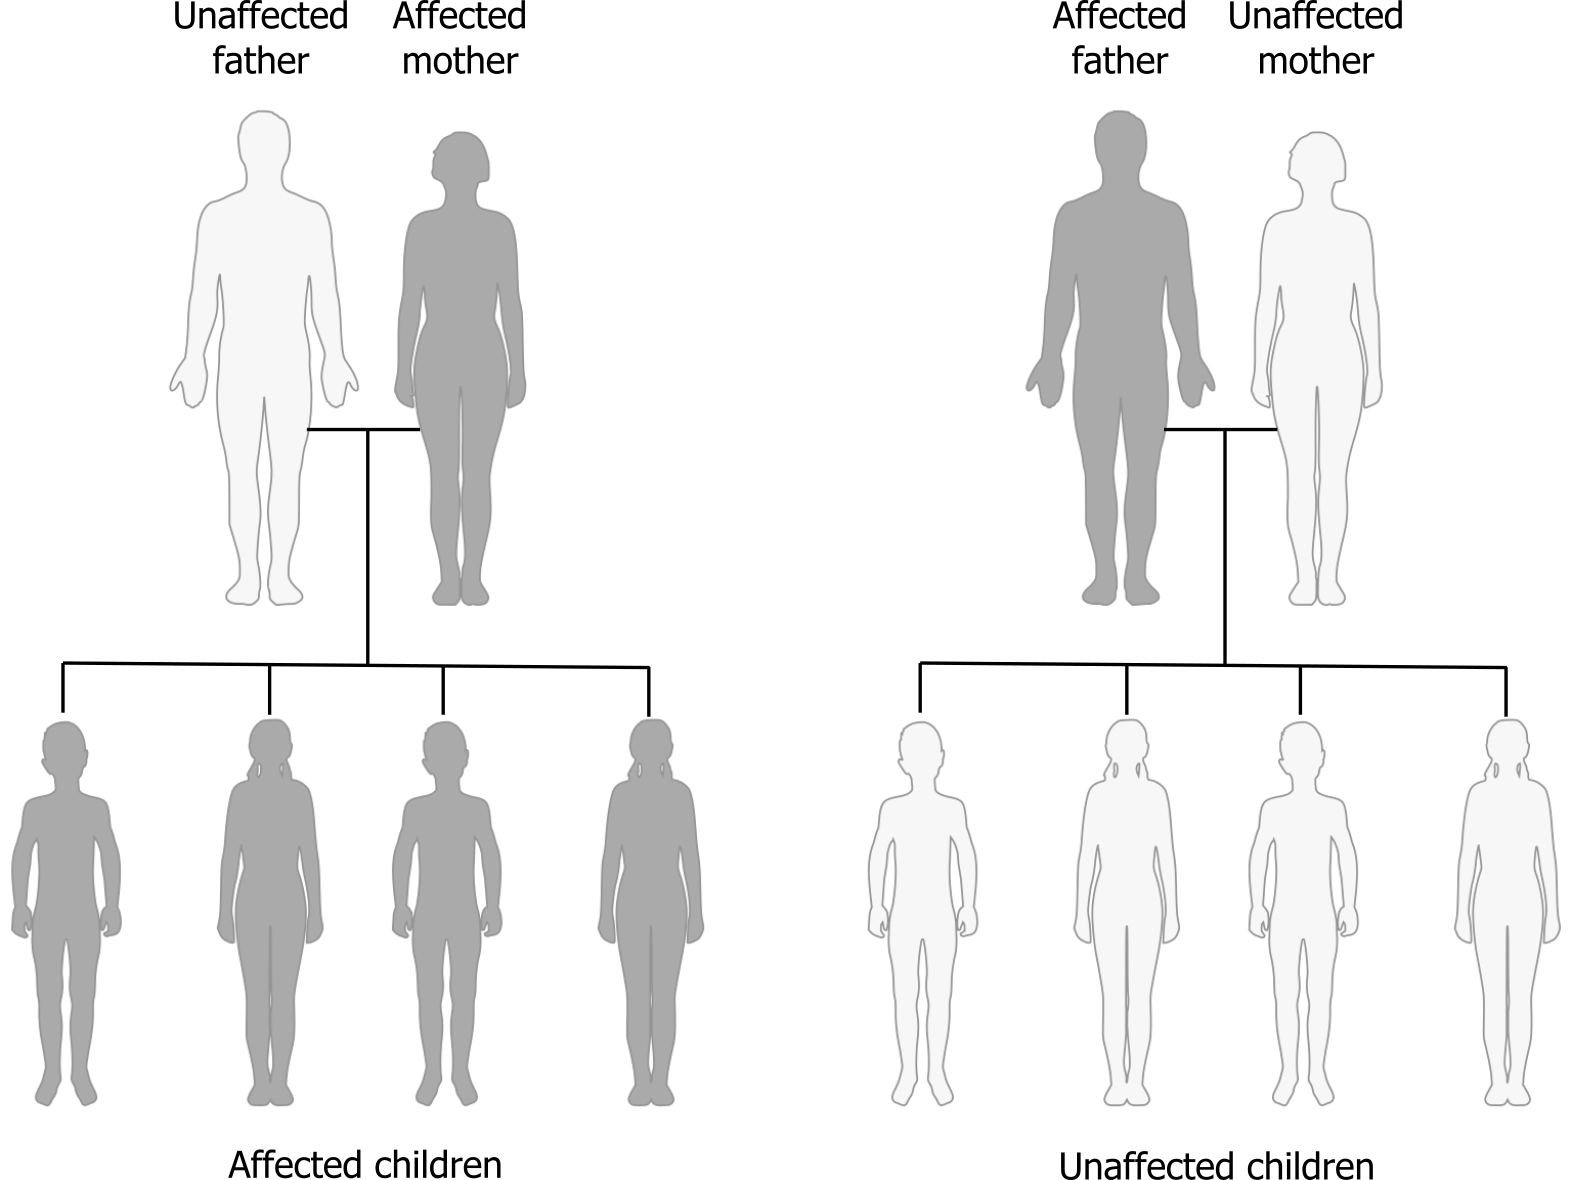
- Females and males are affected equally by traits transmitted in an autosomal dominant fashion.
- Affected individuals have one normal copy of the gene and one mutant copy of the gene; thus each offspring has a 50 percent chance on inheriting the mutant allele (figure 14.2).
Semidominance or incomplete dominance
For most disorders inherited as dominant traits, homozygosity for a disease-causing mutation results in a much more severe clinical phenotype than heterozygosity. An example is familial hypercholesterolemia, a genetic disorder resulting from mutations of the low-density lipoprotein (LDL) receptor gene. Individuals with a heterozygous loss-of-function mutation show elevated LDL cholesterol levels (greater than 7 to 10 mmol/ L) and typically suffer their first myocardial infarction in midlife. Homozygous individuals have a much higher LDL cholesterol level (10 to 30 mmol/ L), with the onset of symptoms in early childhood and coronary heart disease as early as school age.
In these examples, the phenotype of heterozygotes (Aa) is somewhere in between the phenotypes of wild-type and mutant homozygotes (AA and aa). The inheritance pattern is called semidominant or incompletely dominant, in contrast to complete dominance that is found in very few conditions, such as Huntington’s disease, in which the phenotype of the heterozygous and homozygous mutation carriers is more or less identical. It is worth thinking about reasons why a condition may show complete penetrance. For practical purposes, both types of conditions may be called dominant because the definition rests on the clinical phenotype in the heterozygote, irrespective of what is observed in the homozygote.
Codominance
There are a few cases in which two alleles of the same gene code for proteins with different specific functions, both of which may be found simultaneously in (compound) heterozygous individuals. Such alleles are said to be codominant to each other. The classic example is the ABO blood group system, in which individuals with genotype AB show phenotypic characteristics of allele A as well as allele B, and there is also a null allele that causes complete loss of protein function.
Sex-linked traits
X-linked recessive traits do not typically manifest when there is a normal copy of the gene (e.g., in females). In contrast nearly all X-linked recessive traits are fully evident in males because they only have one copy of the X chromosome, and thus do not have a normal copy of the gene to compensate for the mutant copy. For that same reason, women are rarely affected by X-linked recessive diseases, however, they are affected when they have two copies of the mutant allele.
If a man is affected with an X-linked recessive condition:
- All his daughters will inherit one copy of the mutant allele from him; there is no male-to-male transmission.
- All daughters are obligate heterozygotes and may be either asymptomatic carriers or have variable (less severe) symptoms of the disorder.
- On average, 25 percent of the daughtersʼ children (50 percent of her sons) will be affected with the disorder of their grandfather, 25 percent of children (50 percent of her daughters) will be heterozygous females, while 50 percent of the children will inherit the normal allele from their mother.
- All sons of an affected male will have inherited the Y chromosome of their father and, therefore, will not be affected and will not transmit the disorder to their children.
X-linked dominant disorders clinically manifest when only one copy of the mutant allele is present. There is no transmission from father to son, but there can be transmission from father to daughter (all daughters of an affected male will be affected since the father has only one X chromosome to transmit). Children of an affected woman have a 50 percent chance of inheriting the X chromosome with the mutant allele. Phenotypic presentation of X-linked traits can be influenced by lyonization or X-inactivation. As one X chromosome is randomly expressed in all female cells, the differential patterns of X-inactivation can alter phenotype in female carriers of X-linked recessive disorders and X-linked dominant disorders.
Calculation of risk
One of the most important considerations of genetic counseling is calculating risk. Mathematics is only the first step; equally important is communicating the probability that the event will occur. There are a number of ways to say that an event will not occur with absolute certainty. Studies have shown that these terms are understood and evaluated differently by different individuals. Another factor that varies between patients is that events are evaluated according to whether the result will be considered positive or negative and by which consequences they will have. For example, the probability that, beginning at age forty-five, mothers have a 5 percent risk of giving birth to a child with a chromosomal disorder is generally considered a high risk. In cancer, on the other hand, a survival chance of 5 percent is considered low.
Hardy-Weinberg equations
The Hardy-Weinberg law rests on the assumption that there are two different alleles at a certain locus; these alleles are named “p” and “q” (i.e., a normal allele [traditionally p] and a variant allele [traditionally q]). Since there are only these two alleles, p + q = 1.
In humans, if the respective gene occurs in two copies on only one autosome, the frequency of the three possible genotypes is calculated from the binominal distribution, which is often represented as:
p2 + 2pq + q2 = 1
p is the frequency of the ʻAʼ allele
q is the frequency of the ʻaʼ allele
p2 = the frequency of the AA genotype
q2 = the frequency of the aa genotype
2pq = the frequency of the Aa genotype
The Hardy-Weinberg law only applies to an “ideal population” that meets the following criteria:
- Mating within the population occurs randomly, with equal probability and equal success for the various genotypes.
- The population is large enough to prevent random events (gene drift) from affecting the allele frequency.
- There is no selection advantage or disadvantage for carriers of certain genotypes.
- There are no new mutations.
- There are no migration events that might alter the allele frequency.
The one factor that has practical implications among this group of criteria is random mating, since the Hardy-Weinberg law cannot be applied if there is frequent intermarriage. In such cases, rare recessive disorders occur with much greater frequency than would be expected from the frequency of heterozygosity. The other criteria are more relevant to whether or not the allele or genotype frequencies remain constant or whether the incidence of a disorder changes.
Example
Cystic fibrosis is a recessive condition that affects 1/2,500 births in the Caucasian population:
Frequency of the recessive allele:
q2 = 1/2,500 = 0.0004
q = 0.02
Frequency of the dominant allele:
1 – 0.02 = 0.98 = p
14.1 References and resources
Text
Clark, M. A. Biology, 2nd ed. Houston, TX: OpenStax College, Rice University, 2018, Chapter 10: Cell Reproduction, Chapter 12: Mendel’s Experiments and Heridity, Chapter 13: Modern Understandings of Inheritance.
Le, T., and V. Bhushan. First Aid for the USMLE Step 1, 29th ed. New York: McGraw Hill Education, 2018, 55–59.
Nussbaum, R. L., R. R. McInnes, H. F. Willard, A. Hamosh, and M. W. Thompson. Thompson & Thompson Genetics in Medicine, 8th ed. Philadelphia: Saunders/Elsevier, 2016, Chapter 7: Patterns of Single Gene Inheritance, Chapter 9: Genetic Variations in Populations, Chapter 10: Identifying the Genetic Basis for Human Disease.
Figures
Grey, Kindred, Figure 14.1 Punnett square illustrating allelic distribution of recessive traits. 2021. https://archive.org/details/14.1_20210926. CC BY 4.0.
Grey, Kindred, Figure 14.2 Allelic distributions in dominant traits. 2021. https://archive.org/details/14.2_20210926. CC BY 4.0.
Additional resources
- Hardy-Weinberg problems: https://www.k-state.edu/parasitology…/hardwein.html
- Practice pedigrees: https://ocw.mit.edu/courses/biology/…ntals-of-biology-fall-2011/genetics/pedigrees/MIT7_01SCF11_3.3sol1.pdf
- Practice pedigrees: https://www.khanacademy.org/science/high-school-biology/hs-classical-genetics/hs-pedigrees/a/hs-pedigrees-review
14.2 Non-Mendelian Inheritance
The majority of genetic disorders are not inherited in a Mendelian fashion. Even in cases where Mendelian genetics can predict genotype, the disease phenotype may not be displayed or may be variable due to external influences. This section describes some additional factors that influence presentation and inheritance patterns.
Penetrance refers to the display of any signs or symptoms if you have the genetic abnormality; this does not describe the variety of phenotype. As illustrated in figure 14.3, this refers to the number of “affected (purple)” versus “unaffected (white)” cells in an individual. Individuals with a greater number of purple cells may have a more pronounced phenotype than individuals with greater numbers of white cells.
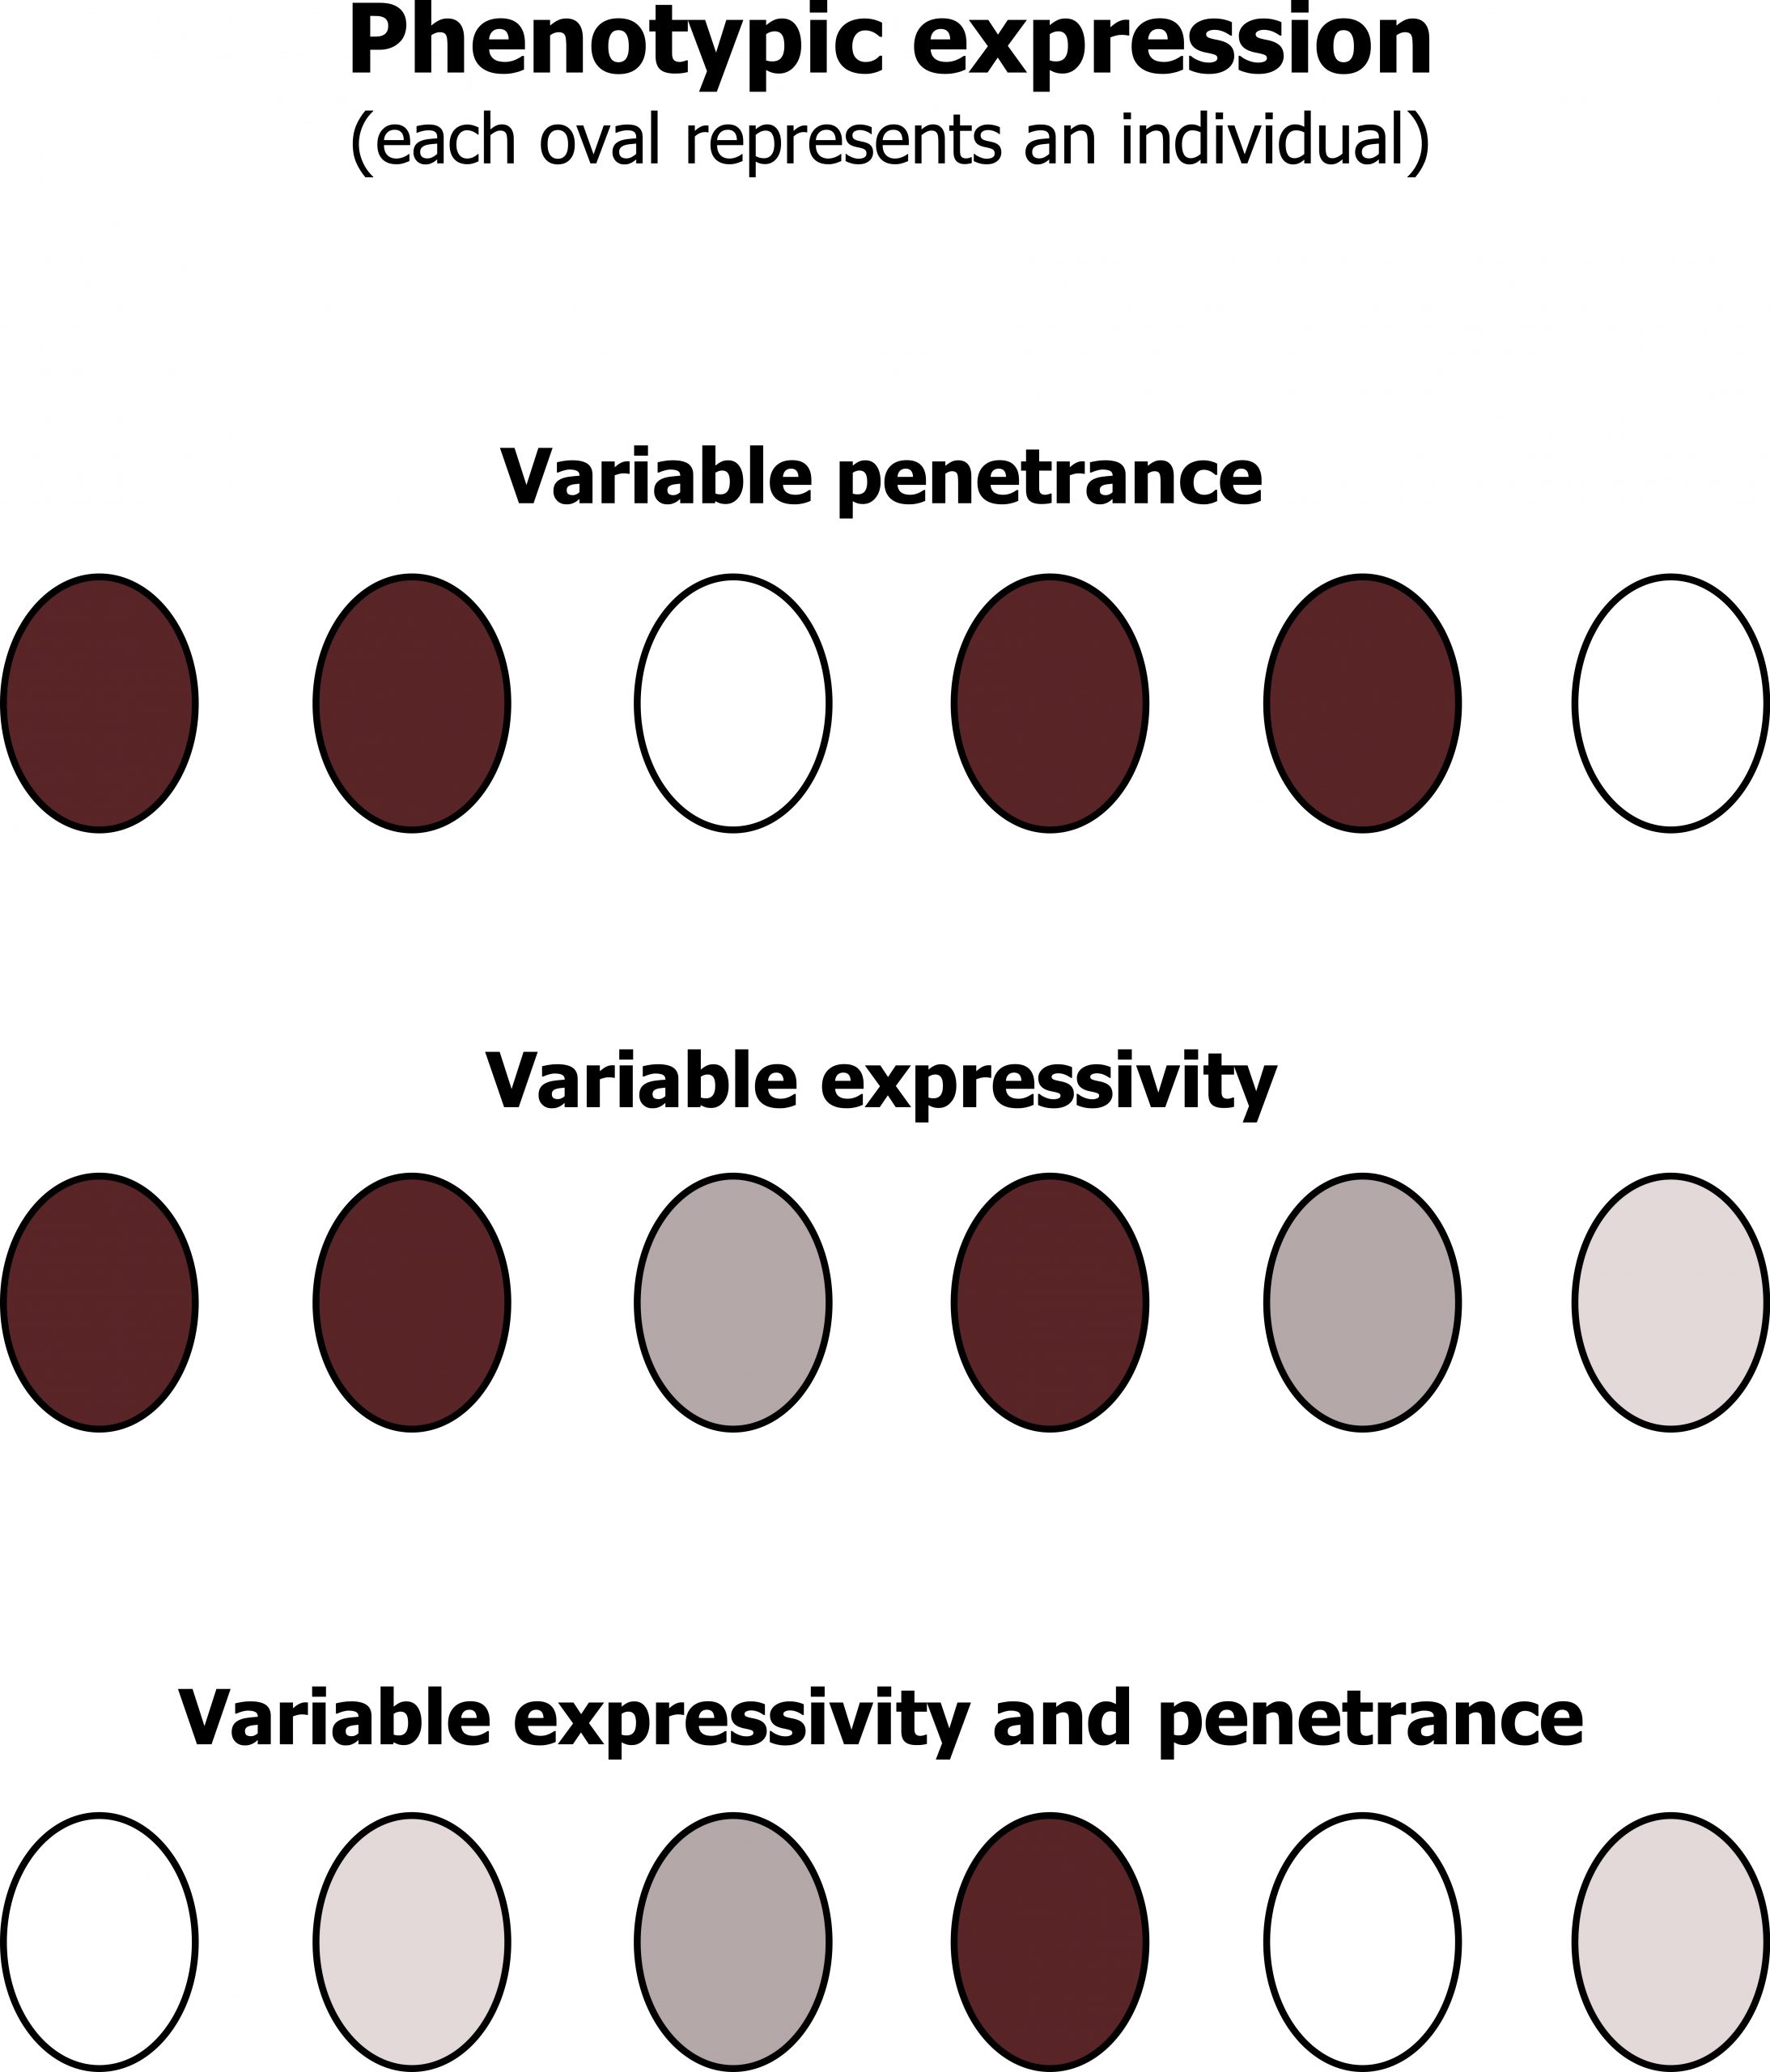
Variable phenotypes can present due to changes in expressivity or pleiotropy. These terms refer to the variety of presentations from a single genetic disorder (variable expression). As illustrated in figure 14.3, expressivity can be a range of “purplish” colors, which may give rise to a variable phenotype. In other more complicated genetic cases, both penetrance and expressivity must be considered when making a diagnosis. Pleiotropy of a disorder is best described as a single gene disorder having implications on several different organ systems.
Extranuclear inheritance
Mitochondria are unique in that they have multiple copies of a circular chromosome. This DNA is independent of nuclear DNA and inherited from the mother.
Therefore in this inheritance modality, the females can transmit the trait to all offspring (figure 14.4), however, only female offspring will continue to transmit the disorder. Disease phenotype in mitochondrial disease is extremely variable due to mitochondrial heteroplasmy.
Heteroplasmy is a term referring to the diversity of the mitochondrial genome within each cell. During cell division, mitochondria are divided randomly between the two daughter cells, and therefore the percentage of affected mitochondrial DNA (mtDNA) will also be variable within the offspring. The mitochondria generate energy for the rest of the cell, therefore disease transmitted through mitochondrial inheritance affects high-energy organs (this is a good example of pleiotropy).
Genomic imprinting
Genetic information is not just stored in the actual code (e.g., ATCG), but also for many genes hereditary information is transmitted with a parental-specific imprint based on whether the gene was transmitted from the father or from the mother. This imprint can be thought of as the font of the genome (e.g., ATCG vs. ATCG vs. ATCG). For these imprinted genes, even though the nucleotide sequence in the maternal and paternal copies is identical, the expression differs depending on the parental imprint. Genomic imprinting is the most well-characterized epigenetic transmission of gene regulation. Often in cases, the imprinting of one allele is essential for a normal phenotype, and loss of imprinting or uniparental disomy (inheritance of both loci from a single parental source) can cause inappropriate expression patterns.
Differential methylation of genomic DNA is a central mechanism in the regulation of the expression of genes. Of special importance is the methylation of cytosine in CpG (cytosine-phosphorus-guanine) dinucleotides. Many genes have numerous “CpG islands” with a large number of CpG dinucleotides located upstream of the transcriptional start. Hypermethylation in this region results in transcriptional silencing, meaning the gene can no longer be read. The methylation pattern of DNA and, consequently, the activity pattern of the genes are generally transmitted as a stable trait in mitosis; however, for imprinted or epigenetically sensitive genes, this “trait” is reset in meiosis.
Trinucleotide repeat disorders
Disorders in this category are caused by expansion of tandem trinucleotide repeats (figure 14.5). These repetitive regions can be within upstream regulatory elements or within the coding region themselves; typically these repeated regions are of low copy number. In each generation there is the potential for these repetitive sequences to expand, and the expansion will change gene expression.
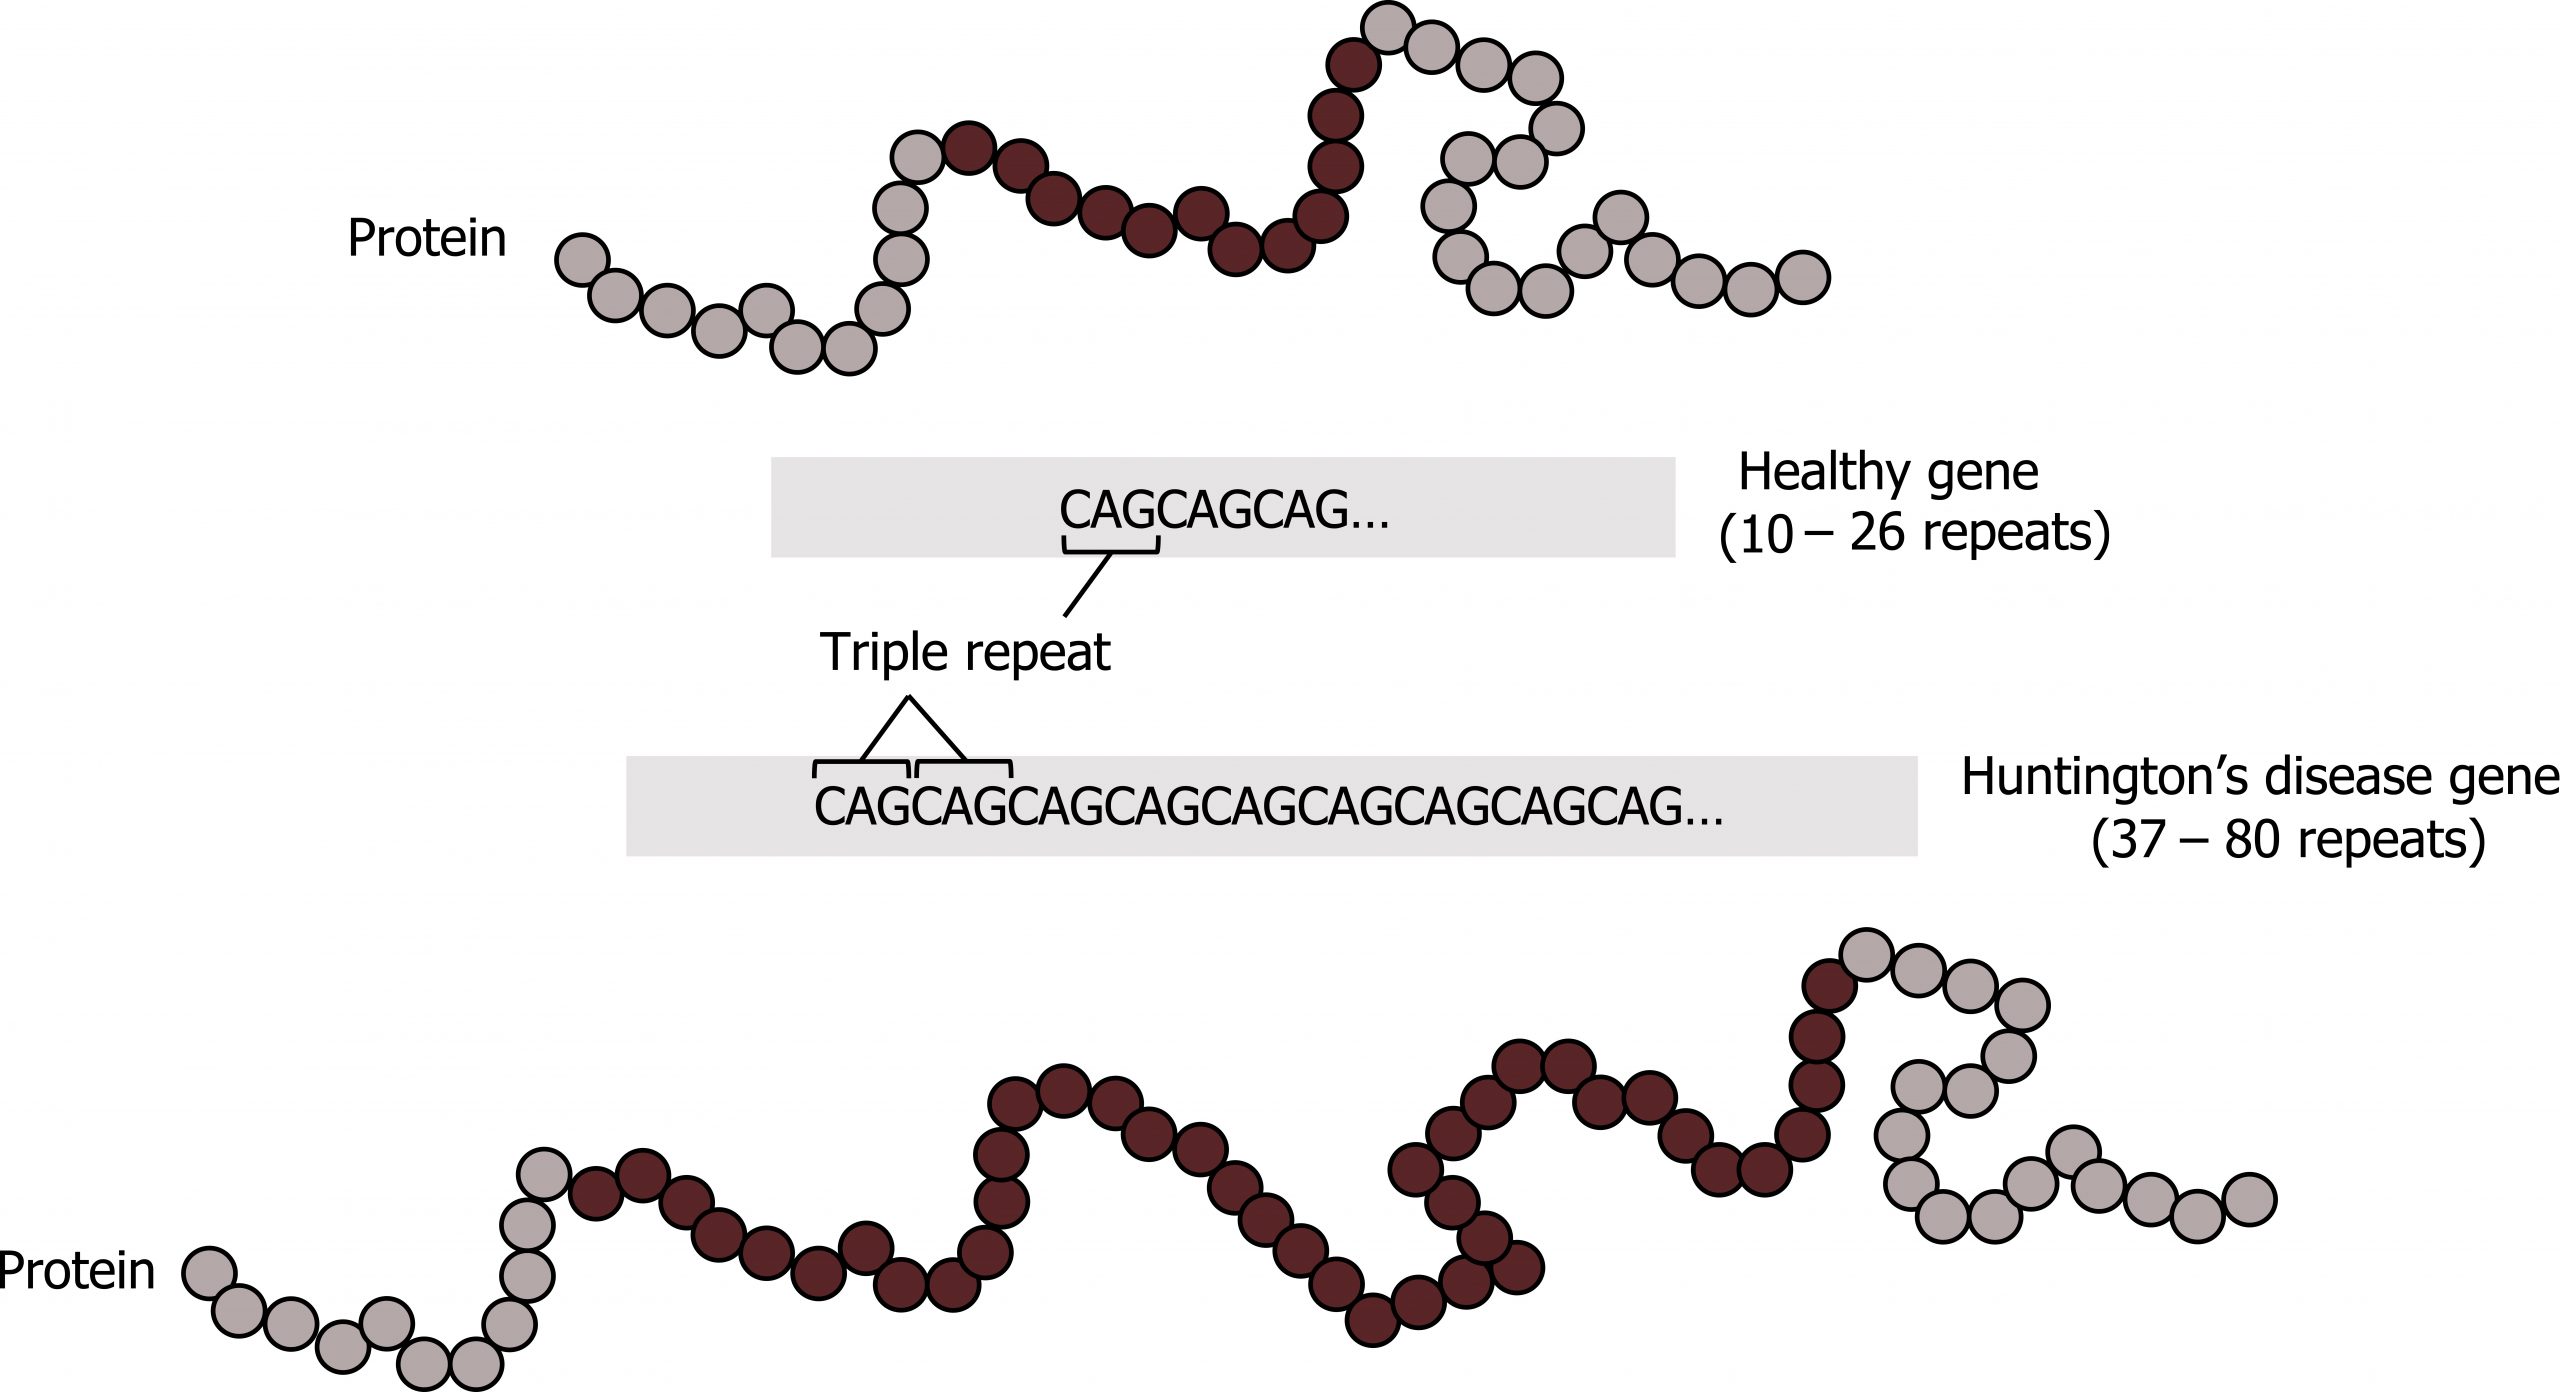
Triplicate repeat disorders are also characteristic of anticipation where the affected phenotype of individuals becomes progressively worse with each generation. Classic repeat disorders include Fragile X and Huntingtonʼs disease. In the case of Fragile X, the repeated region becomes hypermethylated and the methylation pattern expands into the promoter region for the gene. This will lead to silencing of the transcript. The gene itself, FMR1, is involved in mRNA splicing, and the loss of this gene product has a pleiotropic effect.
14.2 References and resources
Text
Clark, M. A. Biology, 2nd ed. Houston, TX: OpenStax College, Rice University, 2018, Chapter 10: Cell Reproduction, Chapter 12: Mendel’s Experiments and Heridity, Chapter 13: Modern Understandings of Inheritance.
Le, T., and V. Bhushan. First Aid for the USMLE Step 1, 29th ed. New York: McGraw Hill Education, 2018, 55–59.
Nussbaum, R. L., R. R. McInnes, H. F. Willard, A. Hamosh, and M. W. Thompson. Thompson & Thompson Genetics in Medicine, 8th ed. Philadelphia: Saunders/Elsevier, 2016, Chapter 7: Patterns of Single Gene Inheritance, Chapter 9: Genetic Variations in Populations, Chapter 10: Identifying the Genetic Basis for Human Disease.
Figures
Grey, Kindred, Figure 14.3 Graphic representation of penetrance and expressivity. 2021. CC BY4.0. Adapted from Introduction to Genetic Analysis 7th Ed. Figure 4.33 The effects of penetrance and expressivity through a hypothetical character “pigment intensity. From NCBI.
Grey, Kindred, Figure 14.4 Mitochondrial inheritance pattern. 2021. https://archive.org/details/14.4_20210926. CC BY-SA 4.0. Added Mitochondrial inheritance by Domaina, Angelito7 and SUM1. CC BY-SA 4.0. From Wikimedia Commons.
Grey, Kindred, Figure 14.5: Trinucleotide repeat expansion characteristic of Huntington’s disease. 2021.
Additional resources
- Hardy-Weinberg problems: https://www.k-state.edu/parasitology…/hardwein.html
- Practice pedigrees: https://ocw.mit.edu/courses/biology/…ntals-of-biology-fall-2011/genetics/pedigrees/MIT7_01SCF11_3.3sol1.pdf
- Practice pedigrees: https://www.khanacademy.org/science/high-school-biology/hs-classical-genetics/hs-pedigrees/a/hs-pedigrees-review
14.3 Linkage Analysis and Genome-Wide Association Studies (GWAS)
There is tremendous interest in finding specific genes that predispose individuals to common disease traits, most of which follow complex inheritance patterns rather than Mendelian (single gene) patterns. Physicians will find frequent references in the medical literature related to the search for genes with high predictive value in common disorders.
While we know the DNA sequence of the vast majority of the coding regions of the genome, we still do not understand the full function of the majority of genes or how they are involved in human health conditions. There are two major approaches to identifying genetic loci, which contribute to disease presentation: linkage analysis and genome-wide association studies.
Linkage analysis
Linkage analysis relies on the fact that disease-causing mutations are inherited jointly (linked) with genetic markers located in their immediate vicinity. In order for a gene and a genetic marker to be linked, they must be syntenic, meaning they must be located on the same chromosome. Most genes or markers within the human genome are inherited independently of one another, and therefore are transmitted together 50 percent of the time.
Linkage between two genes means that they tend to be inherited together more often than expected by chance.
For linkage to occur, two conditions must be met:
- First, the genes must be syntenic.
- Second, they need to reside relatively close to one another.
Syntenic genes may become detached from one another through crossing over (or recombination). For large chromosomes, crossing over is so common that genes at opposite ends of the chromosome are inherited together no more often than if they resided on entirely different chromosomes.
When markers are close enough together on the same chromosome, crossing over fails to separate them frequently enough for them to be inherited independently of one another. This is evidenced by coinheritance of greater than 50 percent.
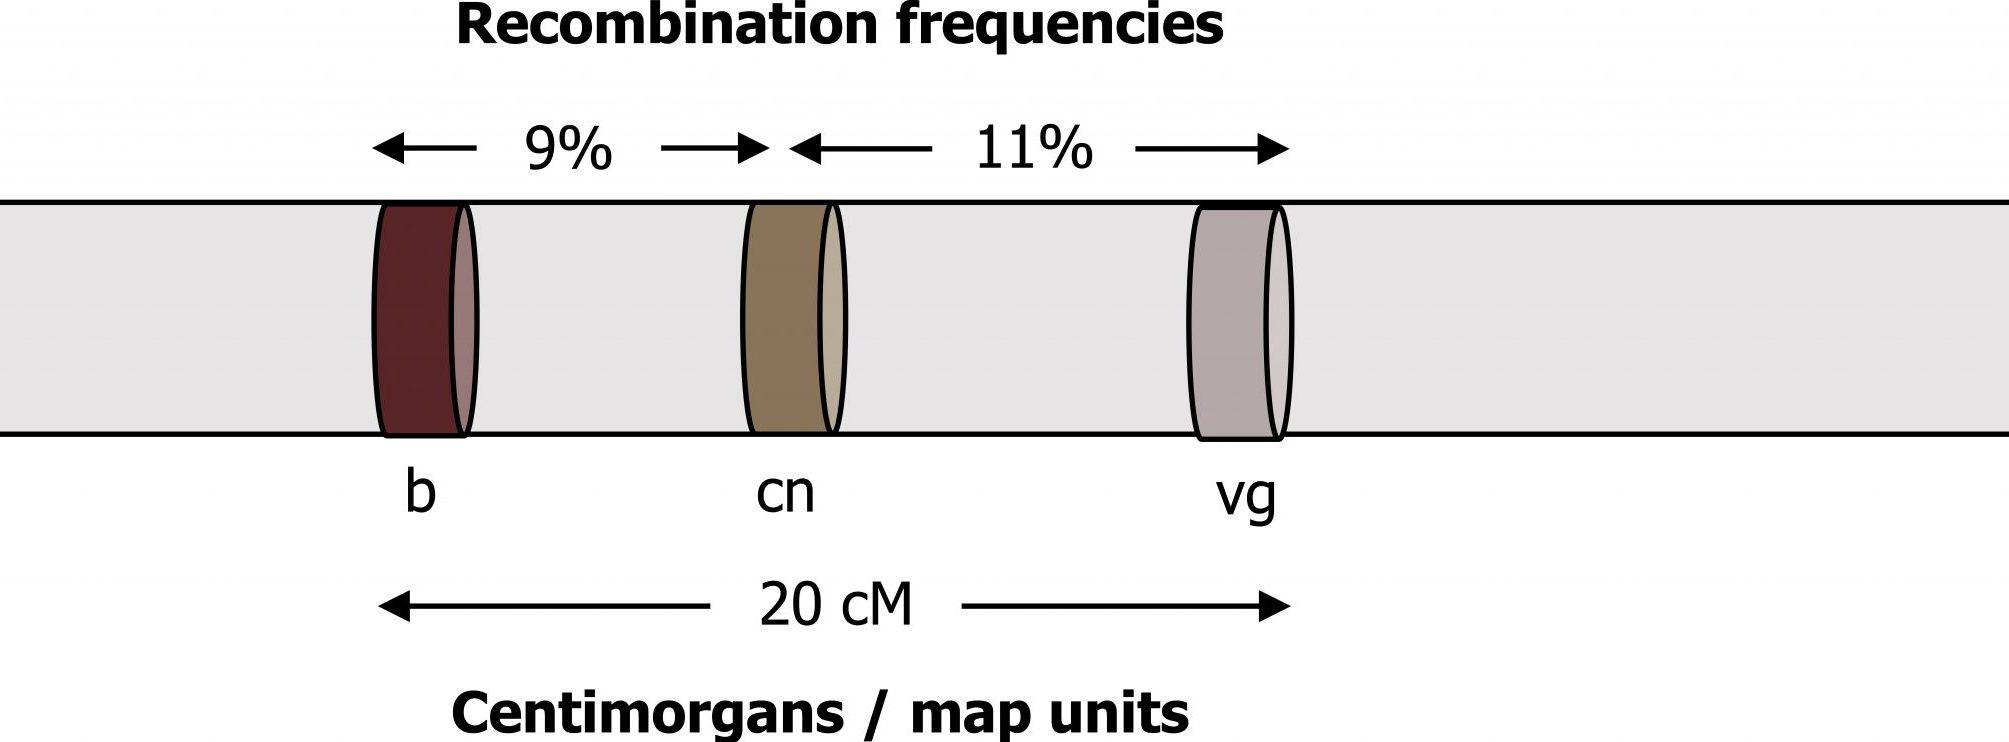
The unit of measure in linkage studies is “centimorgans.” This concept can be confusing because we refer to the “distance” between two traits, but what is measured experimentally is the frequency of coinheritance, not physical distance.
A very small linkage distance means the traits are rarely separated during meiosis. A distance of 0 cM means two traits always stay together, implying that they are extremely close to one another on the same chromosome. If the two traits separate from one another 1 percent of the time during meiosis, they are described as being 1 cM apart; if the two traits separate from one another 5 percent of the time during meiosis, they are described as being 5 cM apart (figure 14.6).
The further apart two genes or markers are on the same chromosome increases the probability of a crossover occurring in between the two markers. Studies to determine linkage require the careful study of large numbers of parents and their offspring. Careful study of the family relationships across three generations allows linkage phases to be determined. In this case, the grandparents’ information is required to determine how the genes are initially linked in the parents, and the grandchildren are studied to determine recombination events (crossing over) that separate the genes or markers during meiosis in the parents.
Distance can be expressed in cM as described previously, or in terms of theta (θ), which are proportions. Remember, both are measures of probability, not physical distance. Linkage determinations are based on the fundamental rules of probability and binomial mathematics. Like any probability issue, a ratio greater than one reflects odds in favor (of linkage), and less than one reflects odds against.
For linkage studies, each family represents an independent estimate of the odds in favor of (or against) linkage. The property within standard probability laws is the concept of joint probability. To determine joint probability, meaning the chance that BOTH of two events will happen, we use what is often called the “AND rule.” The AND rule applies whenever the probabilities under study are independent of one another.
Multiplying the results of many families is challenging, and was particularly so before computer resources became readily available. It is simpler mathematically to add numbers. We can move from multiplication to addition if we simply use the log of the probability instead of the probability number itself. Remember that the log of a number that is less than one is a negative number, and for a number greater than one, it is a positive number. Using a log conversion makes it simple to see if the ratio of the odds is favorable (positive) or unfavorable. The term “LOD score” refers to the log (base 10) of the odds of linkage, looking across a series of independent families.
There really are just two things to remember about LOD scores:
- First, it is a convenient system for combining the observations across a large number of families to describe the odds of linkage.
- Second, the values of LOD scores define “proof” that two genes or markers are linked or not linked.
- When the odds reach an LOD score of 3, the two markers are considered to be proven to be linked.
- When odds reach a level of -2, this is taken as conclusive evidence that the two genes or markers are not linked. LOD scores appear in a great deal of medical literature where the identification or location of disease-related genes is being considered.
Genome-wide association studies (GWAS)
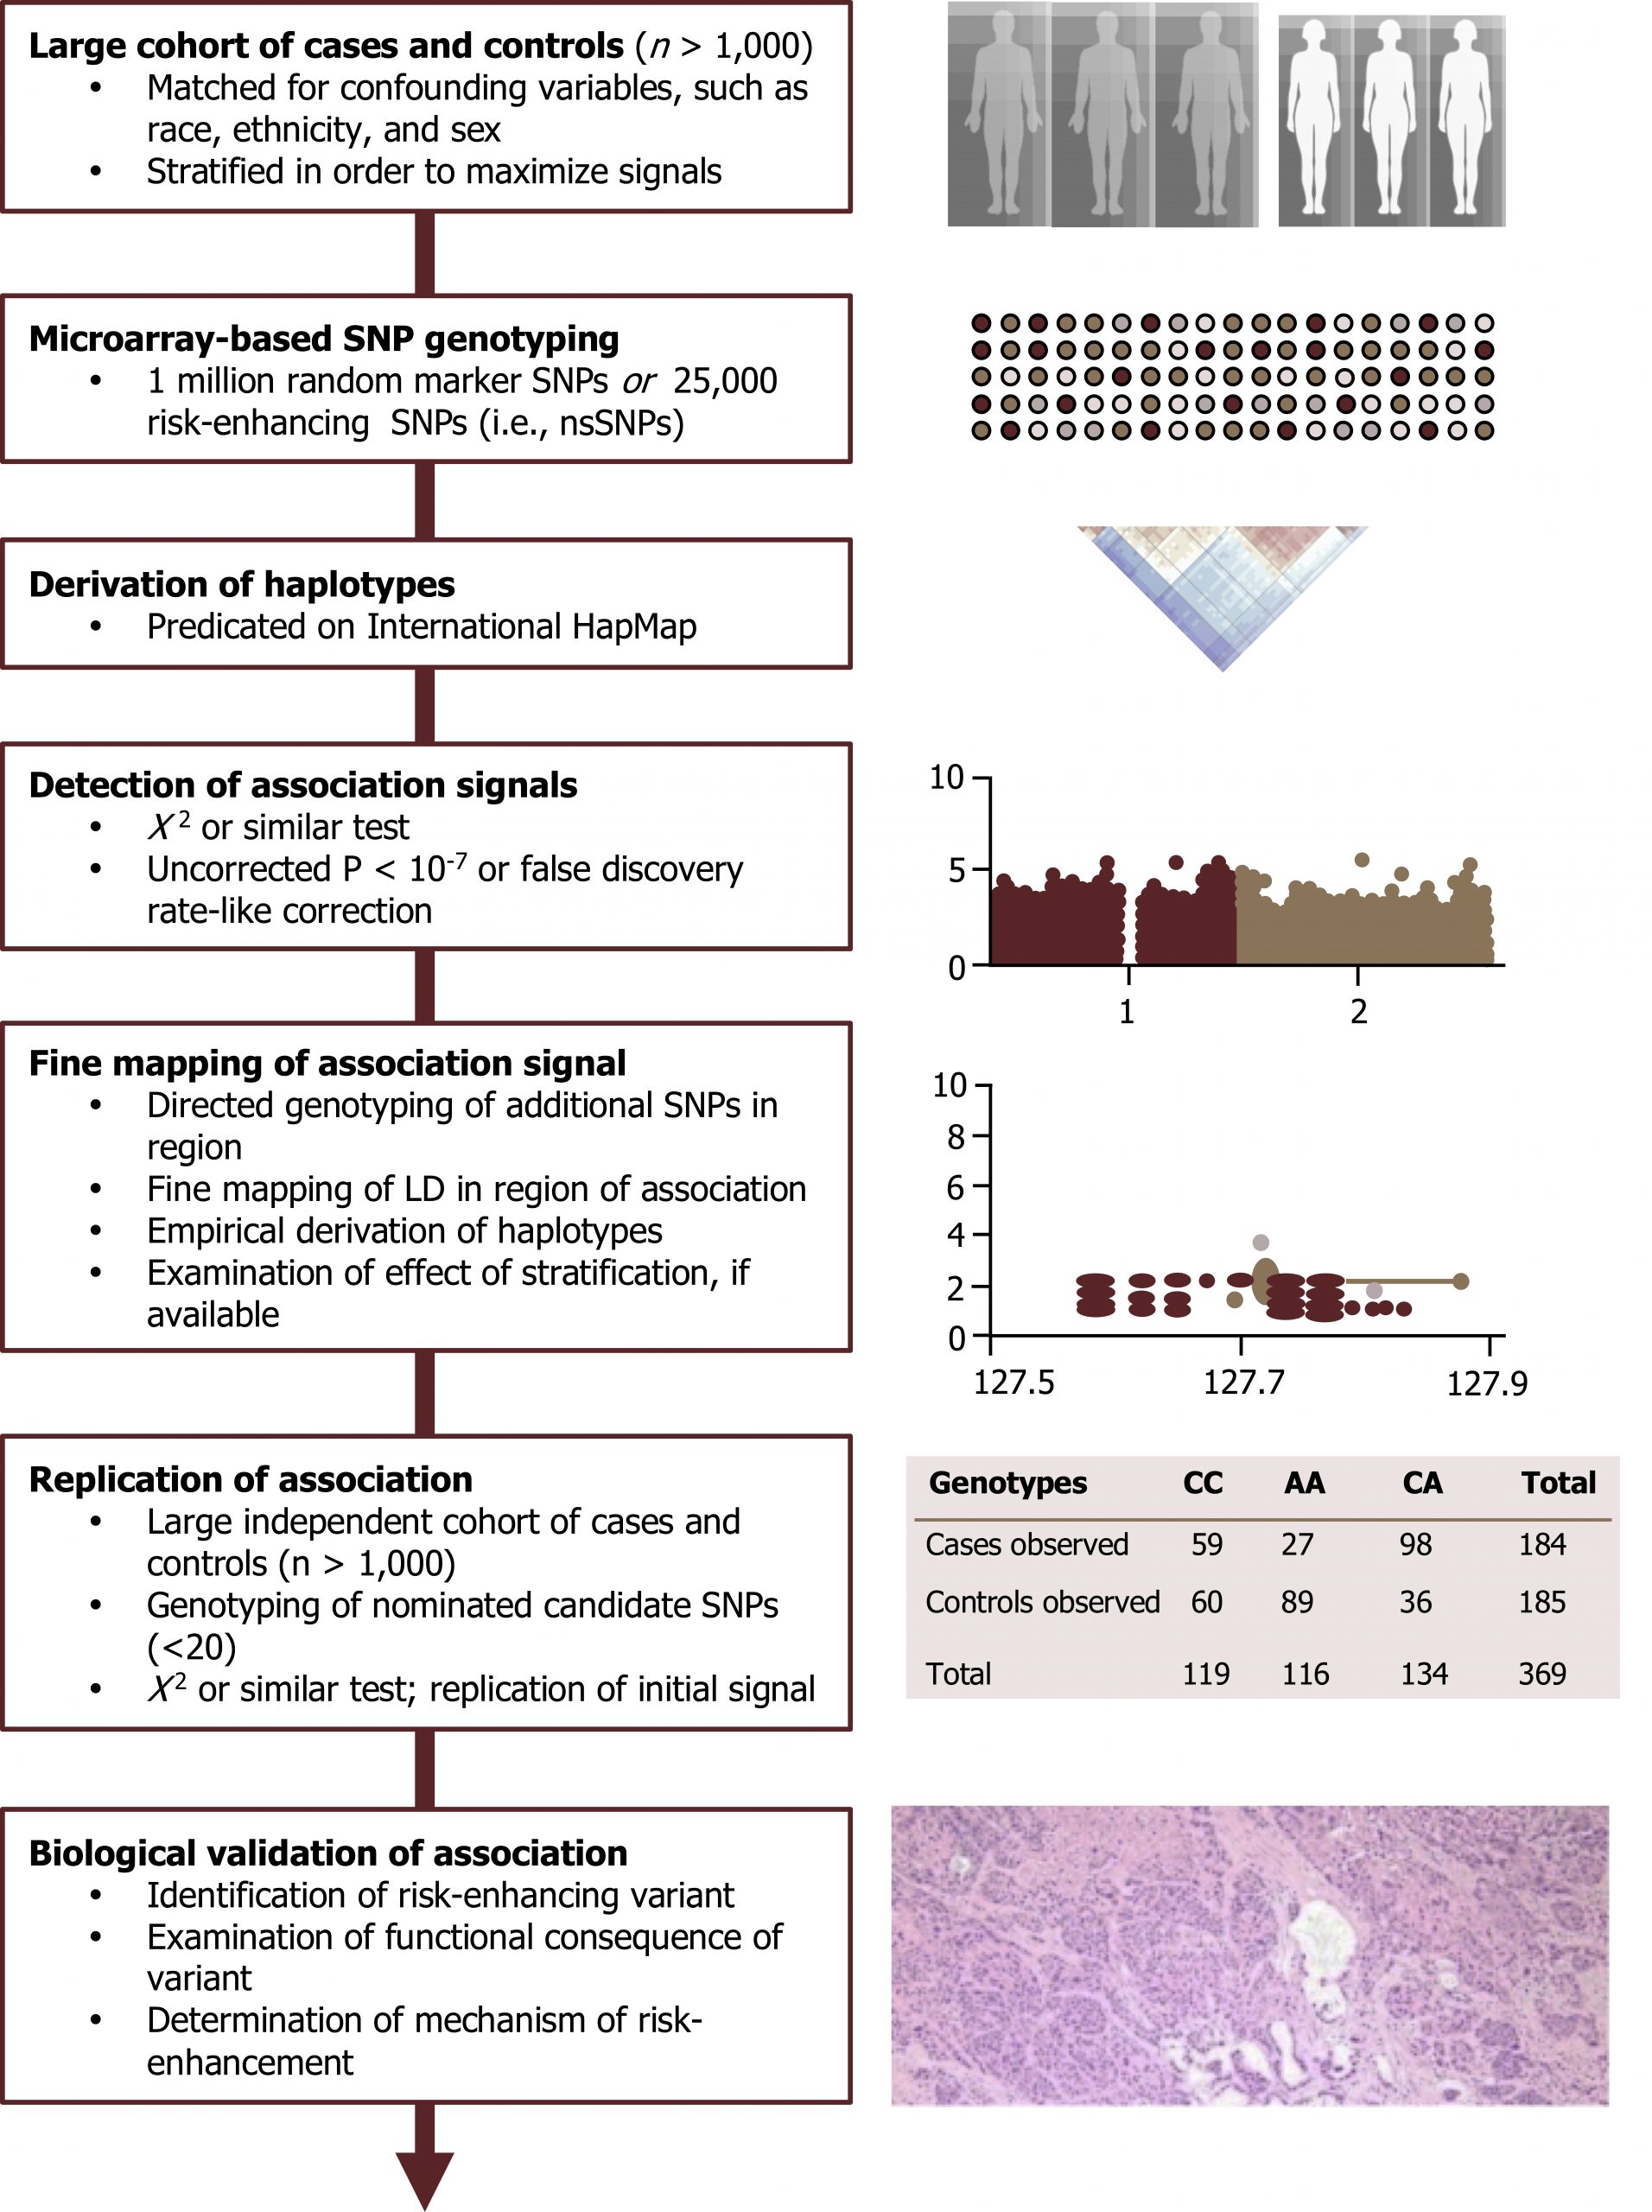
Population association is easily confused with the concepts surrounding linkage. These studies look for a statistical association between a marker (often a single nucleotide polymorphism or SNP) and a specific trait. The concept of population association can be exploited to simultaneously study a very large number of detectable genetic markers (SNPs) in patient populations with common disorders.
Much of the power of personalized medicine is derived from such associations. There is an abundance of GWAS that appear in the medical literature. This is a highly sophisticated type of case-control study for which careful study design is required to avoid spurious findings. These studies provide information related to common genetic traits but do not help address genetic manifestations of rare traits in a population (figure 14.7).
For more information on these types of studies, please see: https://www.genome.gov/20019523/geno…ies-factsheet/.
14.3 References and resources
Text
Clark, M. A. Biology, 2nd ed. Houston, TX: OpenStax College, Rice University, 2018, Chapter 10: Cell Reproduction, Chapter 12: Mendel’s Experiments and Heridity, Chapter 13: Modern Understandings of Inheritance.
Le, T., and V. Bhushan. First Aid for the USMLE Step 1, 29th ed. New York: McGraw Hill Education, 2018, 55–59.
Nussbaum, R. L., R. R. McInnes, H. F. Willard, A. Hamosh, and M. W. Thompson. Thompson & Thompson Genetics in Medicine, 8th ed. Philadelphia: Saunders/Elsevier, 2016, Chapter 7: Patterns of Single Gene Inheritance, Chapter 9: Genetic Variations in Populations, Chapter 10: Identifying the Genetic Basis for Human Disease.
Figures
Grey, Kindred, Figure 14.6 Relationship between centimorgans and recombination frequency. 2021. https://archive.org/details/14.6_20210926. CC BY 4.0.
Tam, V., Patel, N., Turcotte, M. et al. Figure 14.7 Schematic of GWAS study. Adapted under Fair Use from Benefits and limitations of genome-wide association studies. Nat Rev Genet 20, 467–484 (2019). https://pubmed.ncbi.nlm.nih.gov/31068683/. Fig. 1: GWAS study design. Added Mitochondrial inheritance by Domaina, Angelito7 and SUM1. CC BY-SA 4.0. From Wikimedia Commons. Added Genetic similarities between 51 worldwide human populations (Euclidean genetic distance using 289,160 SNPs) by Tiago R. Magalhães, Jillian P. Casey, Judith Conroy, Regina Regan, Darren J. Fitzpatrick, Naisha Shah, João Sobral, Sean Ennis. CC BY 2.5. From Wikimedia Commons. Added Histopathology of adenosquamous carcinoma of the pancreas by Yeung, Vincent; Palmer, Joshua D.; Williams, Noelle; Weinstein, Jonathan C.; Fortuna, Danielle; Sama, Ashwin; Winter, Jordan; Bar-Ad, Voichita. CC BY 4.0. From Wikimedia Commons.
Additional resources
- Hardy-Weinberg problems: https://www.k-state.edu/parasitology…/hardwein.html
- Practice pedigrees: https://ocw.mit.edu/courses/biology/…ntals-of-biology-fall-2011/genetics/pedigrees/MIT7_01SCF11_3.3sol1.pdf
- Practice pedigrees: https://www.khanacademy.org/science/high-school-biology/hs-classical-genetics/hs-pedigrees/a/hs-pedigrees-review
