13 Human Genetics
Learning Objectives
Introduction to human genetics and genetic testing
- Understand how the following studies are performed and what kind of genetic information can/canʼt be obtained from each: karyotype, FISH, array CGH, Southern, Northern, and Western blots.
- Be able to select the appropriate technique (from the list above) to study chromosomes, chromosome segments containing several genes or single genes, microsatellites/copy number variants, DNA mutations/sequence alterations, RNA, and proteins.
- Understand how genes can be cloned using either a vector or PCR.
- Be able to describe both Sanger sequencing and “shotgun sequencing”.
- Be able to describe the information obtained from whole exome sequencing.
Genetics methodology
- Understand how the following studies are performed and what kind of information can/can’t be obtained from each: exome, Sanger sequencing, microarray, RFLP analysis, and FISH.
- Use the genetic code table to construct a protein sequence.
- Become familiar with DNA sequence variant nomenclature.
About this Chapter
The human genome project was a collaborative effort to sequence the human genome with the general idea that we would be able to identify all the genes coded for in DNA and determine how all genes functioned. This global understanding would change the way diseases are diagnosed and treated. When the project concluded in 2003, it was clear that DNA sequence was only a single piece of this equation, and just knowing what genes are present does not give a clear picture of how genes are expressed and regulated. What it has illustrated is that the modalities of inheritance and genetic influence over human phenotype is more complex that previously appreciated.
13.1 Chromosomal Structure and Cytogenetics
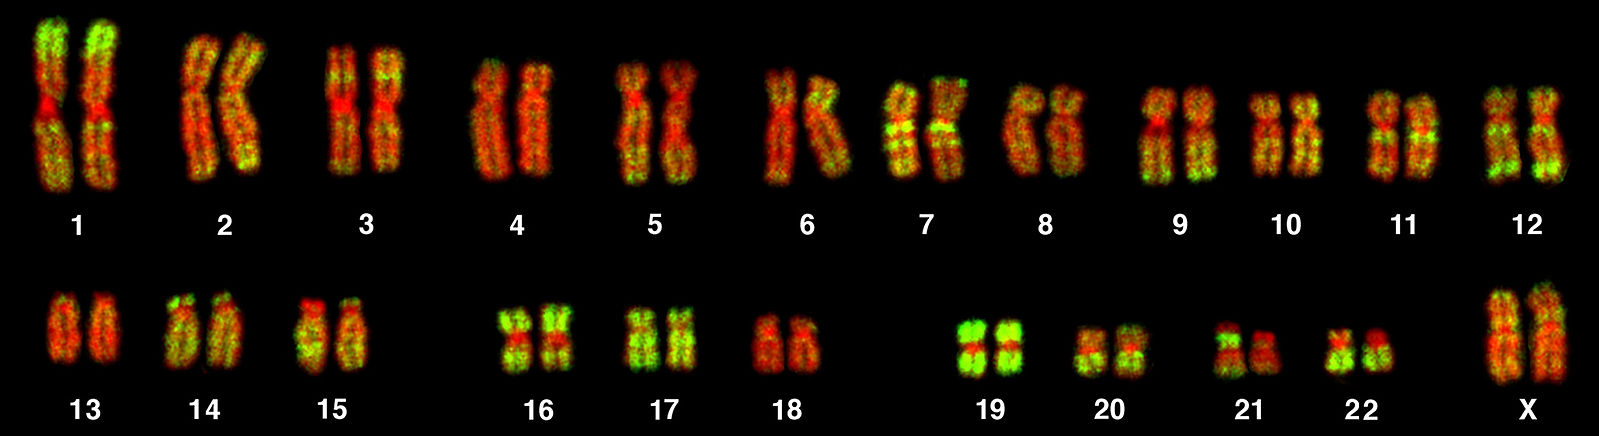
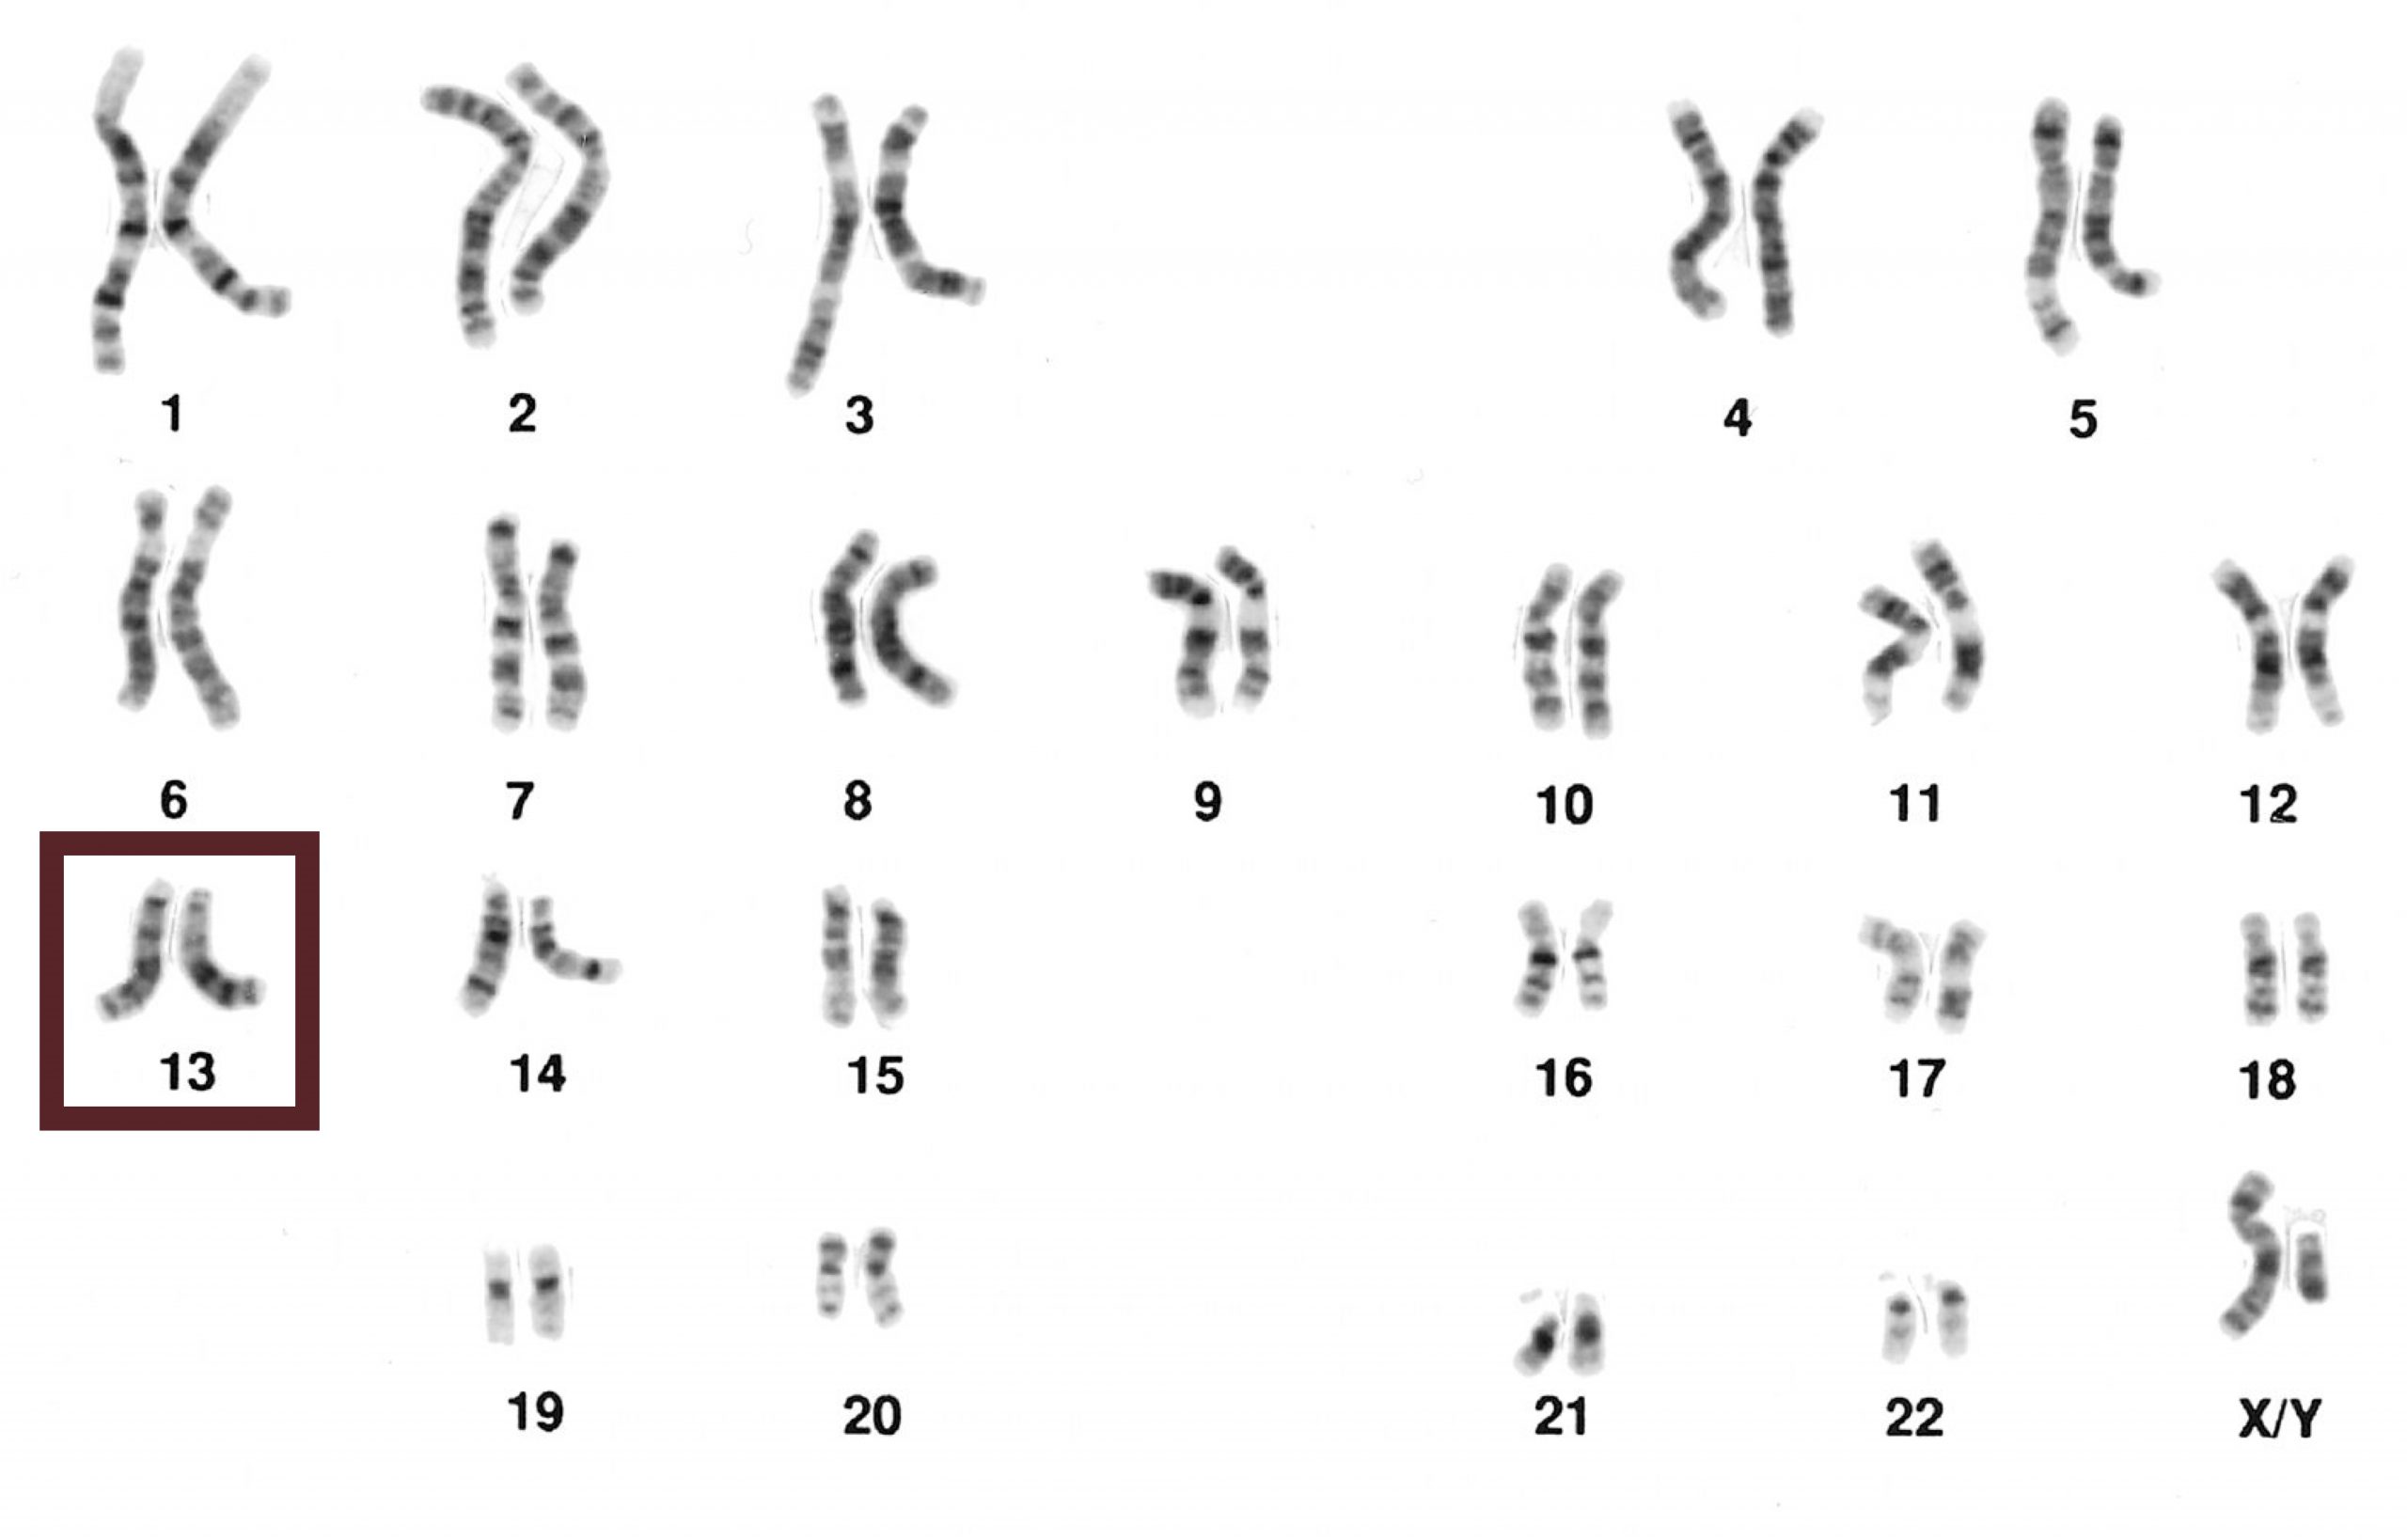
Chromosomes can be analyzed from living tissue and arranged in a karyotype (figure 13.1). Chromosomes can be sorted into the autosomal pairs (twenty-two) and sex chromosomes and classified to determine any abnormalities. A normal karyotype for a female is 46,XX, and a male is 46,XY. Deviations from this patterning can result in chromosomal abnormalities, which may or may not produce viable offspring.
Chromosome structure
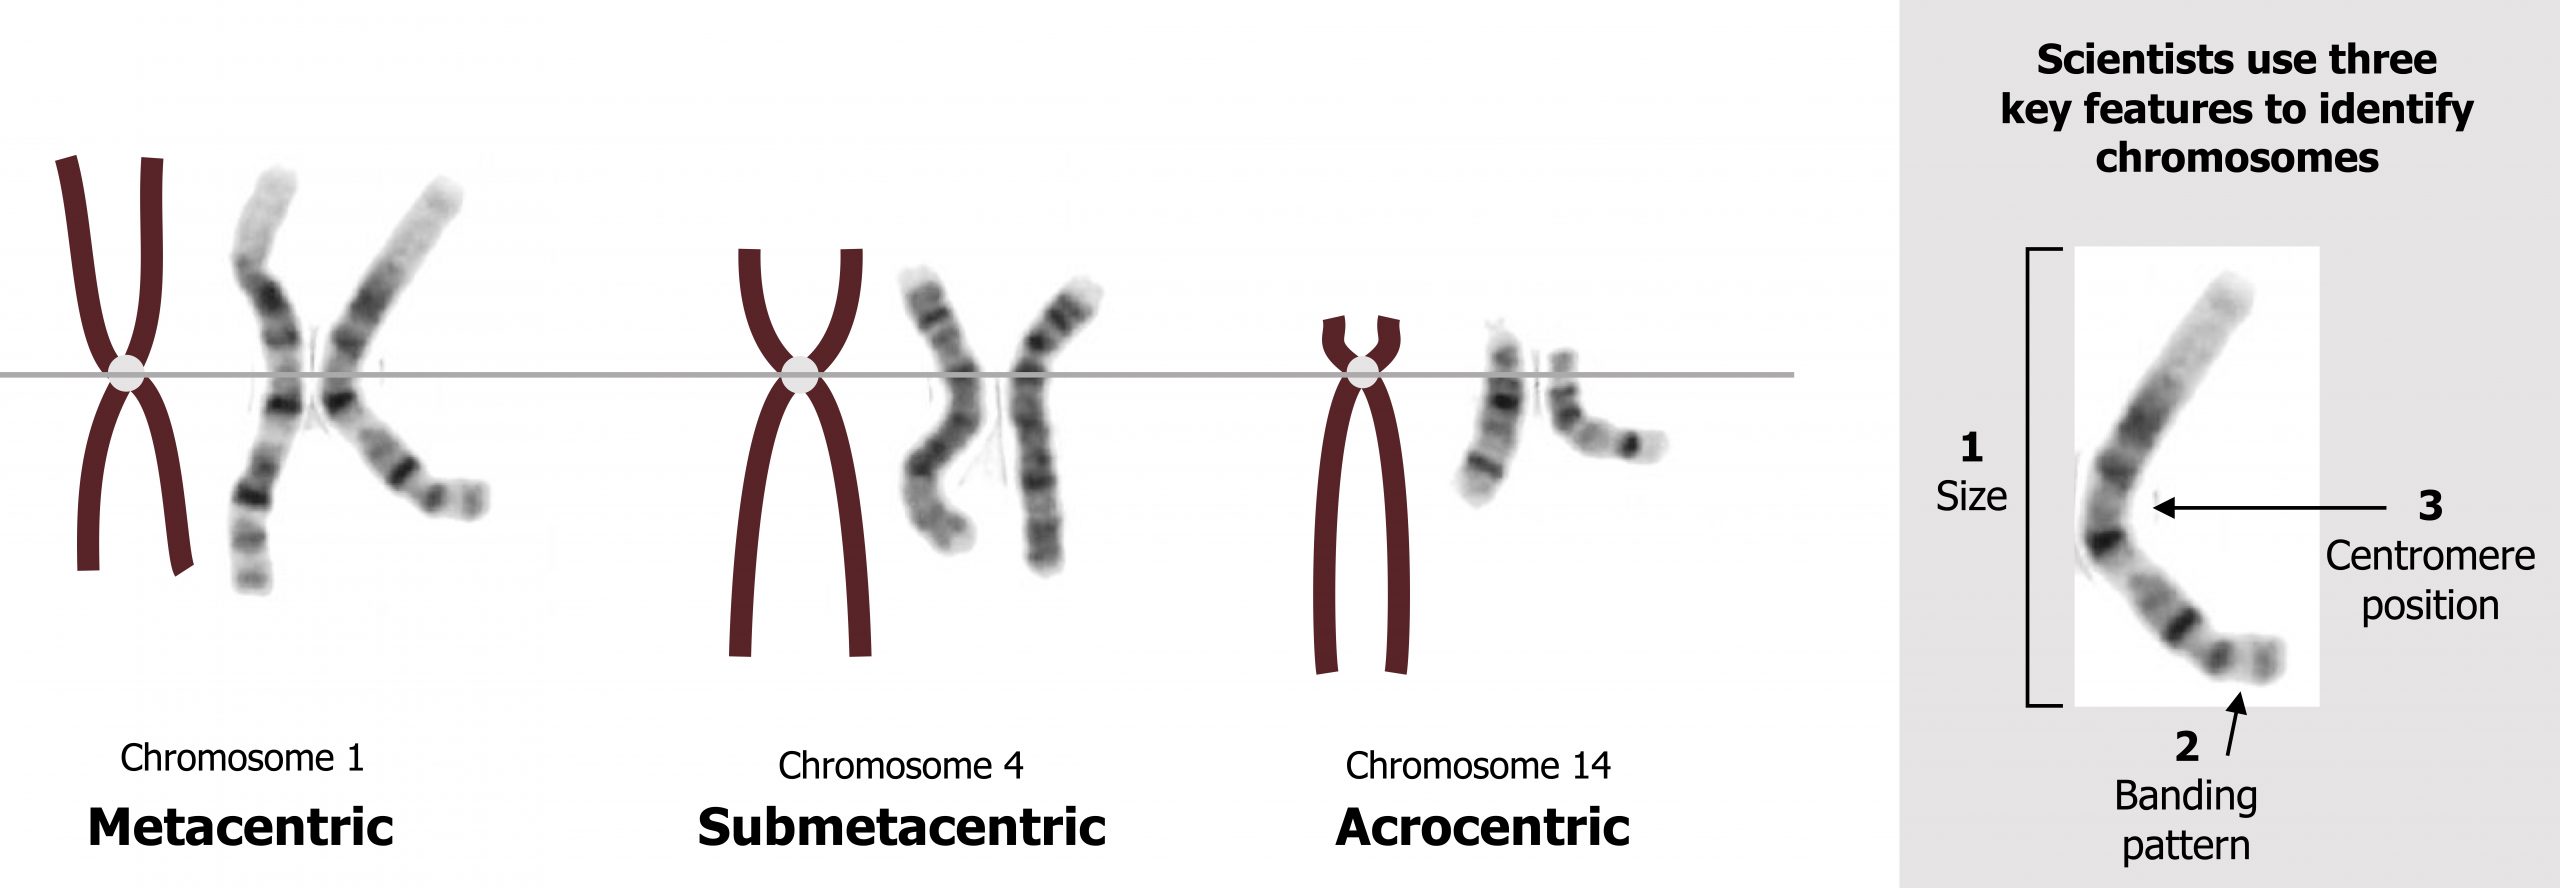
Each chromosome is made up of a p and q arm held together by the centromere. The position of the centromere is a distinguishing characteristic and can be classified as metacentric, submetacentric, or acrocentric. The position of the centromere plays a key role in mitotic and meiotic division as chromosomes with skewed centromeres are more likely to be involved in nondisjunction events (figure 13.2).
Nondisjunction
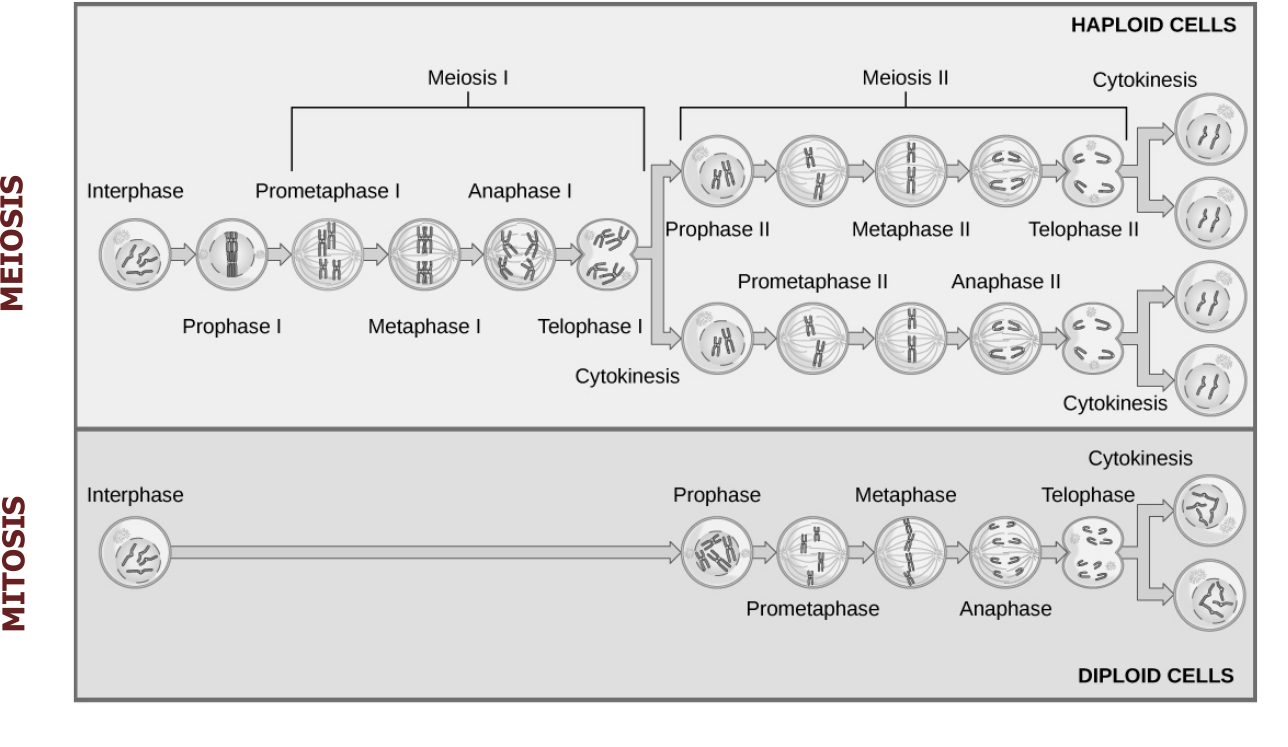
The precise pairing and segregation during the two meiotic divisions ensures the equal division of the somatic diploid set of chromosomes into the four resulting haploid cells (figure 13.3). Nondisjunction is the term used when the two homologous chromosomes in the first division or the two sister chromatids in the second do not segregate from each other at anaphase, but instead move together into the same daughter cell. This term may also be used for the same occurrence in mitotic cell divisions when the sister chromatids fail to segregate properly.
| DNA synthesis | Synapsis of homologous chromosomes | Crossover | Homologous chromosomes line up at metaphase plate | Sister chromatids line up at metaphase plate | ||
| Meiosis | Occurs in S phase of interphase | During prophase I | During prophase I | During metaphase I | During metaphase II | Outcome: Four haploid cells at the end of meiosis II |
| Mitosis | Occurs in S phase of interphase | Does not occur in mitosis | Does not occur in mitosis | Does not occur in mitosis | During metaphase | Outcome: Two diploid cells at the end of mitosis |
Table 13.1: Summary of meiotic and mitotic cell divisions.
These nondisjunction events can result in unequal distribution of chromosomes rendering a cell with an atypical chromosome number. A cell that is euploid would contain all twenty-three chromosomes, while polyploidy would suggest additional chromosomes within the cell. In humans, aneuploidy of autosomes are the most clinically important abnormalities to address, and the most common cause of this is a nondisjunction event.
Meiotic nondisjunction
Normally, one copy of each chromosome is inherited from each parent; however, when there is nondisjunction at either anaphase I or anaphase II, gametes will contain either two copies or no copies of the chromosome, which failed to disjoin. At fertilization, when the gamete provided by the other parent contributes one copy of each chromosome, the newly formed zygote will instead possess three copies (trisomy) or one copy (monosomy) of the chromosome, which failed to disjoin. Trisomy and monosomy are both examples of aneuploidy, a general term that denotes an abnormality in the number of copies of any given chromosome.
Chromosomal trisomies caused by nondisjunction at meiosis I can be distinguished from those occurring at meiosis II by examining the inheritance patterns of polymorphic markers near the centromere in cells obtained from the trisomic offspring (figure 13.4).
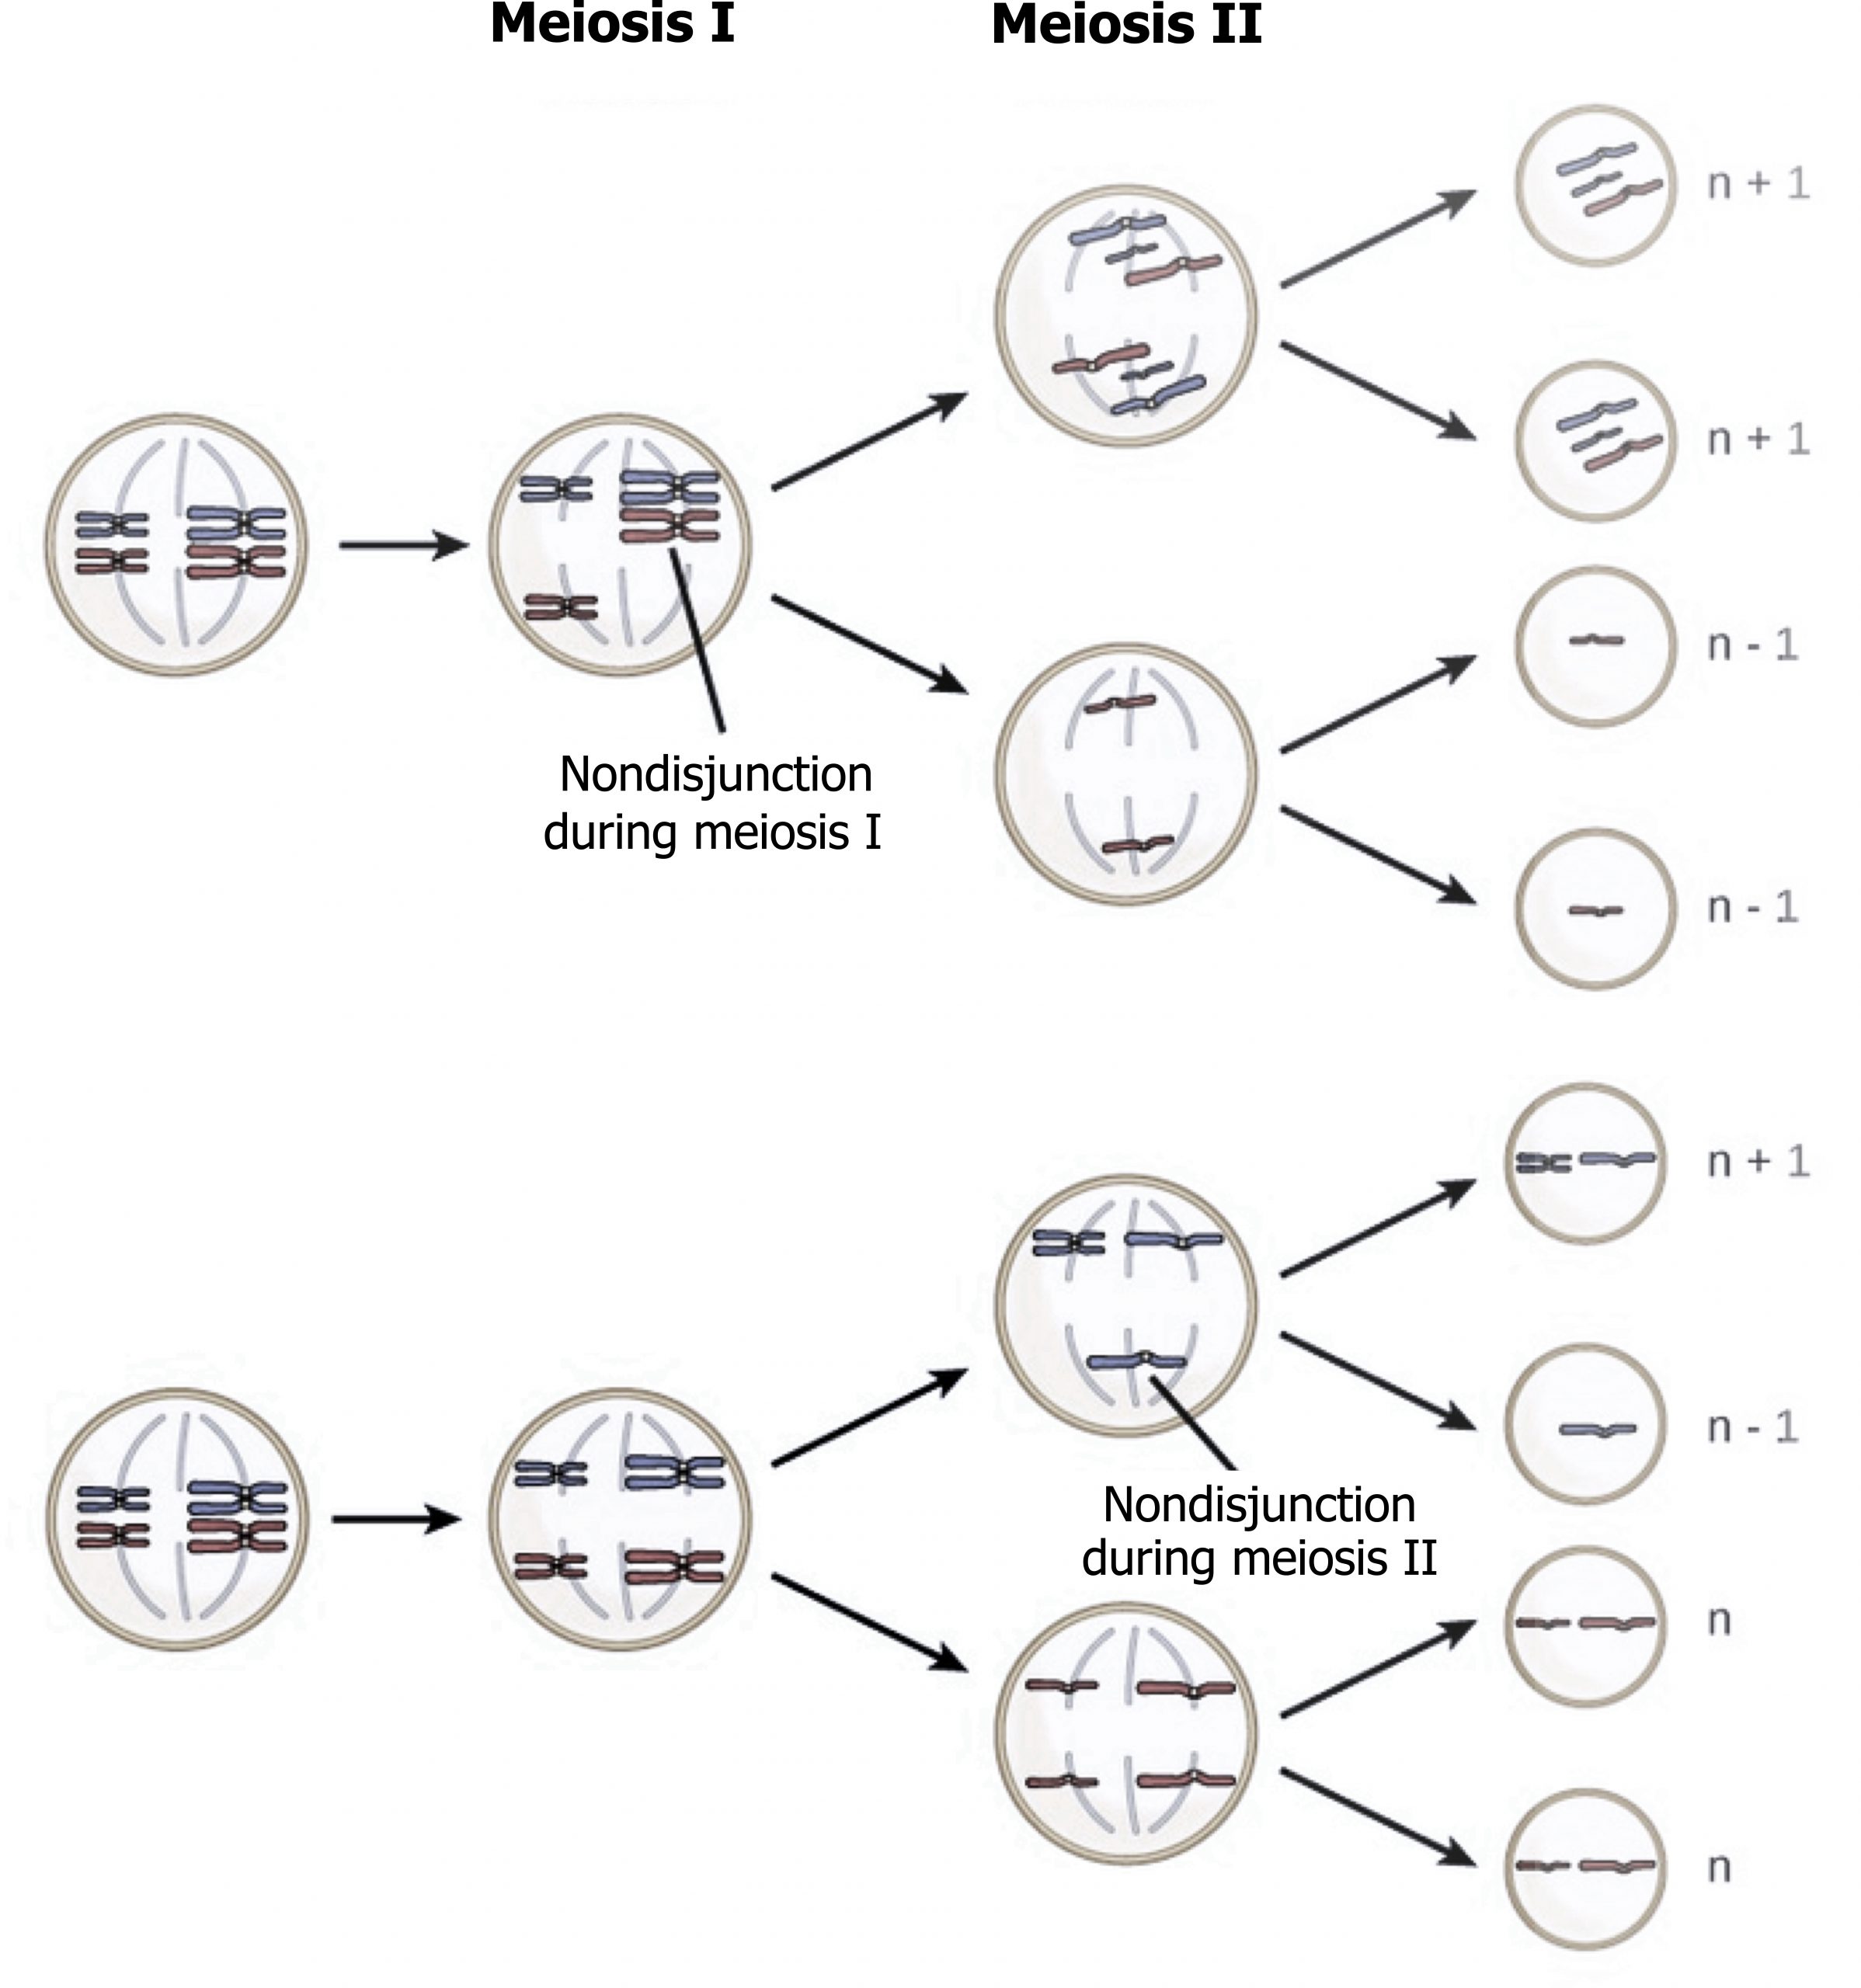
- Nondisjunction during the first division results in one copy of each of the two different markers being present on the two copies of the chromosome present in the abnormal gamete.
- Nondisjunction at meiosis II results in two copies of the same marker being present (figure 13.4).
Meiotic nondisjunction is the cause of the most common and clinically significant class of chromosomal abnormalities. This is true for chromosomal abnormalities found in spontaneous abortions where approximately 35 percent of miscarriages have a trisomy or monosomy, in stillbirths with approximately 4 percent being aneuploid, and also in live births with 0.3 percent being affected. Most autosomal trisomies and virtually all autosomal monosomies result in pregnancy failure or spontaneous abortion. Trisomies for chromosomes 13, 18, or 21 can result in the live birth of an infant with birth defects and intellectual disability. Extra copies of the X or Y chromosome are compatible with live birth, as is a small fraction of the conceptions with only a single X chromosome (Turner syndrome).
Increasing maternal age is considered a risk factor for increased frequency of nondisjunctional events. This maternal age effect is seen in both meiosis I and meiosis II, with the majority of these events occurring at meiosis I. Only a small proportion of chromosomal aneuploidies are due to errors in male meiosis, and these generally involve the sex chromosomes. Although there is little correlation with increasing paternal age and nondisjunctional events, there is some evidence to suggest that increased paternal age increases risk for other conditions (neurofibromatosis and achondroplasia) and should therefore not be ignored when determining risk.
Mitotic nondisjunction
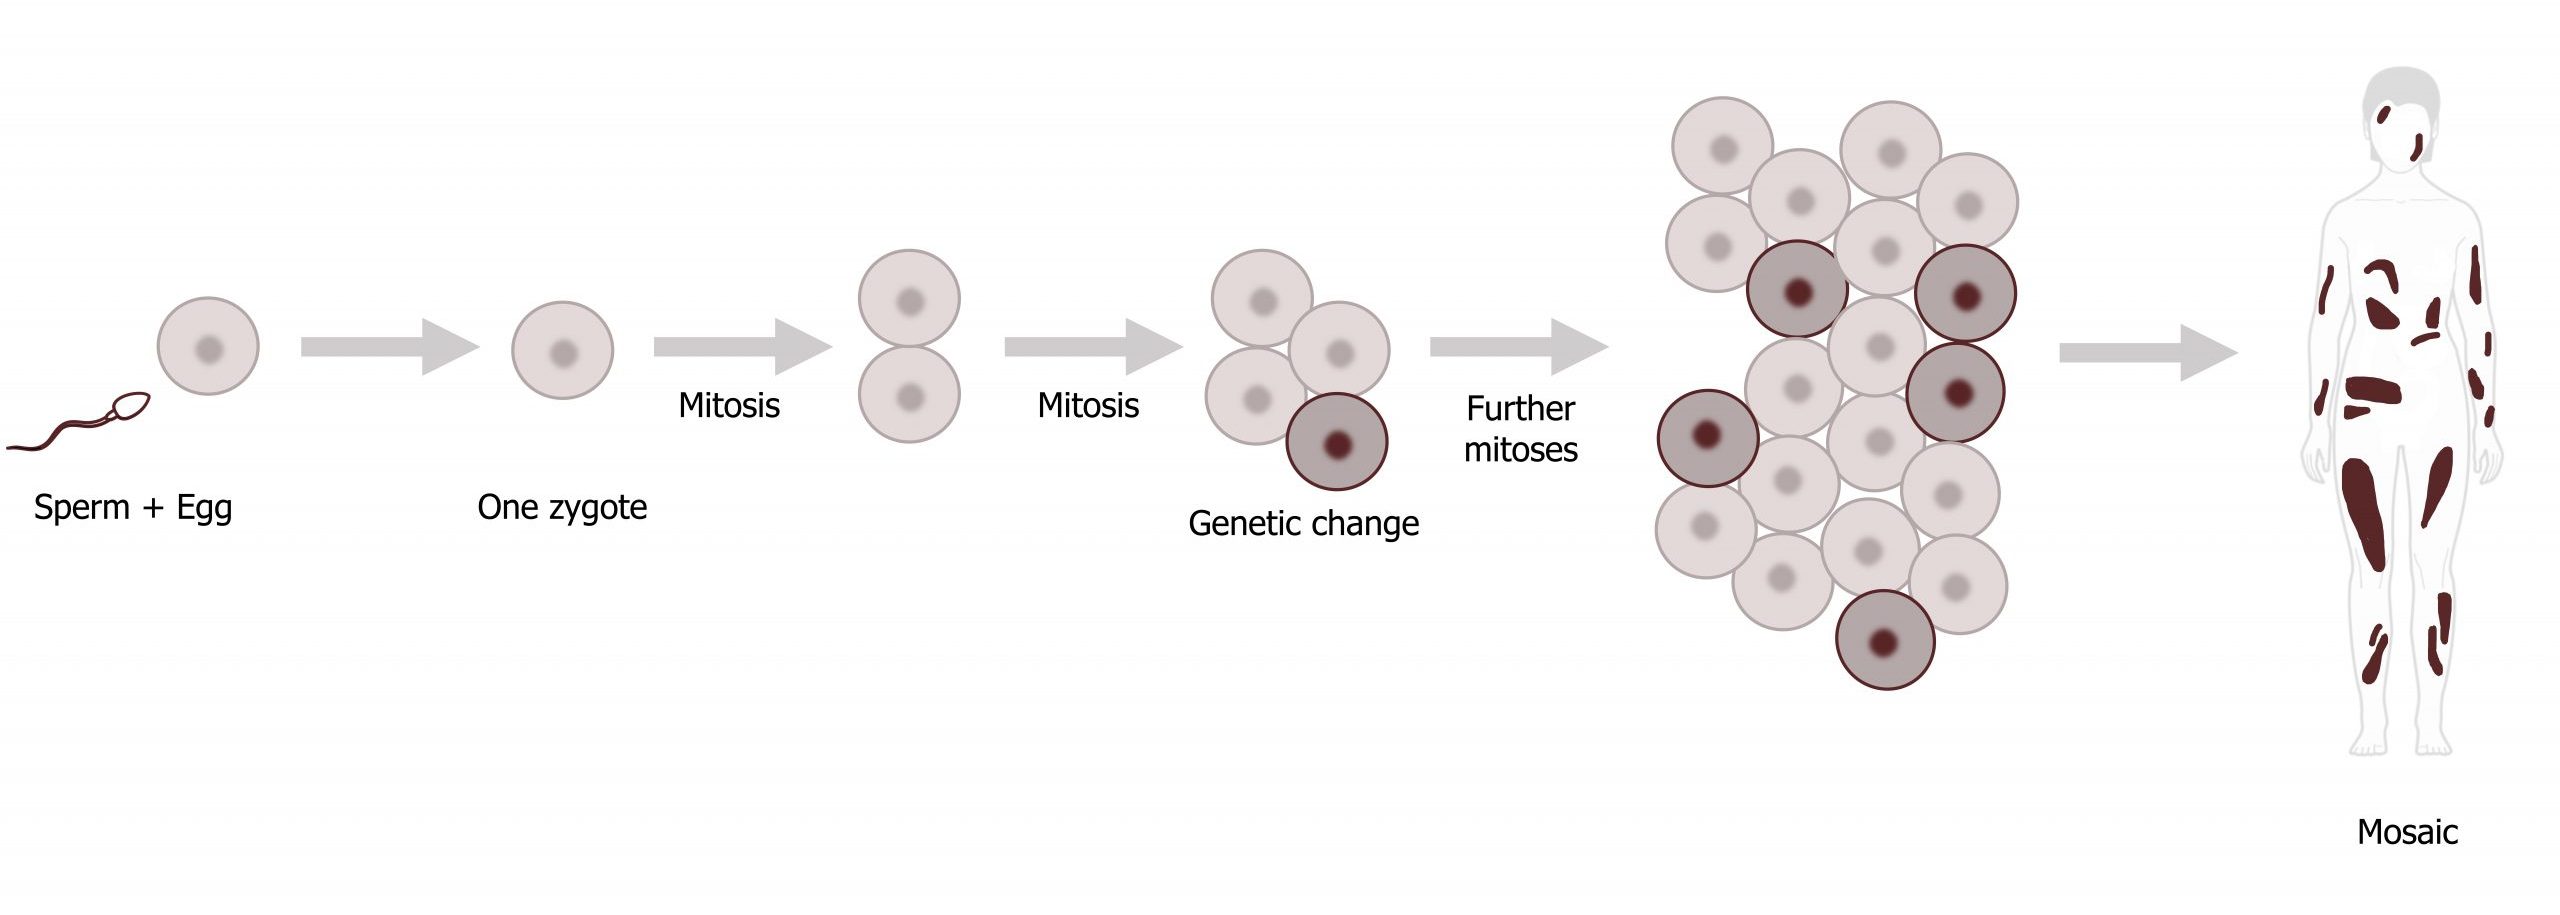
Mitotic nondisjunction occurs after zygote formation and may be the result of misdivision of a cell after a normal conception with gain (or loss) of a chromosome during embryogenesis. This typically results in mosaicism (figure 13.5), the presence of multiple and genetically distinct cell populations in the same individual. The timing of mitotic nondisjunction events determines the ratio of aneuploid to normal cells and the types of tissues affected. For example, if the nondisjunction occurs early in development, the majority of cells and tissues would carry this aneuploidy, which would result in an increased clinical severity.
Mosaicism is often found in sex chromosome abnormalities and some autosomal trisomies. Over half of mosaic trisomy 21 cases have been shown to be the result of loss of the extra 21 in subsequent mitotic divisions after a trisomic conception, while trisomy 8 mosaicism typically seems to be acquired during mitotic divisions after a normal conception.
Chimaerism is similar to mosaicism in that multiple, genetically distinct cell lines are present in the same individual. Here, however, the cell lines begin as different zygotes rather than arising through changes during mitosis. This can arise naturally from the fusion of closely implanted twins or migration of cells between embryos in multiple gestations, or it can be caused by the transplantation of tissues or organs from donors for medical treatment.
Chromosome structural defects
In addition to copy number defects, parts of the chromosome may be lost or altered. These rearrangements, regardless of the type, may be balanced or unbalanced (where the rearrangement does not produce a loss or gain).
Deletions and duplications
A deletion occurs when a chromosome breaks at two sites and the segment between them gets lost. Depending on the size and breakage site, varying numbers of genes can be lost. In rare cases the deletions are large enough to be visible under the light microscope. Smaller deletions have traditionally been identified by molecular cytogenetic (FISH) analyses, although they are now routinely detected with chromosome oligonucleotide arrays. These are called microdeletions, while the resulting pathologies are called microdeletion syndromes.
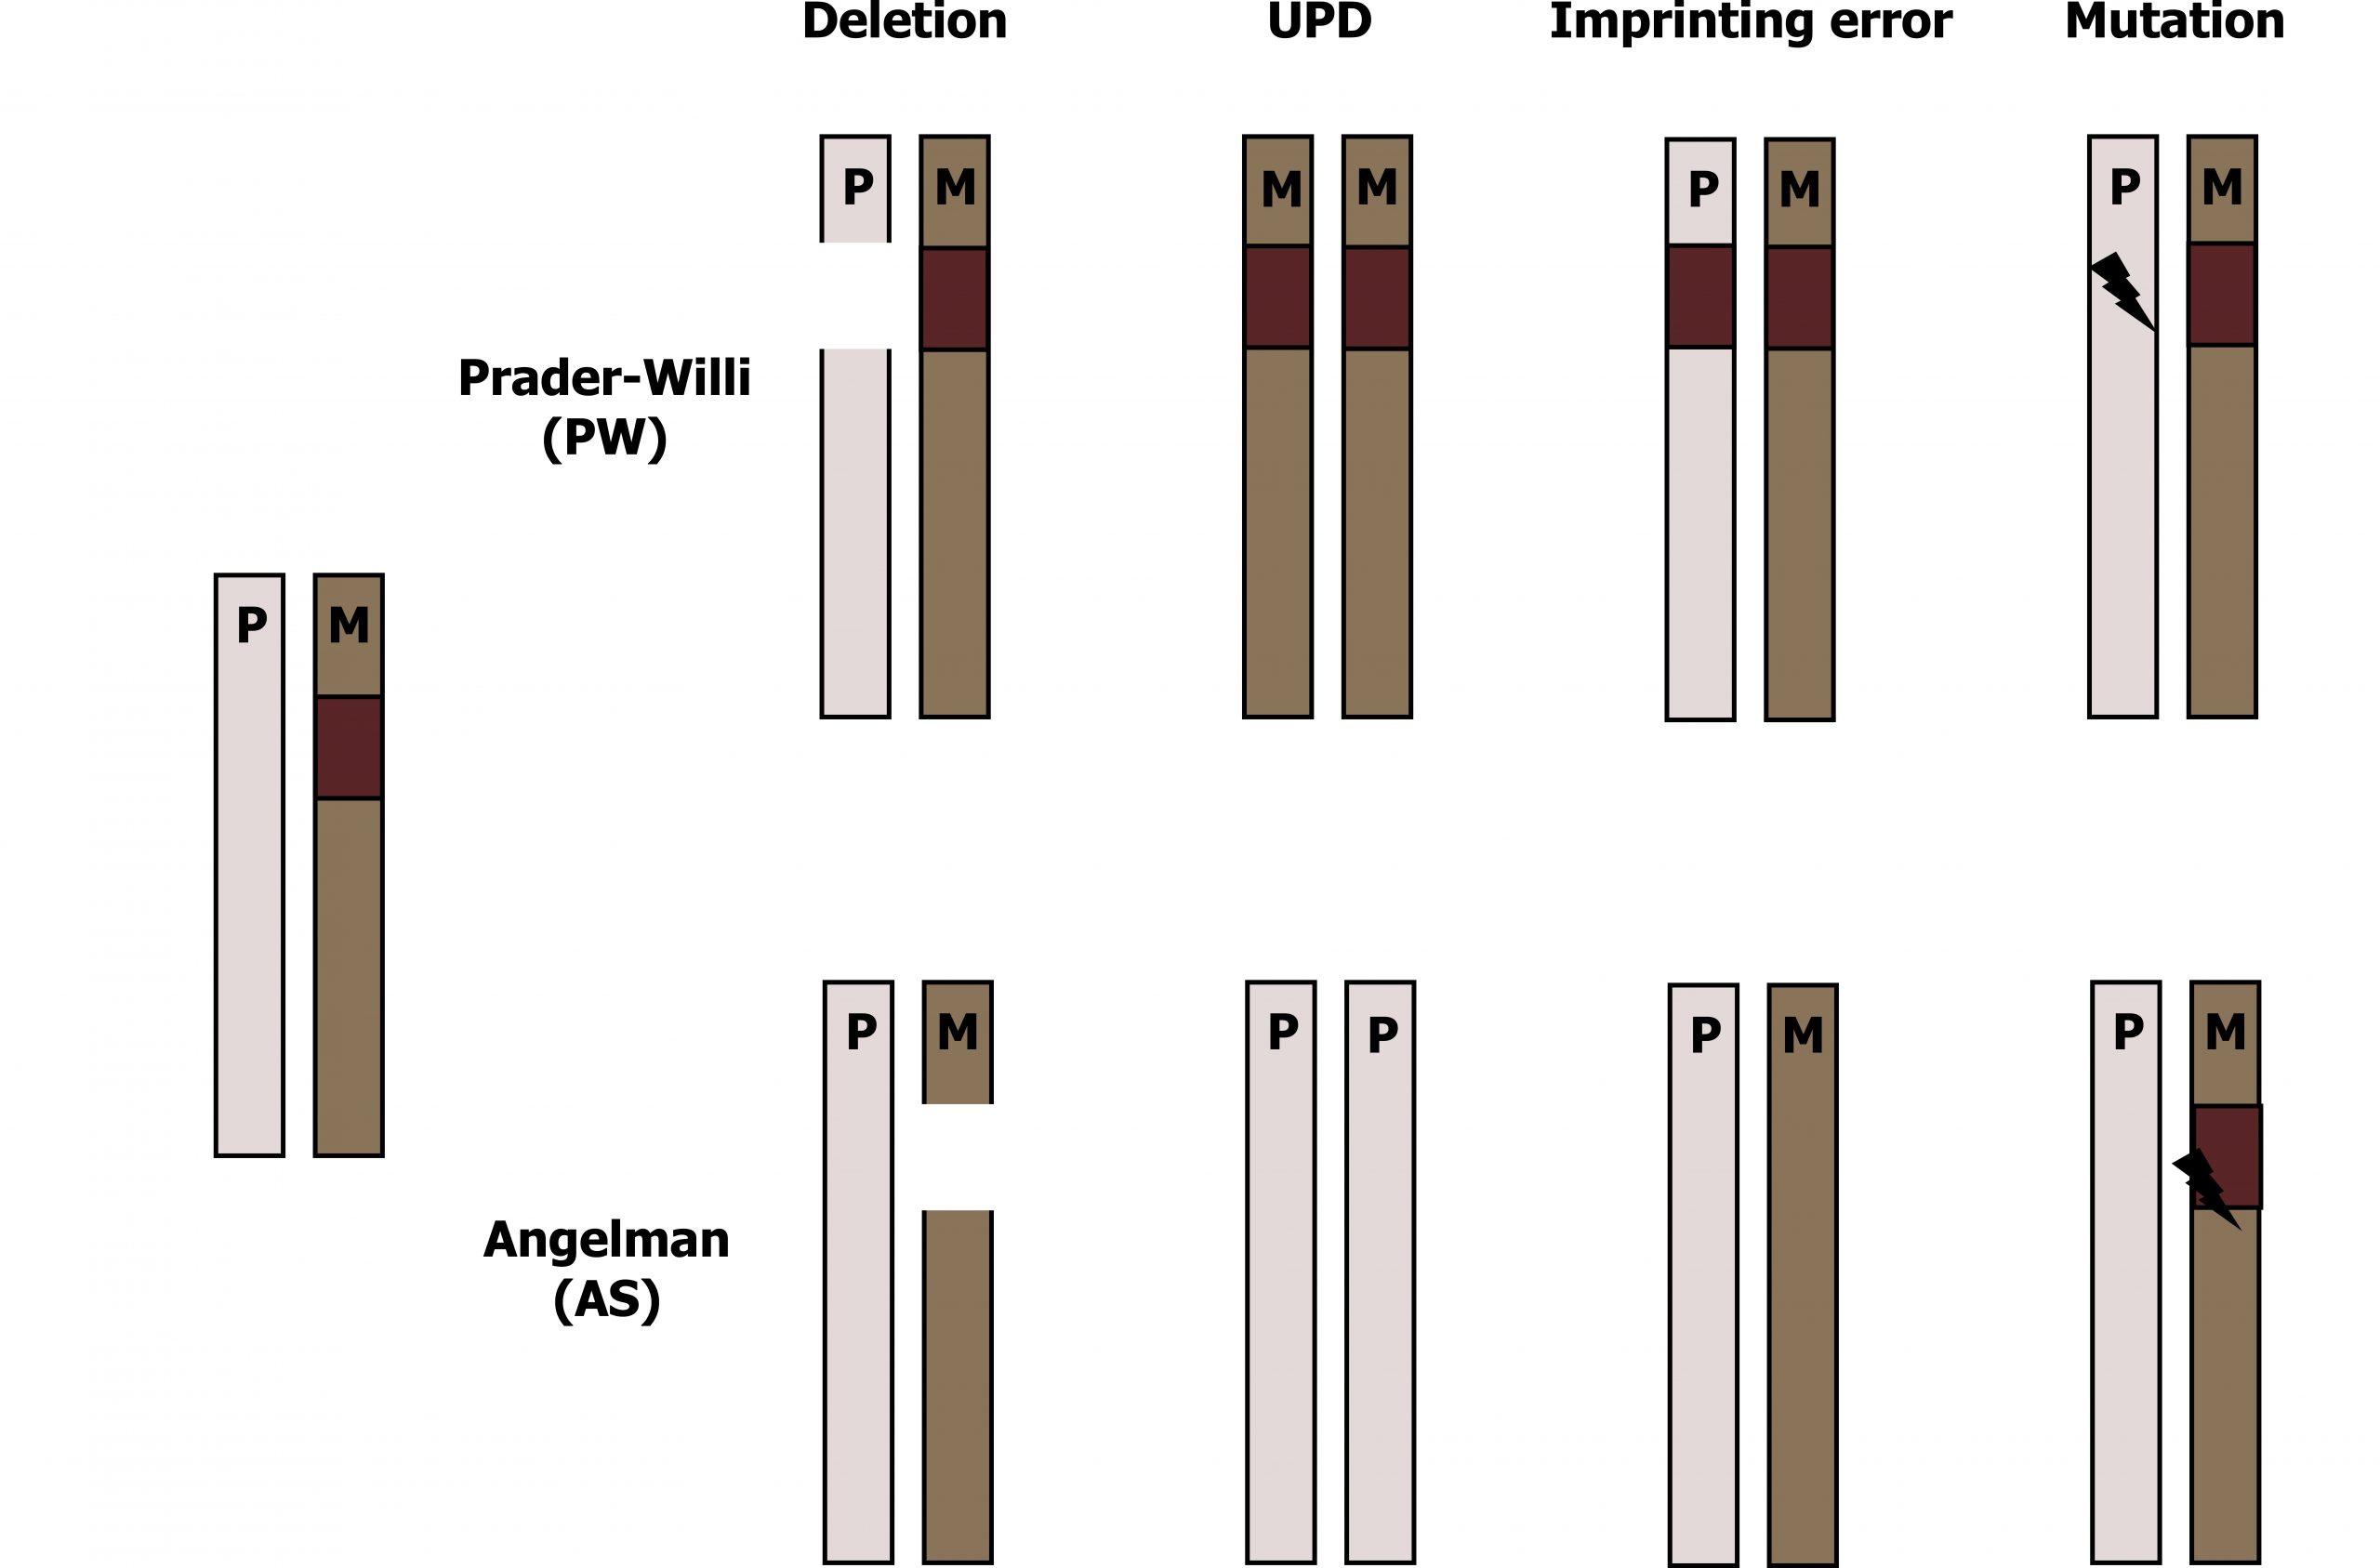
An example of this is Prader-Willi syndrome, a rare disorder due to the deletion or loss of expression from the paternal chromosome 15. This short region of genes is subject to maternal imprinting and typically only expressed from a single chromosomal loci. In these individuals, loss of expressivity from the paternal allele (either through a microdeletion or loss of chromosome 15) and imprinting of the maternal allele leads to this presentation. If both copies of the region are inherited from the paternal allele the result is the presentation of Angelman syndrome (figure 13.6).
Duplications refer to a chromosome segment appearing in two (often sequentially inserted) copies on a single homolog. Most of the time, this is caused by a nonhomologous recombination in the first meiotic division.
Inversion
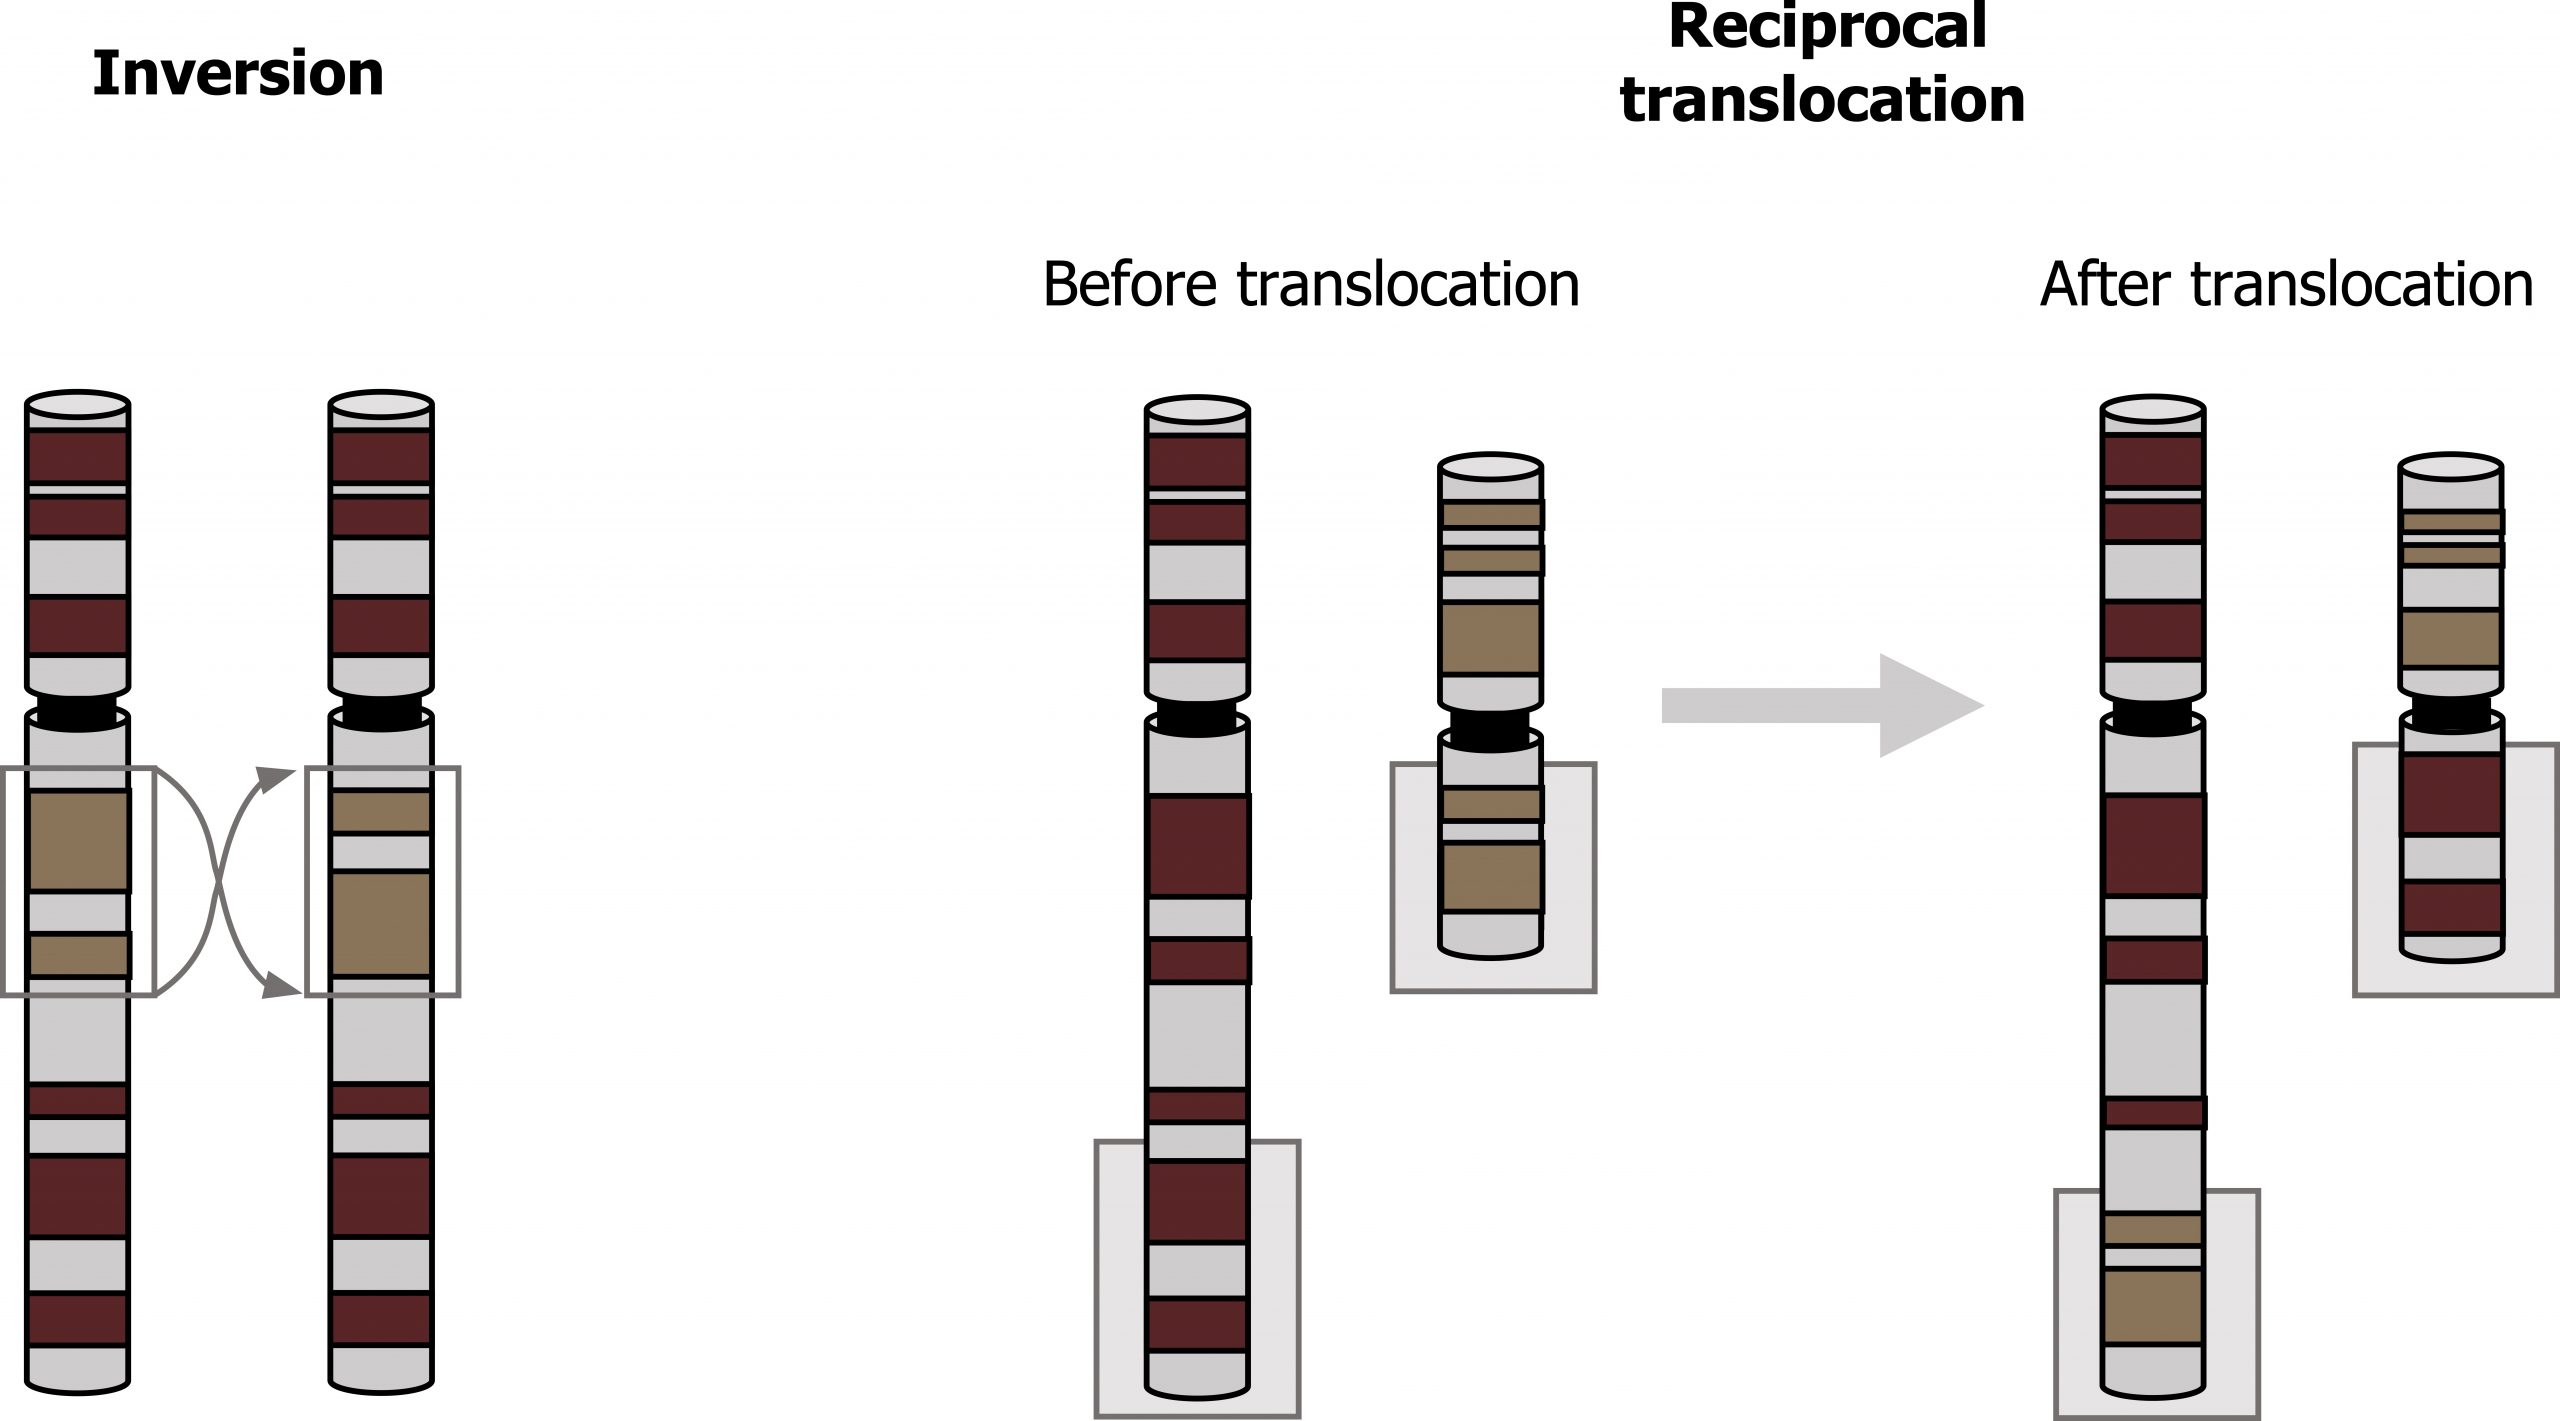
Inversion occurs when a chromosome segment between two breaks is rotated 180 degrees before reinsertion. The gene copy number remains the same; clinical symptoms may arise if there is an additional deletion or duplication, if the breaks occur within the coding region of a gene, or if the regulation of a gene is altered. Like other balanced chromosomal aberrations, inversions may cause infertility, recurrent miscarriages, or an unbalanced chromosome complement in a child (figure 13.7).
Isochromosome
An isochromosome is a derivative chromosome with two homologous arms after the centromere divided transversely rather than longitudinally. An isochromosome can be thought of as a “mirror image” of either the short arm or the long arm of a given chromosome.
Ring chromosome
Ring chromosomes occur when a chromosome breaks at both ends and the ends join together. They typically become clinically relevant through the loss of chromosomal material distal to the breaks. Ring chromosome X causes 5 percent of Turner syndrome cases.
Translocations
Translocations occur most often during meiosis if unequal crossing over occurs. Additionally, translocations (interchange of genetic material between nonhomologous chromosomes) can be another source of chromosomal abnormality (figure 13.7).
Translocations can be classified as either reciprocal or Robertsonian.
- Reciprocal translocations occur when there is a break in two different chromosomes and the material is mutually exchanged. The newly formed “derivate chromosomes” have a full genetic complement, and the carrier is typically unaffected as no genetic information is lost.
- Robertsonian translocations occur when the short arms of two nonhomologous chromosomes are lost and the long arms (q) fuse to form a single chromosome. The acrocentric chromosomes (13, 14, 15, 21, and 22) are very susceptible to this type of translocation as they are acrocentric with very short arms. The short arms typically carry very little genetic material, so the loss of them does not usually result in a carrier phenotype. These individuals have forty-five chromosomes.
13.1 References and resources
Text
Clark, M. A. Biology, 2nd ed. Houston, TX: OpenStax College, Rice University, 2018, Chapter 10: Cell Reproduction, Chapter 11: Meiosis and Sexual Reproduction, Chapter 13: Modern Understandings of Inheritance, Chapter 17: Biotechnology and Genomics.
Le, T., and V. Bhushan. First Aid for the USMLE Step 1, 29th ed. New York: McGraw Hill Education, 2018, 52–55.
LeClair, R. J., and R. G. Best. “Chromosome Mechanics.” eLS (2016): 1–11. https://onlinelibrary.wiley.com/doi/….a0001441.pub3.
Nussbaum, R. L., R. R. McInnes, H. F. Willard, A. Hamosh, and M. W. Thompson. Thompson & Thompson Genetics in Medicine, 8th ed. Philadelphia: Saunders/Elsevier, 2016, Chapter 5: Principles of Clinical Cytogenetics.
Figures
Bolzer A, Kreth G, Solovei I, et al. Figure 13.1 Representative karyotype illustrating 22 pairs of autosomes and one pair of sex chromosomes. PLoSBiol3.5.Fig7ChromosomesAluFish. CC BY 2.5. From WIkimedia Commons.
Csink AK, Henikoff S. Figure 13.6 Genetic basis of Prader-Willi (PWS) and Angelman syndrome(AS). Adapted under Fair Use from Trends in Genetics. Volume 14, Issue 5, 1 May 1998, pp 194-200. Figure 2. Prader-Willi and Angelman syndromes.
Grey, Kindred, Figure 13.2 Basics of chromosome structure. 2021. https://archive.org/details/13.2_20210926. CC BY 4.0. Added Karyotype (normal) by National Cancer Institute. Public domain. From Wikimedia Commons.
Grey, Kindred, Figure 13.3 Summary of meiotic and mitotic cell divisions. 2021. https://archive.org/details/13.3_20210926. CC BY 4.0. Adapted from Figure 1. CC BY 4.0. From Open Oregon.
Grey, Kindred, Figure 13.4 Comparison on nondisjunction in meiosis I vs. meiosis II. 2021. https://archive.org/details/13.4_20210926. CC BY 4.0. Adapted from Figure 8. CC BY 4.0. From Open Oregon.
Grey, Kindred, Figure 13.5 Mosaicism resulting in cells with differing genetics across the body. 2021. CC BY SA 3.0. Added Sperm by Amit Hazra from the Noun Project and Woman surface diagram ahead-behind dark skin by Jmarchn. CC BY-SA 3.0. From Wikimedia Commons.
Grey, Kindred, Figure 13.7 Example of a chromosome inversion and translocation. 2021. https://archive.org/details/13.7_20210926. CC BY 4.0.
13.2 Biotechnology
Basic techniques to manipulate genetic material (DNA and RNA)
To evaluate genetic disorders a variety of biochemical techniques can be used. The type, kind, and size of the projected genetic variation will determine what approach is taken.
Following DNA extraction there are a variety of techniques that can be employed. The lowest resolution technique for evaluating the genome is the karyotype followed by high-resolution banding. From here, smaller genomic changes can be observed using comparative genome hybridization, fluorescence in situ hybridization (FISH) analysis, or microarrays. Finally, specific nucleotide changes can be examined by whole genome sequencing.
DNA and RNA extraction
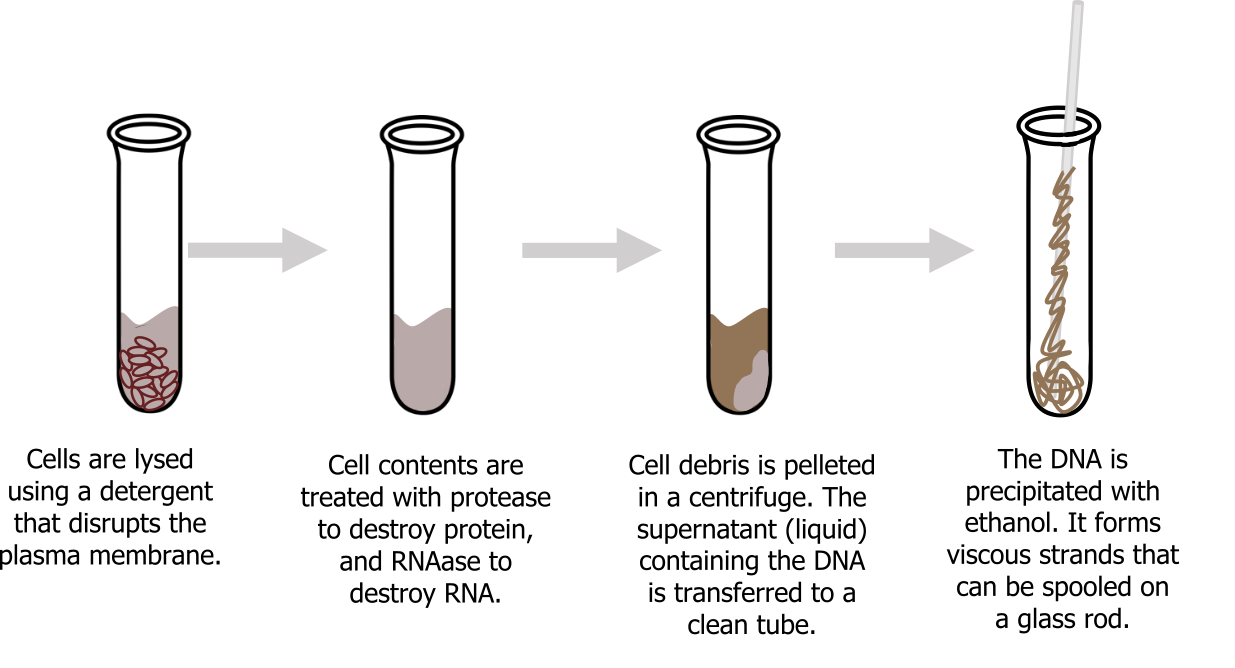
To study or manipulate nucleic acids, one must first isolate or extract the DNA or RNA from the cells. Most nucleic acid extraction techniques involve steps to break open the cell and use enzymatic reactions to destroy all macromolecules that are not desired. Enzymes such as proteases that break down proteins inactivate macromolecules, and ribonucleases (RNAses) that break down RNA are inhibited to ensure sample stability. Using alcohol precipitates the DNA. Human genomic DNA is usually visible as a gelatinous, white mass. One can store the DNA samples frozen at ‒80°C for several years (figure 13.8).
Scientists perform RNA analysis to study gene expression patterns in cells. RNA is naturally very unstable because RNAses are commonly present in nature and very difficult to inactivate. Similar to DNA, RNA extraction involves using various buffers and enzymes to inactivate macromolecules and preserve the RNA.
Karoytype and high-resolution banding
Karyotyping can be used to look at general chromosome morphology and chromosome number. To do this, cells are harvested and arrested in metaphase allowing for the chromosomes to be fixed, spread on slides, and stained by one of several techniques. Giemsa banding (G banding) is the gold standard for the detection and characterization of structural and numerical genomic abnormalities in clinical diagnostic settings for both constitutional (postnatal or prenatal) and acquired (cancer) disorders.
The pattern of light and dark bands on each chromosome is numbered on each arm from the centromere to the telomere, and comparison of a patient sample to a standard map can be used to precisely identify changes in chromosome structure. Microdeletion syndromes can be detected with this technique (figure 13.9).
Fluorescence in situ hybridization (FISH)
FISH is a targeted approach using a sequence-specific probe to detect the presence or absence of a particular DNA sequence or for evaluating the number or organization of a chromosome or chromosomal region in situ.
This technique has several advantages and can be used to identify a variety of different chromosomal changes:
- DNA probes specific for chromosomal regions, or genes, can be labeled with different fluorochromes and used to identify particular chromosomal rearrangements.
- Repetitive DNA probes allow detection of satellite DNA or other repeated DNA elements localized to specific chromosomal regions.
Microarrays
Although FISH can detect chromosome changes, microarrays can simultaneously query the whole genome to detect relative copy number variations, gains, or losses by hybridizing a control genome to one of a patient. In looking at the results, an excess of sequences from one genome would represent an overrepresentation in a gene locus within an individual (duplication). This technique can also be used to look at single nucleotide polymorphisms to determine allele frequency.
DNA sequencing techniques
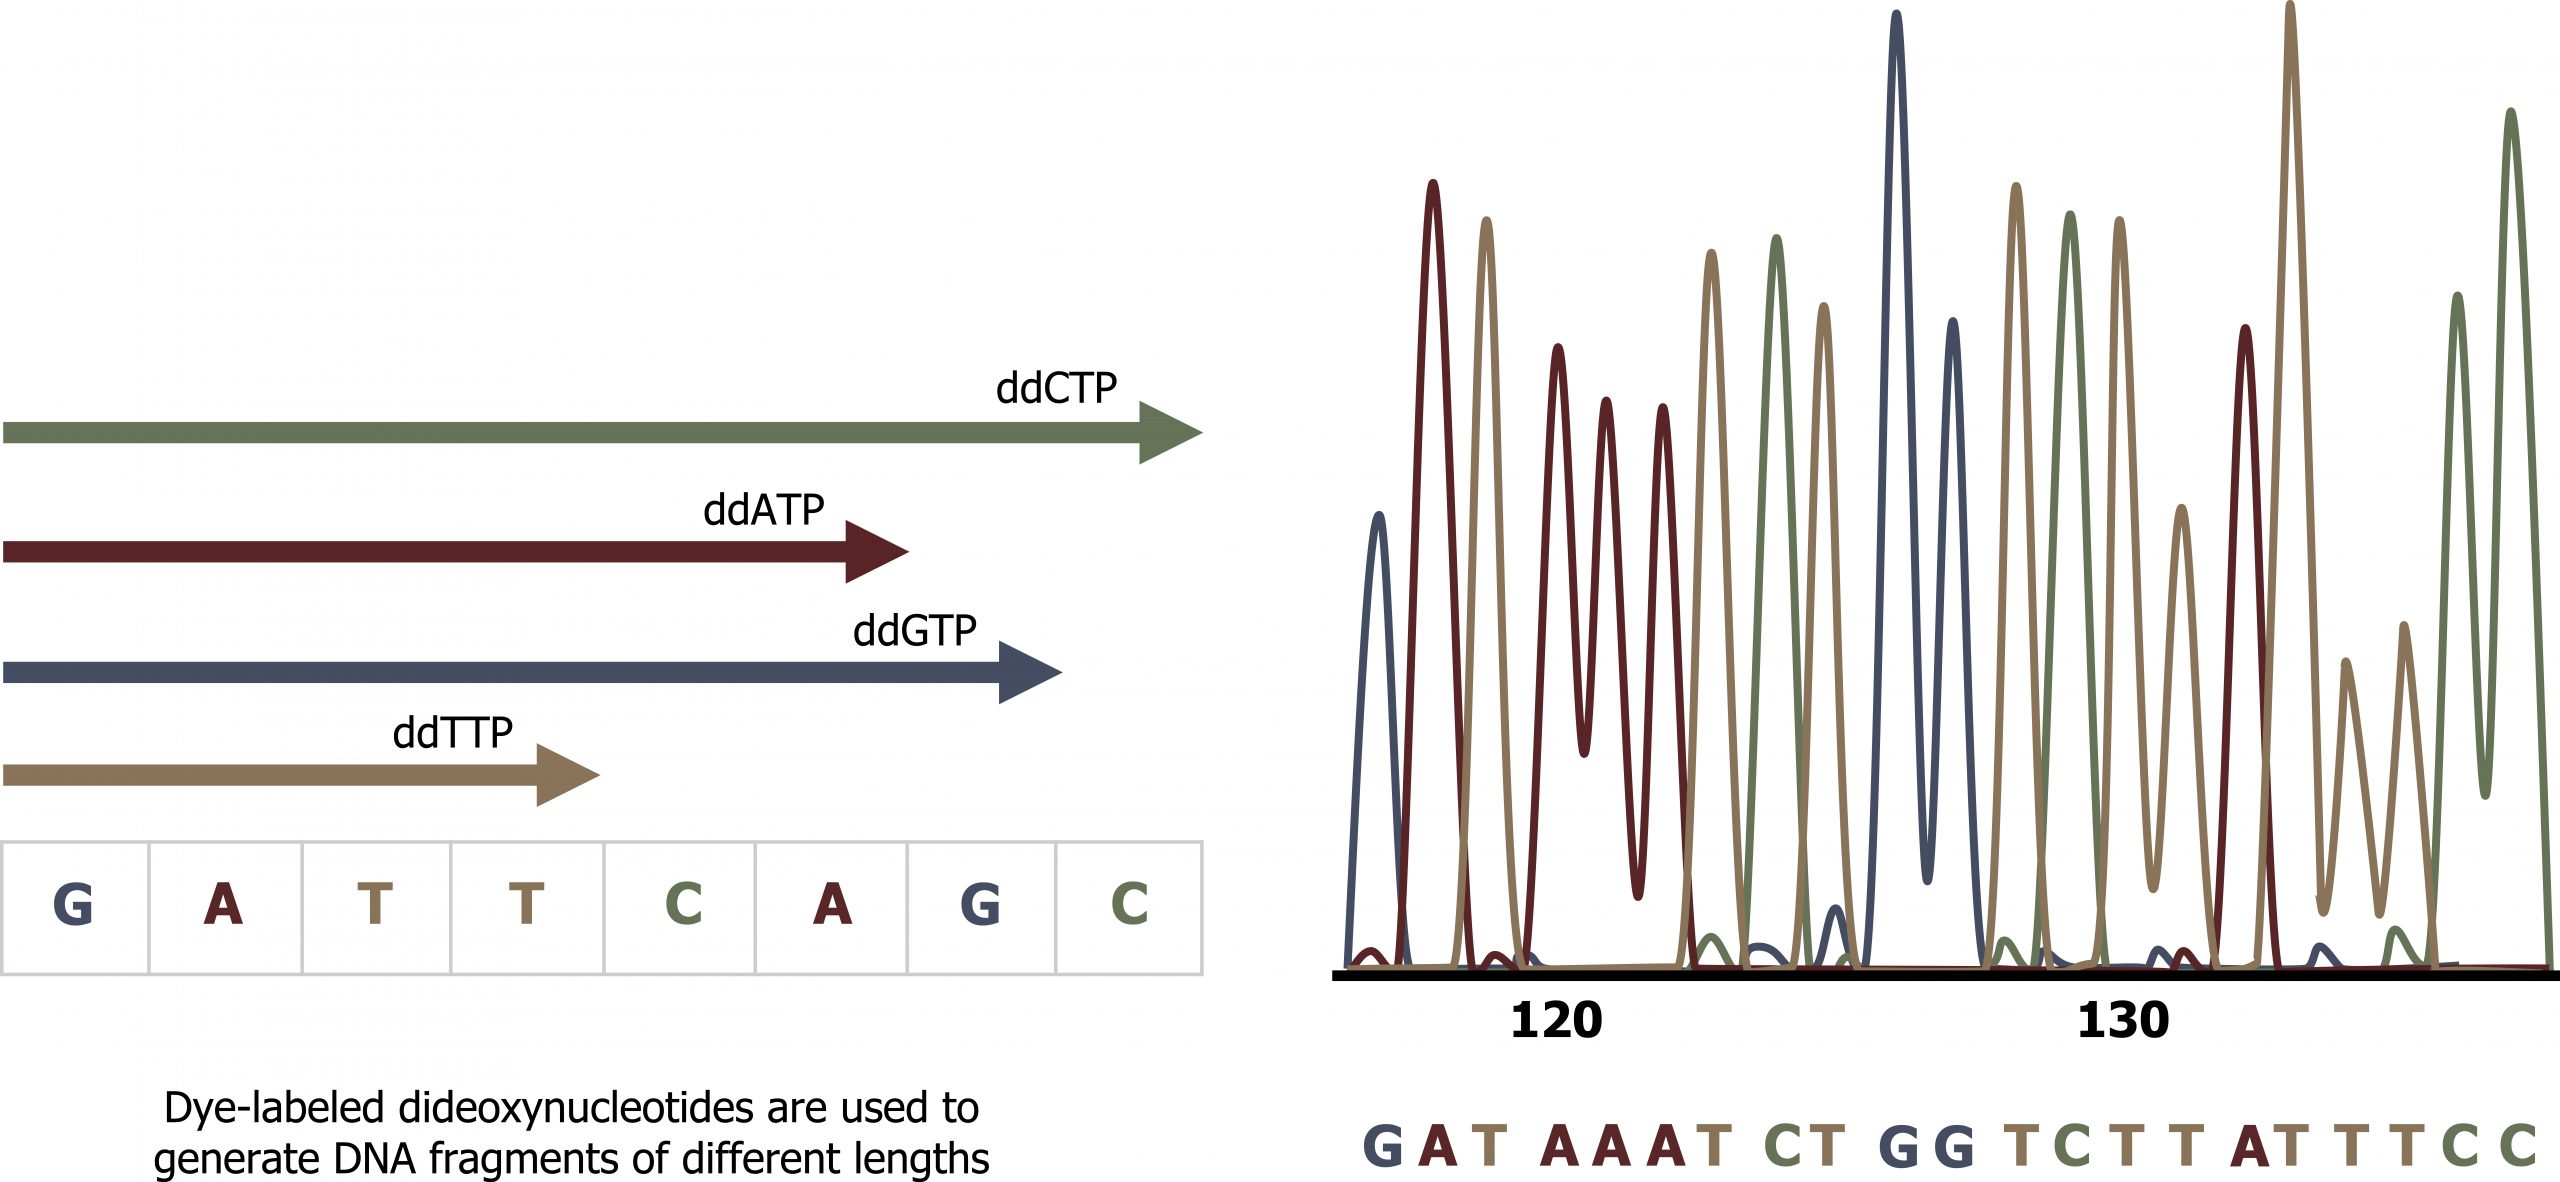
Sanger sequencing is commonly referred to as the dideoxy chain termination method. The method is based on the use of chain terminators, the dideoxynucleotides (ddNTPs). The ddNTPSs differ from the deoxynucleotides by the lack of a free 3′ OH group on the five-carbon sugar. If a ddNTP is added to a growing DNA strand, the chain cannot be extended any further because the free 3′ OH group needed to add another nucleotide is not available. By using a predetermined ratio of deoxyribonucleotides to dideoxynucleotides, it is possible to generate DNA fragments of different sizes.
The DNA sample to be sequenced is denatured (separated into two strands by heating it to high temperatures). The DNA is divided into four tubes in which a primer, DNA polymerase, and all four nucleoside triphosphates (A, T, G, and C) are added. In addition, limited quantities of one of the four dideoxynucleoside triphosphates (ddCTP, ddATP, ddGTP, and ddTTP) are added to each tube respectively. The tubes are labeled as A, T, G, and C according to the ddNTP added. For detection purposes, each of the four dideoxynucleotides carries a different fluorescent label. Chain elongation continues until a fluorescent dideoxy nucleotide is incorporated, after which no further elongation takes place. After the reaction is over, electrophoresis is performed. Even a difference in length of a single base can be detected (figure 13.10).
Nucleic acid fragment amplification by polymerase chain reaction (PCR)
DNA analysis often requires focusing on one or more specific genome regions. Polymerase chain reaction (PCR) is a technique that scientists use to amplify specific DNA regions for further analysis (figure 13.11). Researchers use PCR for many purposes in laboratories, such as cloning gene fragments to analyze genetic diseases, identifying contaminant foreign DNA in a sample, and amplifying DNA for sequencing. More practical applications include determining paternity and detecting genetic diseases.
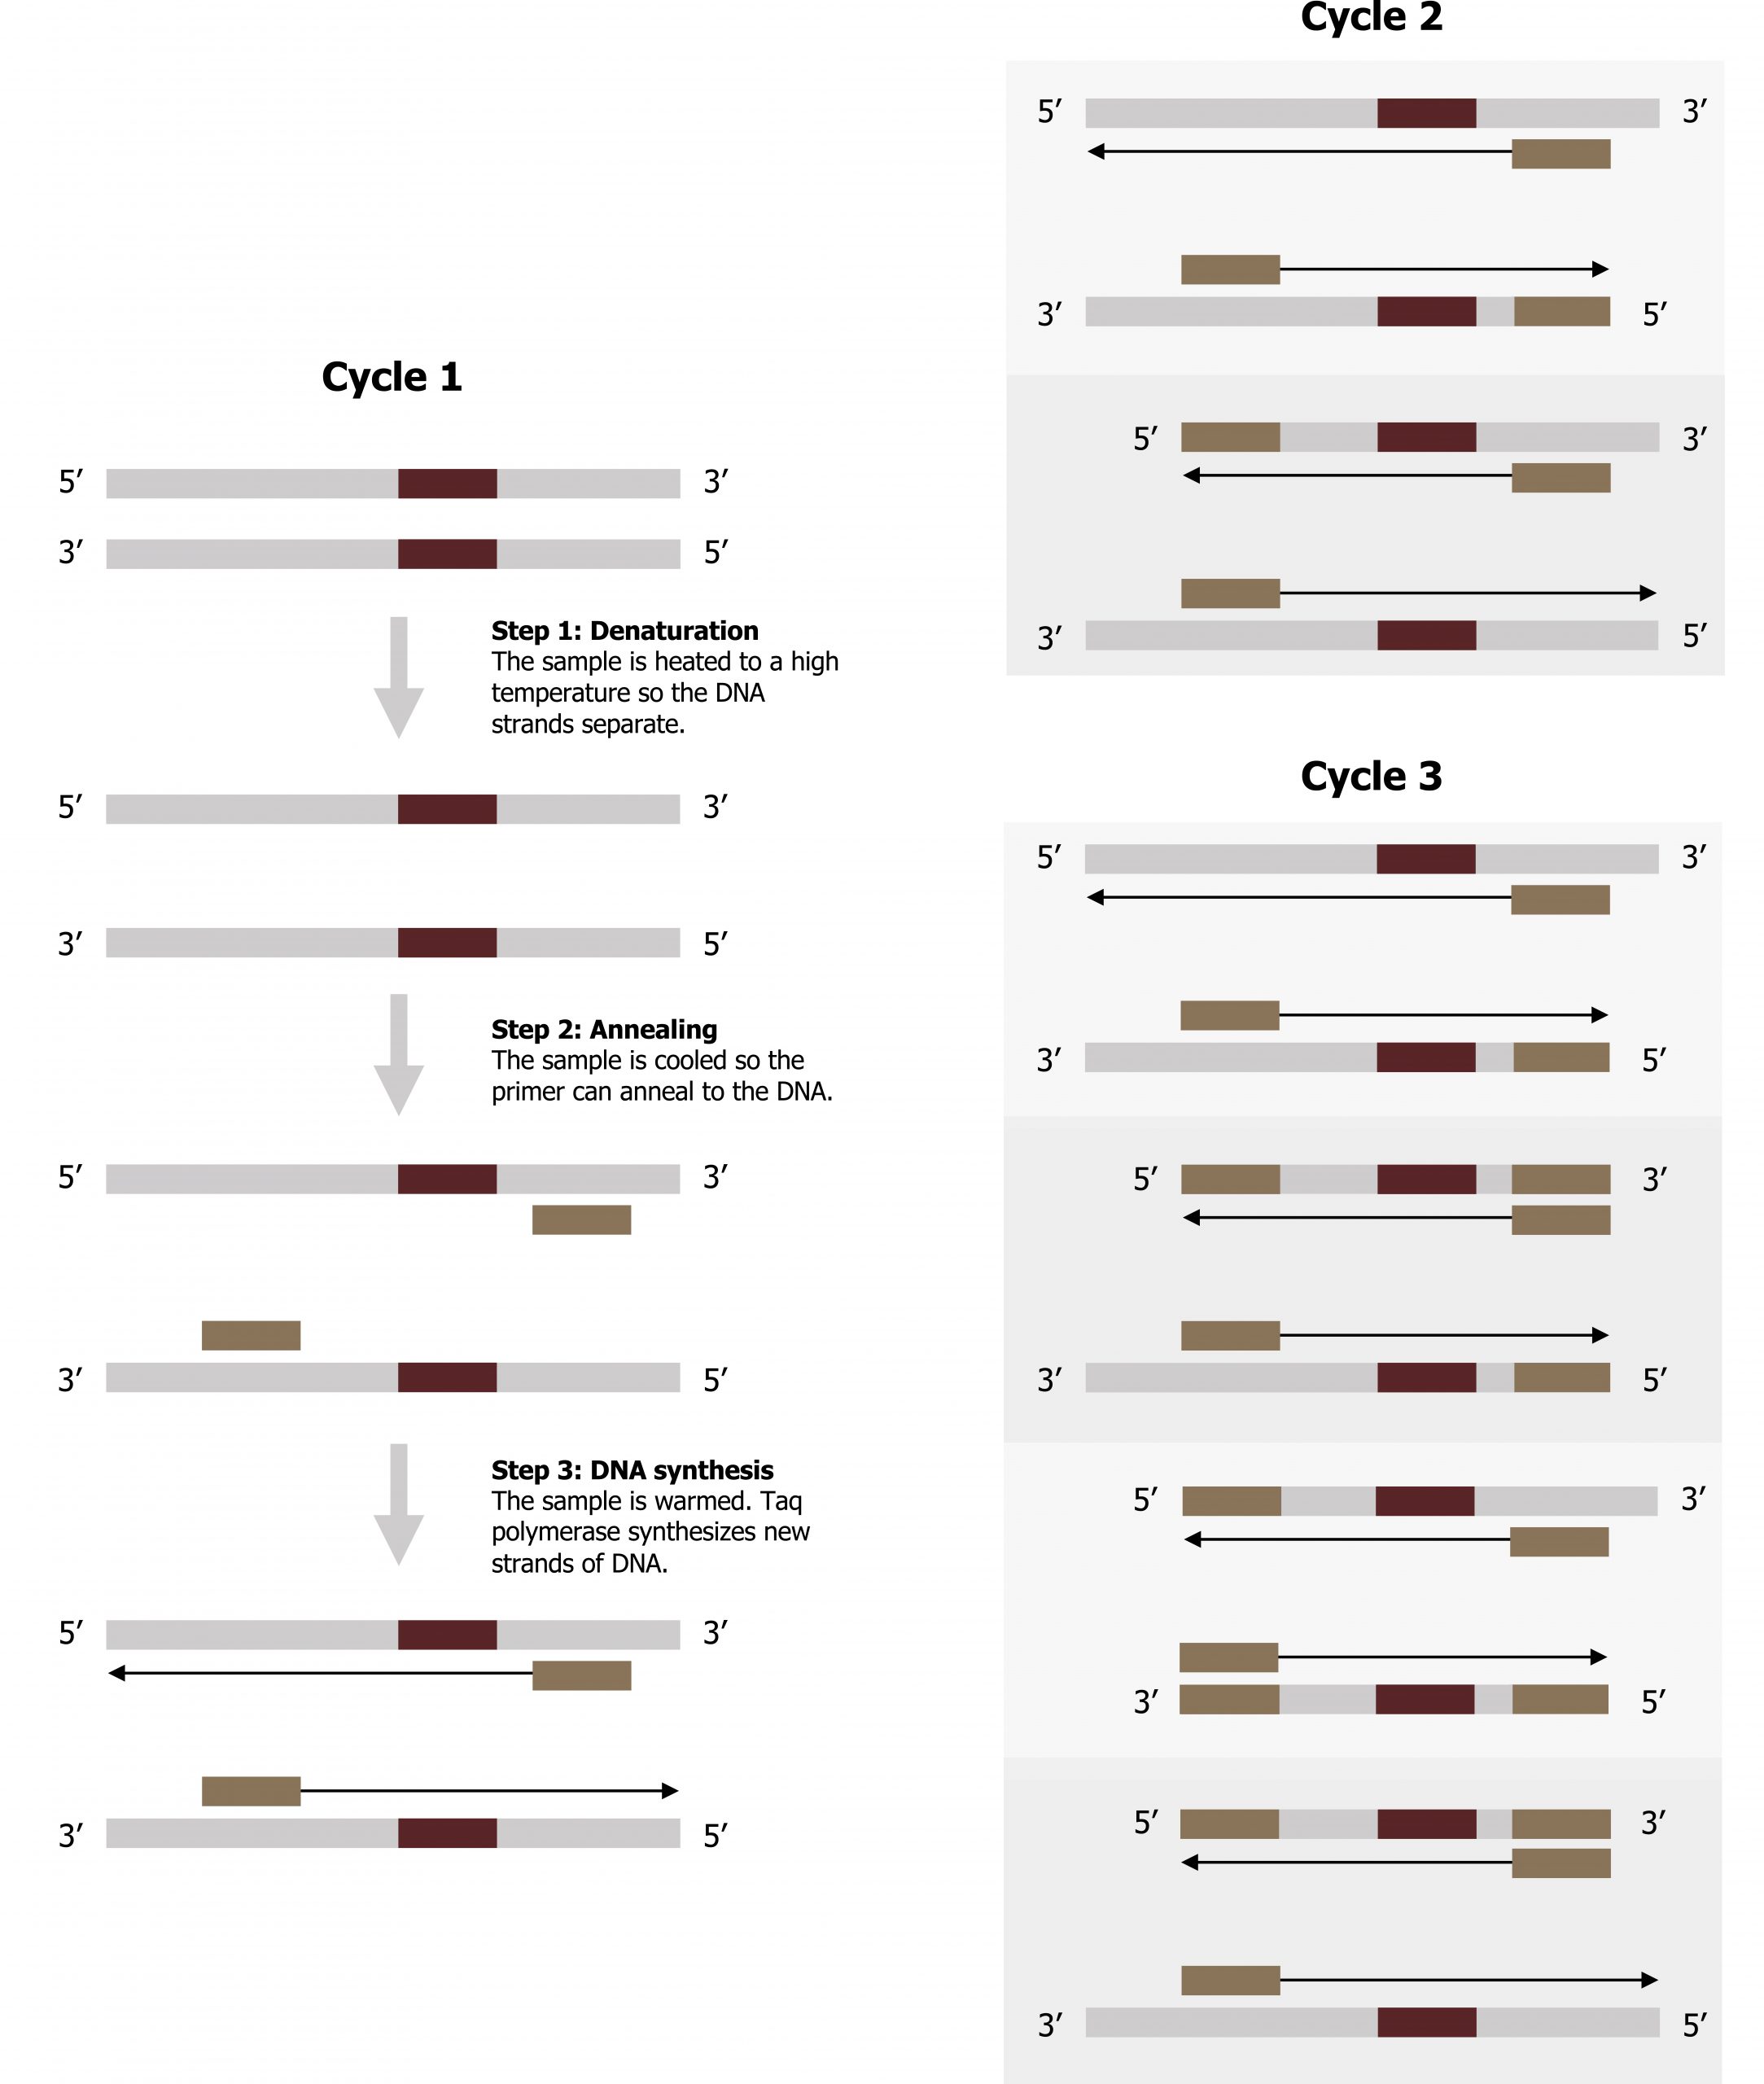
Scientists use polymerase chain reaction, or PCR, to amplify a specific DNA sequence. Primers are short pieces of DNA complementary to each end of the target sequence combined with genomic DNA, Taq polymerase, and deoxynucleotides.
Reverse transcriptase PCR (RT-PCR) is similar to PCR, but cDNA is made from an RNA template before PCR begins. DNA fragments can also be amplified from an RNA template in a process called reverse transcriptase PCR (RT-PCR). The first step is to recreate the original DNA template strand (called cDNA) by applying DNA nucleotides to the mRNA. This process is called reverse transcription. This requires the presence of an enzyme called reverse transcriptase. After the cDNA is made, regular PCR can be used to amplify it.
Gel electrophoresis
Gel electrophoresis is a technique used to separate DNA fragments of different sizes. Usually the gel is made of a chemical called agarose or polyacylamide depending on the sample being used. The DNA has a net negative charge and moves from the negative electrode toward the positive electrode. The electric current is applied for sufficient time to let the DNA separate according to size; the smallest fragments will be farthest from the well (where the DNA was loaded), and the heavier molecular weight fragments will be closest to the well. Once the DNA is separated, the gel is stained with a DNA-specific dye for viewing it.
Hybridization, southern blotting, and northern blotting
Different types of electrophoresis can be used to look at various changes at the level of the DNA (genome), RNA (transcriptome), or protein (proteome). In all cases, a sample (DNA, RNA, protein) is run on a gel (electrophoresis) and is then examined using a probe specific to the sample.
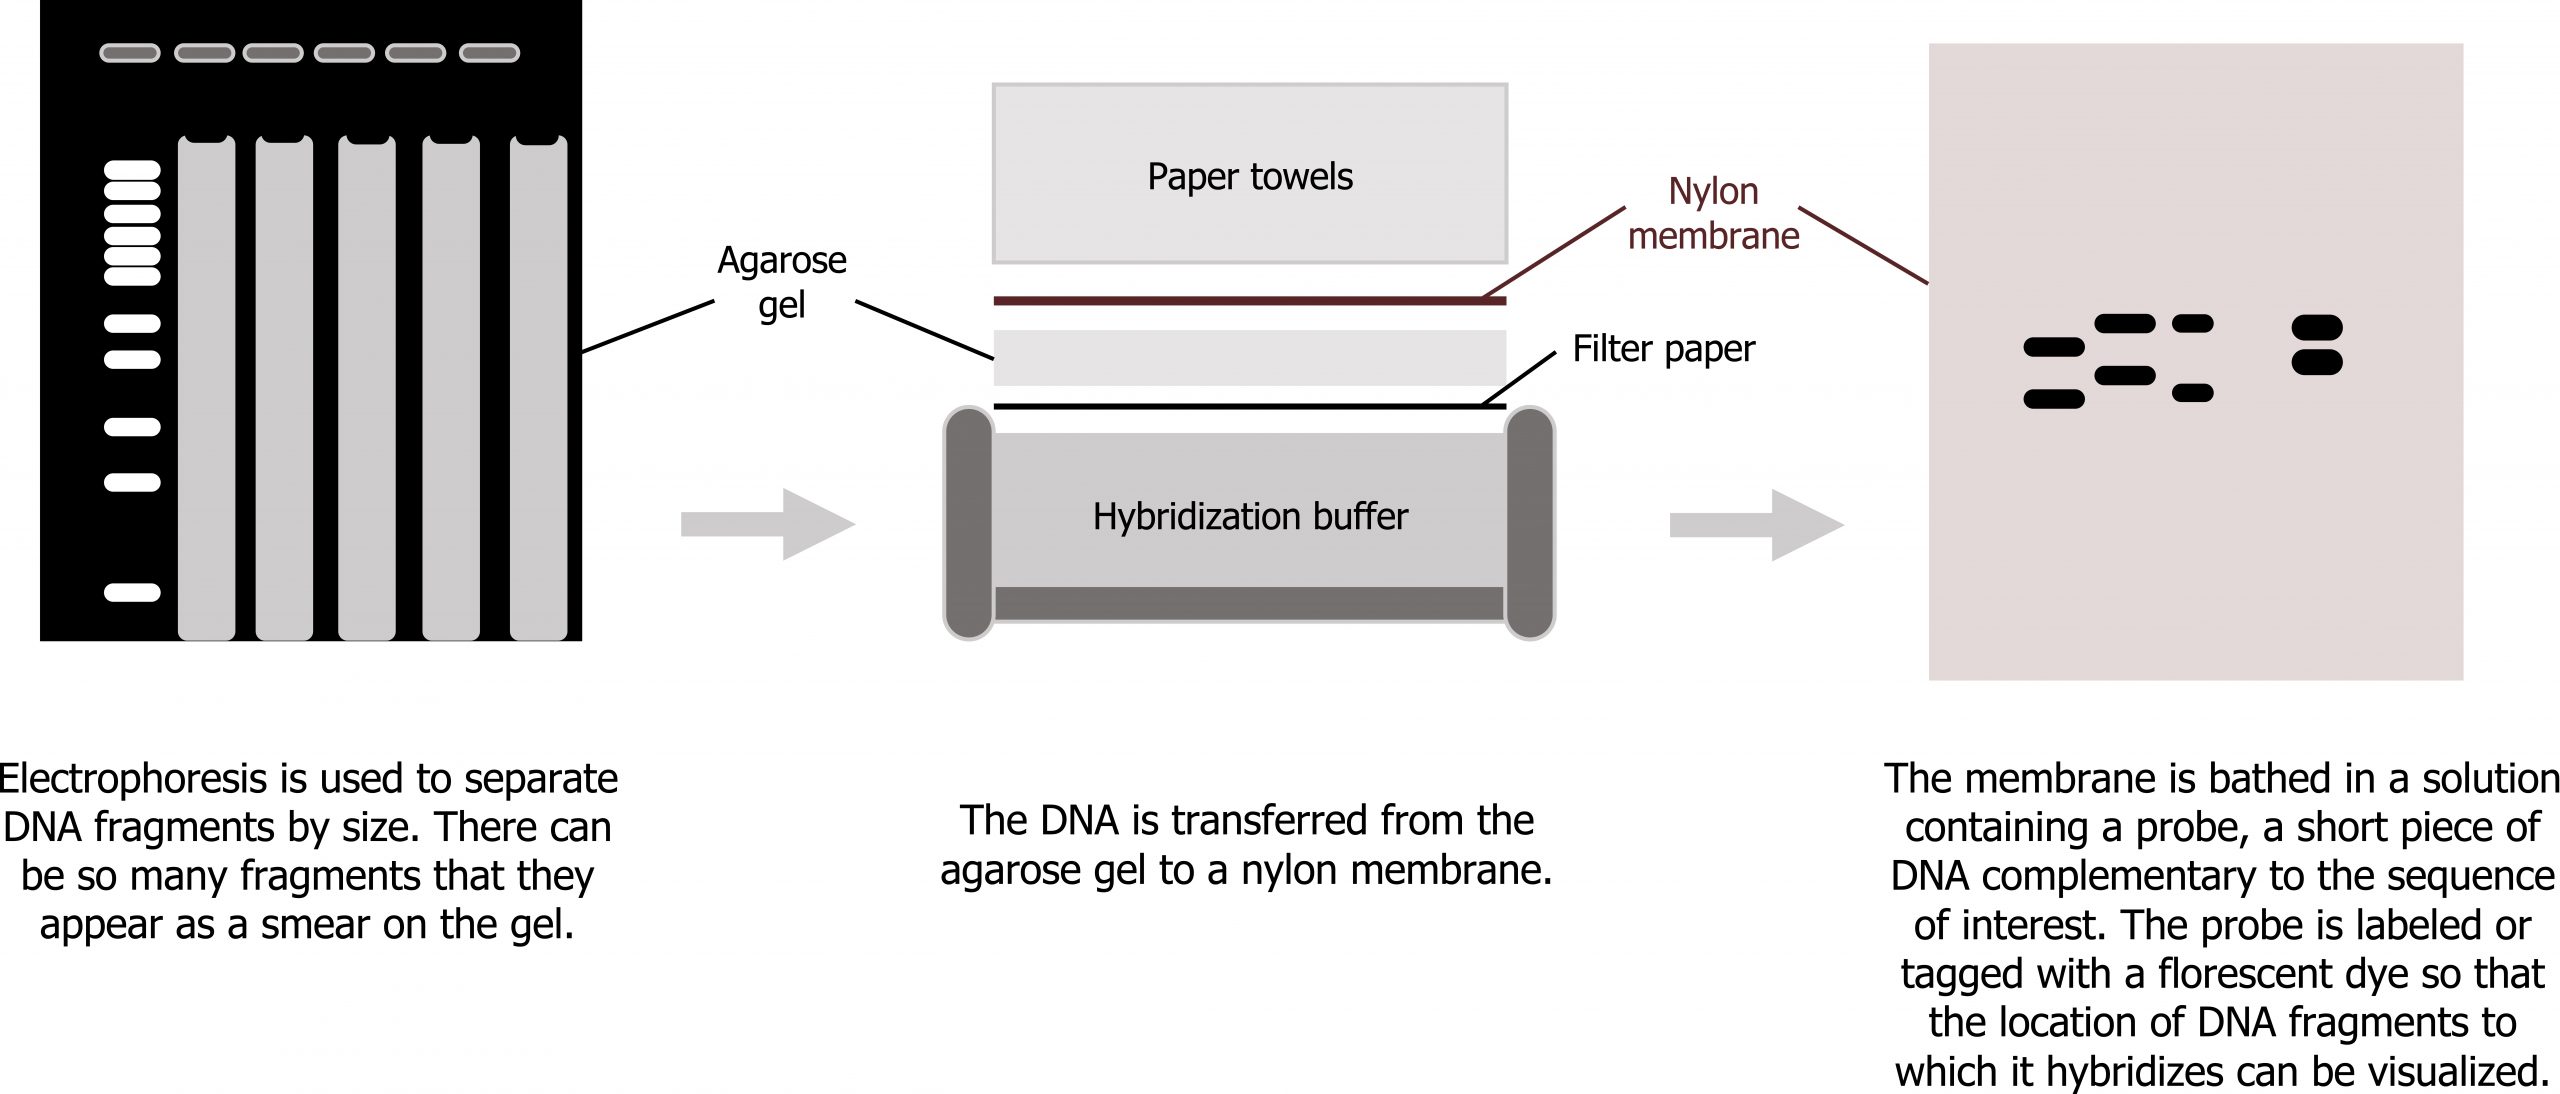
Southern blots are designed to examine changes in DNA. DNA, typically genomic DNA, is probed with a DNA probe complementary to the region of interest in the genome (figure 13.12).
Northern blots are designed to examine changes in RNA. RNA is probed with a DNA probe complementary to the transcript of interest. This will detect changes in gene expression.
Western blots are designed to examine changes in protein size and amount. Cell lysates or protein isolates are probed with an antibody specific to the protein of interest. This will detect changes in protein expression.
13.2 References and resources
Text
Clark, M. A. Biology, 2nd ed. Houston, TX: OpenStax College, Rice University, 2018, Chapter 10: Cell Reproduction, Chapter 11: Meiosis and Sexual Reproduction, Chapter 13: Modern Understandings of Inheritance, Chapter 17: Biotechnology and Genomics.
Le, T., and V. Bhushan. First Aid for the USMLE Step 1, 29th ed. New York: McGraw Hill Education, 2018, 52–55.
LeClair, R. J., and R. G. Best. “Chromosome Mechanics.” eLS (2016): 1–11. https://onlinelibrary.wiley.com/doi/….a0001441.pub3.
Nussbaum, R. L., R. R. McInnes, H. F. Willard, A. Hamosh, and M. W. Thompson. Thompson & Thompson Genetics in Medicine, 8th ed. Philadelphia: Saunders/Elsevier, 2016, Chapter 5: Principles of Clinical Cytogenetics.
Figures
Grey, Kindred, Figure 13.8 Basic process for DNA extraction. 2021. CC BY 4.0. Adapted from Biology 2e. Figure 17.3 This diagram shows the basic method of DNA extraction.CC BY 4.0. From OpenStax. Added Test Tube by Victoria Codes from the Noun Project.
Grey, Kindred, Figure 13.10 Schematic of Sanger sequencing technique. 2021. CC BY 4.0. Adapted from Biology 2e. Figure 17.14 This figure illustrates Frederick Sanger’s dideoxy chain termination method. CC BY 4.0. From OpenStax.
Grey, Kindred, Figure 13.12 Schematic of Southern Blotting technique. 2021. CC BY 4.0. Adapted from Biology 2e. Figure 17.6 Scientists use Southern blotting to find a particular sequence in a DNA sample. CC BY 4.0. From OpenStax.
Lieberman M, Peet A. Figure 13.11 Overview of polymerase chain reaction. Adapted under Fair Use from Marks’ Basic Medical Biochemistry. 5th Ed. pp 329. Figure 17.10 Polymerase chain reaction (PCR). 2017.
National Cancer Institute. Figure 13.9 Male karyotype with G-banding patterns. Karyotype (normal). Public domain. From Wikimedia Commons.
