1 Biochemistry Basics
Learning Objectives
- Review basic amino acid structure and determine the functional capabilities of amino acids based on their R-groups.
- Review how enzymes catalyze specific reactions essential to a cell and how these reactions have specific chemistry based on the Km and Vmax of the enzyme.
- Determine how the kinetics of an enzyme can be altered by cofactors, coenzymes, inhibitors, and activators.
About this Chapter
This chapter is for reference only and contains basic information on amino acid structure and enzyme regulation. The fundamental building blocks of proteins and enzymes are amino acids. Their unique structures and functional groups allow for specific interactions that can enhance enzyme activity, facilitate folding of individual motifs, and provide stability for the protein structure as a whole. The ability to regulate enzyme activity is an essential component to cellular homeostasis. Enzymes can be regulated by many extrinsic factors that will increase or decrease product production, change enzyme concentration, or change substrate availability. Regardless of the mechanisms of regulation, pathway control will be a recurring component to all biochemistry. It should be noted that the mechanisms discussed here are not fully inclusive but highlight the most commonly used mechanisms of regulation in the biochemical reactions presented in the rest of the content.
1.1 Amino Acids
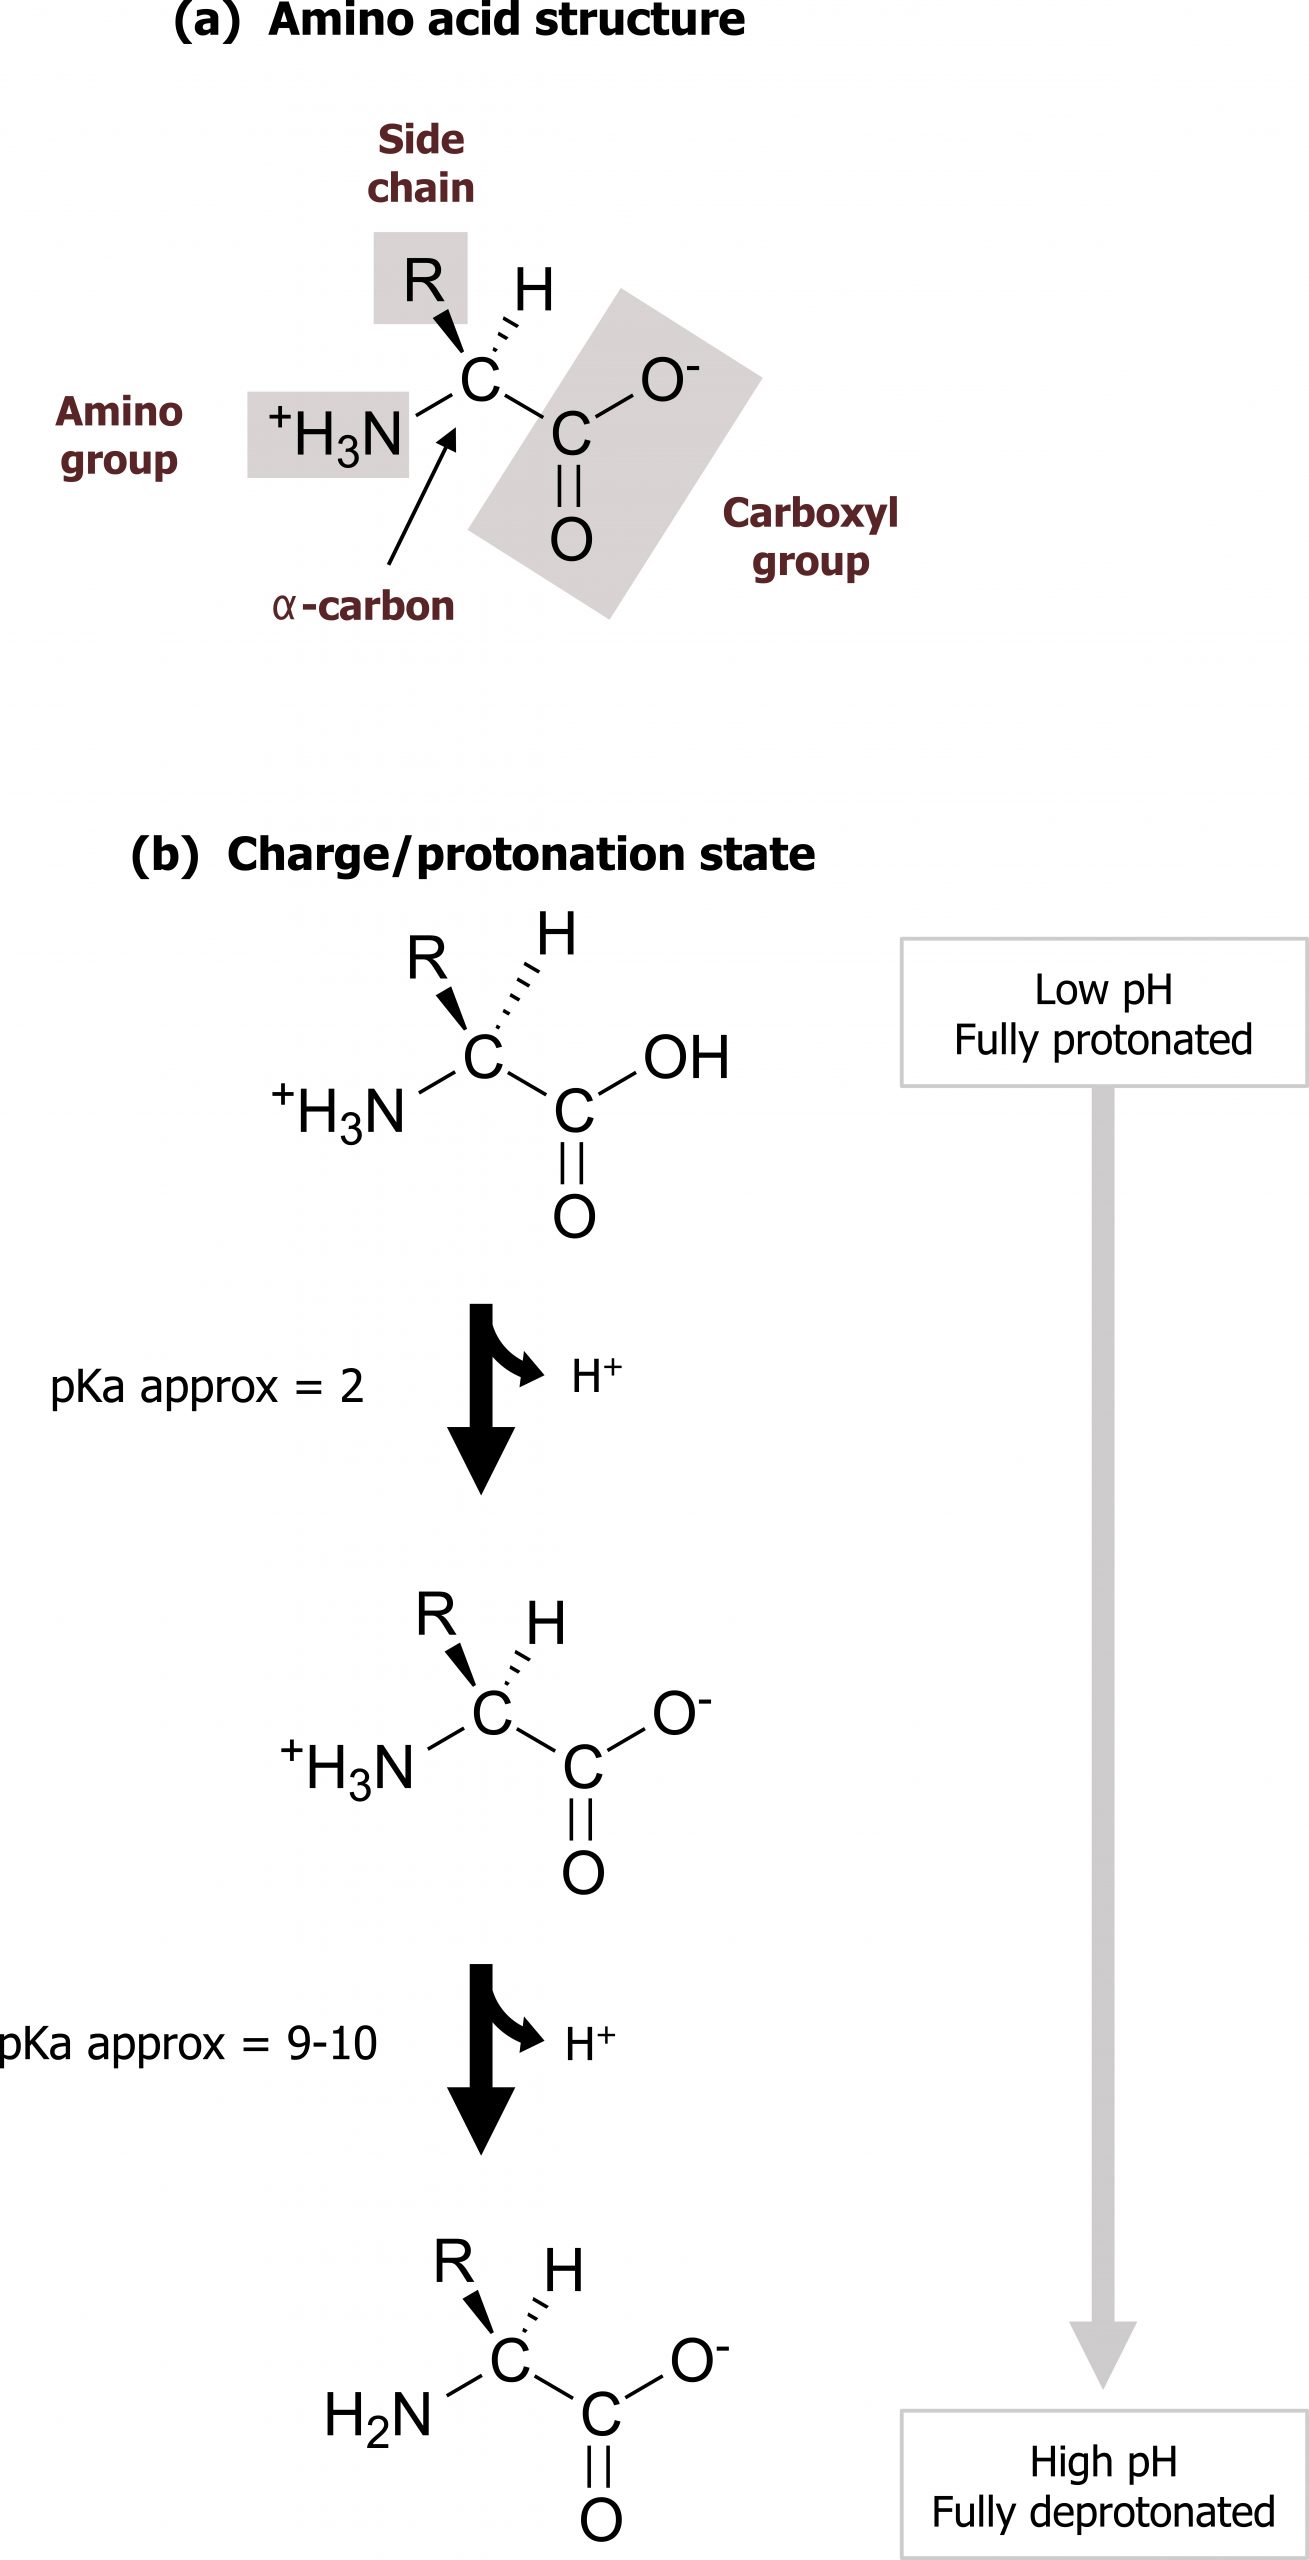
There are twenty commonly occurring amino acids in mammalian proteins (nine essential and eleven nonessential). Each amino acid has a carboxyl group, a primary amino group, and a unique side chain (R-group) bonded to the α-carbon atom. At physiologic pH (approximately 7.4), amino acids are present as zwitter ions with the carboxyl group forming the negatively charged carboxylate ion (COO–), and the amino group is protonated (NH3+) (figure 1.1).
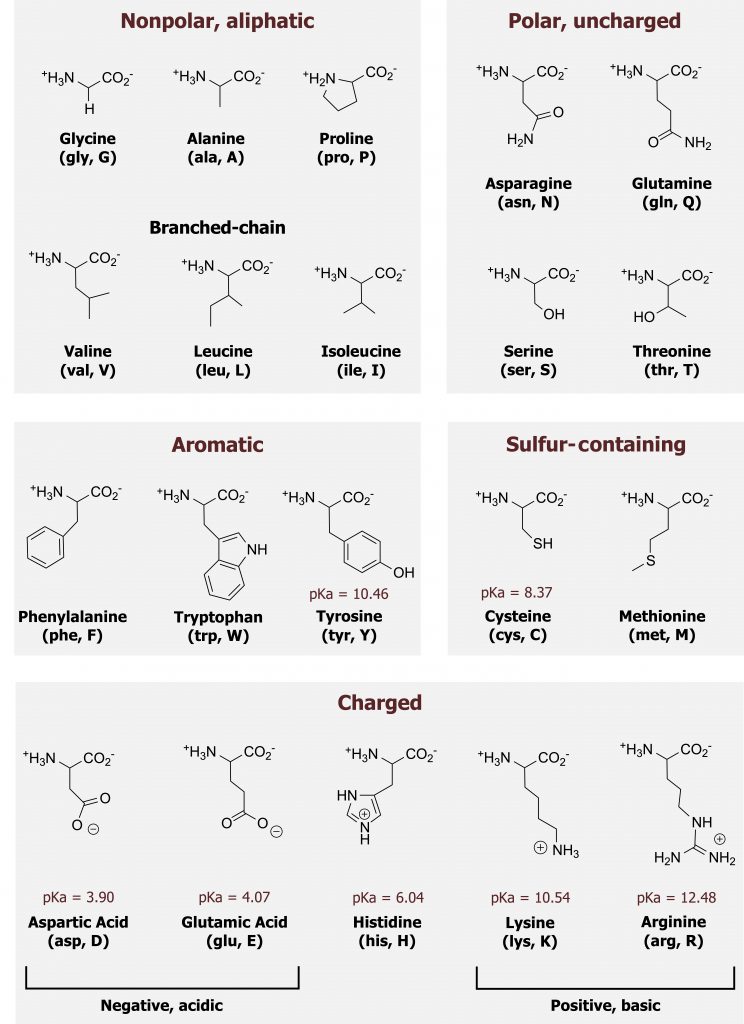
Amino acids can be grouped largely by the functionality of their R-group (figure 1.2).
Although it is not essential to memorize the structures of the amino acids, a strong understanding of their general characteristics will be very helpful.
Amino acid functional groups
The primary sequence of a protein is determined by the amino acids in the chain and how these individual units function as a group. More generally, amino acids can be characterized as polar or nonpolar. These fundamental characteristics will determine where the residue resides within the protein (surface or core, within a transmembrane domain or part of the active site) and how the amino acid contributes to folding and catalysis.
Nonpolar residues
Nonpolar amino acids can be further divided into: uncharged (aromatic and nonpolar aliphatic) and sulfur-containing groups. Nonpolar uncharged side chains do not gain or lose protons or participate in hydrogen or ionic bonding. These amino acids typically cluster in the internal regions of a protein, away from the aqueous interface. The exception to this is if these amino acids are present as part of a membrane-bound protein, and in this case, the amino acids may be exposed in the transmembrane region. Proline is also of note, as it forms an unconventional peptide bond and will add a kink in the primary structure of a protein. Sulfur-containing amino acids can participate in disulfide linkages, which are used to stabilize interactions between peptide chains or tertiary structures.
Polar residues
Amino acids with uncharged polar R-groups may participate in hydrogen bonding and undergo modifications such as phosphorylation. Tyrosine, serine, and threonine all have a hydroxyl group within the R-group, and they can also be readily modified by kinase-mediated phosphorylation.
Some amino acids are charged at a physiological pH and can be acidic or basic. These side chains may donate or accept protons, respectively, and the most notable charged amino acid is histidine, which can function as a buffer at a physiological pH.
1.1 References and resources
Text
Ferrier, D. R., ed. Lippincott Illustrated Reviews: Biochemistry, 7th ed. Philadelphia: Wolters Kluwer Health/Lippincott Williams & Wilkins, 2017, Chapter 1: Amino Acids, Chapter 2: Protein Structure.
Lieberman, M., and A. Peet, eds. Marks’ Basic Medical Biochemistry: A Clinical Approach, 5th ed. Philadelphia: Wolters Kluwer Health/Lippincott Williams & Wilkins, 2018, Chapter 6: Amino Acids in Proteins, Chapter 8: Enzymes as Catalysts, Chapter 9: Regulation of Enzymes.
Figures
Grey, Kindred, Figure 1.1 Basic structure of amino acids and ionization. 2021. Chemical structure by Henry Jakubowski. https://archive.org/details/1.1_20210924. CC BY 4.0.
Grey, Kindred, Figure 1.2 Chart of amino acids. 2021. Chemical structure by Henry Jakubowski. https://archive.org/details/1.2_20210924. CC BY 4.0.
1.2 Enzyme Kinetics
Many translated proteins are also enzymes with a specific metabolic function within the cell. Enzymes help reduce the amount of transition state energy required for a reaction to move forward through several mechanisms:
- Stabilizing the substrate within the active site,
- Excluding water from the reaction site,
- Stabilizing the transition state, and
- Using cofactors or coenzymes to help with group transfer.
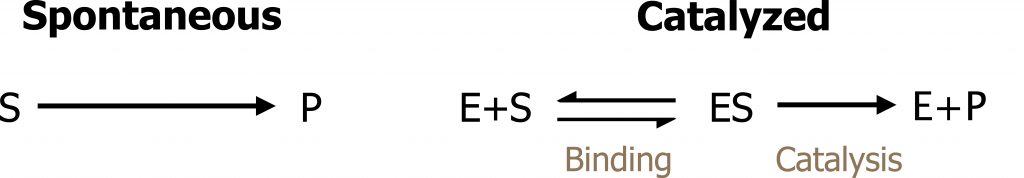
The kinetics of enzyme-catalyzed reactions is mainly determined by the properties of the catalyst. Like all catalysts, the enzyme [E] creates a new reaction pathway. Initially, the substrate [S] is bound to the free enzyme [ES] (figure 1.3).
The rate of this enzyme reaction can be described by the Michaelis–Menten equation, which relates the the initial velocity (vi) to the concentration of substrate [S] and the two parameters Km and Vmax. The Vmax is defined as the maximal velocity that can be achieved at an infinite substrate concentration, while the Km is defined as the substrate concentration needed to reach 1/2 Vmax. The Michaelis constant (Km) characterizes the affinity of the enzyme for a substrate. A high affinity of the enzyme for a substrate therefore leads to a low Km value, and vice versa (figure 1.4).
![X-axis substrate concentration and Y-axis reaction velocity. The line is a rectangular hyperbola and flattens at the maximum velocity. The equation is Vi of the fraction with numerator Vmax multiplied by [S] and denominator Km + [S]](https://pressbooks.lib.vt.edu/app/uploads/sites/66/2021/10/1.4-928x1024.jpg)
Note
The Michaelis‒Menten model contains simplifying assumptions (substrate binding is in equilibrium, formation of [P] is irreversible, [E] and [ES] are the only enzyme forms).
Since vi approaches Vmax asymptotically, it is difficult to read off reliable values for Vmax or Km from diagrams plotting v against [S] (figure 1.4). To alleviate this issue, the Michaelis‒Menten equation can be arranged in such a way that the measured points lie on a straight line. In the Lineweaver‒Burk plot, 1/v is plotted against 1/[S]. The intersections of the line of best fit with the axes then produce 1/Vmax and −1/Km (figure 1.5).
![Equation is 1 divided by V = the fraction with numerator Km and denominator Vmax times (the fraction with numerator 1 and denominator [S]) plus the fraction with numerator 1 and denominator Vmax. X-intercept at -1 divided by Km, Y-intercept at 1 divided by Vmax, and slope Km divided by Vmax.](https://pressbooks.lib.vt.edu/app/uploads/sites/66/2021/10/1.5-1024x918.jpg)
Factors influencing enzyme kinetics
The catalytic properties of enzymes, and consequently their activity, are influenced by numerous factors, which all must be optimized and controlled if activity measurements are to be performed in a useful and reproducible fashion. These factors include physical quantities (temperature or pressure), the chemical properties of the solution (pH or ionic strength), and the concentrations of all relevant substrates, cofactors, coenzymes, and inhibitors. The role of cofactors (inorganic) or coenzymes (organic) is often to accept or donate electrons in a reaction or to temporarily stabilize the substrate in the course of the reaction. Depending on the type of interaction with the enzyme, a distinction is made between soluble coenzymes and prosthetic groups.
- Soluble coenzymes are bound to the enzyme during a reaction, undergo a chemical change, and are then released again. The original form of the coenzyme is regenerated by a second, independent reaction.
- Prosthetic groups are coenzymes that are tightly bound to the enzyme (sometimes covalently), and remain associated with the enzyme during the reaction. The part of the substrate bound by the coenzyme after release of the first product is then transferred in a second reaction to another substrate or coenzyme of the same enzyme. Many coenzymes are aromatic compounds that cannot be synthesized de novo in animal cells.
- Metal ions can also serve as cofactors. Their functions are variable; some stabilize the native conformation of an enzyme active site, while others are involved in oxidation–reduction reactions or facilitate catalysis by polarizing chemical bonds within the substrate.
Enzyme regulation
Competitive and noncompetitive inhibition
Enzymes can be inhibited or activated by interference from other compounds. These will influence the reaction by changing the Km or Vmax of the reaction. Most enzyme inhibitors act reversibly and do not cause permanent changes in the enzyme. However, there are also irreversible inhibitors that modify the target enzyme covalently and permanently. These are termed suicide inhibitors.
Inhibitors can be categorized as competitive or noncompetitive, and this can be determined by comparing the kinetics of the normal versus inhibited reactions.
![(A) Competitive Inhibition; Graph: X-axis 1 divided by [S] and y-axis 1 divided by Vi. There is a line for no inhibitor and for with inhibitor. The with inhibitor line has a greater x-intercept value and the lines intersect at the y-intercept. Equation: E I complex bidirectional arrow to E+S bidirectional arrow to E S complex + P. Arrow returning to E I complex adds I. (B) Pure Noncompetitive inhibition; Graph: The same axes and no inhibitor line of graph a. The plus inhibitor line has a greater y-intercept value and the lines intersect at the x-intercept at a negative value. Equation: E I complex bidirectional arrow to E+S bidirectional arrow to E S complex. E S complex right arrow P. E S complex bidirectional arrow to E with either I or S. Arrow returning to E I complex and E with either I or S adds I.](https://pressbooks.lib.vt.edu/app/uploads/sites/66/2021/10/1.6-1024x829.jpg)
Competitive inhibitors bind the enzyme at the active site and compete with the substrate for binding. Many function as substrate analogs. In the presence of the inhibitor, a higher substrate concentration is therefore needed to achieve a half-maximum rate; the Michaelis constant Km increases. When substrate concentrations are elevated, this will ultimately displace the inhibitor, and Vmax will be reached. The maximum rate, Vmax, is therefore not influenced by competitive inhibitors. In this case, there is no change on Vmax as competition can be overcome by increasing the concentration of substrate, but there is an increase in the apparent Km, as a greater substrate concentration is needed to reach Vmax (figure 1.6(a)).
In contrast, noncompetitive inhibitors bind the enzyme on a site alternative to the substrate binding site, and therefore its effects cannot be overcome by increasing the substrate. In this case, Km remains unchanged, but kcat (the rate of product formation), and thus Vmax, decreases. Irreversible inhibitors usually result in a noncompetitive type of inhibition because the concentration of active enzyme [E] decreases (figure 1.6(b)).
The action of inhibitors can be illustrated clearly in the Lineweaver‒Burk plot. In this type of plot, the intercept of the approximation lines with the y-axis corresponds to 1/Vmax, while the x-axis intercept gives the value of −1/Km. This is why the straight lines obtained in the absence (blue) and presence of a competitive inhibitor (A, red) intersect on the y-axis (1/ Vmax), unchanged), while noncompetitive inhibitors (B, red) result in a straight line with a higher y-intercept but unchanged x-intercept (1/Vmax) increased, Km) unchanged) (figure 1.6).
Allosteric regulation
The Michaelis‒Menten model of enzyme catalysis assumes that the enzymeʼs spatial structure does not alter with substrate binding. However, many enzymes are present in various conformations, which have different catalytic properties. Allosteric enzymes can be recognized by their S-shaped (sigmoidal) saturation curves, which cannot be described using the Michaelis‒Menten equation. In allosteric enzymes, the binding efficiency initially rises with increasing [S], because the free enzyme is present in a low-affinity conformation, which is gradually converted into a higher-affinity form. It is only at high [S] values that a lack of free binding sites becomes noticeable and the binding efficiency decreases again. The affinity of allosteric enzymes is therefore not constant, but depends on the type and concentration of the ligand. Inhibitors and activators (effectors) influence the activity of allosteric enzymes by stabilizing certain conformations. These effects play an important part in regulating metabolism (figure 1.7).
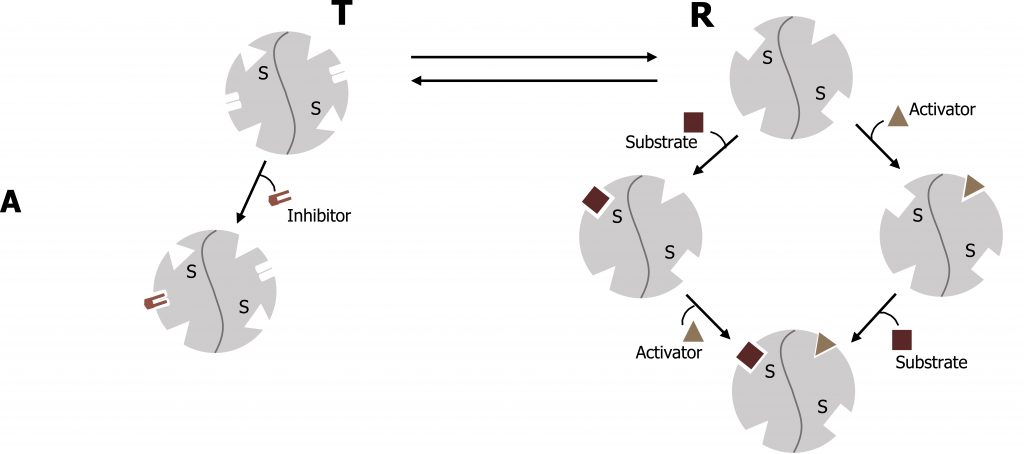
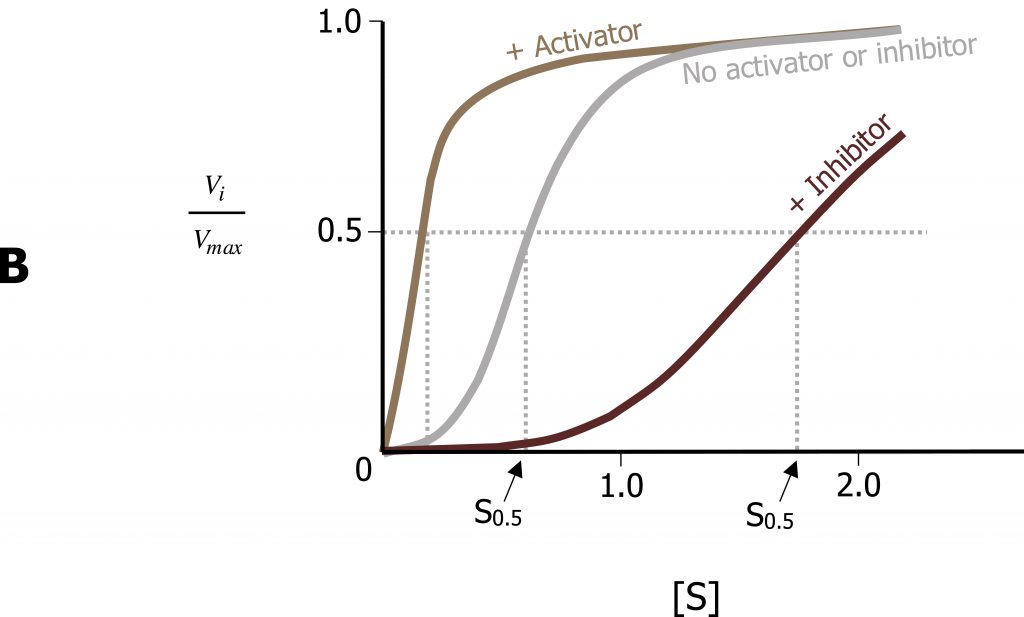
Similar to noncompetitive inhibitors, allosteric effectors will bind sites alternative to the active site. Allosteric activators typically stabilize the relaxed conformation of an enzyme (R), and increase the rate of substrate binding of the subsequent subunits. This is called cooperativity. In contrast, allosteric inhibitors will stabilize the tense (T) conformation of a protein and will increase substrate off (release) rate. The best example of this is with oxygen binding to hemoglobin, which has a quaternary structure with four binding sites for oxygen.
Enzyme regulation through covalent modification
Enzyme function can also be modified through covalent modification such as phosphorylation. These are typically post-translational modifications that can take place in the golgi or through kinase-mediated interactions. For example, glycogen phosphorylase requires phosphorylation for activation. Phosphorylation will be an integral means of regulation of enzymes during metabolic pathways.
1.2 References and resources
Text
Ferrier, D. R., ed. Lippincott Illustrated Reviews: Biochemistry, 7th ed. Philadelphia: Wolters Kluwer Health/Lippincott Williams & Wilkins, 2017, Chapter 1: Amino Acids, Chapter 2: Protein Structure.
Lieberman, M., and A. Peet, eds. Marks’ Basic Medical Biochemistry: A Clinical Approach, 5th ed. Philadelphia: Wolters Kluwer Health/Lippincott Williams & Wilkins, 2018, Chapter 6: Amino Acids in Proteins, Chapter 8: Enzymes as Catalysts, Chapter 9: Regulation of Enzymes.
Figures
Grey, Kindred, Figure 1.3 Basics of enzyme kinetics. 2021. https://archive.org/details/1.3_20210924. CC BY 4.0.
Lieberman M, Peet A. Figure 1.4 Graphical representation of the Michaelis-Menten equation. Adapted under Fair Use from Marks’ Basic Medical Biochemistry. 5th Ed. pp 152. Figure 9.2 A graph of the Michaelis-Menten equation. 2017.
Lieberman M, Peet A. Figure 1.5 Lineweaver-Burk plot to illustrate Km and Vmax. Adapted under Fair Use from Marks’ Basic Medical Biochemistry. 5th Ed. pp 153. Figure 9.3 The Lineweaver-Burk transformation for the Michaelis-Menten equation. 2017.
Lieberman M, Peet A. Figure 1.6 Competitive vs. noncompetitive inhibition. Adapted under Fair Use from Marks’ Basic Medical Biochemistry. 5th Ed. pp 156. Figure 9.6 Lineweaver-Burk plots of competitive and purenoncompetitive inhibition. 2017.
Lieberman M, Peet A. Figure 1.7 Allosteric enzyme regulation. Adapted under Fair Use from Marks’ Basic Medical Biochemistry. 5th Ed. pp 157. Figure 9.8 Activators and inhibitors of an allosteric enzyme (simplified model). 2017.
