5 Fuel for Later
Learning Objectives
Gluconeogenesis and glycogenolysis
- Determine the regulatory states of the key gluconeogenic enzymes (fructose bisphosphatase 1 (FBP1), pyruvate carboxylase/PEPCK, glucose 6-phosphatase) under fed and fasting conditions.
- Relate how gluconeogenesis, the urea cycle, and β-oxidation are interconnected and how defects in one of these pathways can result in the presentation of hypoglycemia.
- Describe the process and regulation of glycogenolysis.
- Compare the use of muscle and liver glycogen stores.
Lipolysis, β-oxidation, and ketogenesis
- Describe the process of β-oxidation and how this connects to ketogenesis and lipolysis.
- Describe the importance of carnitine in the movement of fatty acids into the mitochondria using carnitine palmitoyltransferase.
- Evaluate the role of malonyl-CoA as a regulator of β-oxidation (key enzyme carnitine palmitoyltransferase 1).
- Describe how hormone levels impact lipolysis through the regulation of hormone-sensitive lipase.
Urea cycle and nitrogen metabolism
- Define ketogenic and glucogenic amino acids, and list them as exclusively ketogenic, glucogenic, or both.
- Describe urea cycle regulation by N-acetyl glutamate (NAGS) and substrate availability.
- Relate the activity of the urea cycle to the fed and fasted states.
- Describe the interconversion between keto-acids and amino acids, including the requirement of pyridoxal phosphate (PLP) as a cofactor (transaminase reaction).
- Describe the importance of the reactions catalyzed by (A) glutamine synthetase, (B) glutaminase, and (C) glutamate dehydrogenase.
Glycogenolysis (see section 4.5)
- Contrast the regulation and the utility of skeletal muscle versus liver glycogen.
- Evaluate the regulatory status of critical enzymes in the following pathways: glycolysis, glycogen synthesis and degradation, fatty acid synthesis and β-oxidation, and gluconeogenesis.
- Determine how different storage disorders can present with alternative phenotypes.
About this Chapter
In order to maintain glucose homeostasis, mechanisms are in place to supply fuel to essential tissues even under fasted conditions. This section will address how these pathways are interconnected and simultaneously regulated to achieve this goal.
5.1 Gluconeogenesis and Glycogenolysis
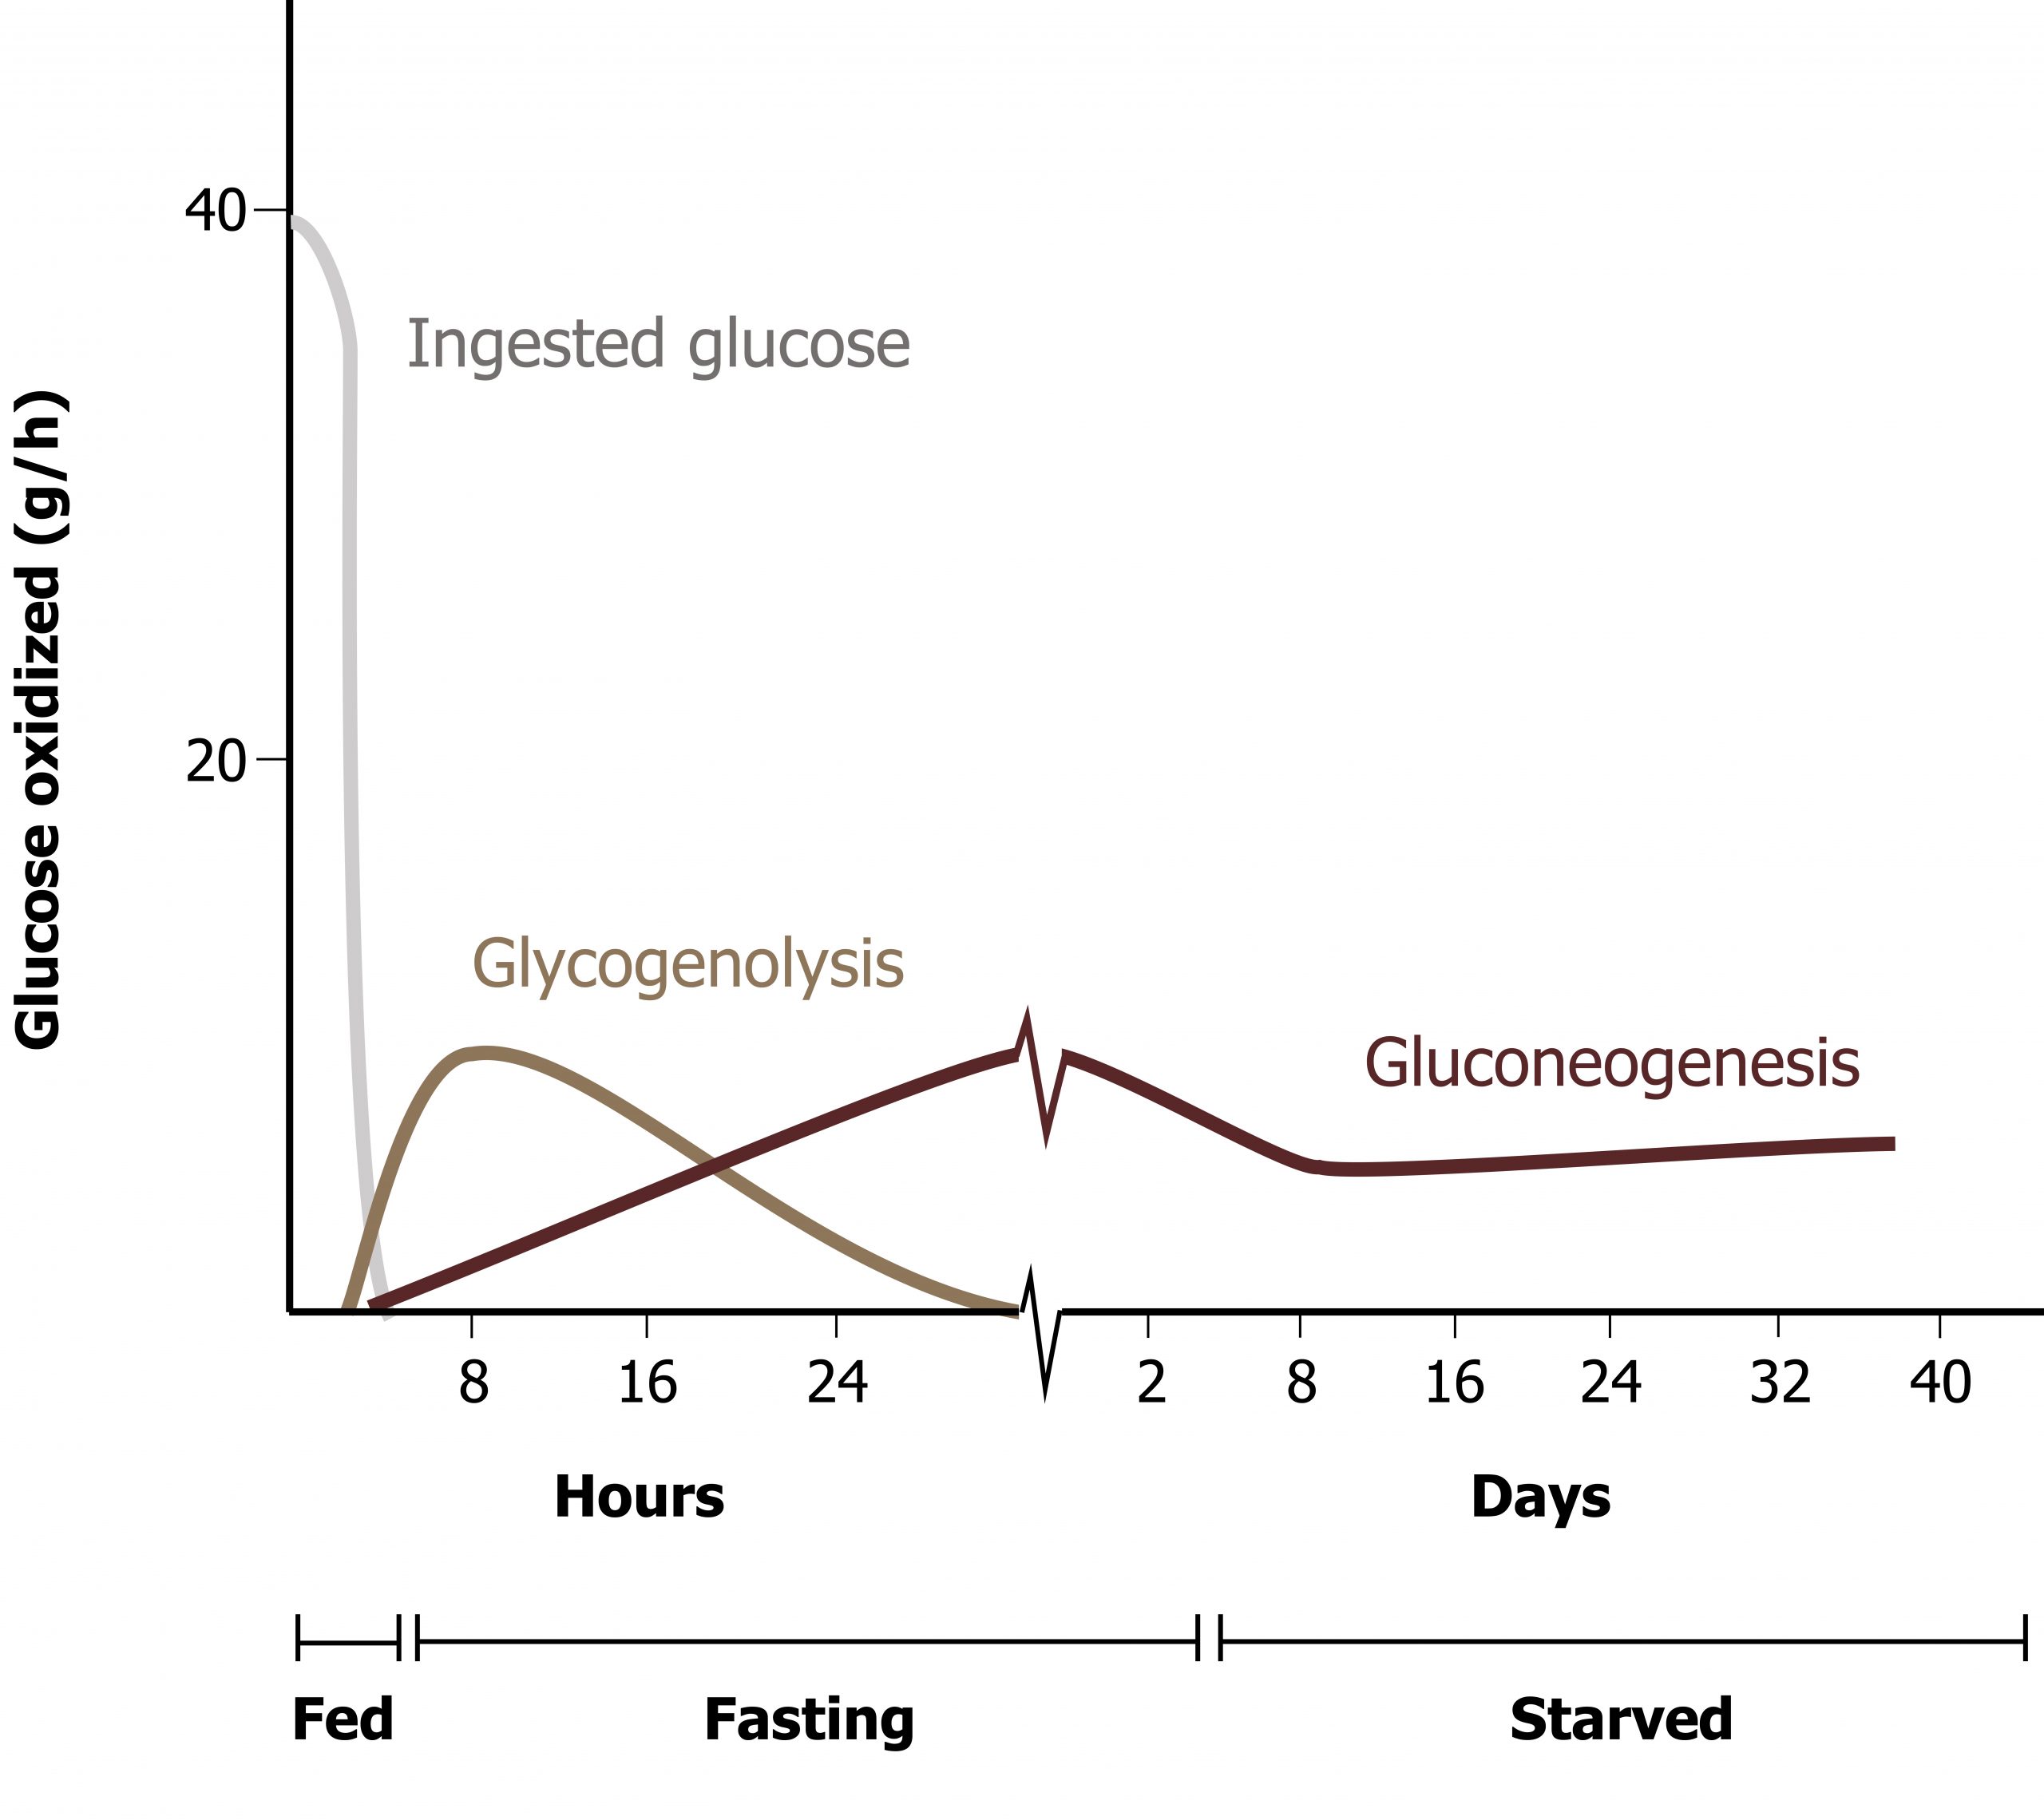
Gluconeogenesis and glycogenolysis are the two pathways essential for glucose homeostasis. Figure 5.1 illustrates the time frame and overlap of glycogenolysis and gluconeogenesis. These pathways are activated nearly simultaneously when the insulin to glucagon ratio becomes sufficiently reduced. Over time, the reliance on the pathways changes.
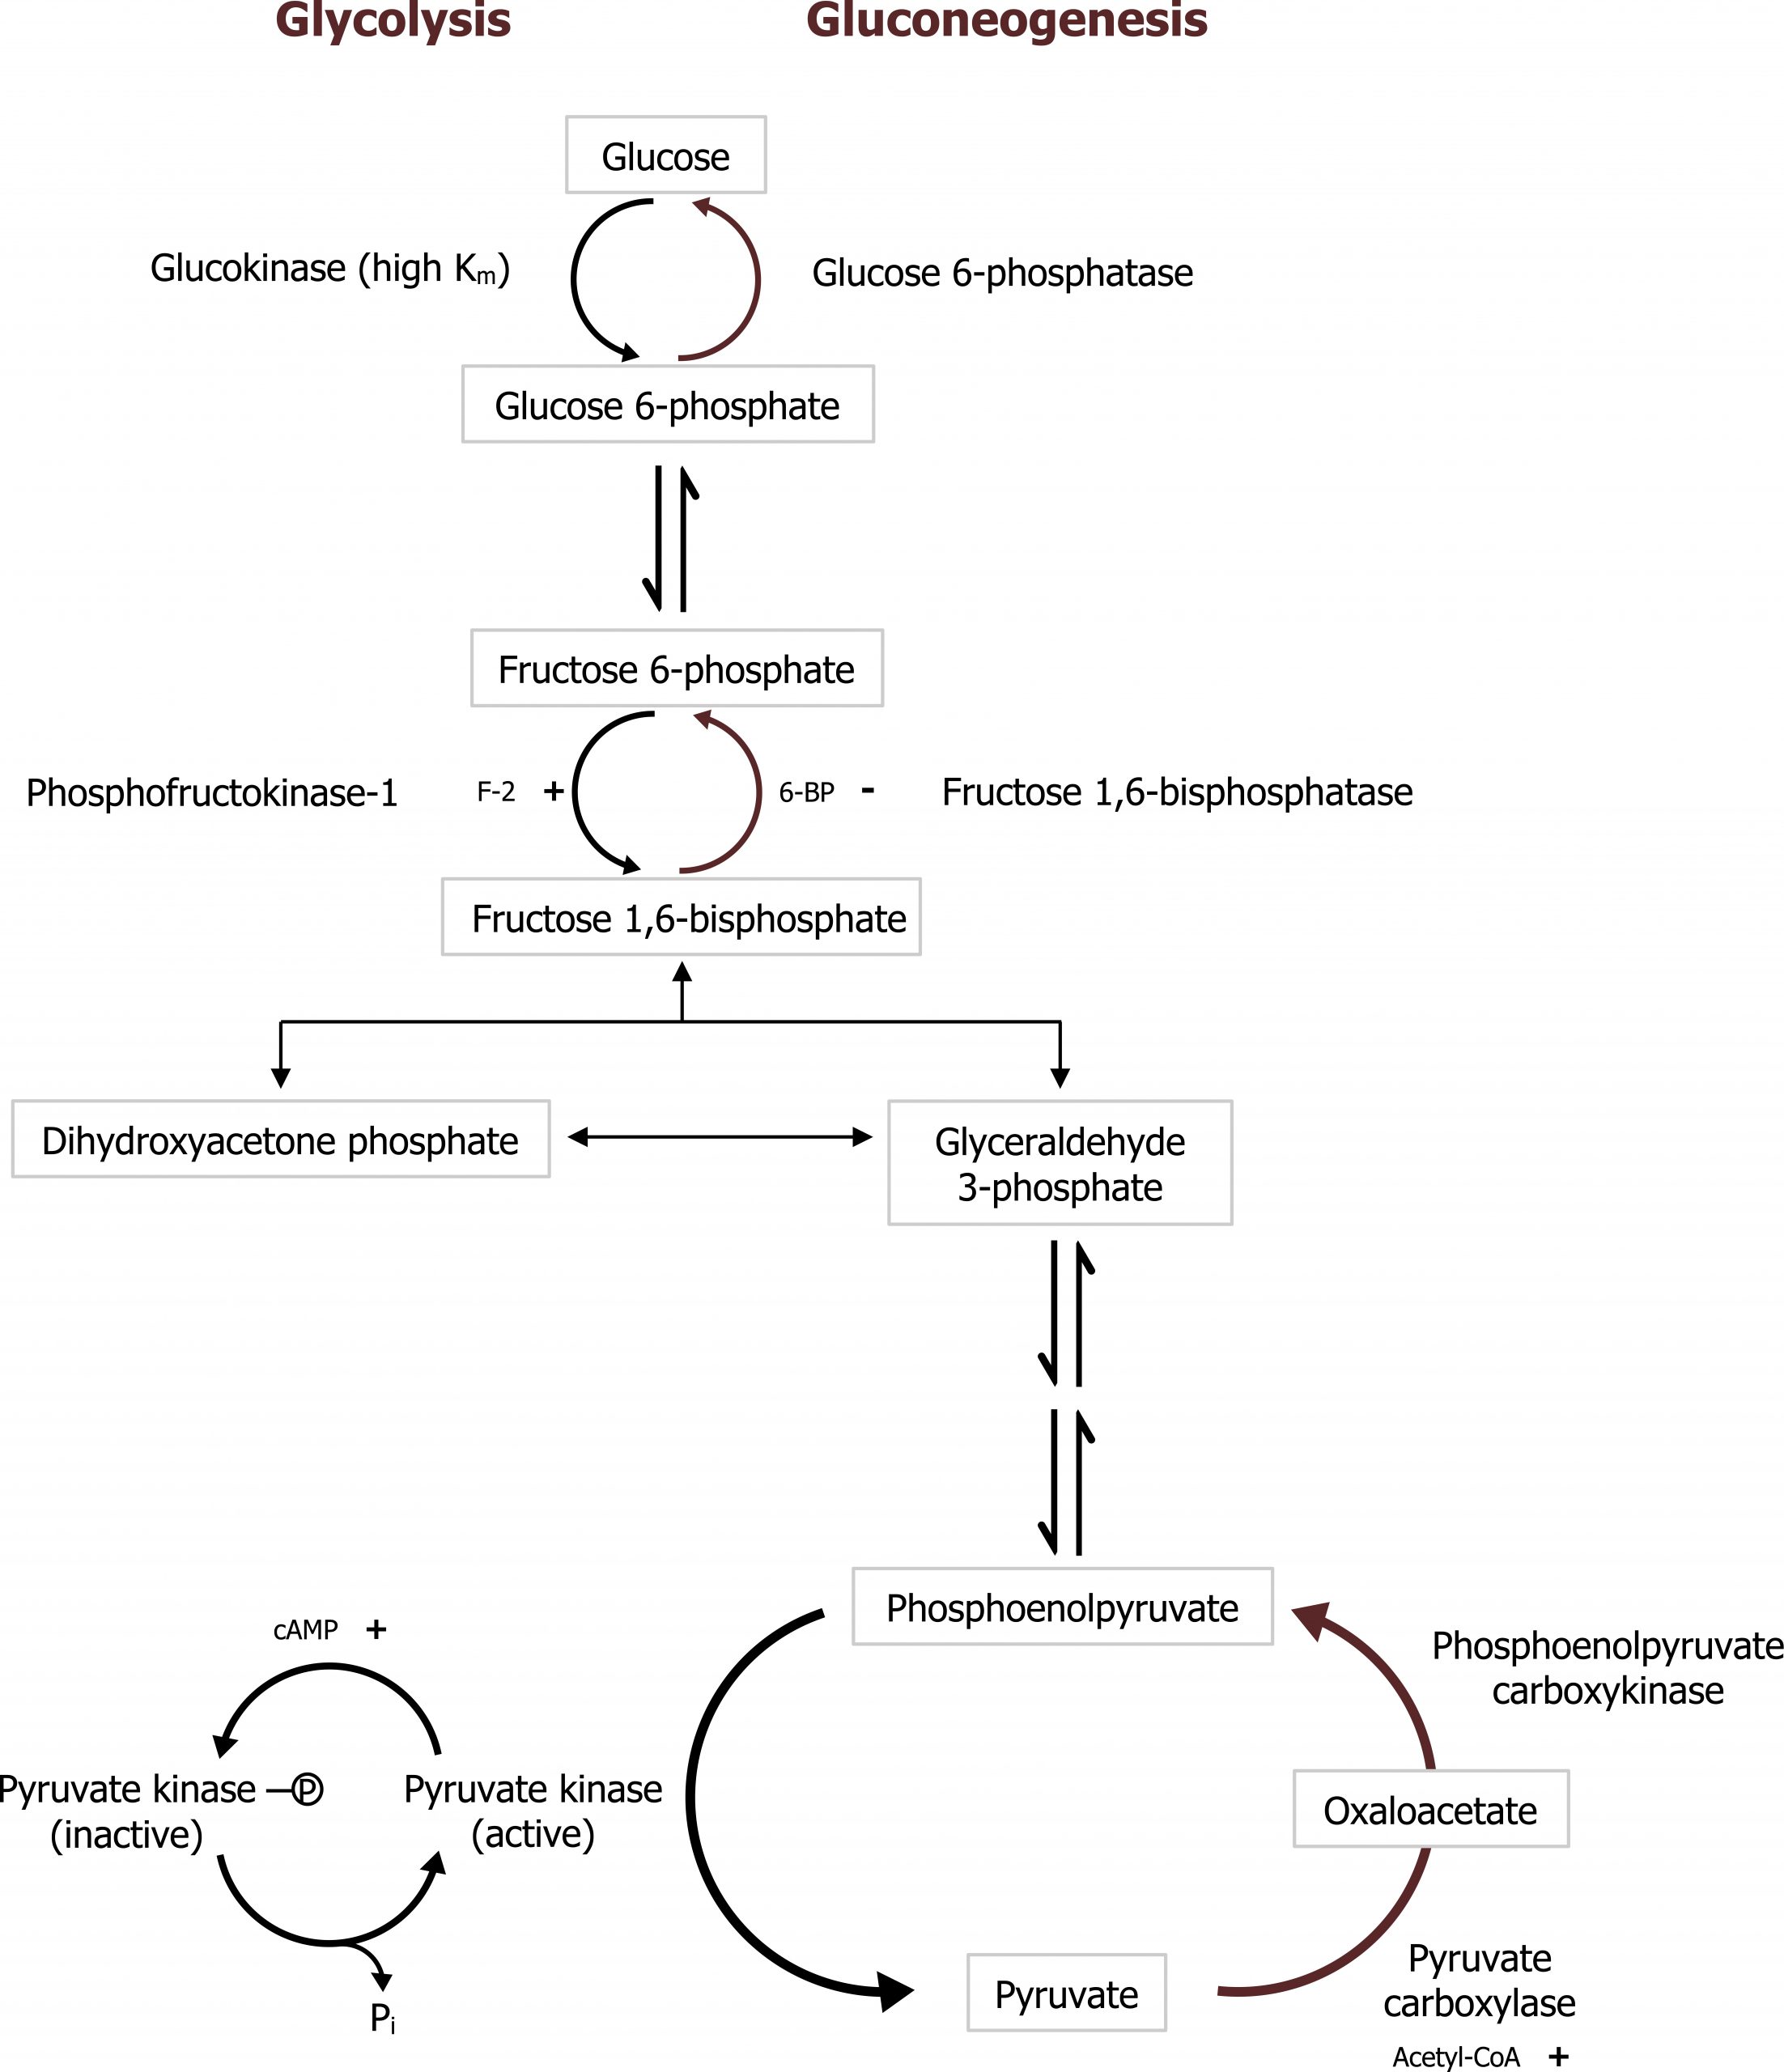
Gluconeogenesis (GNG) is an anabolic pathway that produces glucose from lactate, glycerol, or glucogenic amino acids. This pathway is activated primarily in the liver during fasting and is coordinated with the catabolic pathways of β-oxidation and protein catabolism. The pathway follows the reverse of glycolysis with the exception of four unique enzymes, which overcome the irreversible steps of glycolysis (figure 5.2).
Substrates for GNG
Amino acids
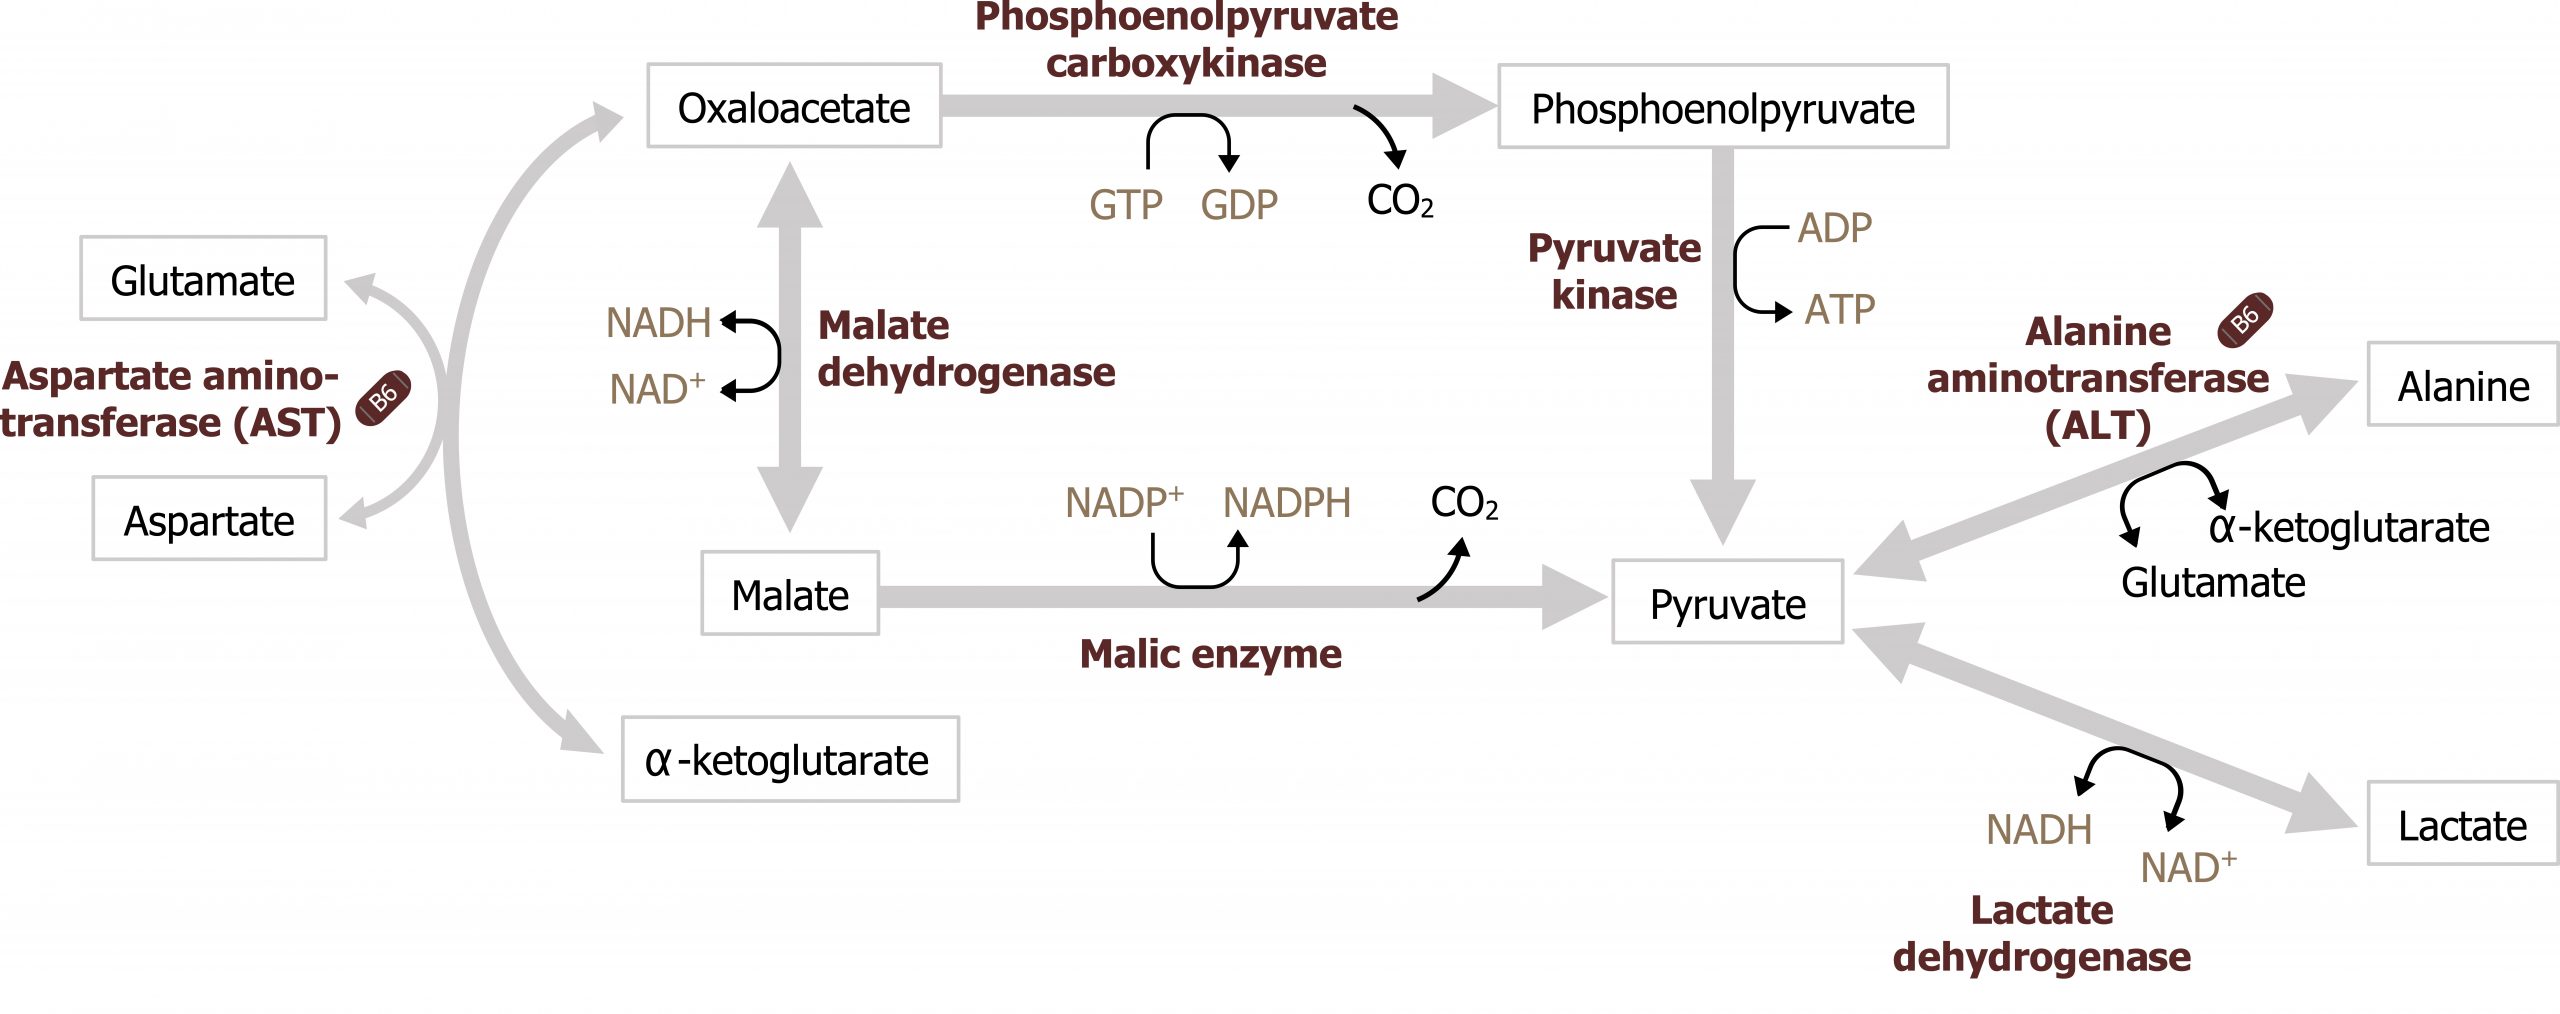
The primary substrates for GNG are derived from glucogenic amino acids released through cortisol-mediated protein catabolism. In the fasted state, cortisol is elevated, and it supports fasted state pathways through the activation of protein catabolism — in the skeletal muscle — and by increasing the transcription of enzymes needed for gluconeogenesis (specifically phosphoenol carboxykinase (PEPCK)). As amino acids are released from the skeletal muscle, primarily as glutamine and alanine, they are taken up by the liver. In order to be used for glucose synthesis, they undergo transamination to generate a useful intermediate of the TCA cycle, predominantly α-ketoglutarate and pyruvate (see figures 5.3 and 5.10) . In the case of alanine, this can be transaminated to generate pyruvate. Glutamine will first be deaminated by glutaminase, and the remaining glutamate will be transaminated to form α-ketoglutarate (see figure 5.11). Both pyruvate and α-ketoglutarate will increase substrates in the TCA cycle, ultimately increasing the pool of available malate to be shuttled out of the mitochondria. It is through this process of protein catabolism and transamination that glucogenic amino acids contribute to the synthesis of oxaloacetate (OAA) needed for gluconeogenesis.
Lactate
Lactate is primarily produced through the Cori cycle or from anaerobic glucose oxidation. (Note: The Cori cycle, or lactic acid cycle, refers to the metabolic pathway in which lactate produced by anaerobic glycolysis in the muscle or RBC travels to the liver and is converted to glucose. The glucose returns to the peripheral tissues and is metabolized back to lactate.) Once in the liver, lactate can be oxidized back to pyruvate through the reverse reaction catalyzed by lactate dehydrogenase (figure 5.3).
Glycerol
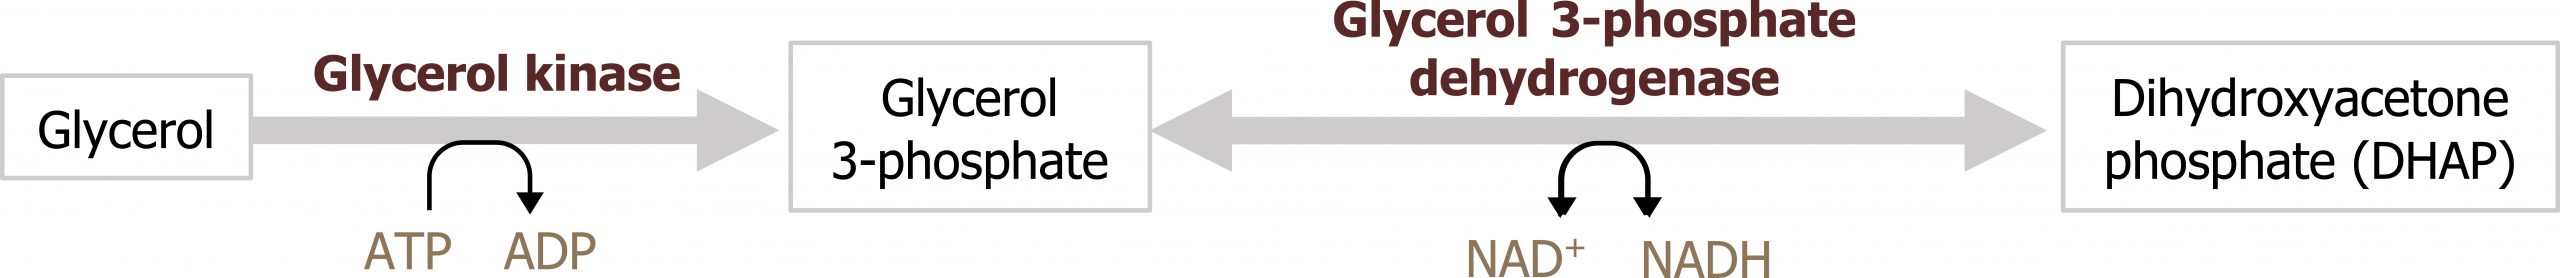
When lipolysis is stimulated by epinephrine or glucagon, activation of hormone-sensitive lipase in the adipose allows for the hydrolysis of triacylglycerol into three free fatty acid chains and glycerol. The glycerol released into circulation will be taken up by the liver. Once in the liver it can be converted into dihydroxyacetone phosphate (DHAP), a glycolytic intermediate. This is an additional way in which carbons can be obtained for glucose synthesis (figure 5.4).
Interconnection of GNG and other metabolic pathways
Gluconeogenesis is heavily reliant on support from other pathways. It requires amino acids for carbon substrates from cortisol-mediated protein catabolism. The ability of those amino acids to be deaminated relies on the ability of the urea cycle to remove ammonia in the form of nontoxic urea, and perhaps most importantly, gluconeogenesis relies on the process of β-oxidation.
β-oxidation
The process of β-oxidation supports gluconeogenesis in two major ways:
- The NADH and FADH2 generated from β-oxidation is oxidized in the electron transport chain to produce ATP. This ATP provides the needed energy for glucose synthesis. It also supplies energy to the urea cycle for nitrogen disposal.
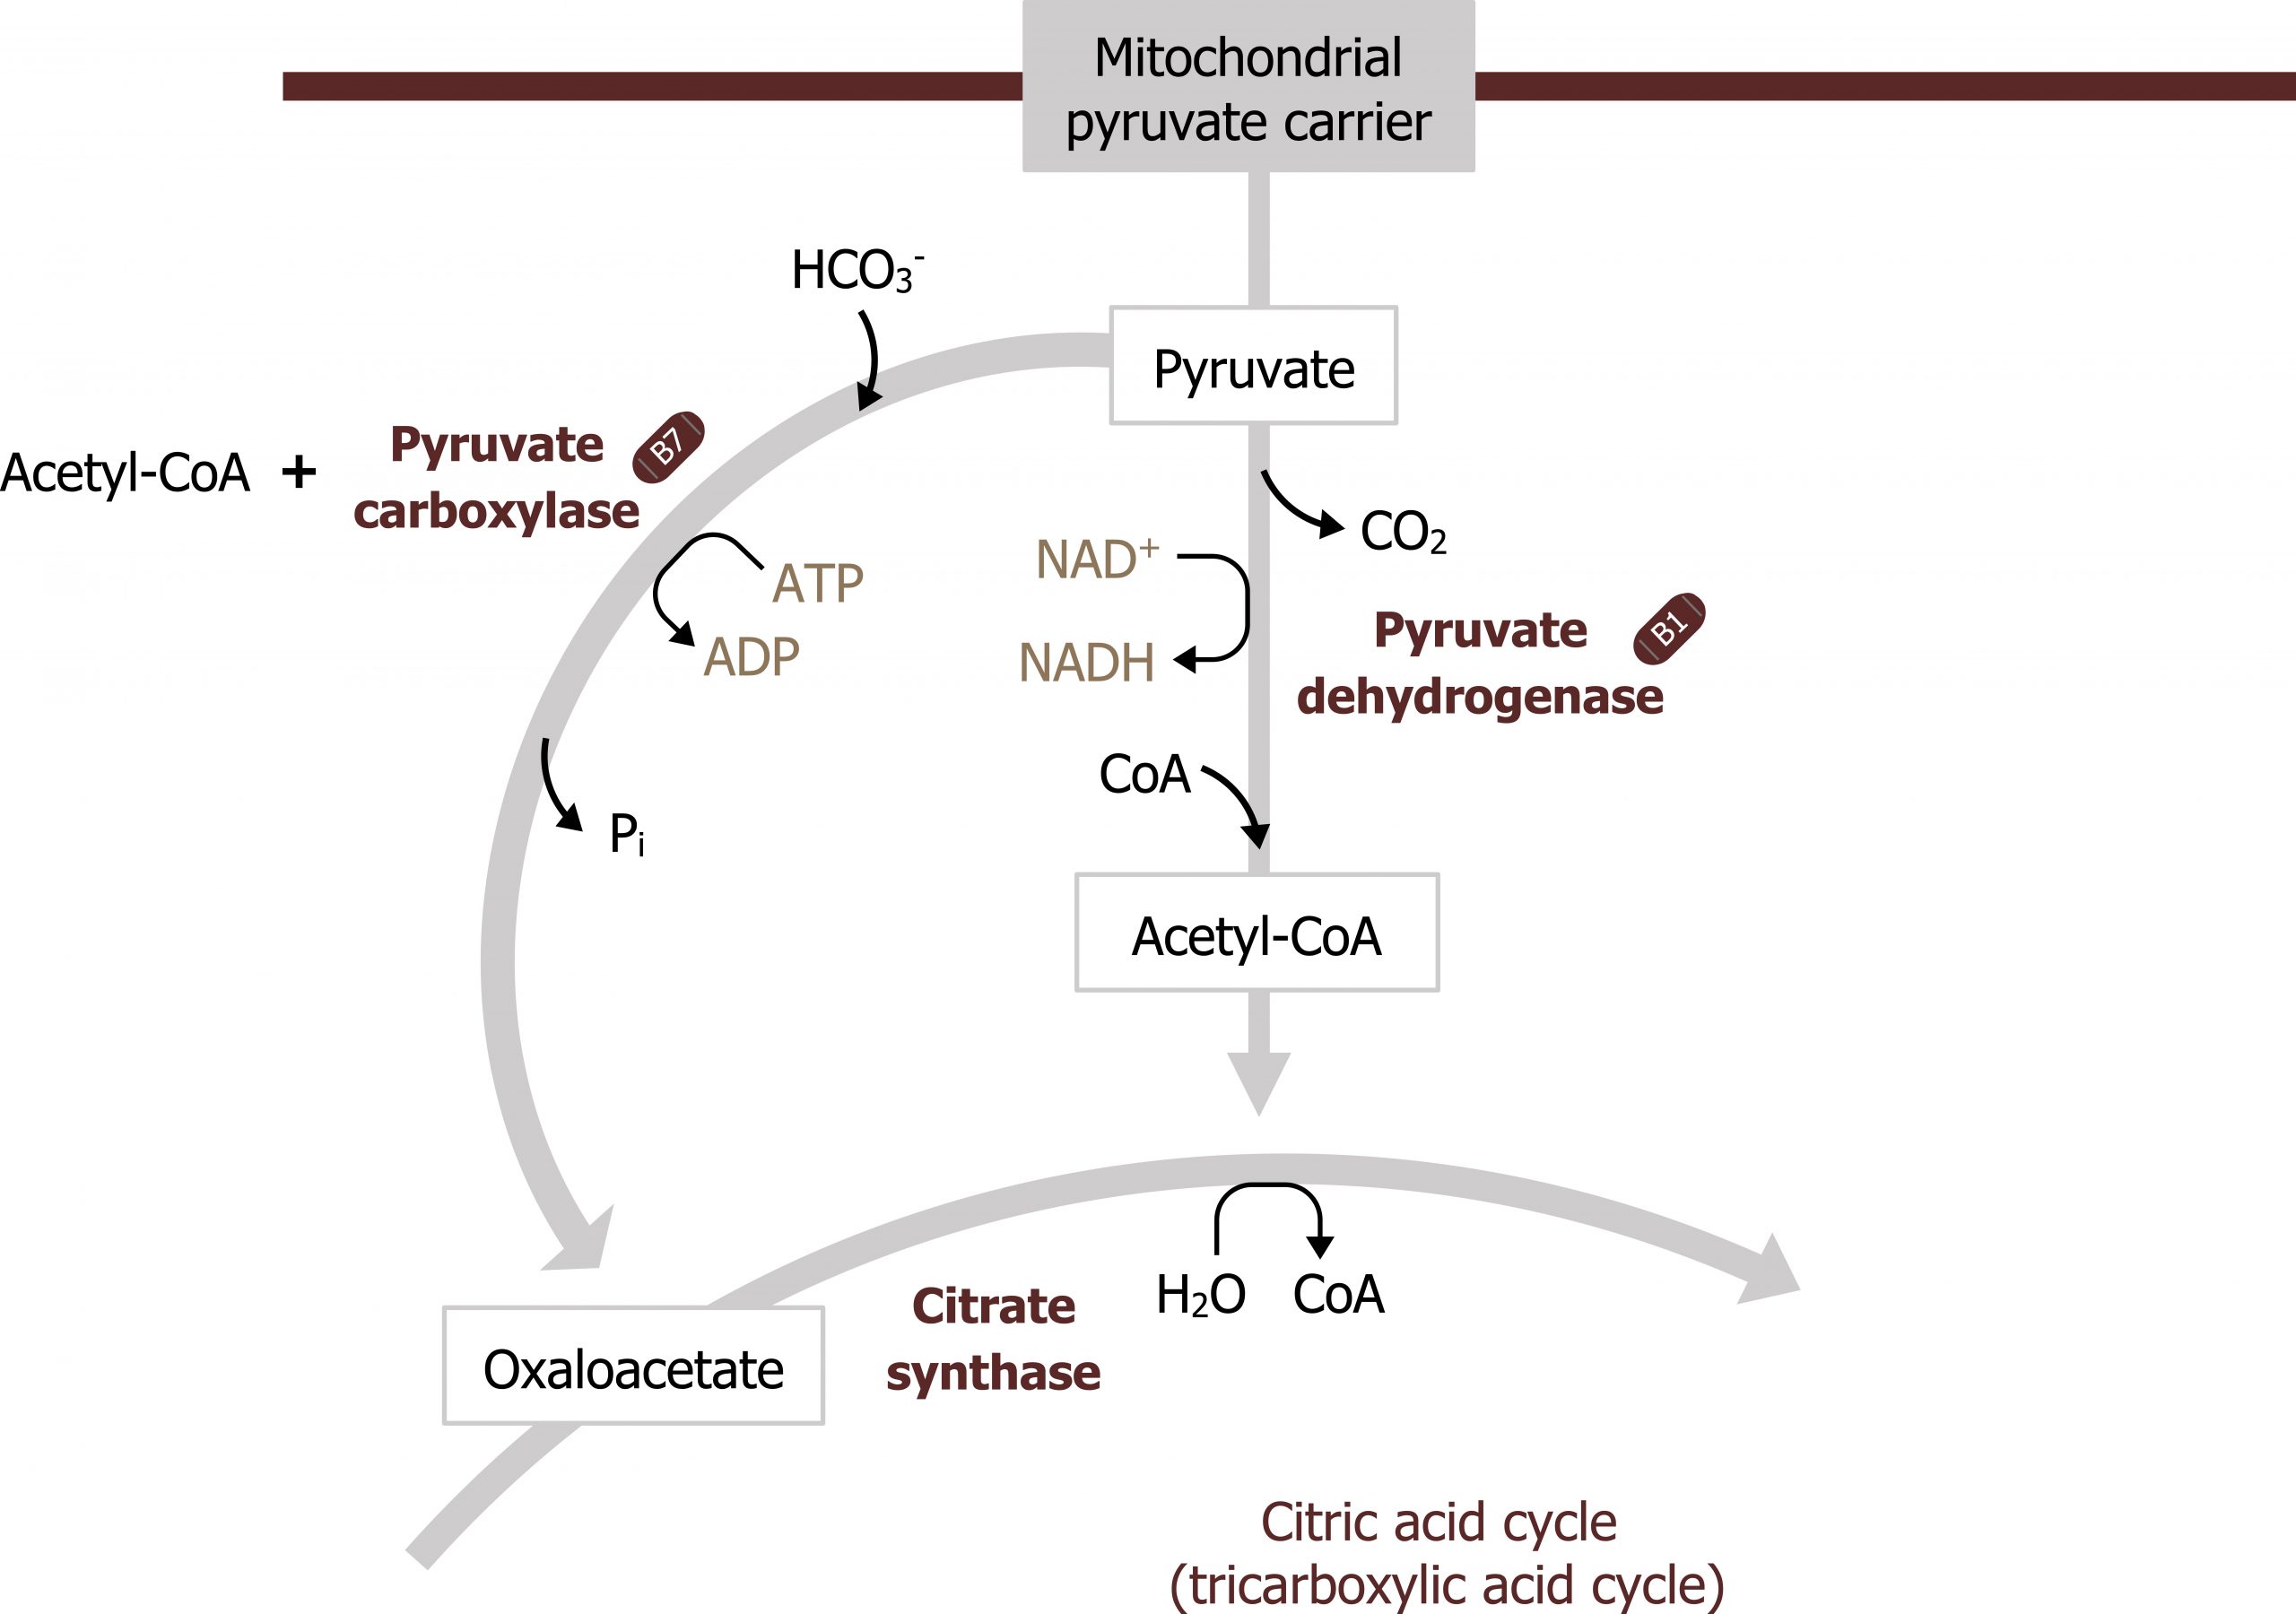
- β-oxidation also produces acetyl-CoA. This compound is needed to allosterically activate pyruvate carboxylase (figure 5.5).
Acetyl-CoA produced from β-oxidation itself is not a substrate for gluconeogenesis, rather it is required for allosteric activation of pyruvate carboxylase, which is the first step in GNG. Again, acetyl-CoA is not a substrate for this process; it is fully oxidized in the TCA cycle and provides no additional carbons to be exported from the TCA cycle as malate. Therefore the cell has to rely on amino acid carbon skeletons, glycerol, and lactate as substrates for glucose production (section 5.2).
Regulation of gluconeogenesis
Pyruvate carboxylase and phosphoenol carboxykinase (PEPCK)
Gluconeogenesis is essentially the reverse of glycolysis with four key regulatory steps that allow the bypass of the three irreversible steps of glycolysis (figure 5.2). This initial step of GNG starts in the mitochondria using pyruvate carboxylase (figure 5.5). This enzyme converts pyruvate in the mitochondria to oxaloacetate and requires biotin as a cofactor. This enzyme is allosterically activated by acetyl-CoA. The OAA produced is reduced to malate, which is shuttled out of the mitochondria using the malate-aspartate shuttle. Once in the cytosol, the malate is oxidized back to OAA and decarboxylated by the enzyme phosphoenol carboxykinase (PEPCK) to generate phosphoenol pyruvate (figure 5.3). The combination of these two enzymes, pyruvate carboxylase and PEPCK, allows the cell to bypass the irreversible step catalyzed by pyruvate kinase.
Once phosphoenol pyruvate (PEP) is synthesized, it will continue through the reverse process using the glycolytic enzymes until it reaches its next irreversible conversion.
Fructose 1,6-bisphosphatase (FBP1)
As PEP continues through the reverse of glycolysis, fructose 1,6-bisphosphate is generated. To bypass the irreversible step catalyzed by phosphofructokinase 1 (PFK1) in glycolysis, the enzyme fructose 1,6-bisphosphatase (FBP1) is present and dephosphorylates fructose 1,6-bisphosphate to produce fructose 6-phosphate. This enzyme, FBP1, is inhibited by AMP and fructose 2,6-bisphosphate (figure 5.2).
Like glycolysis, there is an additional regulation here by the bifunctional enzyme phosphofructokinase 2 (PFK2)/fructose 2,6-bisphosphatase (figure 4.1). This bifunctional enzyme functions as a kinase in the fed state (PFK2) and generates fructose 2,6-bisphosphate that allosterically activates PFK1. In the fasted state the enzyme is phosphorylated by glucagon-activated protein kinase A, and this actives the phosphatase activity of the enzyme. The enzyme dephosphorylates fructose 2,6-bisphosphate and therefore reduces the allosteric activation of PFK1 facilitating the reverse reaction by fructose 1,6-bisphosphatase (figure 5.2).
Glucose 6-phosphatase
Finally, glucose 6-phosphatase is required to dephosphorylate glucose 6-phosphate so it can be released from the liver. This is a key step for both glycogenolysis and gluconeogenesis, and deficiencies in this enzyme can lead to severe bouts of fasting hypoglycemia.
Glycogenolysis
In contrast to glycogen synthesis, glycogenolysis is the release of glucose 6-phosphate from glycogen stores. It can occur in both the liver and the skeletal muscle but under two different conditions (figures 5.6 and 5.7). As noted above, this is a pathway active in the fasted state.
- In the liver, glycogenolysis is the initial source of glucose for the maintenance of blood glucose levels when glucagon levels start to increase. The glucose 6-phosphate generated from liver glycogenolysis is dephosphorylated and released into the blood stream.
- In skeletal muscle, glycogenolysis provides glucose only for the skeletal muscle, and this fuel is not released into the blood stream as skeletal muscle lacks glucose 6-phosphatase, the enzyme needed to dephosphorylate glucose. Therefore, skeletal muscle glycogen is primarily used under anaerobic exercise conditions when oxidizing fatty acids is not rapid enough to produce ATP for the exercising tissue.
Regulation of glycogenolysis
Hepatic glycogenolysis
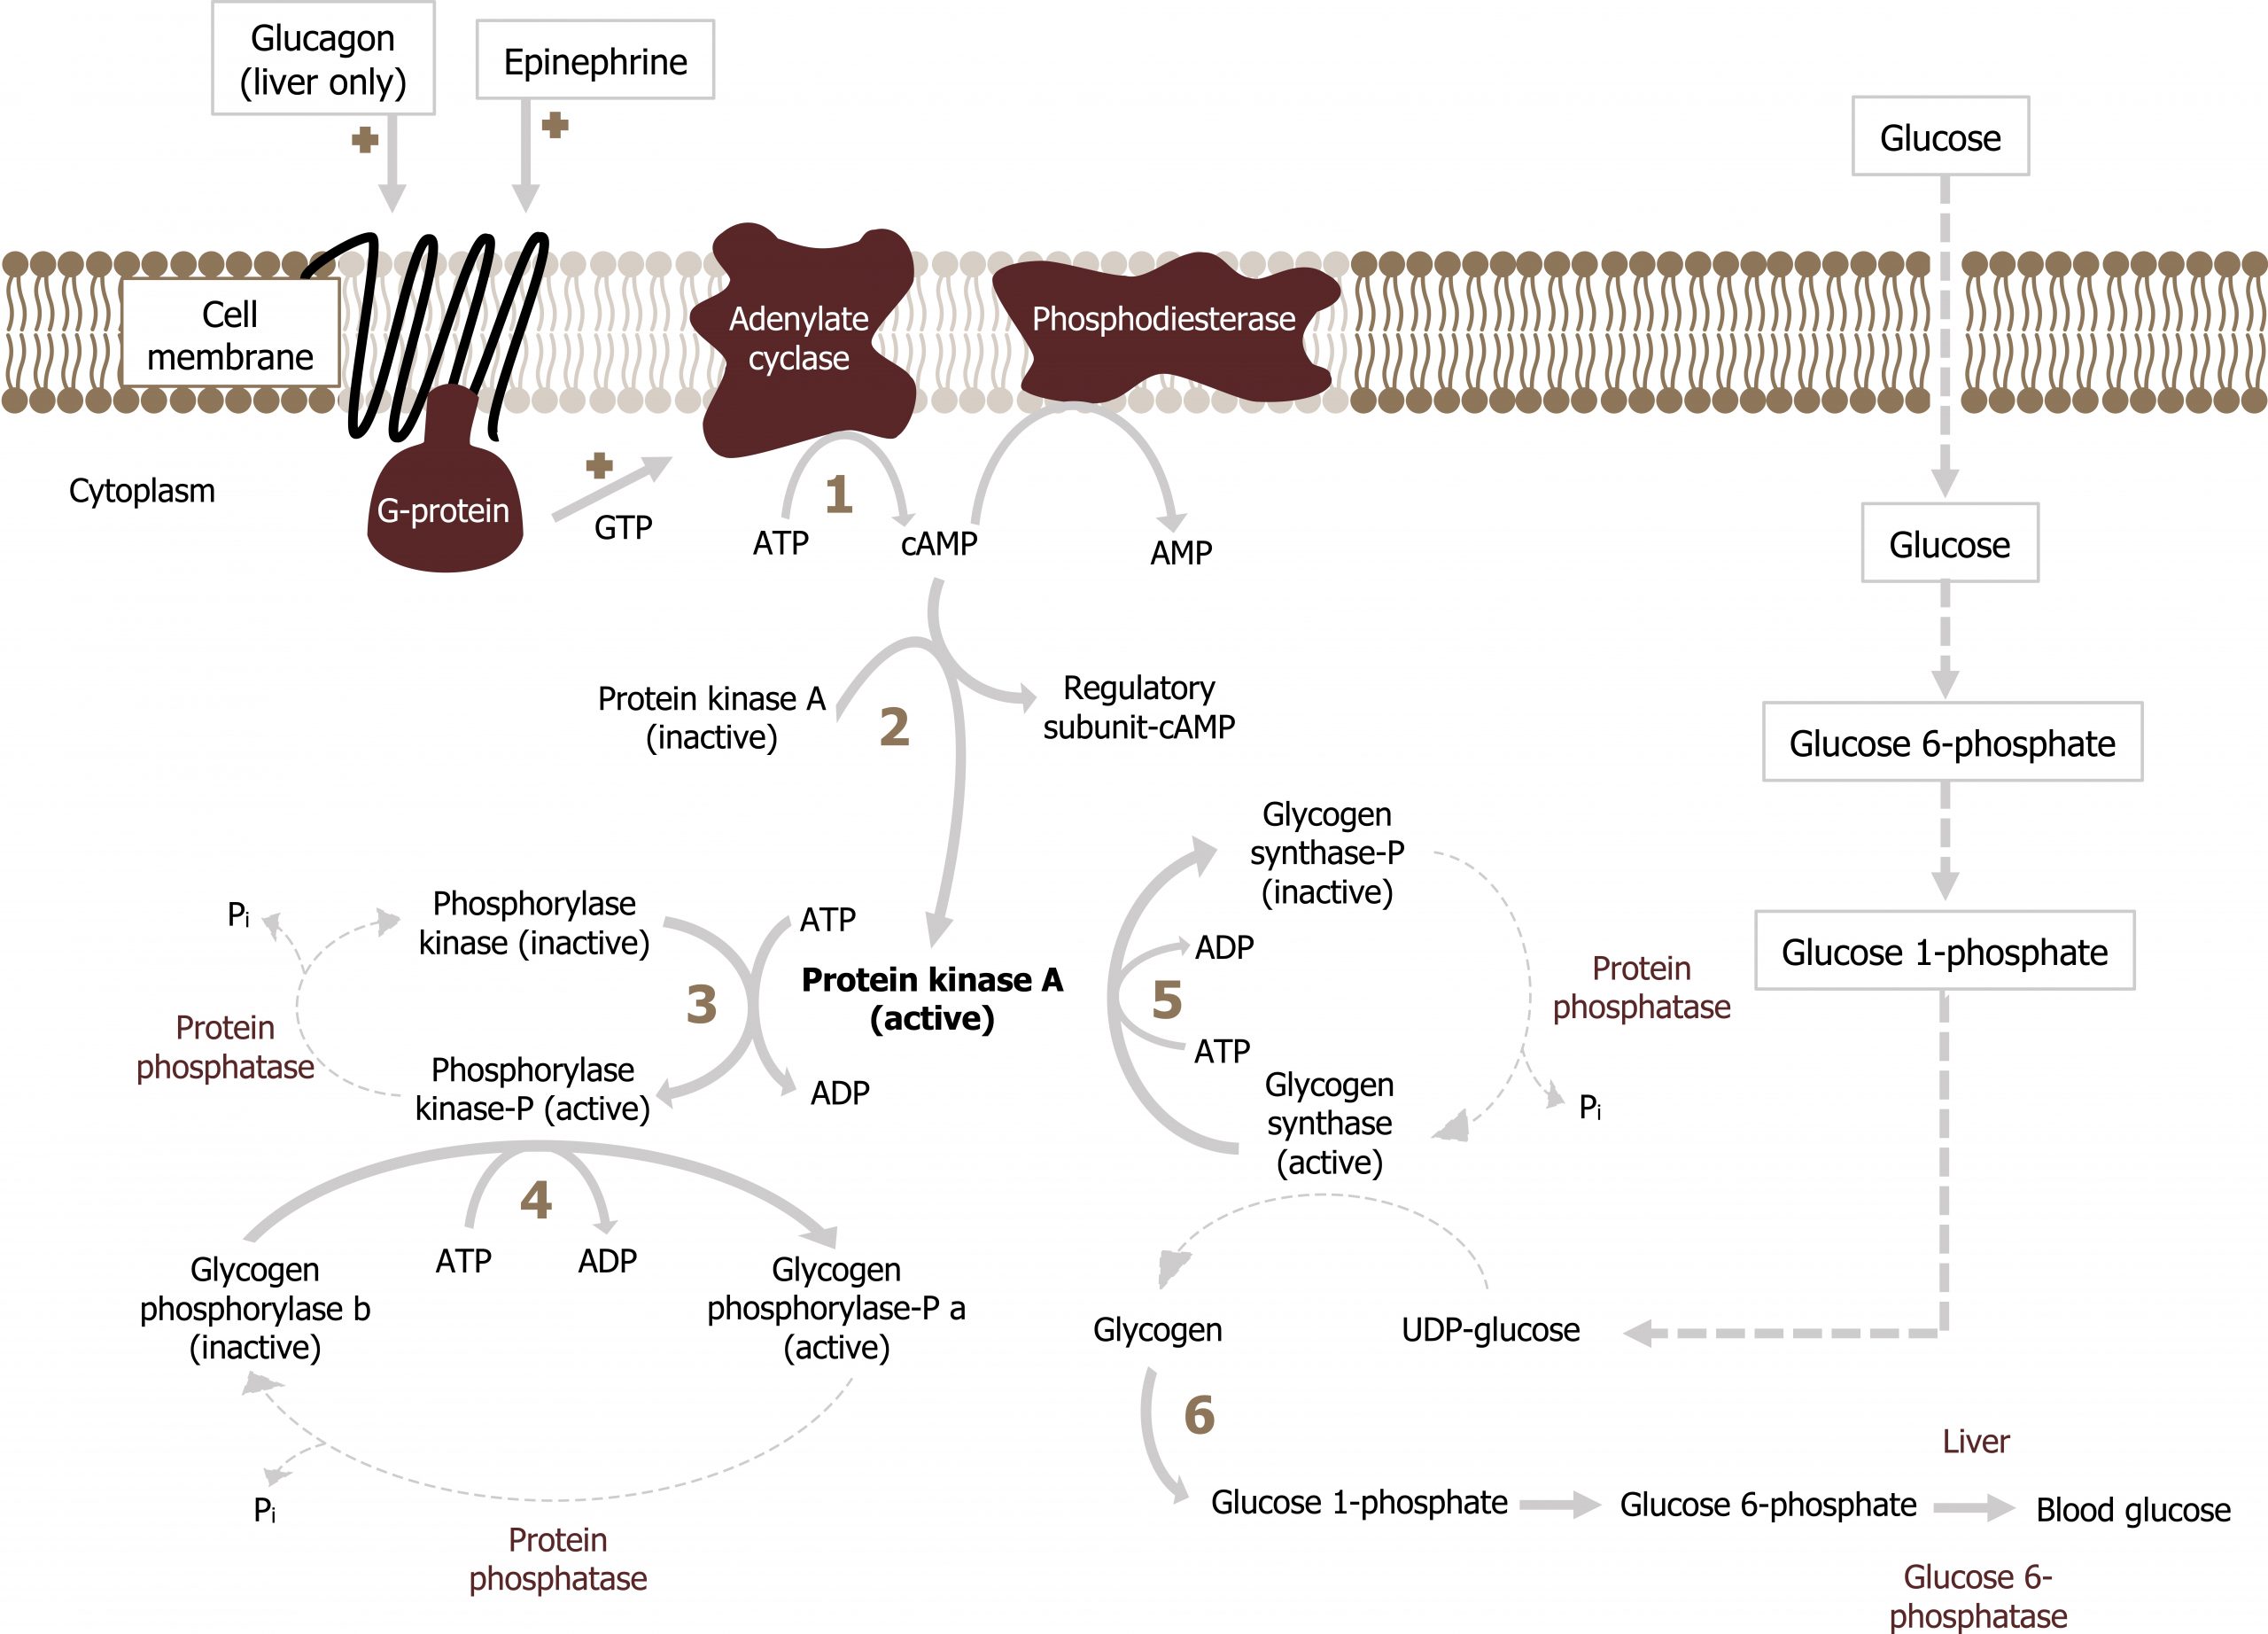
In the liver, glucagon will initiate glycogenolysis through a GPCR-mediated signaling cascade. This leads to the activation of adenylyl cyclase and an increase in cAMP. cAMP activates protein kinase A, which phosphorylates and activates glycogen phosphorylase. Glycogen phosphorylase will initiate glycogen degradation. Also under these conditions, using the same mechanism, glycogen synthase will be phosphorylated and inactivated, ensuring glycogen synthesis is not occurring at the same time (figure 5.6).
Epinephrine can also enhance hepatic glycogenolysis by binding an α-agonist receptor. This initiates the cleavage of phosphatidylinositol 4,5-bisphosphate (PIP2) into inositol 1,4,5-triphosphate (IP3) and diacylglyerol (DAG) by phospholipase C. IP3 stimulates Ca2+ release from endoplasmic reticulum and results in both:
- phosphorylation and activation of glycogen phosphorylase and
- phosphorylation and inactivation of glycogen synthase.
In all cases, the glucose 6-phosphate released from glycogen stores is dephosphorylated by glucose 6-phosphatase and released from the liver.
Skeletal muscle glycogenolysis
Skeletal muscle glycogen is not impacted by glucagon but responds to AMP, Ca2+, and epinephrine (figure 5.7).
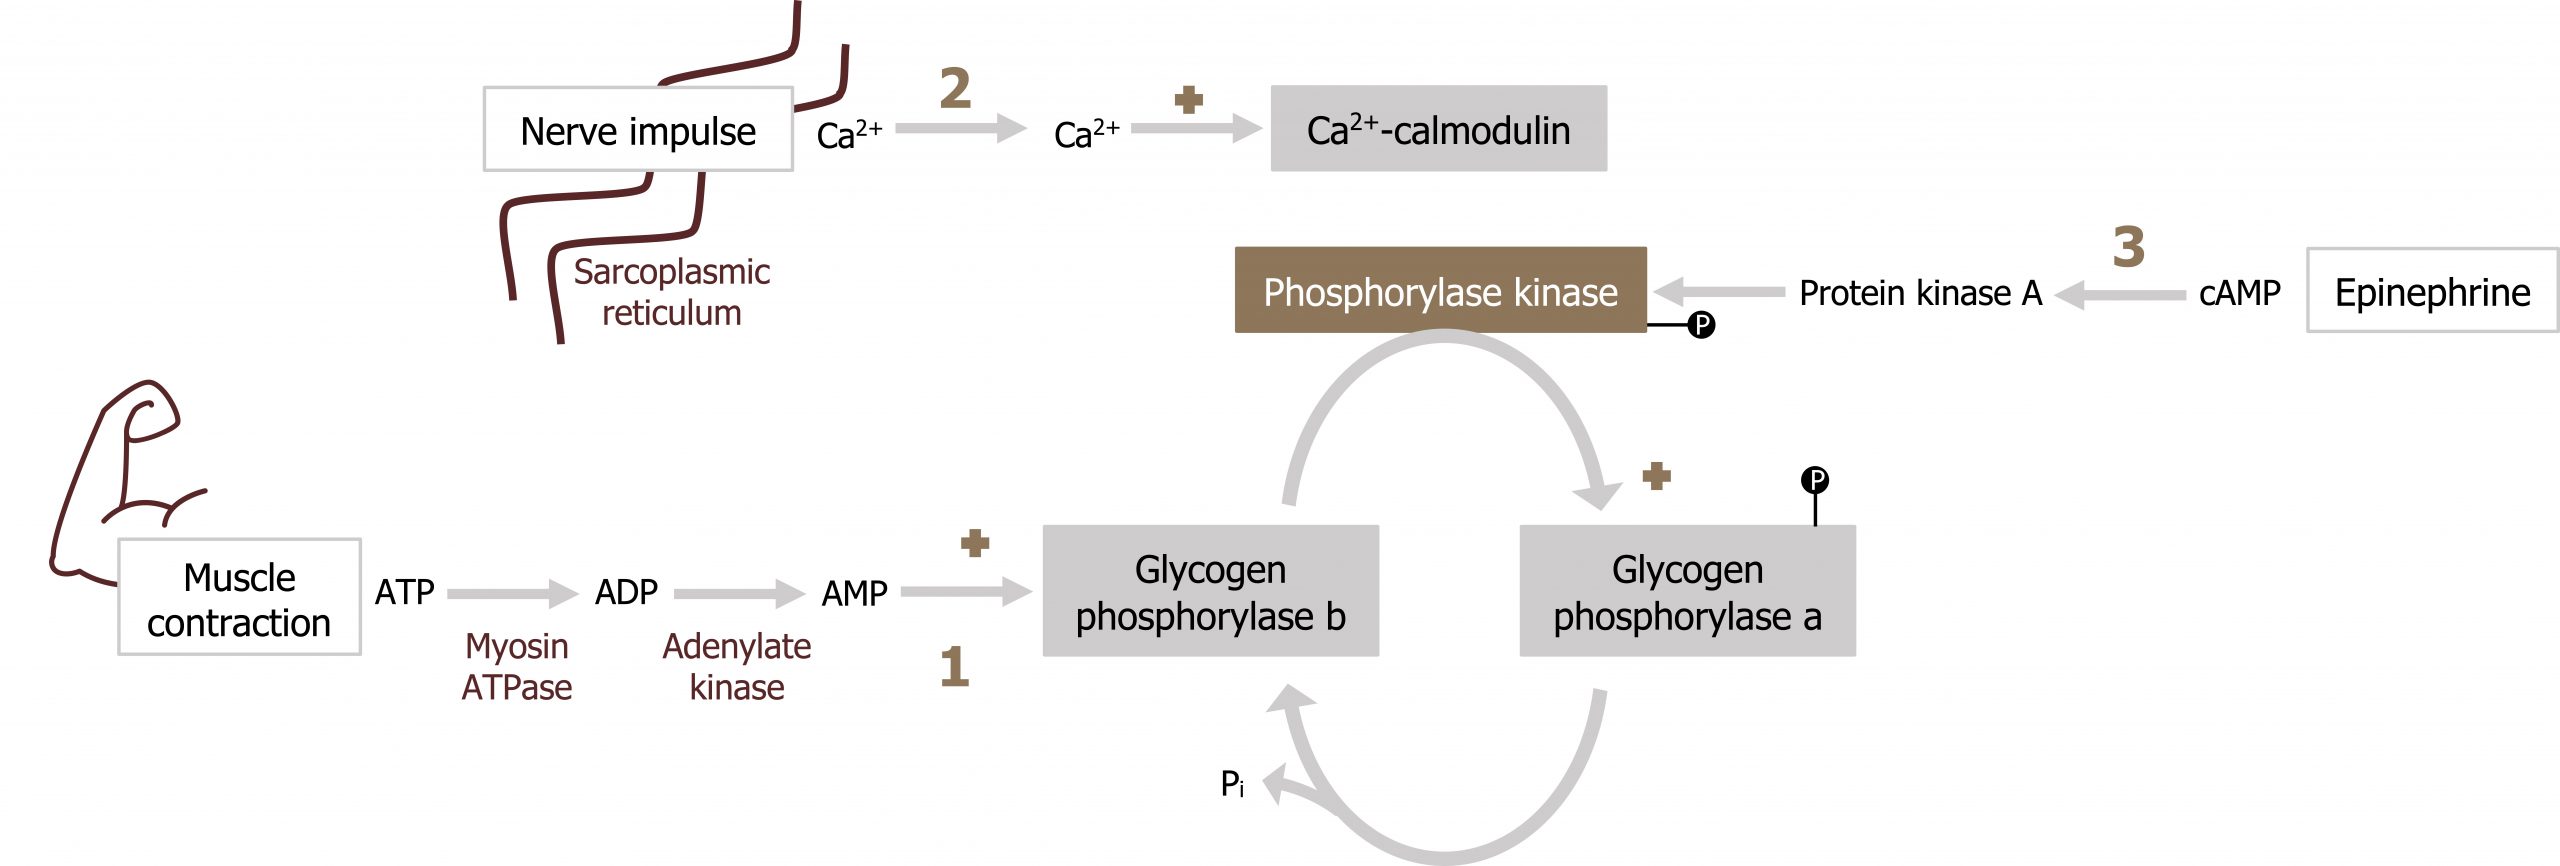
- The primary regulator of this process is AMP. Elevated AMP will allosterically activate glycogen phosphorylase independent of phosphorylation.
- Next, glycogen phosphorylase can be activated by Ca2+. Similar to the above cascade, calcium will activate the Ca2+ calmodulin complex, which will in turn activate phosphorylase kinase, ultimately leading to the phosphorylation and activation of glycogen phosphorylase.
- Finally, epinephrine can also stimulate skeletal muscle glycogenolysis through an increase in cAMP (the cascade of events is the same as glucagon-stimulated hepatic glycogenolysis).
Summary of pathway regulation
| Metabolic pathway | Major regulatory enzyme(s) | Allosteric effectors | Hormonal effects |
|---|---|---|---|
| Gluconeogenesis | Fructose 1,6-bisphosphatase (FBP1) | Citrate (+) Fructose 2,6-BP, AMP (-) | Glucagon ↑ decreases F 2,6-BP by reducing activation of PFK1 |
| Gluconeogenesis | Pyruvate carboxylase Phosphoenolpyruvate carboxykinase |
Acetyl-CoA (+) | Cortisol-mediated enhanced transcription |
| Glycogenolysis | Glycogen phosphorylase | AMP (+) muscle CaB2+ (+) in muscle |
Glucagon ↑ (liver) Epi ↑ (muscle) |
Table 5.1: Summary of pathway regulation.
5.1 References and resources
Text
Ferrier, D. R., ed. Lippincott Illustrated Reviews: Biochemistry, 7th ed. Philadelphia: Wolters Kluwer Health/Lippincott Williams & Wilkins, 2017, Chapter 10: Gluconeogenesis: Section II, III, IV, Chapter 11: Glycogen Metabolism: Section V, VI, Chapter 16: Fatty Acid Ketone Body and TAG Metabolism: Section III, IV, V, Chapter 19: Removal of Nitrogen from Amino Acids: Section V, VI, Chapter 23: Metabolic Effect of Insulin and Glucagon, Chapter 25: Diabetes Mellitus.
Le, T., and V. Bhushan. First Aid for the USMLE Step 1, 29th ed. New York: McGraw Hill Education, 2018, 78, 82, 86, 89–90.
Lieberman, M., and A. Peet, eds. Marks’ Basic Medical Biochemistry: A Clinical Approach, 5th ed. Philadelphia: Wolters Kluwer Health/Lippincott Williams & Wilkins, 2018, Chapter 3: The Fasted State, Chapter 19: Basic Concepts in Regulation, Chapter 24: Oxidative Phosphorylation and the ETC, Chapter 26: Formation of Glycogen, Chapter 28: Gluconeogenesis, Chapter 30: Oxidation of Fatty Acids, Chapter 34: Integration of Carbohydrate and Lipid Metabolism, Chapter 36: Fate of Amino Acids Nitrogen: Urea Cycle.
Figures
Ferrier D. Figure 5.1 Glucose production by glycogenolysis and gluconeogenesis. Adapted under Fair Use from Lippincott Illustrated Reviews Biochemistry. 7th Ed. pp 329. Figure 24.11 Sources of blood glucose after ingestion of 100 g of glucose. 2017.
Grey, Kindred, Figure 5.2 Comparison of glycolysis and gluconeogenesis. 2021. https://archive.org/details/5.2-new. CC BY 4.0.
Grey, Kindred, Figure 5.3 Locations of amino acid and lactate entering gluconeogenesis as substrates for the pathway. 2021. https://archive.org/details/5.3_20210924. CC BY 4.0.
Grey, Kindred, Figure 5.4 Glycerol as a substrate for gluconeogenesis, after phosphorylation to glycerol 3 -phosphate it can be converted to DHAP which can enter directly into glycolysis. 2021. https://archive.org/details/5.4_20210924. CC BY 4.0.
Grey, Kindred, Figure 5.5 Reaction catalyzed by pyruvate carboxylase, this allows the by pass of the irreversible step catalyzed by pyruvate kinase. 2021. https://archive.org/details/5.5_20210924. CC BY 4.0.
Grey, Kindred, Figure 5.7 Skeletal muscle glycogenolysis. 2021. https://archive.org/details/5.7_20210924. CC BY 4.0. Added Muscle by Pascal Heß from the Noun Project.
Lieberman M, Peet A. Figure 5.6 Hepatic glycogenolysis by epinephrine. Adapted under Fair Use from Marks’ Basic Medical Biochemistry. 5th Ed. pp 534. Figure 26.7 Regulation of glycogen synthesis and degradation in the liver. 2017. Added ion channel by Léa Lortal from the Noun Project.
5.2 Lipolysis, β-oxidation, and Ketogenesis
The processes of lipolysis, β-oxidation, and ketogenesis work in concert within the cell but should be considered distinct pathways.
Lipolysis
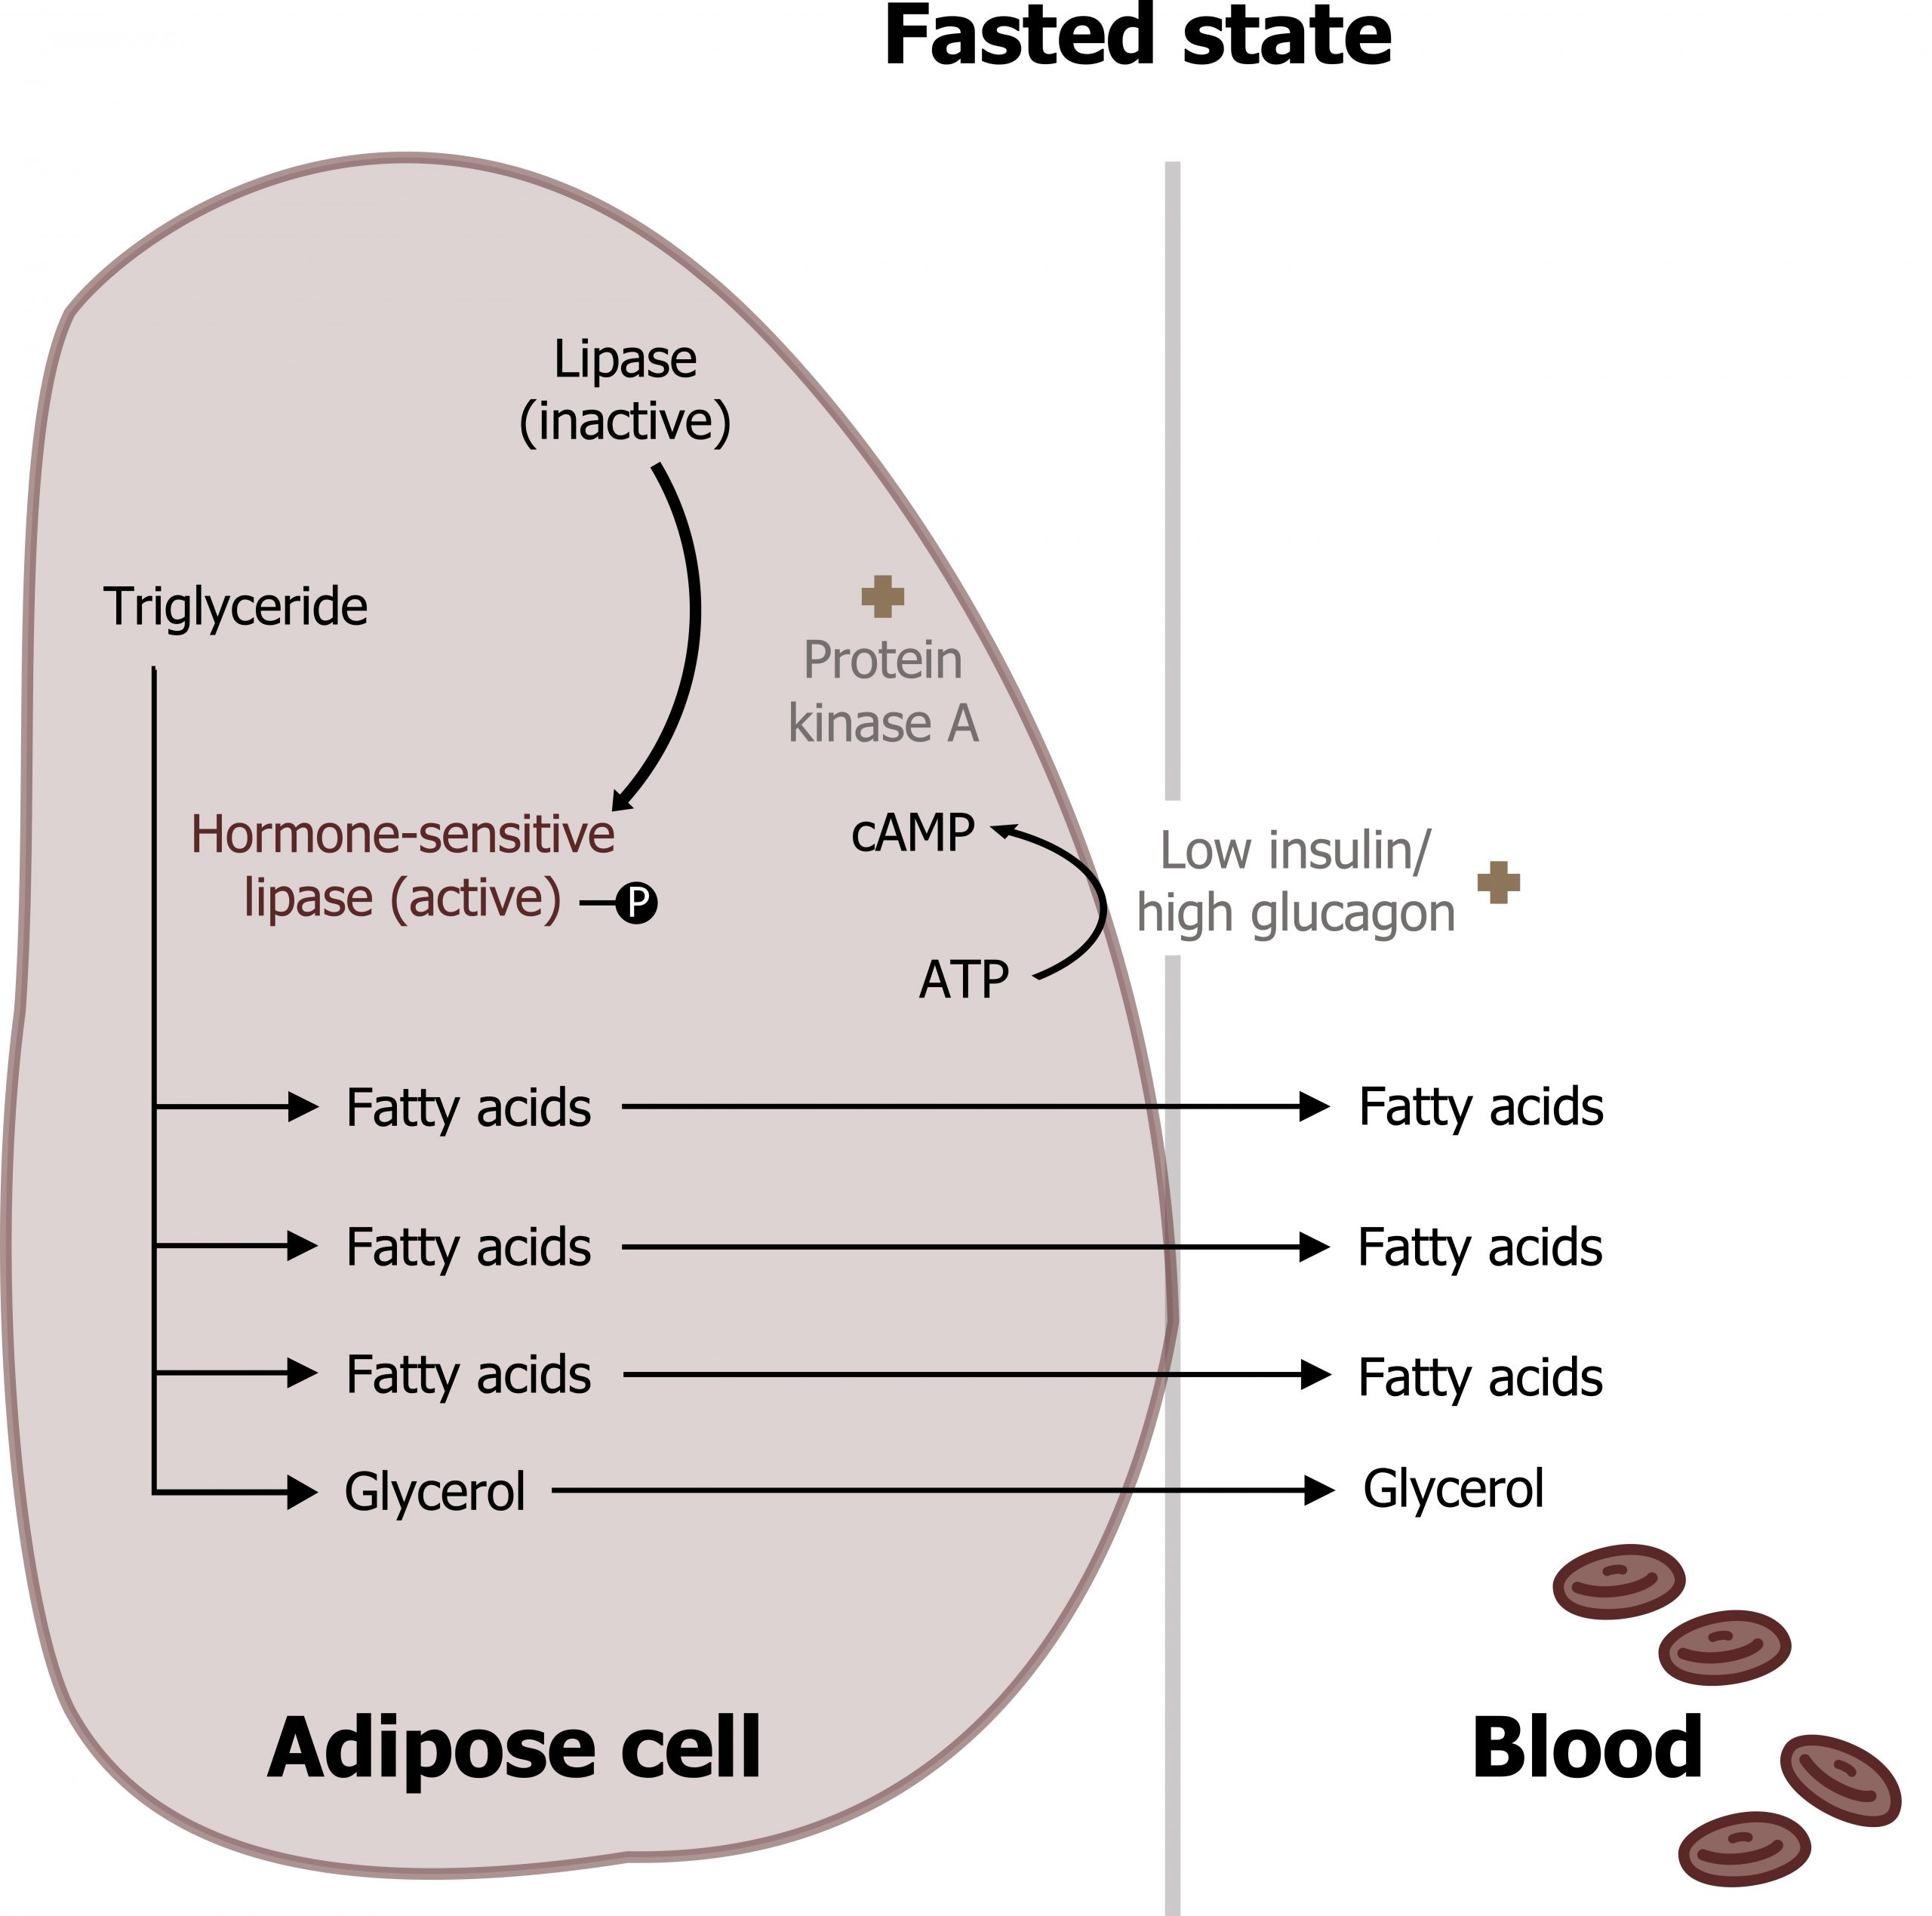
Lipolysis is the release of fatty acids from adipose tissue where they are stored as triacylglycerols (TAGs). This process is mediated by increasing levels of glucagon and epinephrine, which bind G-protein coupled receptors on the adipose tissue and activate lipolysis This cell-signaling cascade phosphorylates and activates hormone-sensitive lipase, the regulatory enzyme for lipolysis. Once phosphorylated (through hormone-mediated increase in cAMP) this enzyme will hydrolyze TAGs to three long-chain fatty acids (LCFAs) and glycerol. The LCFAs are released into the bloodstream and will circulate bound to albumin (fatty acids are hydrophobic and require a protein carrier). LCFAs will be taken up and oxidized by peripheral tissues and the liver under fasted conditions. The glycerol will also be released and used as a substrate for hepatic gluconeogenesis (section 5.1) (figure 5.6).
β-oxidation (oxidation of free fatty acids)
Fatty acid oxidation is a high energy yielding process. It can support the cellular energy needs during fasting and under conditions when excess energy is needed (exercise). After uptake from circulation, the LCFAs must be transferred into the mitochondria where β-oxidation occurs. Initially, the LCFAs are activated to acyl-CoA derivatives in the cytosol by acyl-CoA synthetase. The fatty acyl-CoA can then be transferred across the mitochondrial membranes using a series of transport proteins: carnitine palmitoyltransferase 1 and 2 (CPT1 and CPT2) (figure 5.9).
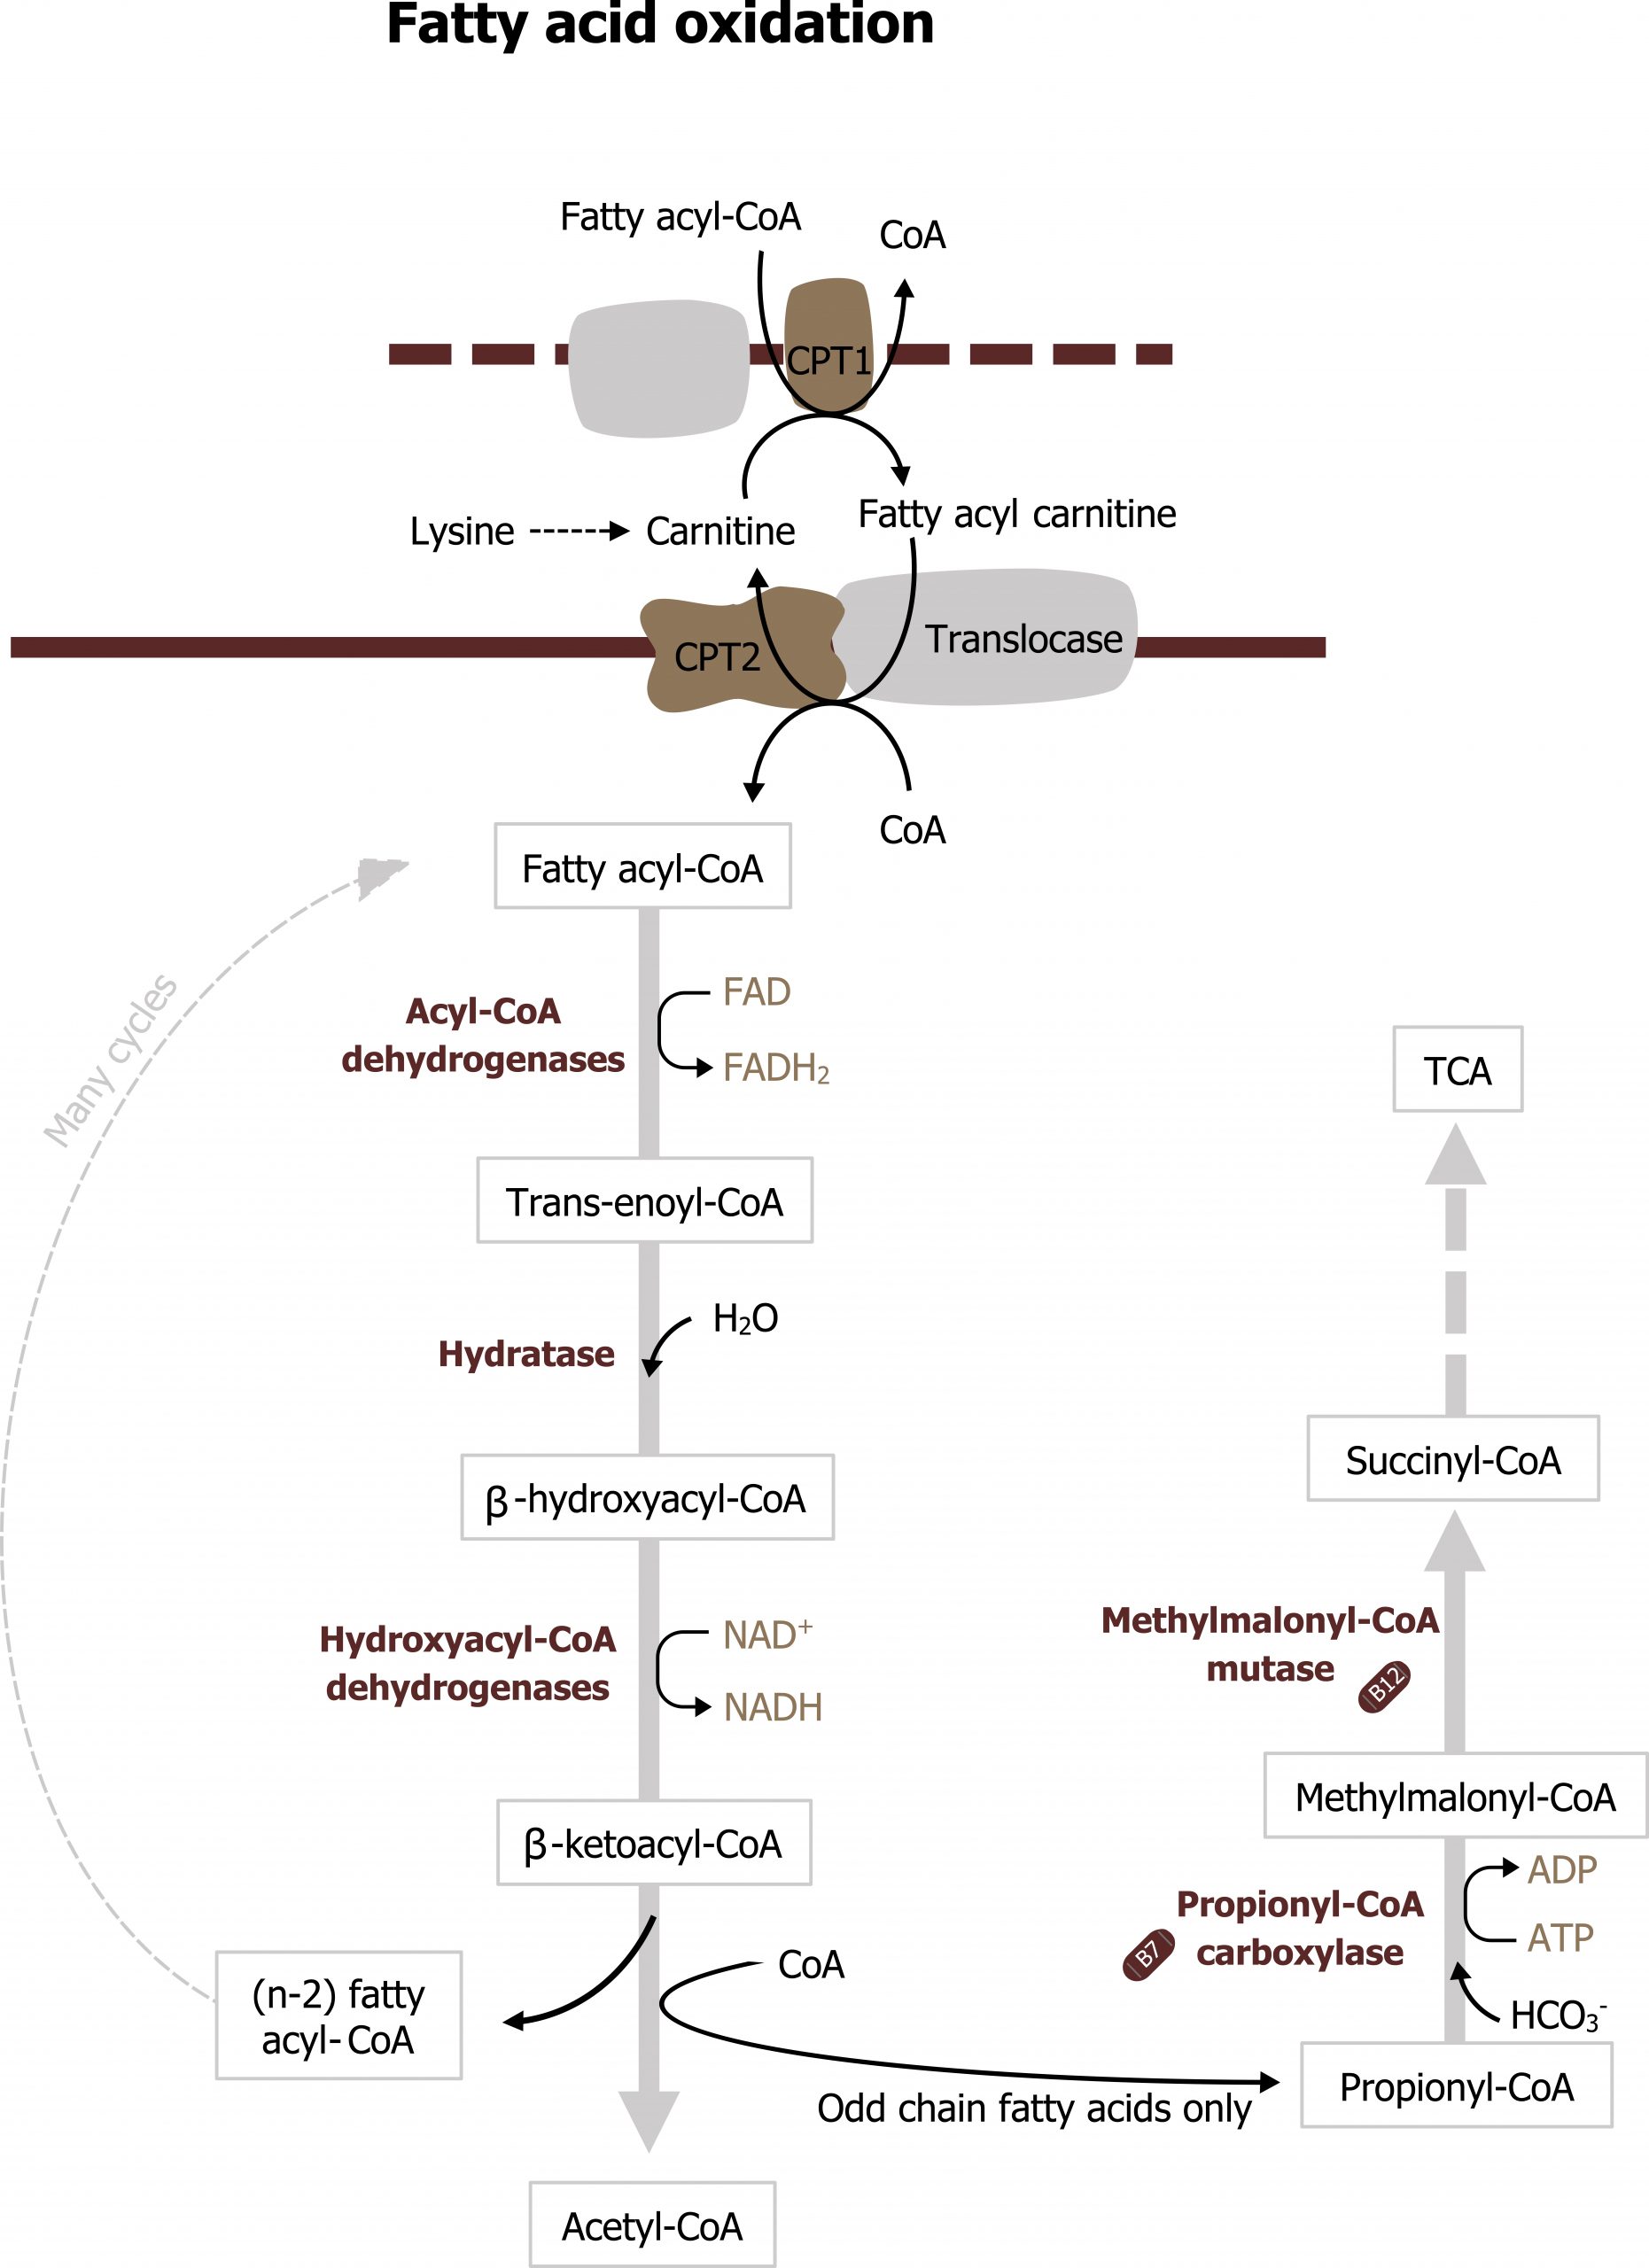
CPT1 sits on the outer mitochondrial membrane and transfers the fatty acyl-CoA to carnitine. Fatty acyl carnitine is transferred into the mitochondrial matrix through CPT2, and the carnitine is released and recycled. Only long-chain fatty acyl-CoAs require carnitine as a carrier; short- and medium-chain fatty acids can move into the mitochondria without the assistance of these transporters. Once in the matrix, the fatty acyl-CoA is now ready to undergo β-oxidation (figure 5.9).
β-oxidation is an iterative process that involves a series of enzymes that preferentially oxidize different length fatty acids (long, medium, and short). The full β-oxidation spiral consists of four steps that result in the generation of acetyl-CoA, NADH, and FADH2 for each cycle (figure 5.9). The NADH and FADH2 generated will be oxidized in the ETC to produce ATP. The acetyl-CoA can be oxidized in the TCA cycle, but more likely it will be used in ketogenesis. Oxidation of odd chain fatty acids will result in the generation of propionyl-CoA as the final carbon unit, which can also be oxidized in the TCA cycle. The acetyl-CoA from β-oxidation also plays a key role in the allosteric activation of pyruvate carboxylase, which is necessary for gluconeogenesis to occur (section 5.1).
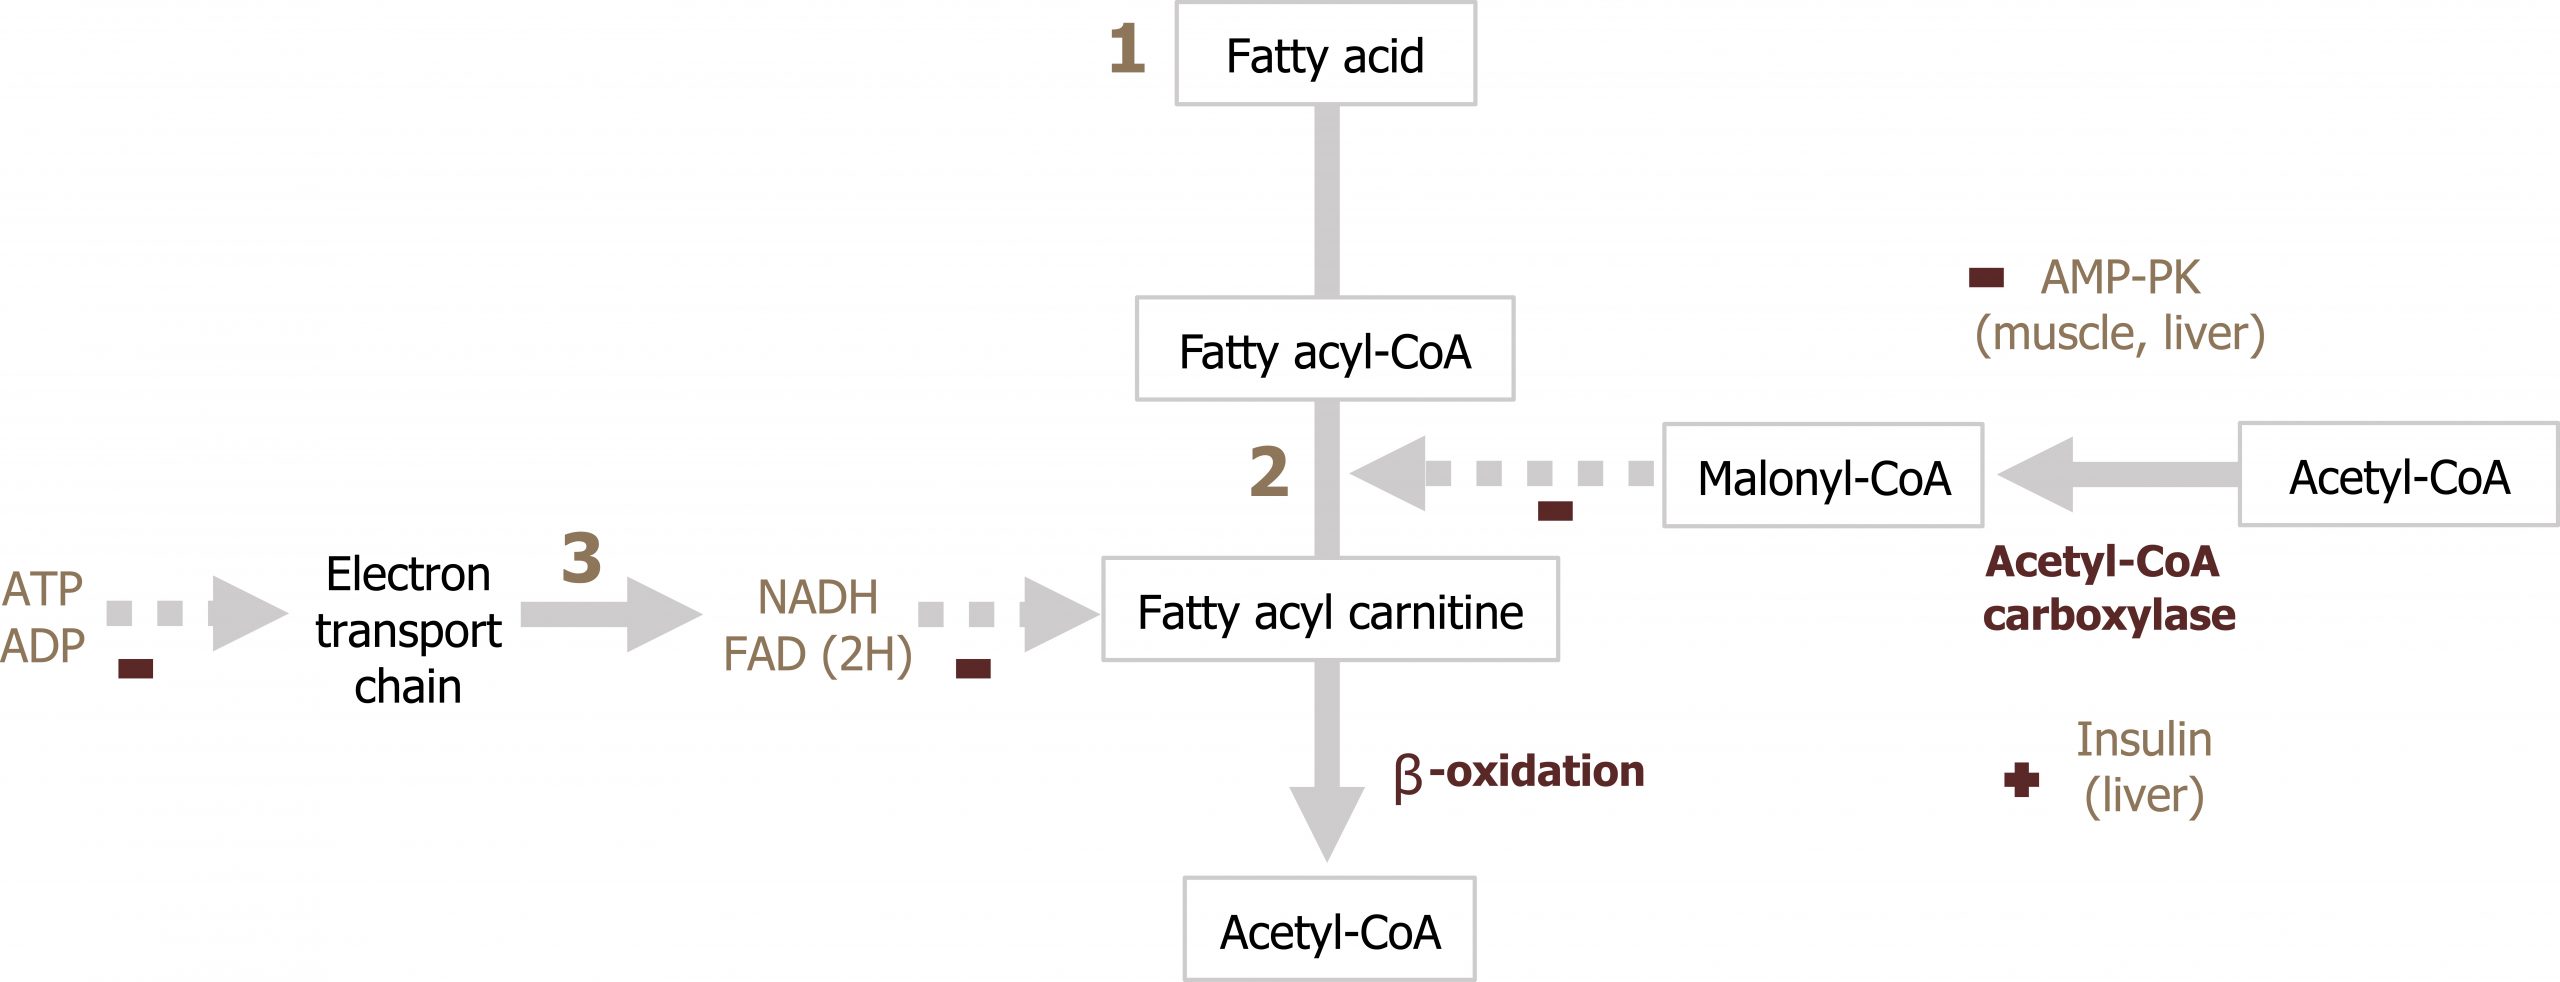
Regulation of β-oxidation
β-oxidation is regulated primarily at the level of transport of LCFAs across the mitochondrial membrane. Malonyl-CoA will inhibit CPT1 therefore ensuring that β-oxidation is not occurring at the same time as fatty acid synthesis (figure 5.10; section 4.4). Additionally, the rate of ATP production (ATP/ADP ratio) will also regulate the rate of NADH and FADH2 produced through β-oxidation (figure 5.10).
Ketogenesis
As mentioned above, the acetyl-CoA produced by β-oxidation is primarily used for ketogenesis — the synthesis of ketone bodies. Substrates for ketogenesis can also come from the oxidation of ketogenic amino acids. In the fasted state, the process of β-oxidation generates a significant amount of acetyl-CoA, and although some of this substrate can be oxidized in the TCA cycle, we need to consider the other metabolic processes occurring. First, the significant amount of NADH generated through β-oxidation reduces flux through the TCA cycle by decreasing the activity of both α-ketoglutarate dehydrogenase and isocitrate dehydrogenase. Second, the process of gluconeogenesis is occurring, and intermediates of the TCA cycle, specifically malate, are actively being moved out of the mitochondria. The combination of these two processes reduces the TCA cycle activity allowing for an accumulation of acetyl-CoA. As acetyl-CoA levels elevate in the mitochondria, this will drive the thiolase reaction to generate acetoacetyl-CoA from two acetyl-CoA molecules (figure 5.11).
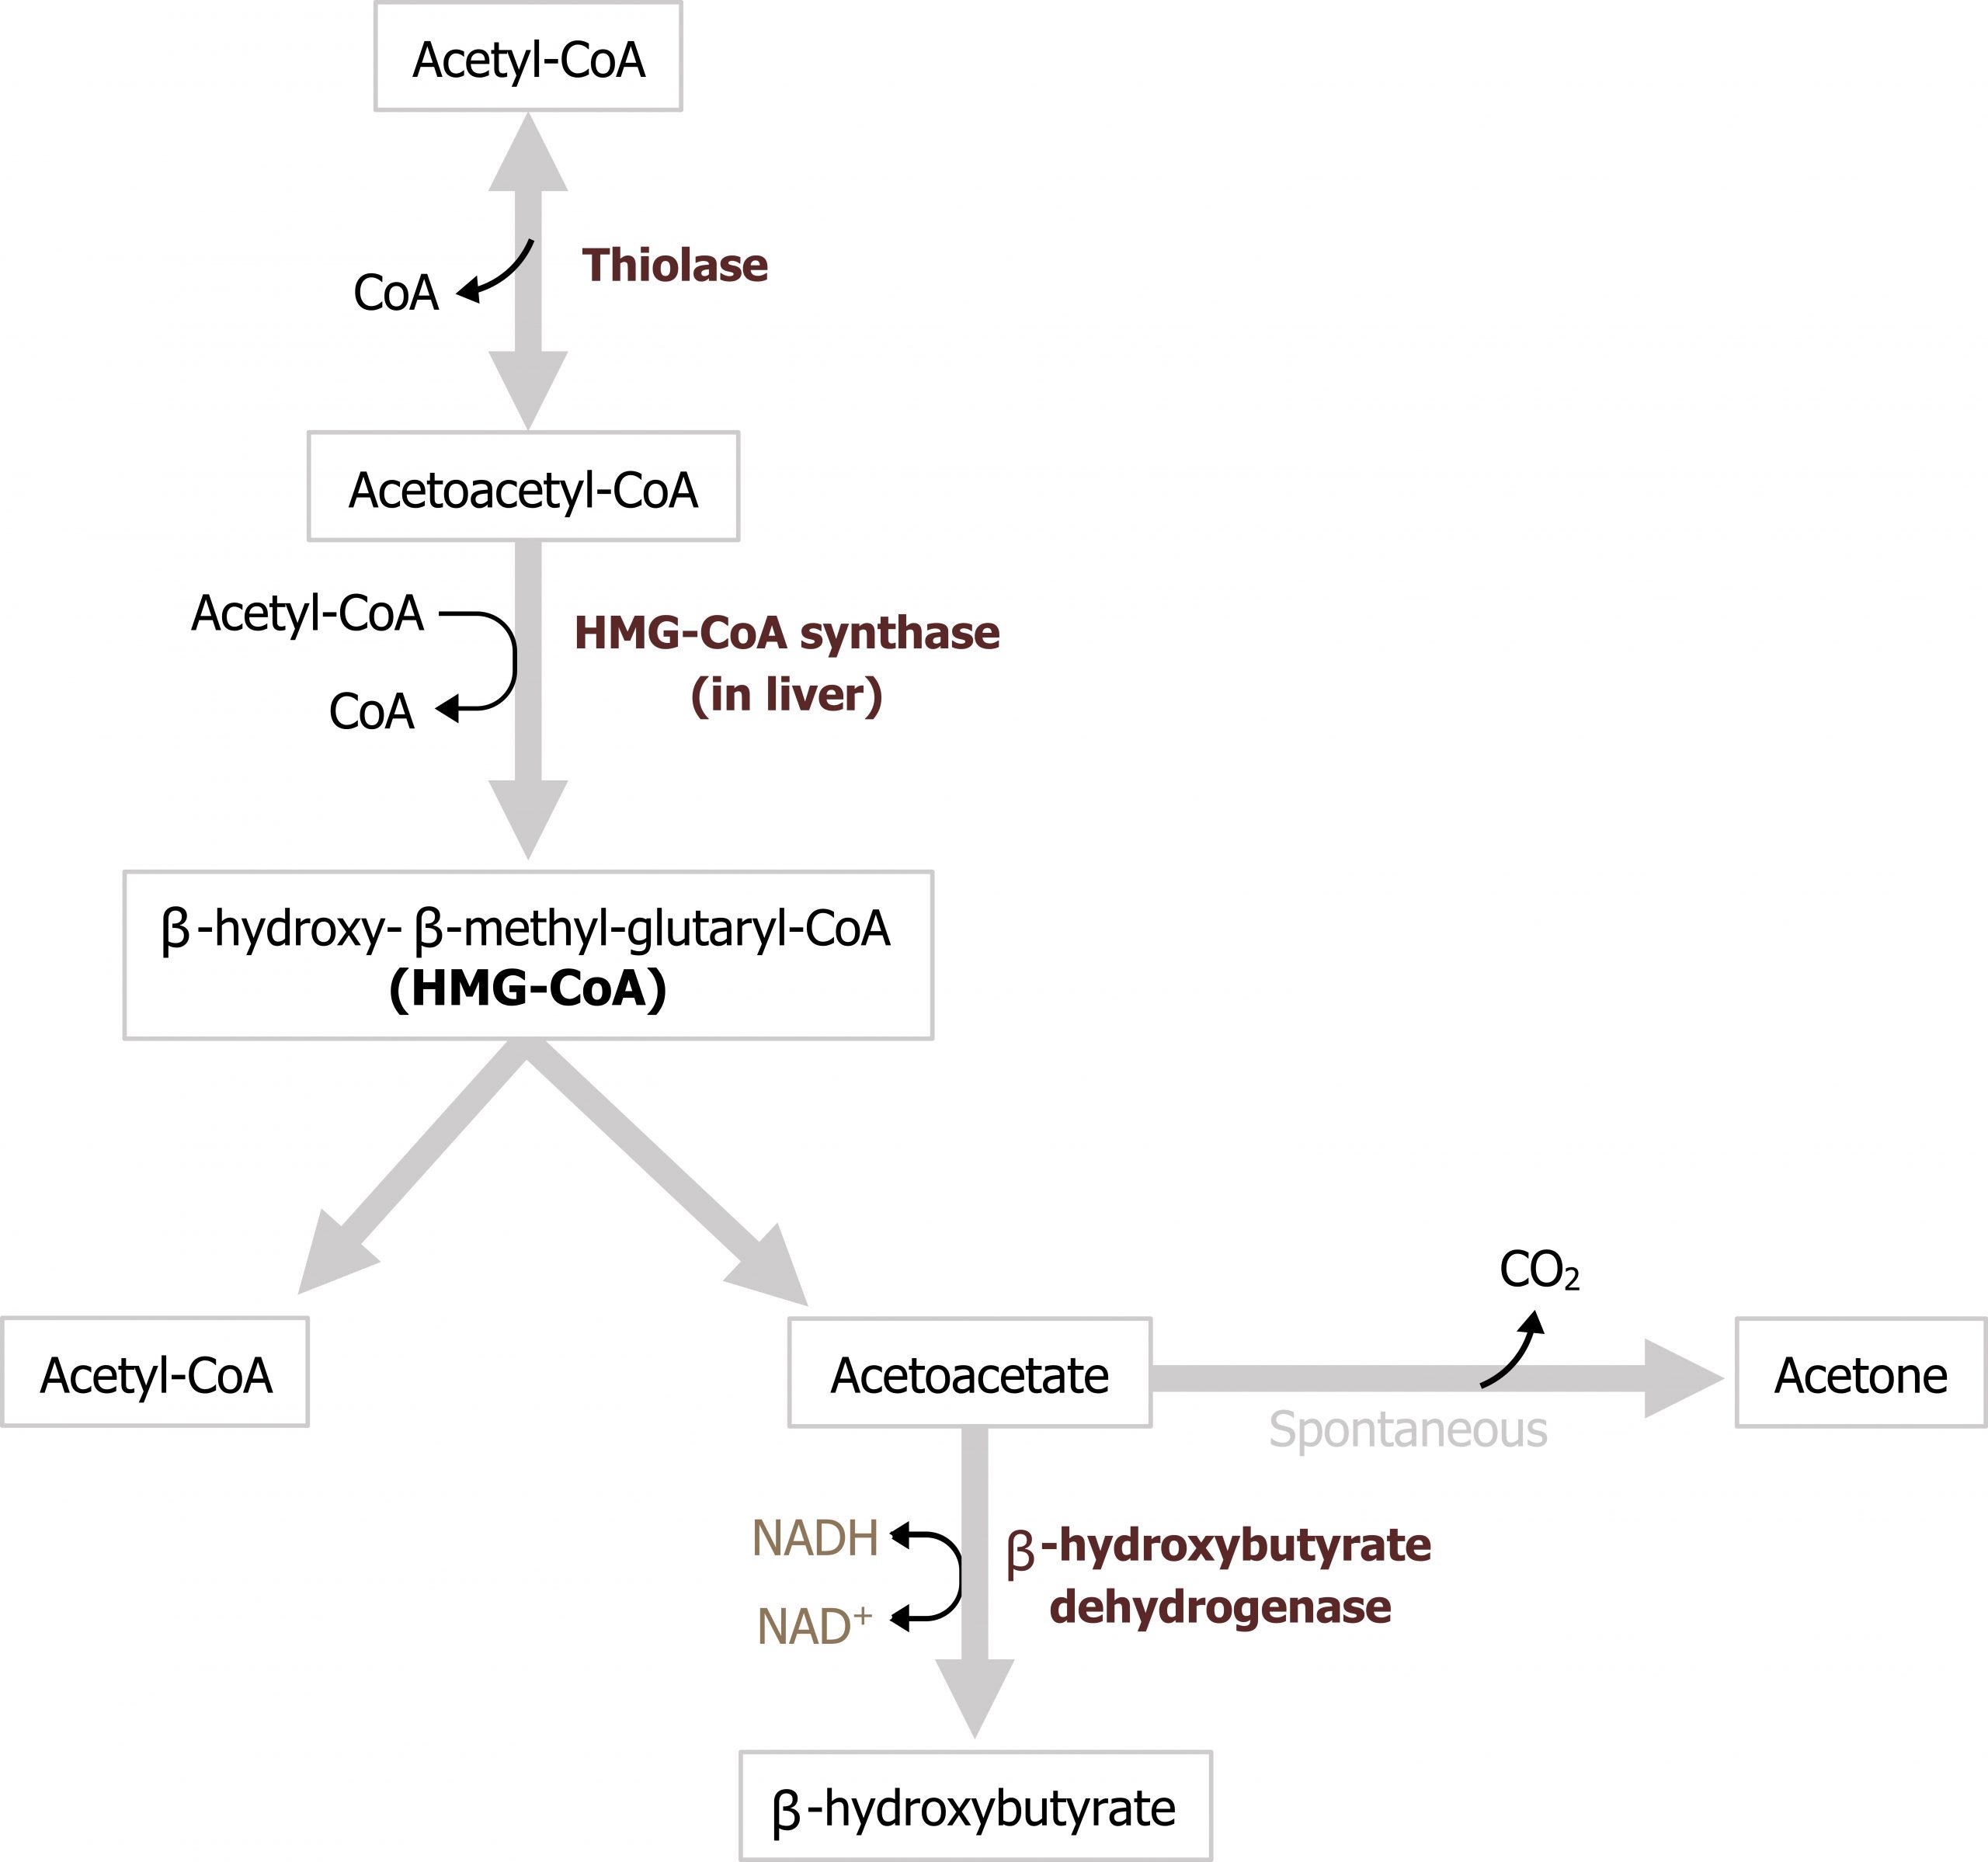
This compound is the substrate for HMG-CoA synthase, which generates 3-hydroxy-3-methyl glutaryl-CoA (HMG-CoA). HMG-CoA is then accepted by HMG-CoA lyase where an acetyl-CoA group is removed to generate acetoacetate. Acetoacetate can either undergo spontaneous decarboxylation to acetone, which can be exhaled, or it can be reduced to β-hydroxybutyrate using NADH. Acetoacetate and β-hydroxybutyrate are the two primary ketone bodies in circulation, and the ratio of the two is dependent on levels of NADH (figure 5.11). These two ketone bodies can be used as fuel in most tissues with the exception of the liver, which lacks thiophorase, the enzyme needed to metabolize these substrates. Ketone oxidation is not a primary fuel source, as fatty acid oxidation is preferred, but it can supply energy to some peripheral tissues. The brain can also oxidize ketones but only under extreme situations, such as starvation states.
Summary of pathway regulation
| Metabolic pathway | Major regulatory enzyme | Allosteric effectors | Hormonal effects |
|---|---|---|---|
| Lipolysis | Hormone-sensitive lipase | None | Epi ↑ Insulin ↓ |
| β-oxidation | Carnitine palmitoyltransferase | Malonyl-CoA (-) | None |
Table 5.2: Summary of pathway regulation.
5.2 References and resources
Text
Ferrier, D. R., ed. Lippincott Illustrated Reviews: Biochemistry, 7th ed. Philadelphia: Wolters Kluwer Health/Lippincott Williams & Wilkins, 2017, Chapter 10: Gluconeogenesis: Section II, III, IV, Chapter 11: Glycogen Metabolism: Section V, VI, Chapter 16: Fatty Acid Ketone Body and TAG Metabolism: Section III, IV, V, Chapter 19: Removal of Nitrogen from Amino Acids: Section V, VI, Chapter 23: Metabolic Effect of Insulin and Glucagon, Chapter 25: Diabetes Mellitus.
Le, T., and V. Bhushan. First Aid for the USMLE Step 1, 29th ed. New York: McGraw Hill Education, 2018, 78, 82, 86, 89–90.
Lieberman, M., and A. Peet, eds. Marks’ Basic Medical Biochemistry: A Clinical Approach, 5th ed. Philadelphia: Wolters Kluwer Health/Lippincott Williams & Wilkins, 2018, Chapter 3: The Fasted State, Chapter 19: Basic Concepts in Regulation, Chapter 24: Oxidative Phosphorylation and the ETC, Chapter 26: Formation of Glycogen, Chapter 28: Gluconeogenesis, Chapter 30: Oxidation of Fatty Acids, Chapter 34: Integration of Carbohydrate and Lipid Metabolism, Chapter 36: Fate of Amino Acids Nitrogen: Urea Cycle.
Figures
Grey, Kindred, Figure 5.8 Process of lipolysis. 2021. https://archive.org/details/5.6_20210924. CC BY 4.0. Added red blood cells by Lucas Helle from the Noun Project.
Grey, Kindred, Figure 5.9 Overview of LCFA transport into the mitochondria and β-oxidation. 2021. https://archive.org/details/5.7_20210924_202109. CC BY 4.0.
Grey, Kindred, Figure 5.10 Regulation of β-oxidation. 2021. https://archive.org/details/5.8_20210924. CC BY 4.0.
Grey, Kindred, Figure 5.11 Overview of ketone body formation. 2021. https://archive.org/details/5.9-deleted. CC BY 4.0.
5.3 Nitrogen Metabolism and the Urea Cycle
Amino acids play key roles as precursors to nitrogen-containing compounds (such as nucleotides and neurotransmitters), as substrates for protein synthesis, and as an oxidizable substrate for energy production (or storage). Unlike carbohydrate and lipid metabolism, we must be concerned with the fates of both the carbon- and nitrogen-containing moieties when discussing the metabolism of amino acids. In the case of amino acids, nitrogen is released as ammonia (NH3), and at physiological pH the majority of ammonia is present as an ammonium ion (NH4+). (It is important to note that only ammonia can cross cellular membranes.) The majority of ammonia is incorporated into urea (in the liver) and excreted by the kidney, while the remaining carbon-containing skeleton is oxidized or utilized in other anabolic pathways (i.e., gluconeogenesis).
Transport of nitrogen via amino acids
The amino acid pool is continually in flux and can be influenced by both dietary protein consumption as well as normal protein turnover within the tissues. Given that the major site of nitrogen disposal is the liver, a mechanism for transport of excess amino acid nitrogen from the peripheral tissues to the liver is in place. Both alanine and glutamine play an essential role as nontoxic carriers of ammonia from peripheral tissues to the liver (figures 5.12 and 5.13). To generate alanine and glutamine for transport, amino acids can undergo transamination reactions.
Transamination: The movement of nitrogen
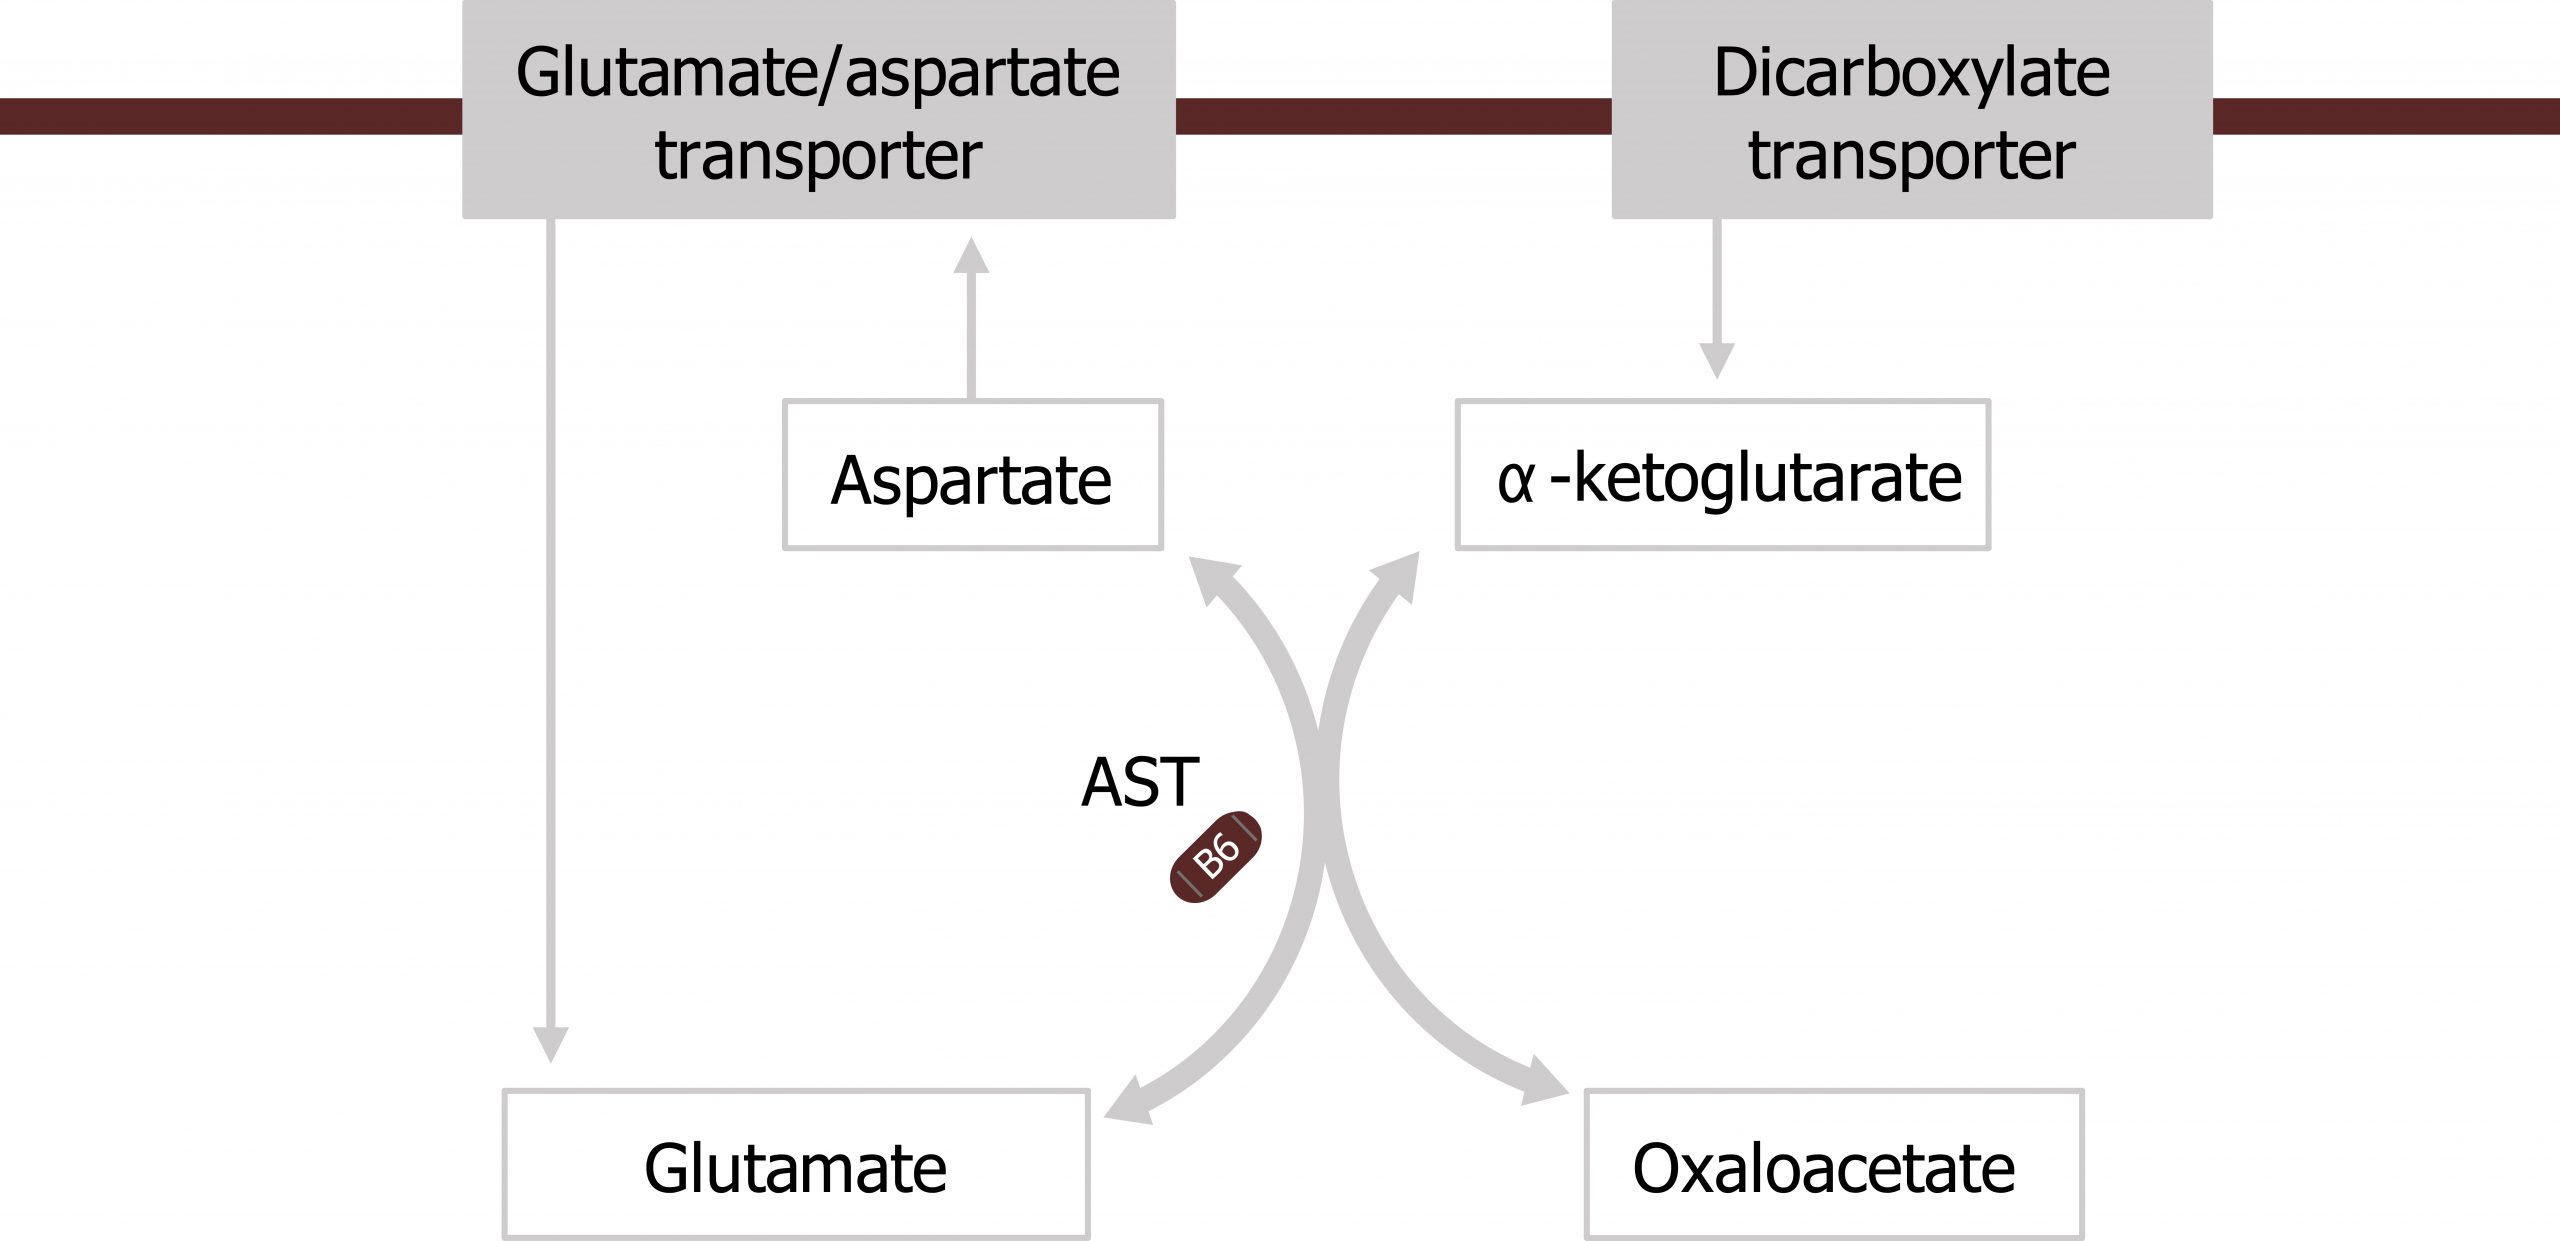
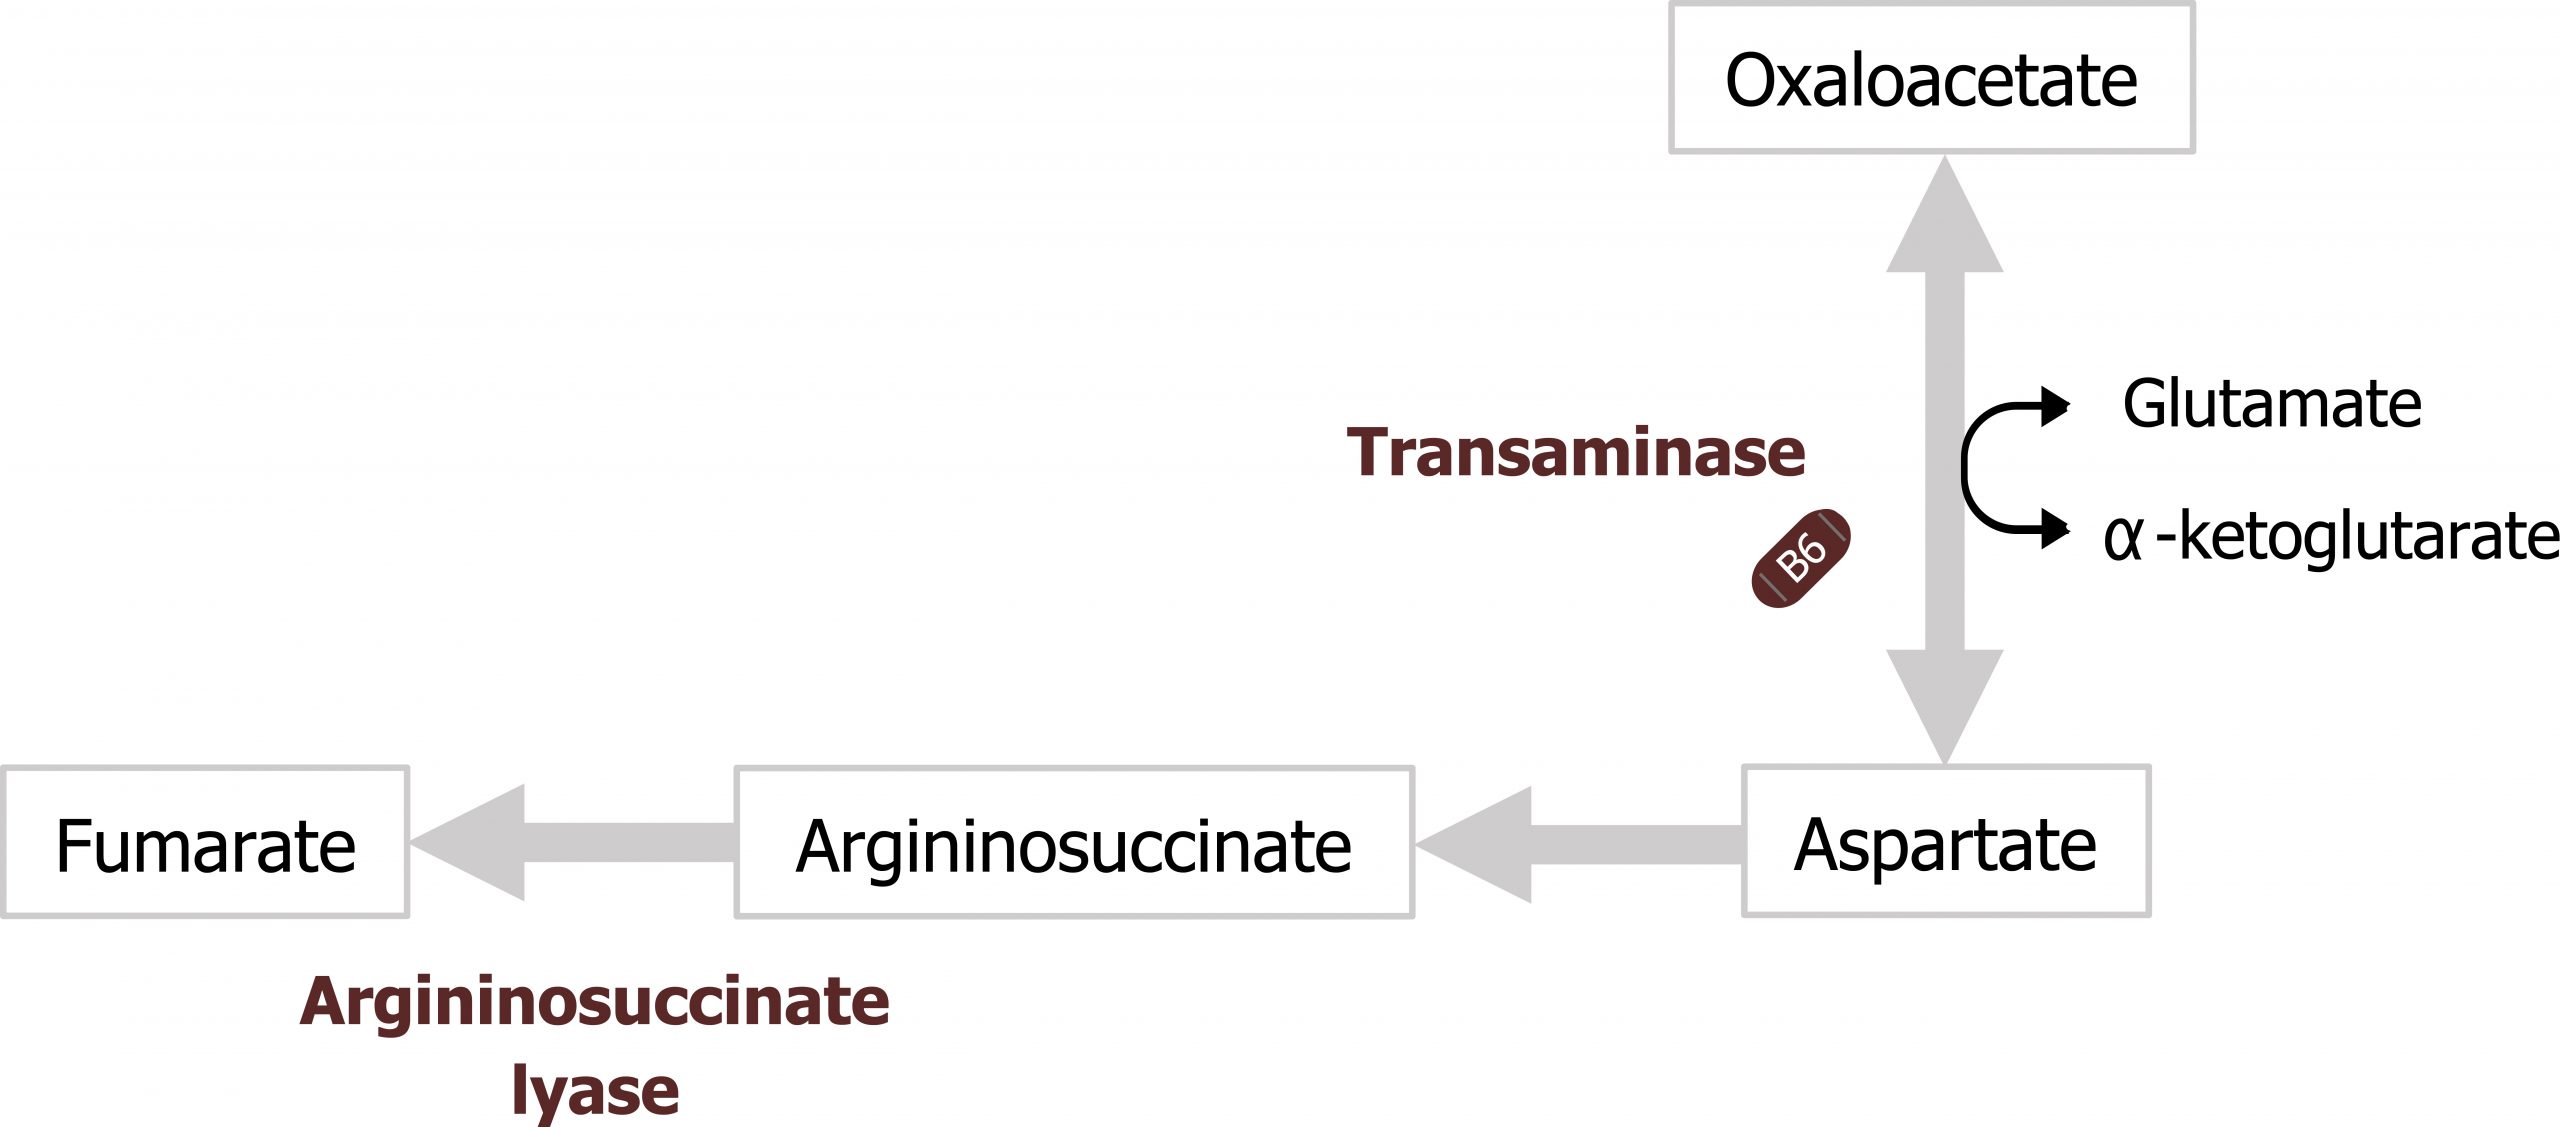
Amino transferases are a family of enzymes (which require pyridoxal phosphate; PLP) as a cofactor to help transfer nitrogen from amino acids on to keto-acid backbones. These enzymes do not free ammonia, but will transfer nitrogen from an amino group to a keto-group in an exchange or transferase reaction. Alanine aminotransferase (ALT) and aspartate aminotransferase (AST) are common and clinically relevant transferases. AST will preferentially accept aspartate and transaminate it in a reaction with α-ketoglutarate (the keto-acid of glutamate) to generate oxaloacetate (OAA) (the keto-acid of aspartate) and glutamate (figures 5.12 and 5.13).
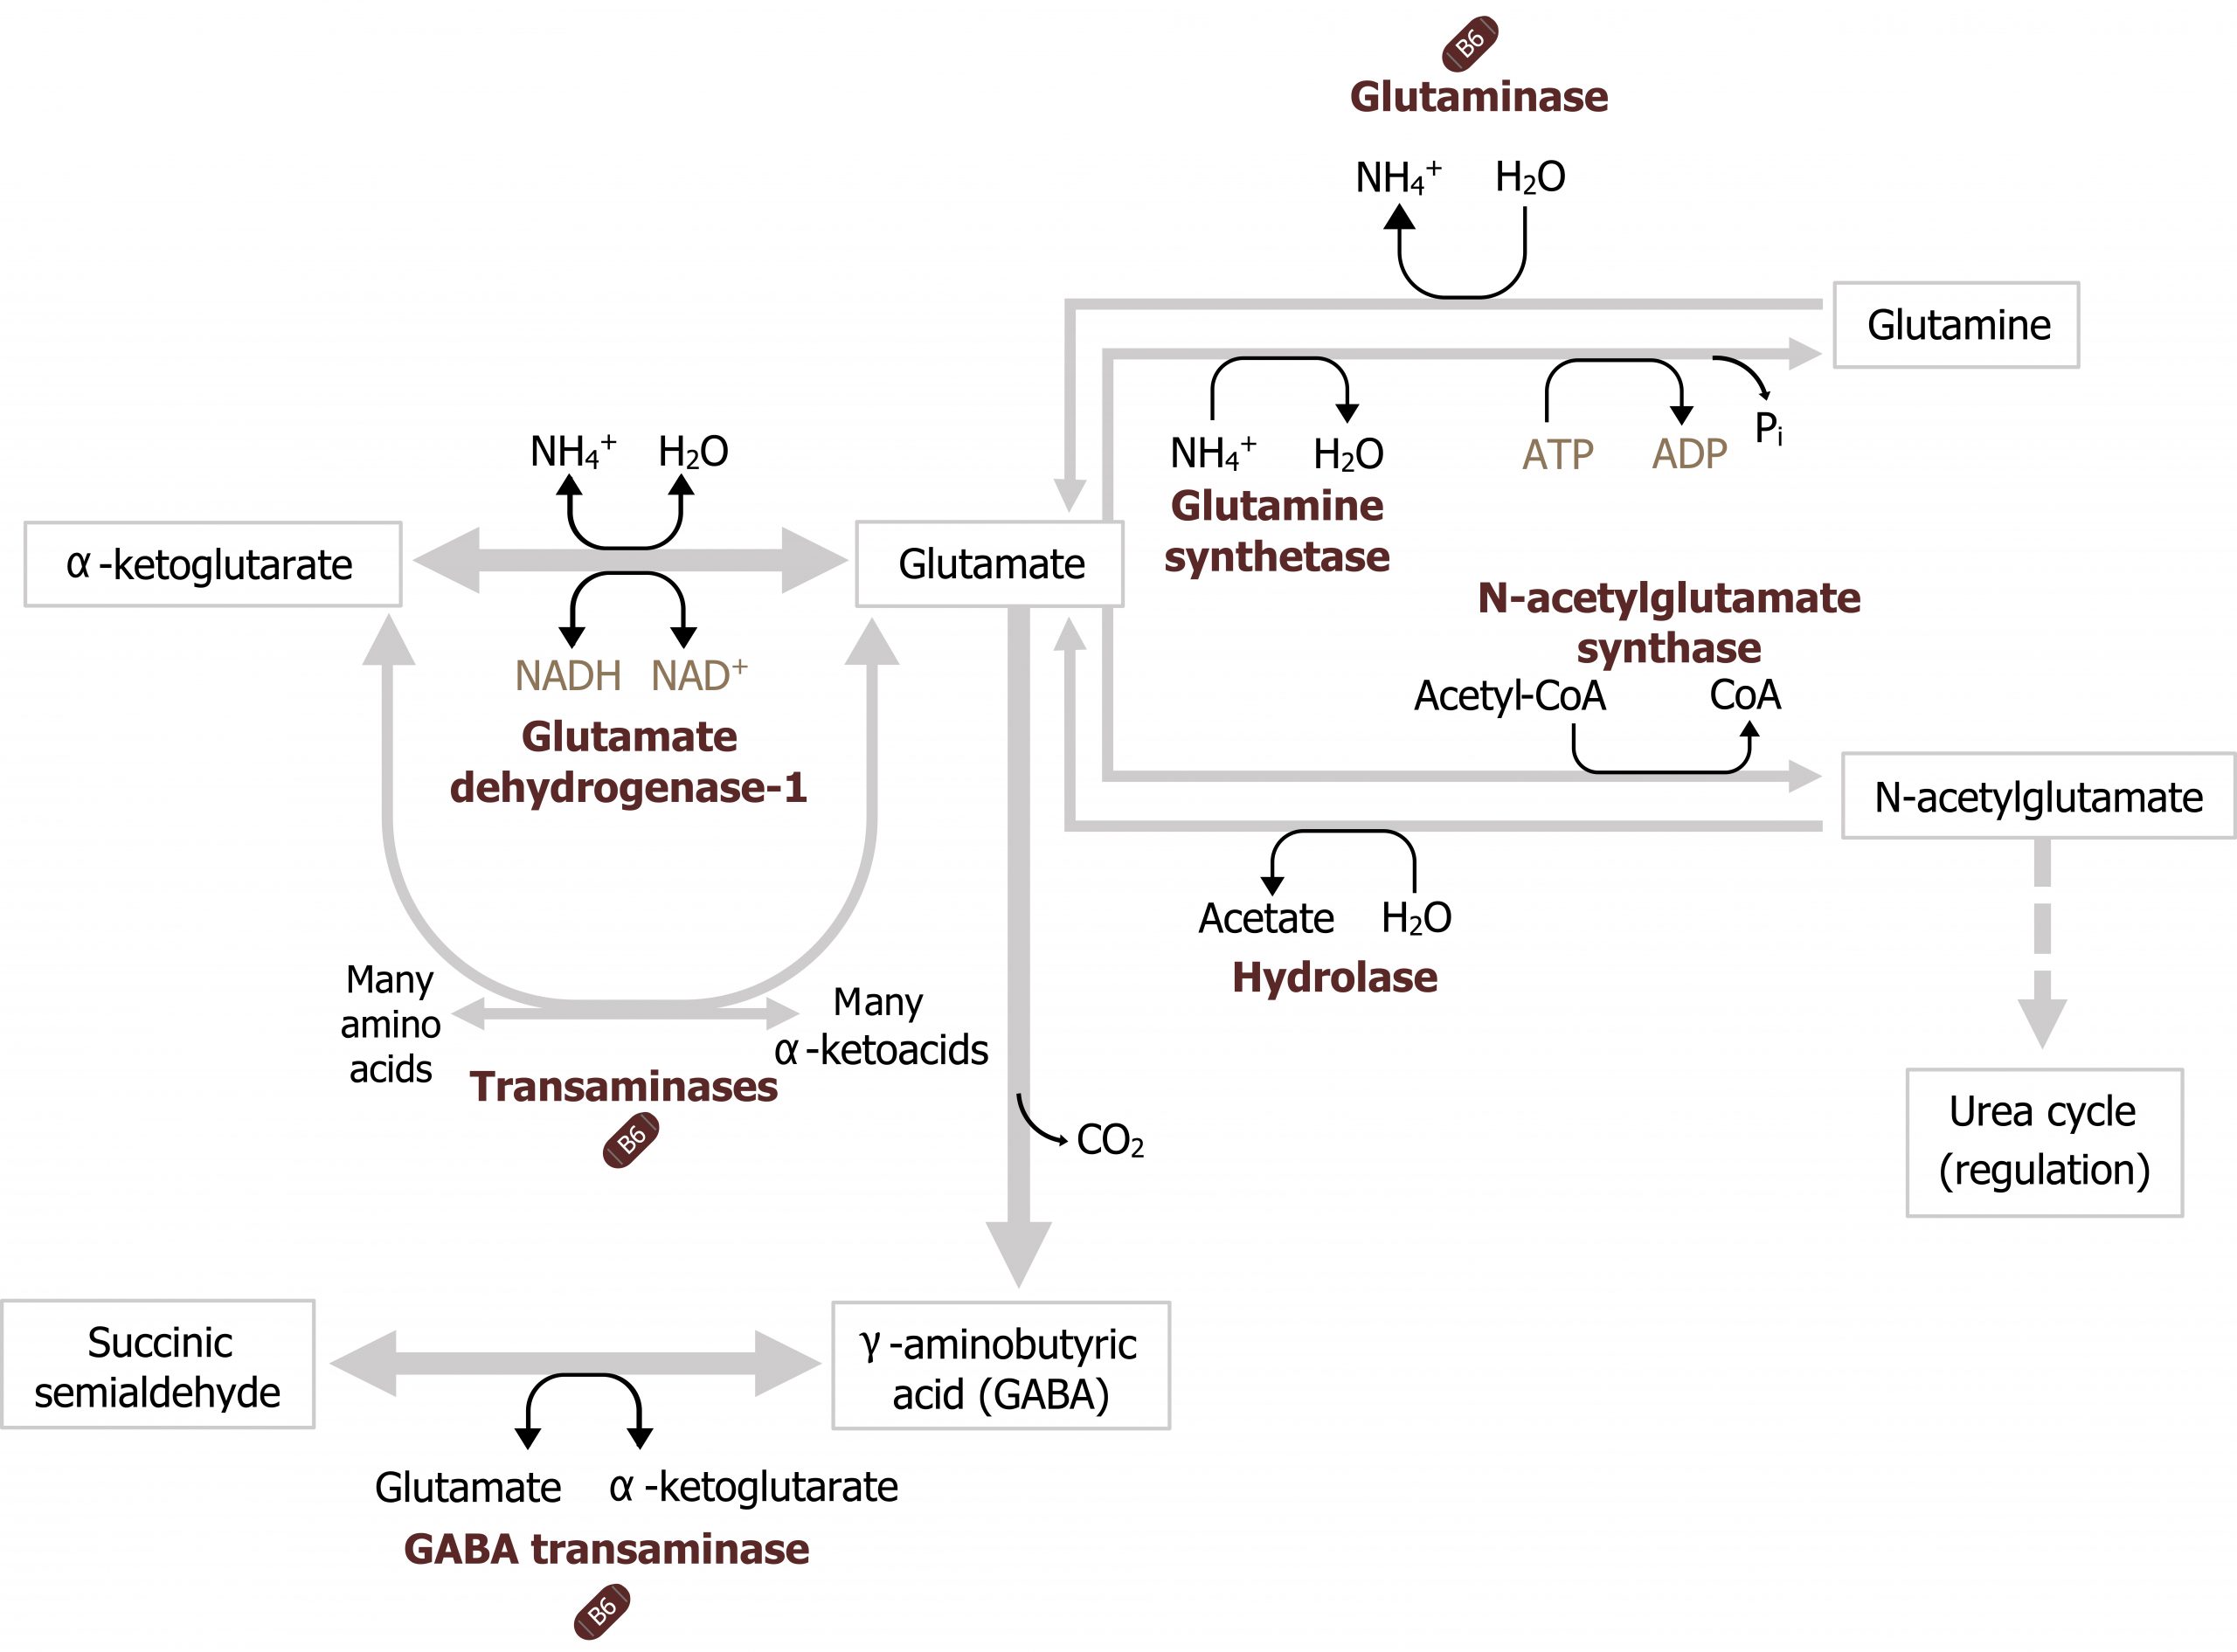
Glutamate dehydrogenase, glutamine synthetase, and glutaminase
In addition to transaminases, there are three other enzymes that play essential roles in nitrogen transport. Glutamate dehydrogenase (GDH) is present in most tissues and is one of the few enzymes able to fix or free ammonia. In figure 5.14, in the skeletal muscle, glutamate dehydrogenase is illustrated fixing ammonia to α-ketoglutarate to generate glutamate, while in the liver it is shown freeing ammonia in the reverse reaction. The direction of the reaction will be influenced by several factors including cellular needs, the levels of NAD+ or NADP+, and levels of ammonia (figure 5.14).
In peripheral tissues, glutamate generated from transamination or from the GDH reaction can be used to fix an additional ammonia to generate glutamine. This reaction, catalyzed by glutamine synthetase, facilitates the synthesis and subsequent movement of excess nitrogen from peripheral tissues to the liver (figure 5.14).
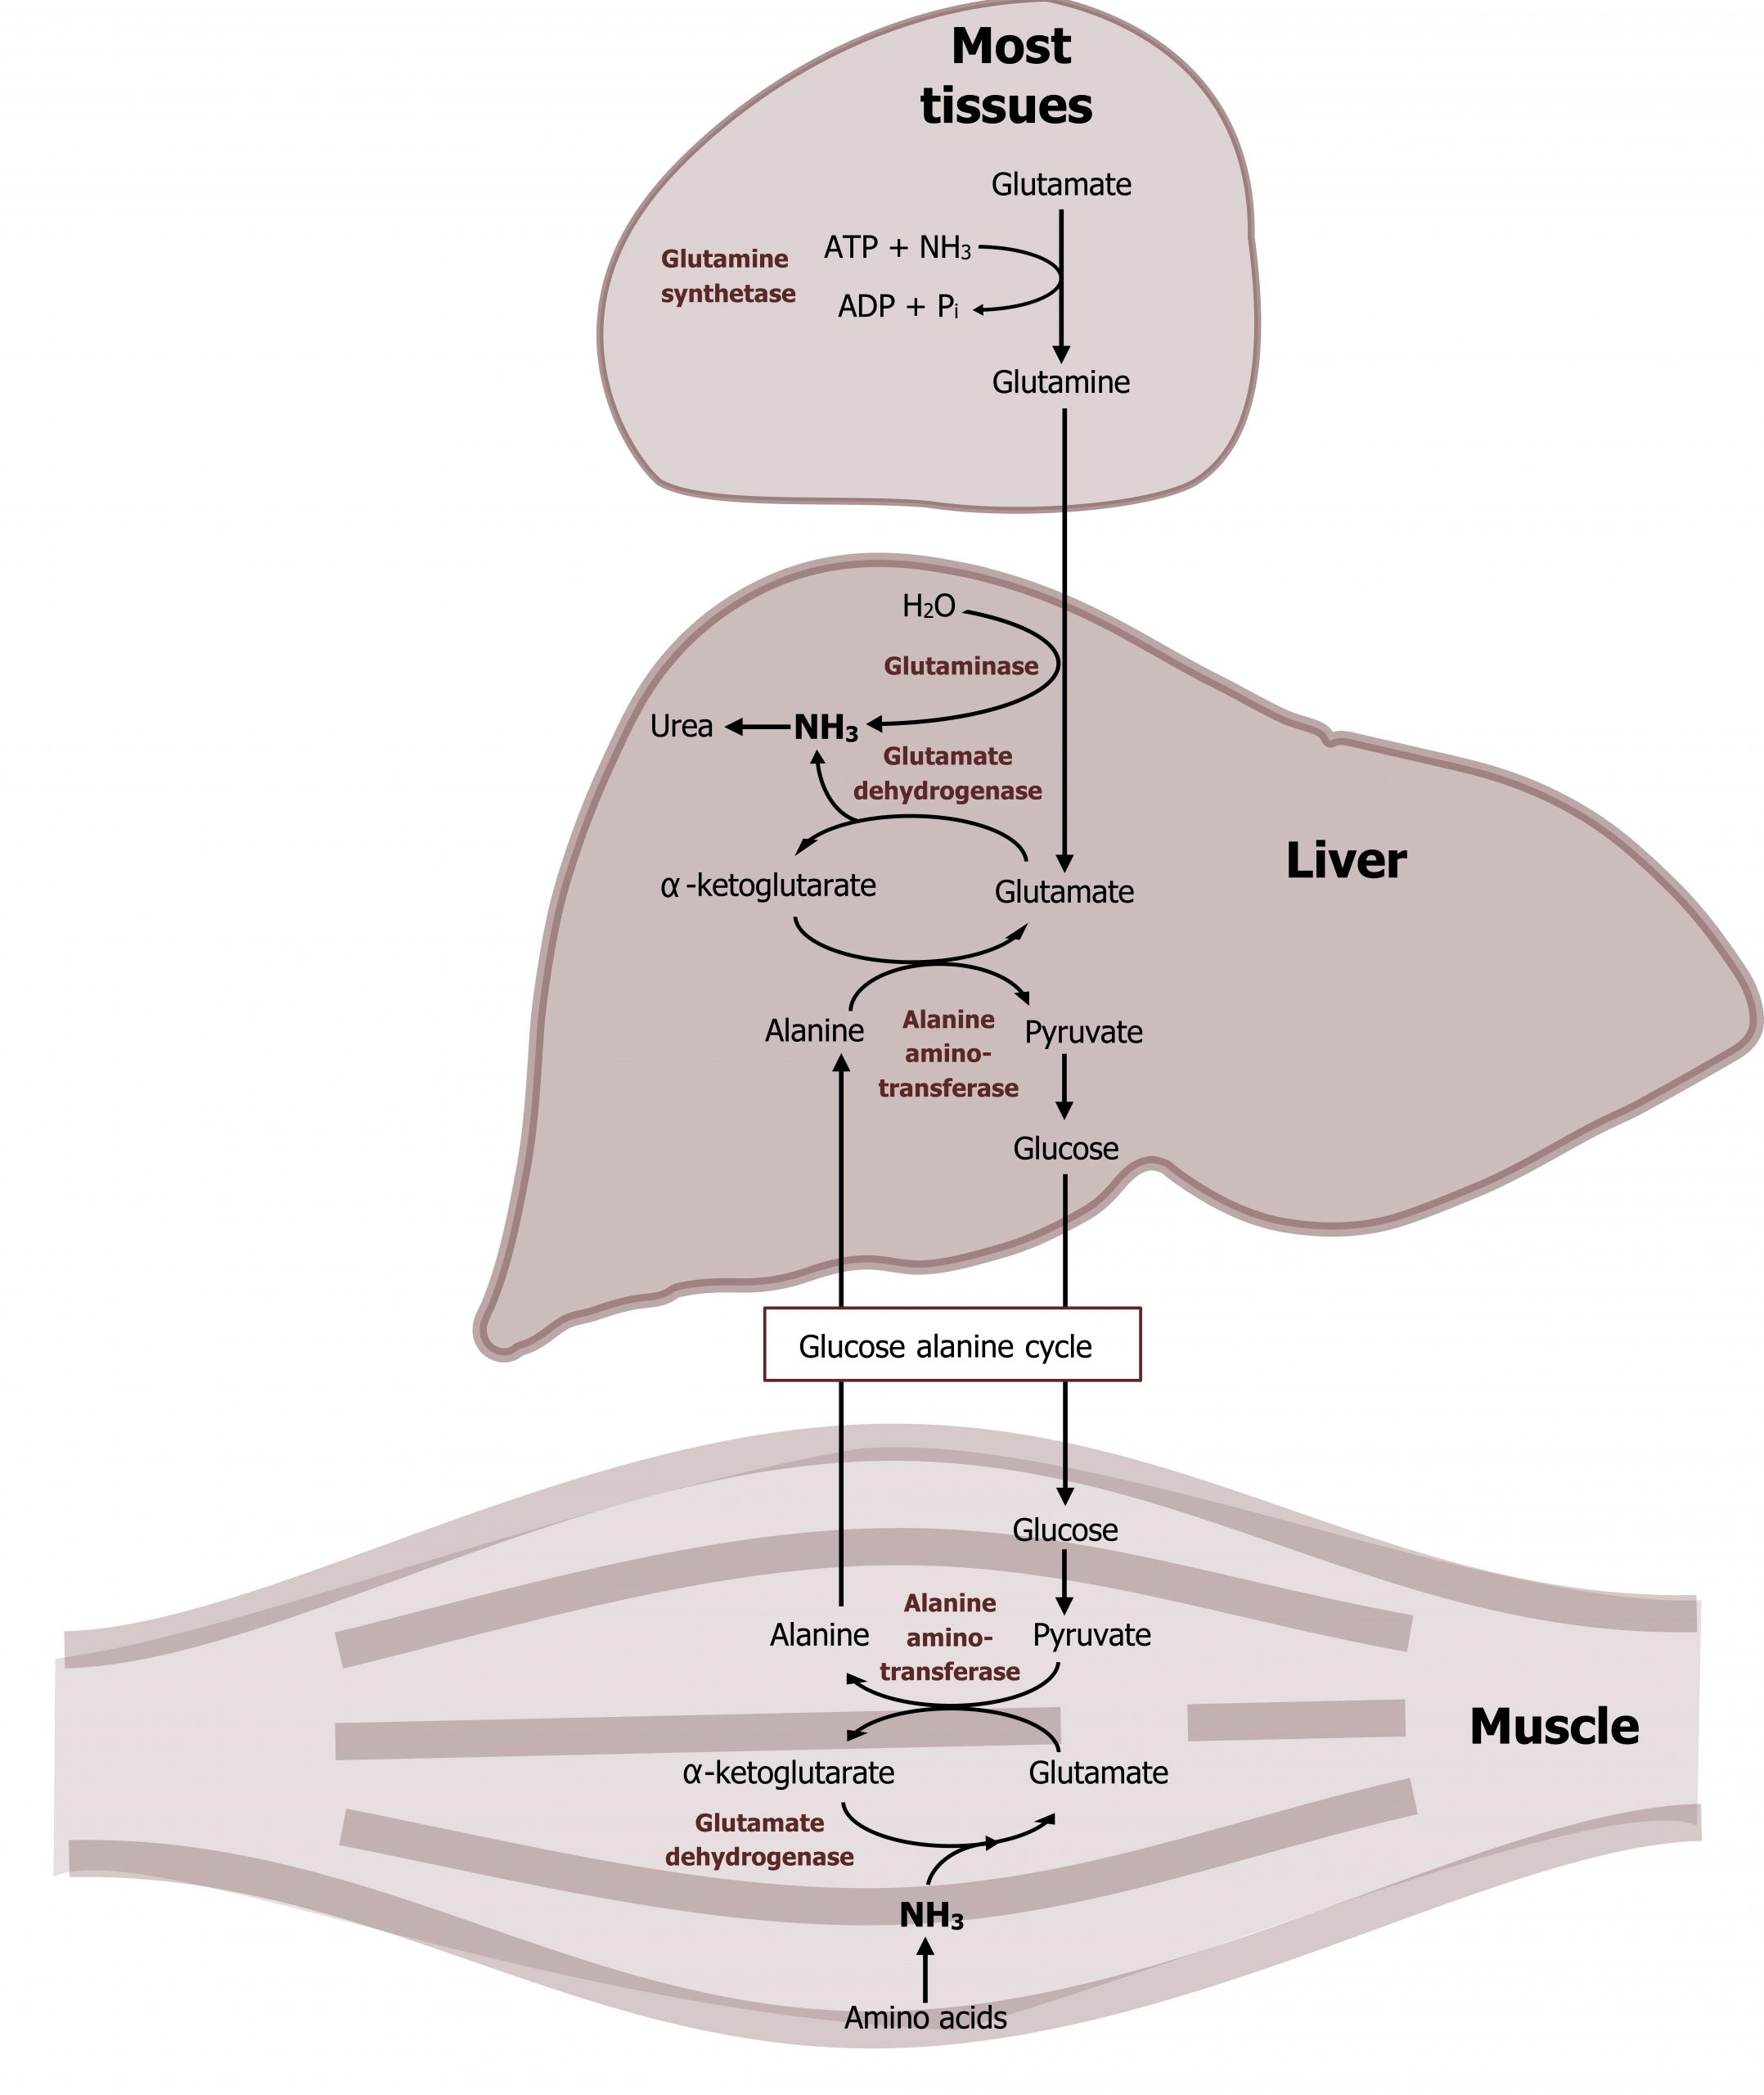
In skeletal muscle, the alanine-glucose cycle is commonly used for the transport of nitrogen from the skeletal muscle to the liver. In this process, ammonia from amino acid degradation is transaminated to form glutamate. Alanine aminotransferase (AST) will transaminate glutamate with pyruvate to generate alanine (and α-ketoglutarate). The alanine is released and transported to the liver where it will undergo another transamination to generate pyruvate, which is used as a substrate for glucose production (gluconeogenesis). The glucose is released from the liver and oxidized by the skeletal muscle.
The other key enzyme in nitrogen metabolism is glutaminase. Glutaminase, is active in the liver and responsible for deaminating glutamine as it is shuttled into the liver. The free ammonia can enter into the urea cycle, and the remaining glutamate can be transaminated to generate α-ketoglutarate. This is in contrast to glutamine synthetase, which is primarily used by peripheral tissues as a means of generating glutamine to remove ammonia from the tissues to the liver (figure 5.14). Nitrogen metabolism, unlike glucose metabolism, is fairly consistent in the fed and fasted states. Excess dietary amino acids, which are not stored, will also require deamination, and the carbons can be stored as either glycogen or fat.
Urea cycle
Ammonia freed in the liver by glutaminase (or glutamate dehydrogenase) will readily enter the urea cycle to be incorporated into urea. A functioning urea cycle is essential for the disposal of nitrogen from catabolic processes, and if dysfunction occurs the accumulation of ammonia can be life threatening.
The urea cycle occurs in the liver and spans both the mitochondria and the cytosolic compartments. The initial free ammonia diffuses through the mitochondrial membrane and is fixed with carbon dioxide (in the form of bicarbonate) during the initial step in this process (figures 5.15 and 5.16). It is important to remember that the synthesis of urea is an anabolic process that requires ATP. Therefore deficiencies in ATP production can inhibit nitrogen disposal as well.
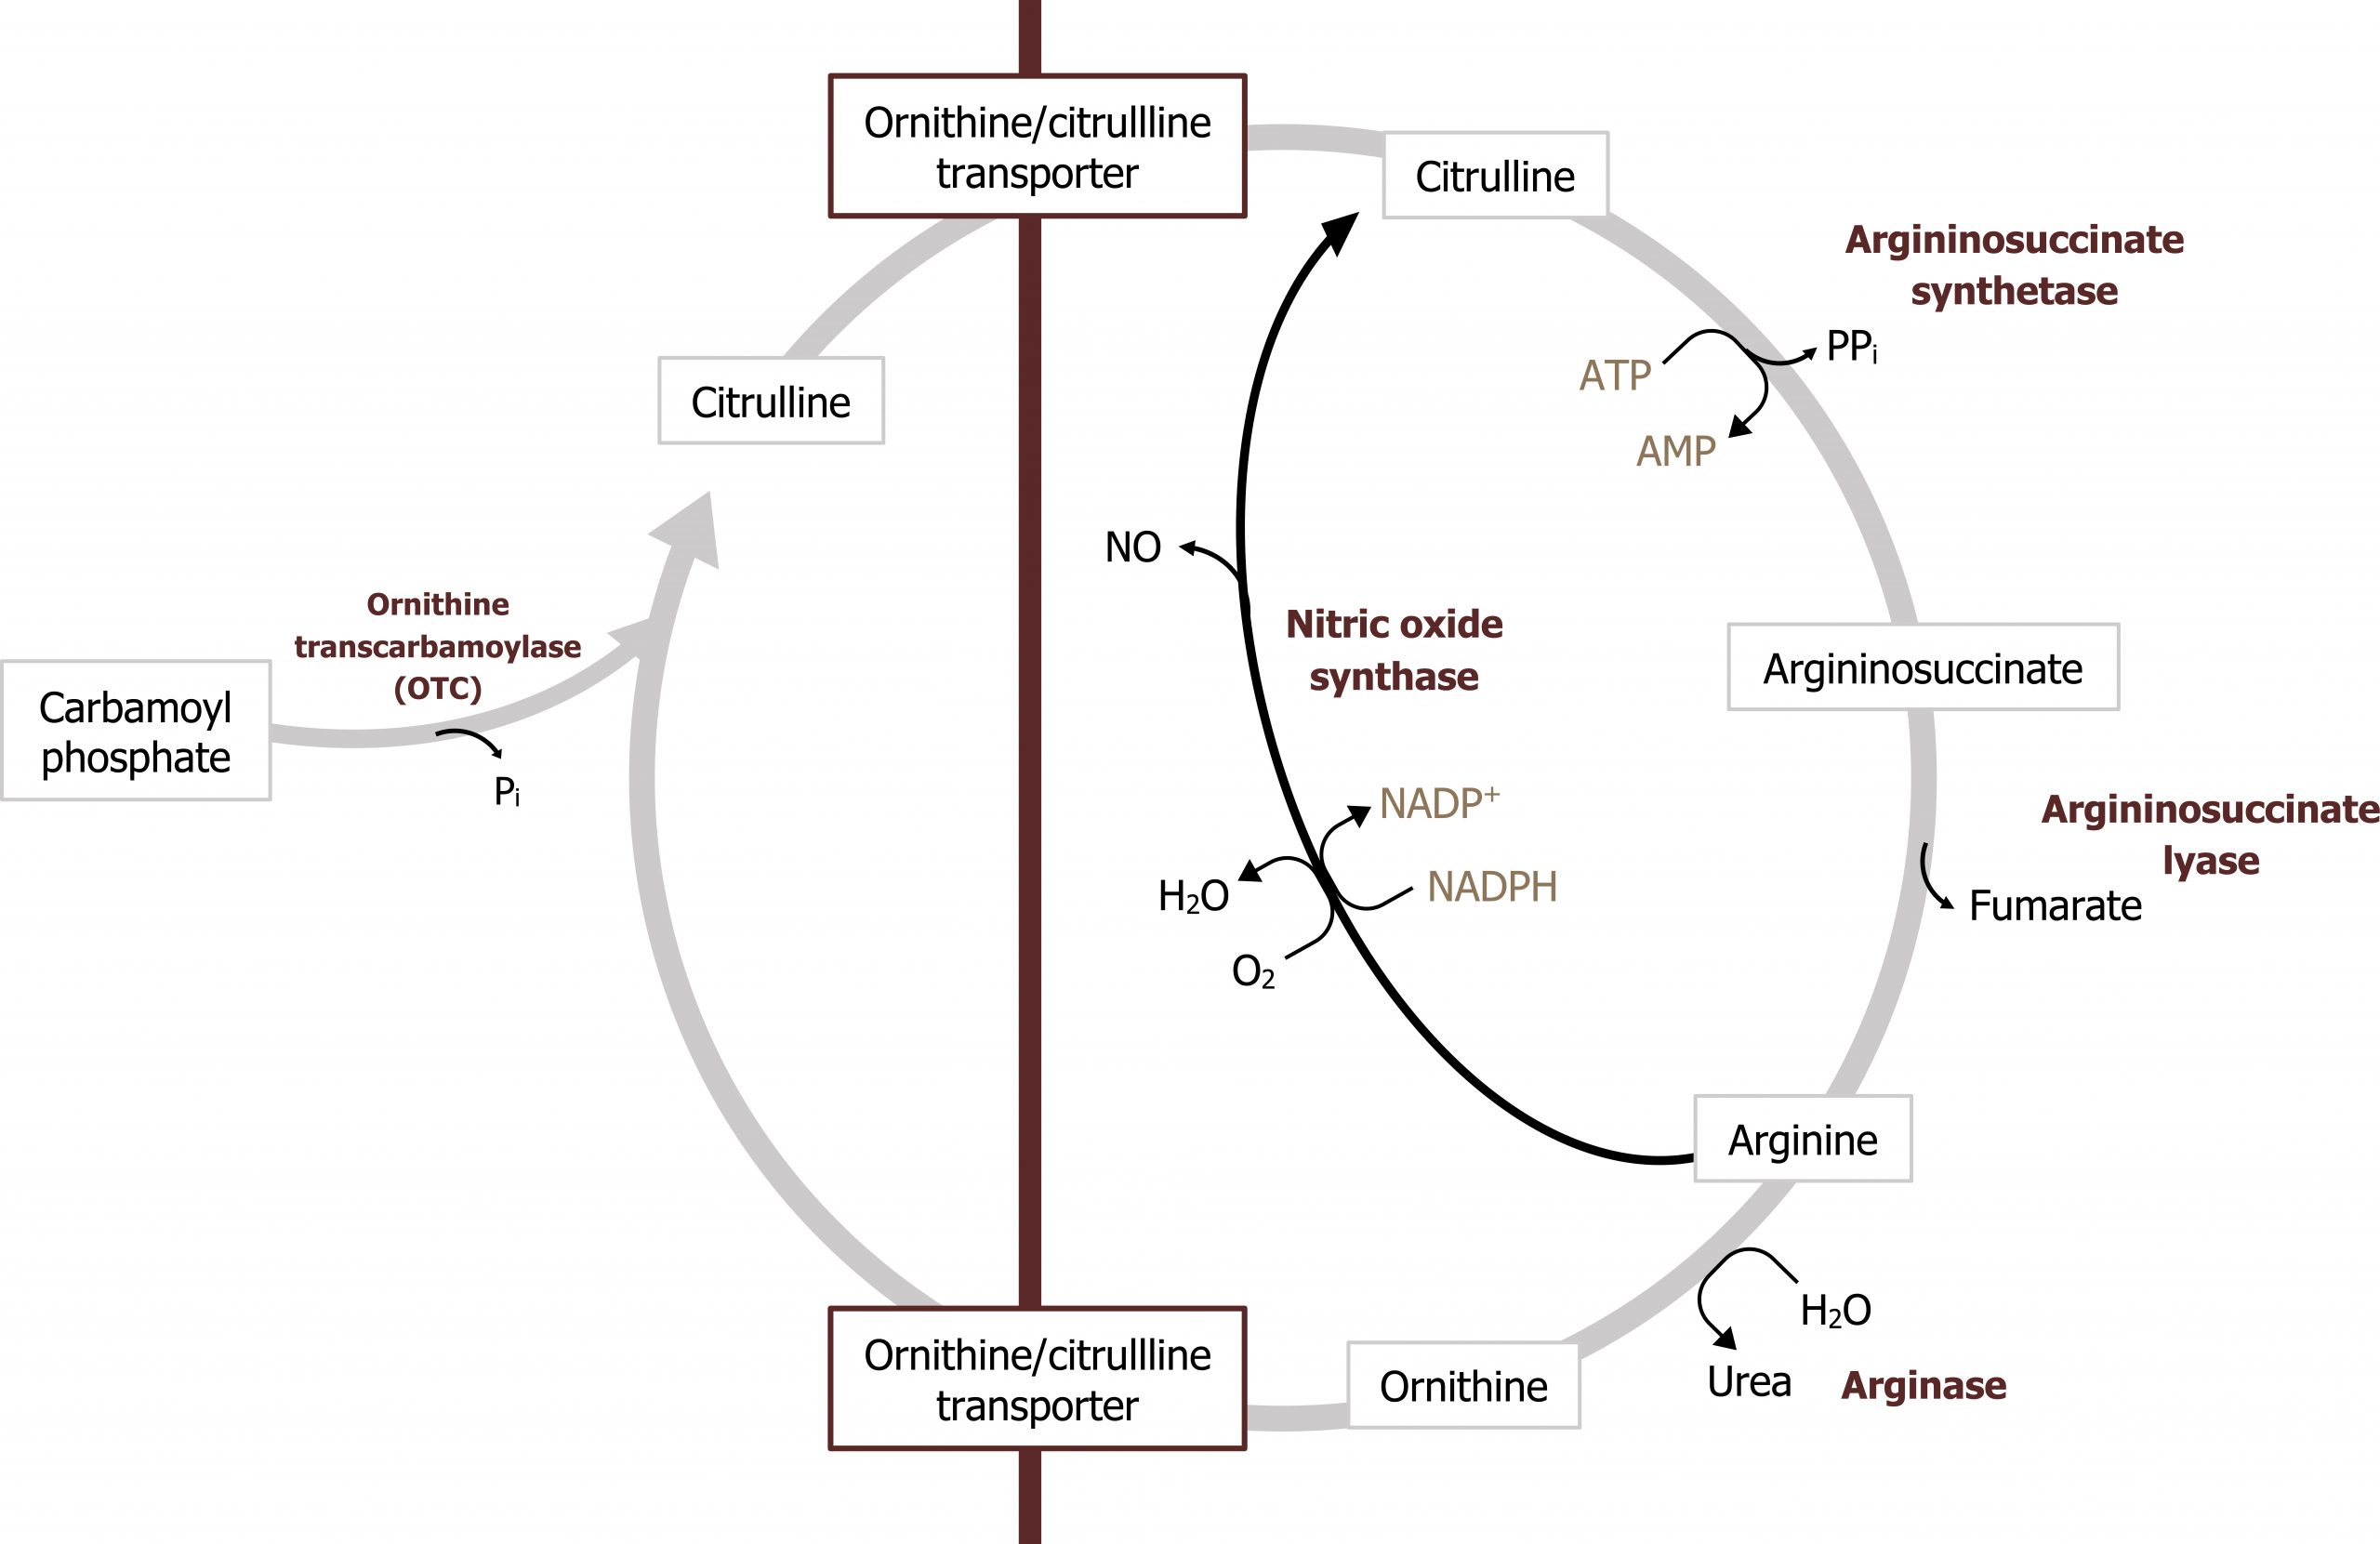
The product of this pathway, urea, is made of two nitrogenous groups with the first coming from the free ammonia released by glutaminase. The second nitrogen is added later in the cycle by aspartate (figures 5.16 and 5.17).
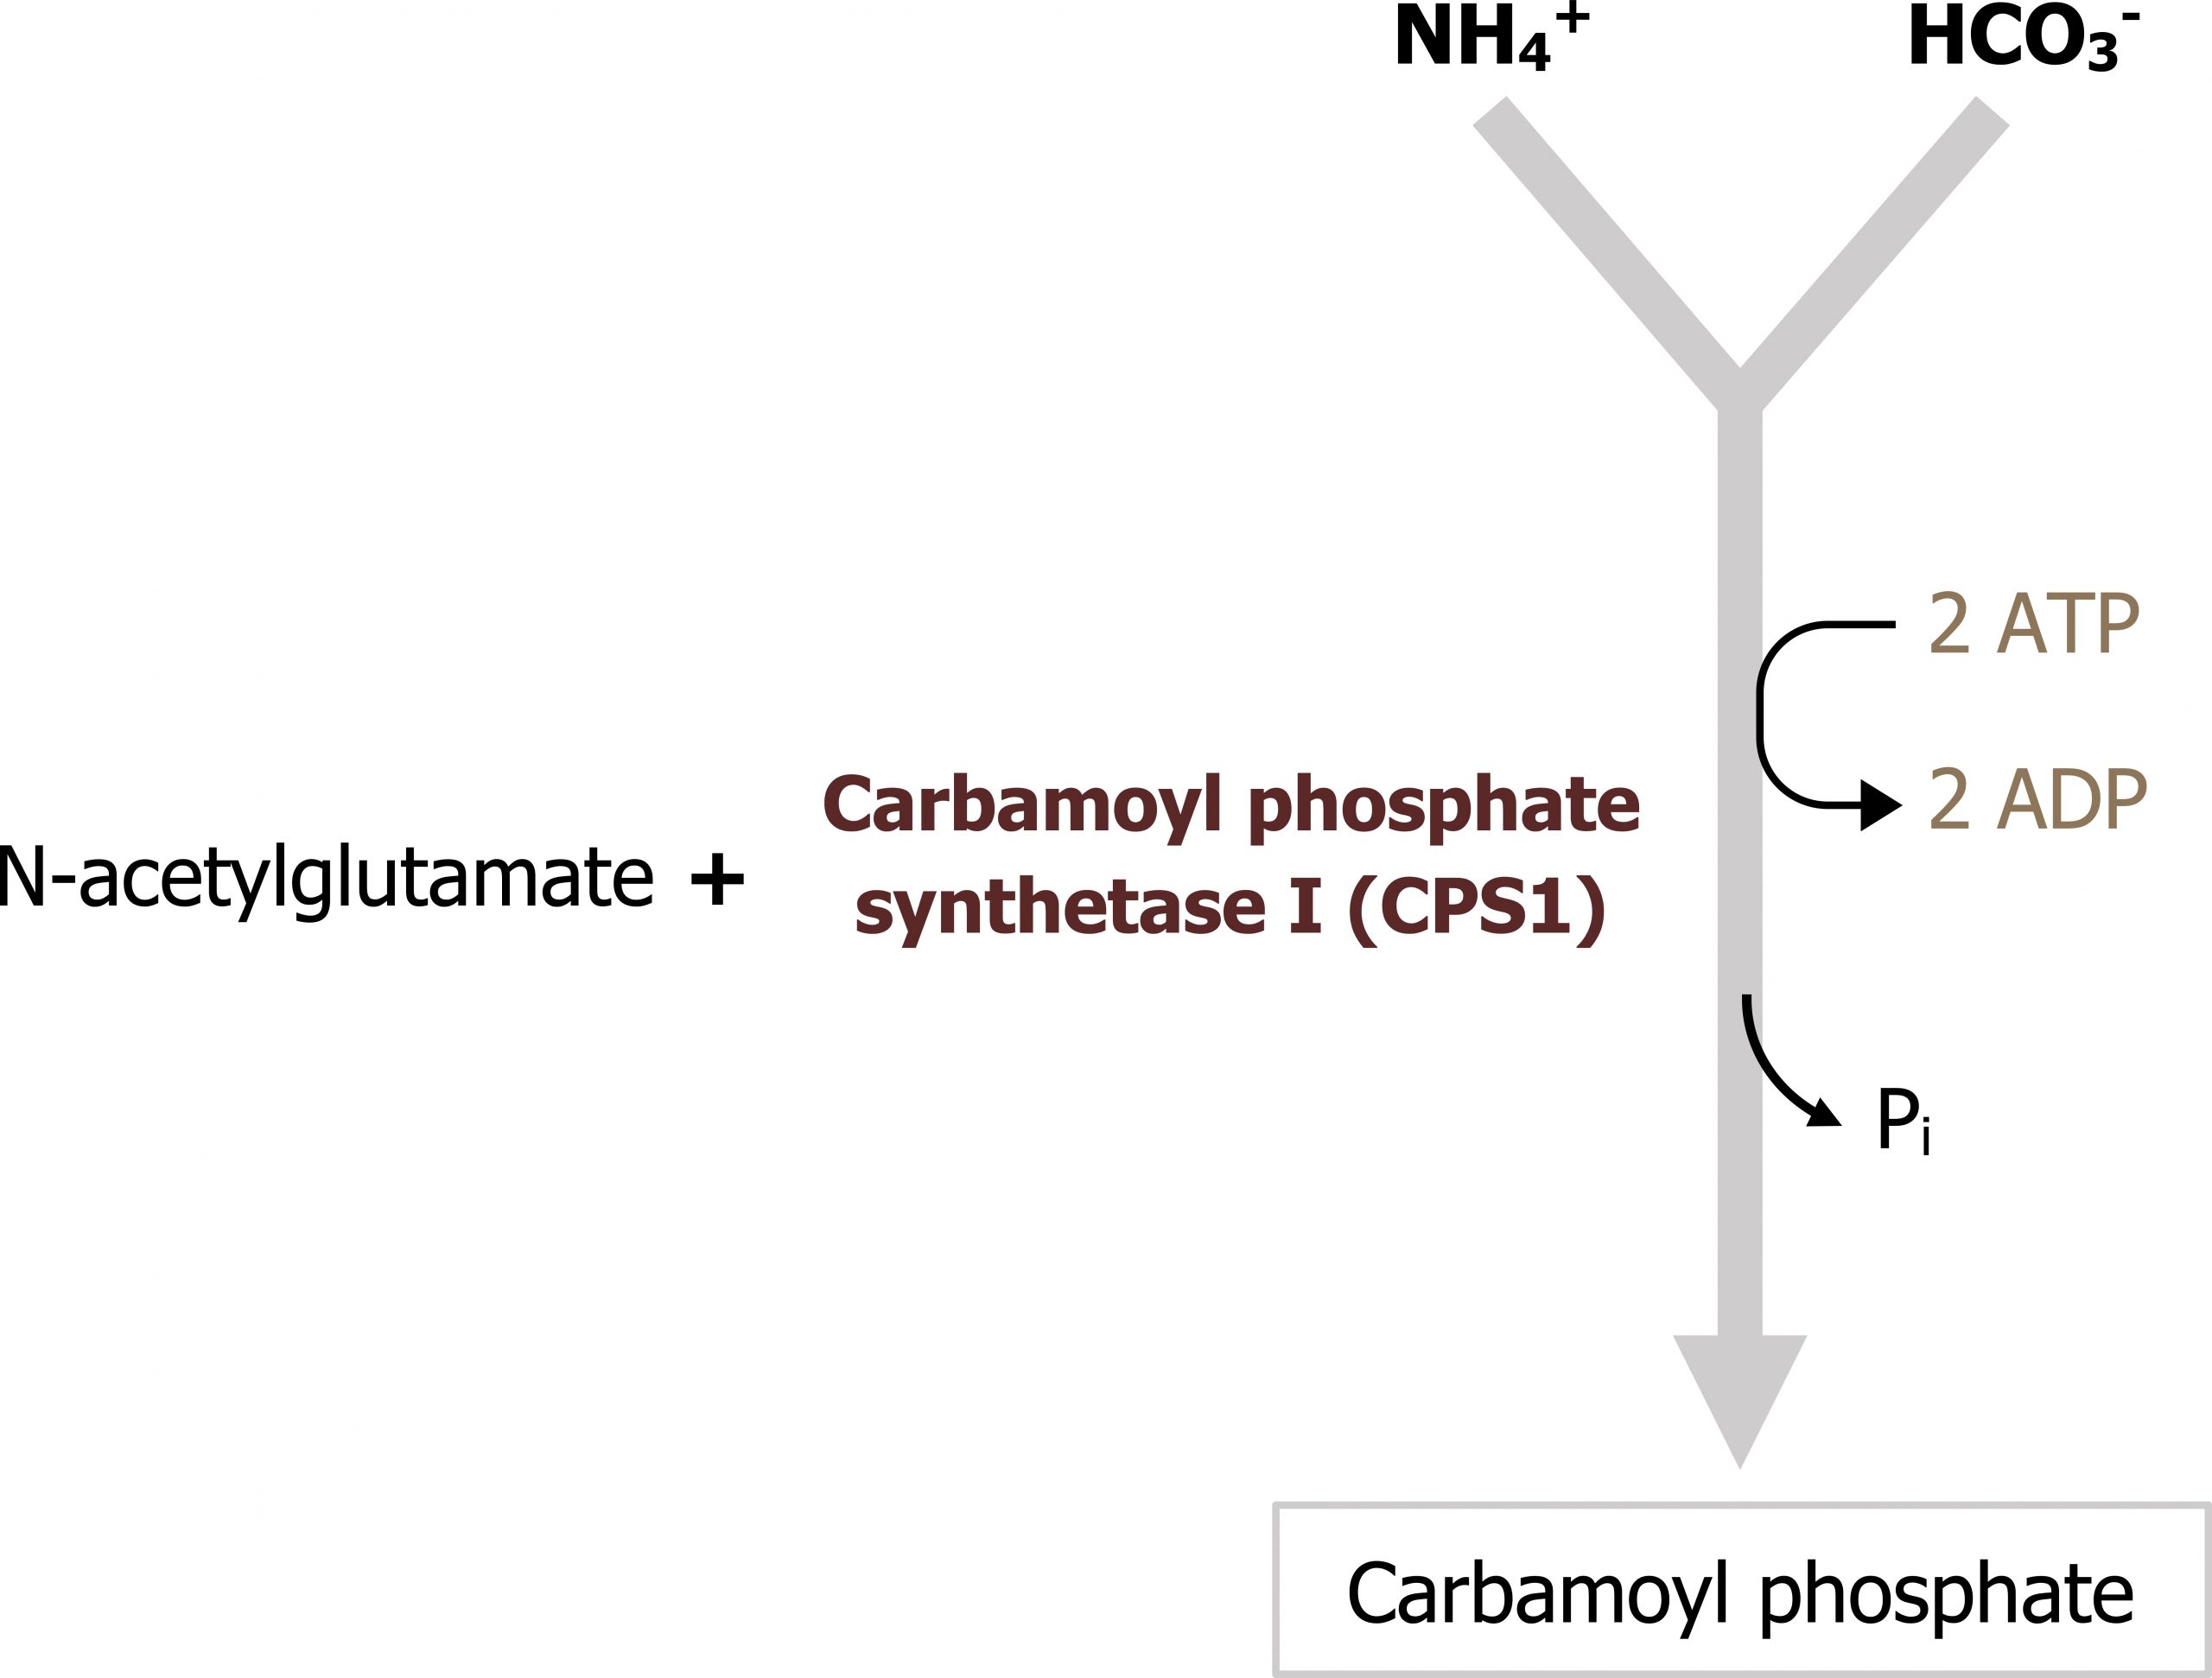
Regulation of the urea cycle
This pathway is predominantly regulated at one key enzyme, carbamoyl phosphate synthetase 1 (figure 5.16). This enzyme requires N-acetylglutamate (NAGS) as an allosteric activator. The synthesis of NAGS is enhanced by arginine, which is an intermediate of the urea cycle. Therefore the cycle provides positive feedback on itself. As flux through the urea cycle increases, and synthesis of arginine increases, this will enhance NAGS production and increase synthesis of carbamoyl phosphate.
Unlike the other pathways discussed, the urea cycle functions independent of hormonal control as it functions to dispose of nitrogen either from excess dietary sources or from protein catabolism/turnover. In the fasted state this is especially important as the carbon skeletons produced are required as substrates for gluconeogenesis (see figure 5.3). In the fed state, amino acids can be deaminated and contribute to the carbon pool (see figures 4.12 and 4.13).
In summary, the process of nitrogen movement from the peripheral tissues to the liver is essential. It involves transamination reactions to produce alanine, and the synthesis of glutamine (by glutamine synthetase) to generate two nontoxic carriers of ammonia. Once transported to the liver, again, transamination coupled with the reactions of glutaminase and glutamate dehydrogenase will allow for ammonia to be freed and enter into the urea cycle.
Summary of pathway regulation
| Metabolic pathway | Major regulatory enzyme(s) | Allosteric effectors | Hormonal effects |
|---|---|---|---|
| Urea cycle | CPS I | N-acetylglutamate (+) |
Table 5.3: Summary of pathway regulation.
5.3 References and resources
Text
Ferrier, D. R., ed. Lippincott Illustrated Reviews: Biochemistry, 7th ed. Philadelphia: Wolters Kluwer Health/Lippincott Williams & Wilkins, 2017, Chapter 10: Gluconeogenesis: Section II, III, IV, Chapter 11: Glycogen Metabolism: Section V, VI, Chapter 16: Fatty Acid Ketone Body and TAG Metabolism: Section III, IV, V, Chapter 19: Removal of Nitrogen from Amino Acids: Section V, VI, Chapter 23: Metabolic Effect of Insulin and Glucagon, Chapter 25: Diabetes Mellitus.
Le, T., and V. Bhushan. First Aid for the USMLE Step 1, 29th ed. New York: McGraw Hill Education, 2018, 78, 82, 86, 89–90.
Lieberman, M., and A. Peet, eds. Marks’ Basic Medical Biochemistry: A Clinical Approach, 5th ed. Philadelphia: Wolters Kluwer Health/Lippincott Williams & Wilkins, 2018, Chapter 3: The Fasted State, Chapter 19: Basic Concepts in Regulation, Chapter 24: Oxidative Phosphorylation and the ETC, Chapter 26: Formation of Glycogen, Chapter 28: Gluconeogenesis, Chapter 30: Oxidation of Fatty Acids, Chapter 34: Integration of Carbohydrate and Lipid Metabolism, Chapter 36: Fate of Amino Acids Nitrogen: Urea Cycle.
Figures
Grey, Kindred, Figure 5.12. Figure 5.12: Transamination reaction. 2021. CC BY 4.0. Added Liver by Liam Mitchell from the Noun Project and Muscle by Laymik from the Noun Project.
Grey, Kindred, Figure 5.13 Reactions catalyzed by glutamate dehydrogenase, glutaminase and glutamine synthetase. 2021. https://archive.org/details/5.11_20210924. CC BY 4.0.
Grey, Kindred, Figure 5.14 Movement of ammonia from peripheral tissues to the liver. 2021. https://archive.org/details/5.12_20210924. CC BY 4.0.
Grey, Kindred, Figure 5.15 Overview of the urea cycle, the pathway spans both the mitochondria and cytosol. 2021. https://archive.org/details/5.13_20210924. CC BY 4.0.
Grey, Kindred, Figure 5.16 Key regulatory step in the urea cycle. CPS1 is activated by N-acetyl glutamate. 2021. https://archive.org/details/5.14_20210924. CC BY 4.0.
Grey, Kindred, Figure 5.17 Entry of the second nitrogen into the urea cycle; aspartate donates the second nitrogen for the synthesis of urea. 2021. https://archive.org/details/5.15_20210924. CC BY 4.0.
