4 Fuel for Now
Learning Objectives
Glycolysis and the pyruvate dehydrogenase complex
- Compare the Kms of glucokinase and hexokinase and relate this activity to their tissue specific activity.
- Determine flux through glycolysis based on the regulation of phosphofructokinase 1 and 2 (PFK1 / PFK2), pyruvate kinase (PK), and the pyruvate dehydrogenase complex.
- Describe the regulation and necessary cofactors of the pyruvate dehydrogenase complex (PDC).
Tricarboxylic acid cycle (TCA) and electron transport chain (ETC)
- Describe the impact of the ratio of NADH/NAD+ and ATP/ADP on flux through the tricarboxylic acid cycle (isocitratedehydrogenase and α-ketoglutarate) and the ETC.
- Determine the relevance of the TCA cycle for providing key intermediates to other synthetic pathways (i.e. heme synthesis) and the need to replenish TCA cycle intermediates.
- Evaluate the role of the malate-aspartate shuttle and the glycerol 3-phosphate shuttle in transferring NADH across the mitochondrial membrane.
- Determine the impact of inhibitors and uncouplers on the ETC.
Fatty acid synthesis
- Describe fatty acid synthesis, including the location of the pathway, substrate, and regulation of acetyl-CoA carboxylase.
Glycogen synthesis
- Determine how glycogen synthesis is regulated in the liver and skeletal muscle (key enzyme: glycogen synthase).
About this Chapter
This chapter will focus on the pathways involved fuel usage in the fed state. Under these conditions, insulin is elevated and glucose uptake by most tissues is increased. The increase in fuel availability enhances both ATP production and fuel storage. Whether fuel is oxidized or stored depends on the regulation of various hepatic pathways (glycolysis, tricarboxyilc acid cycle (TCA), electron transport chain (ETC), fatty acid synthesis, and glycogen synthesis), and they all act in concert to maintain metabolic efficiency. The most important part of each of these pathways will be understanding the key regulatory enzymes and how flux can be altered through these regulatory mechanisms.
4.1 Glycolysis and the Pyruvate Dehydrogenase Complex (PDC)
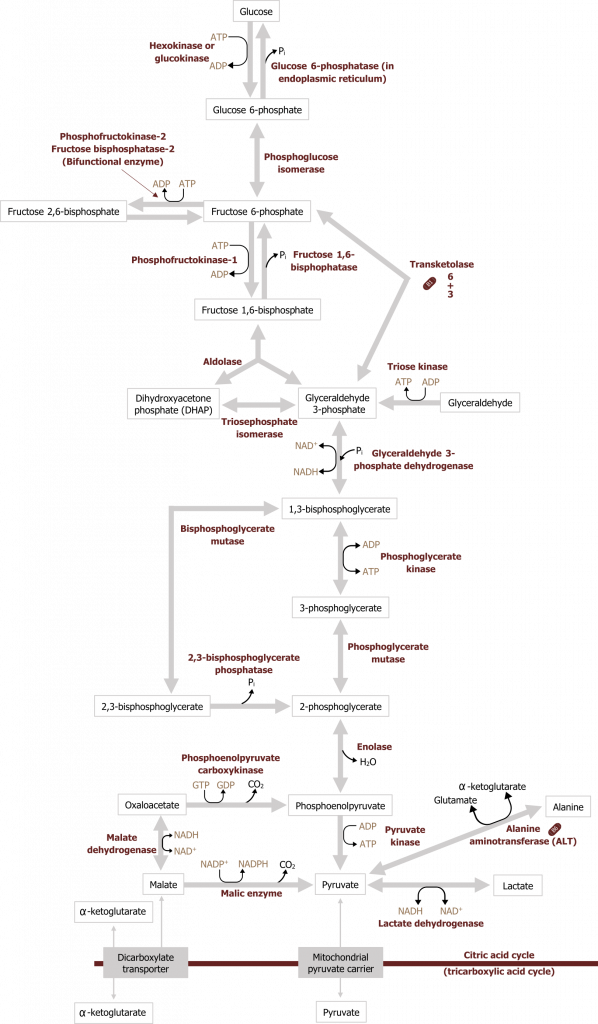
Glycolysis can be divided into two parts, the preparative phase, which requires two ATP, and the energy producing phase, which produces NADH and ATP. The net result of glucose oxidation through glycolysis is two ATP, two NADH and two pyruvate. Briefly, the process of glycolysis starts with the phosphorylation of a glucose molecule (six-carbon sugar). The addition of a phosphate group traps the glucose in the cell where it will undergo isomerization to fructose 6-phosphate and further phosphorylation to fructose 1,6-bisphosphate. From here, fructose 1,6-bisphosphate is cleaved by aldolase B into two three-carbon compounds, which will ultimately produce two pyruvate. Under aerobic conditions, the pyruvate will enter the mitochondria and be oxidized to acetyl-CoA, which will enter the TCA cycle. When oxygen is limited or energy demands exceed oxygen delivery for ATP, the cell will rely on anaerobic glycolysis. In this case, lactate dehydrogenase will oxidize the NADH generated from glycolysis by reducing cytosolic pyruvate to lactate. Under these conditions oxygen is not required to reoxidize NADH, and therefore the process is referred to as anaerobic. The energy produced through this process is much less than through aerobic oxidation and therefore less favorable (figure 4.1).
Regulation of glycolysis
Glycolysis in the liver has three primary regulated and irreversible steps (figure 4.1).
Glucokinase: Glucose to glucose 6-phosphate
In the liver, glucose is taken up through an insulin-independent process mediated by GLUT2 transporters. Following this, glucose must be phosphorylated to be trapped in the cell. The phosphorylation of glucose to glucose 6-phosphate is catalyzed by glucokinase (figure 4.2) in the liver.
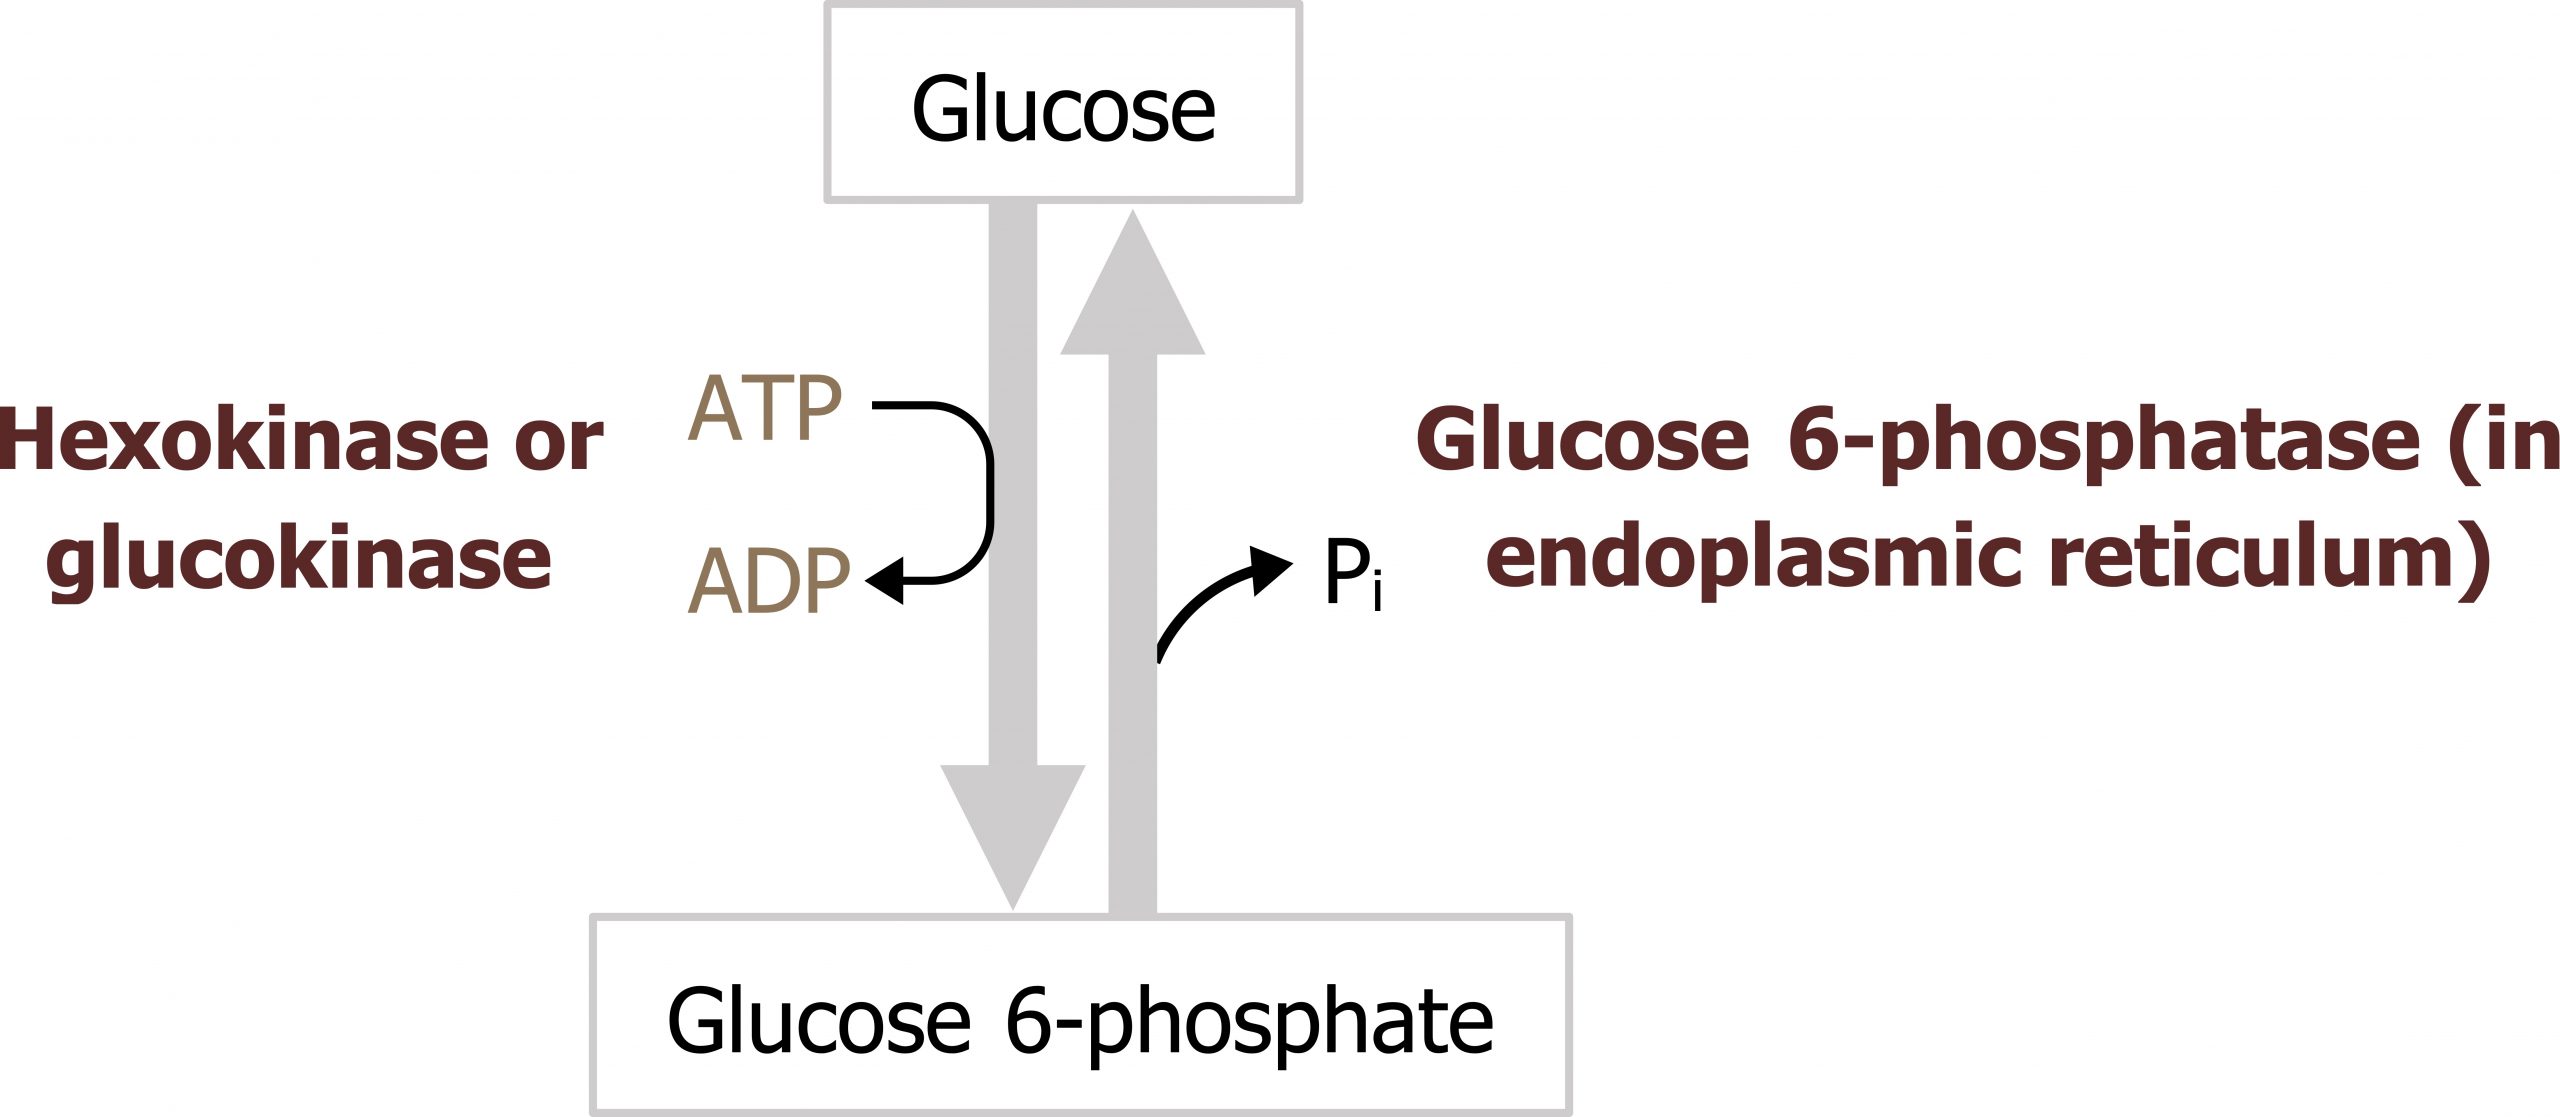
In skeletal muscle, and most other peripheral tissues, glucose is phosphorylated by hexokinase.
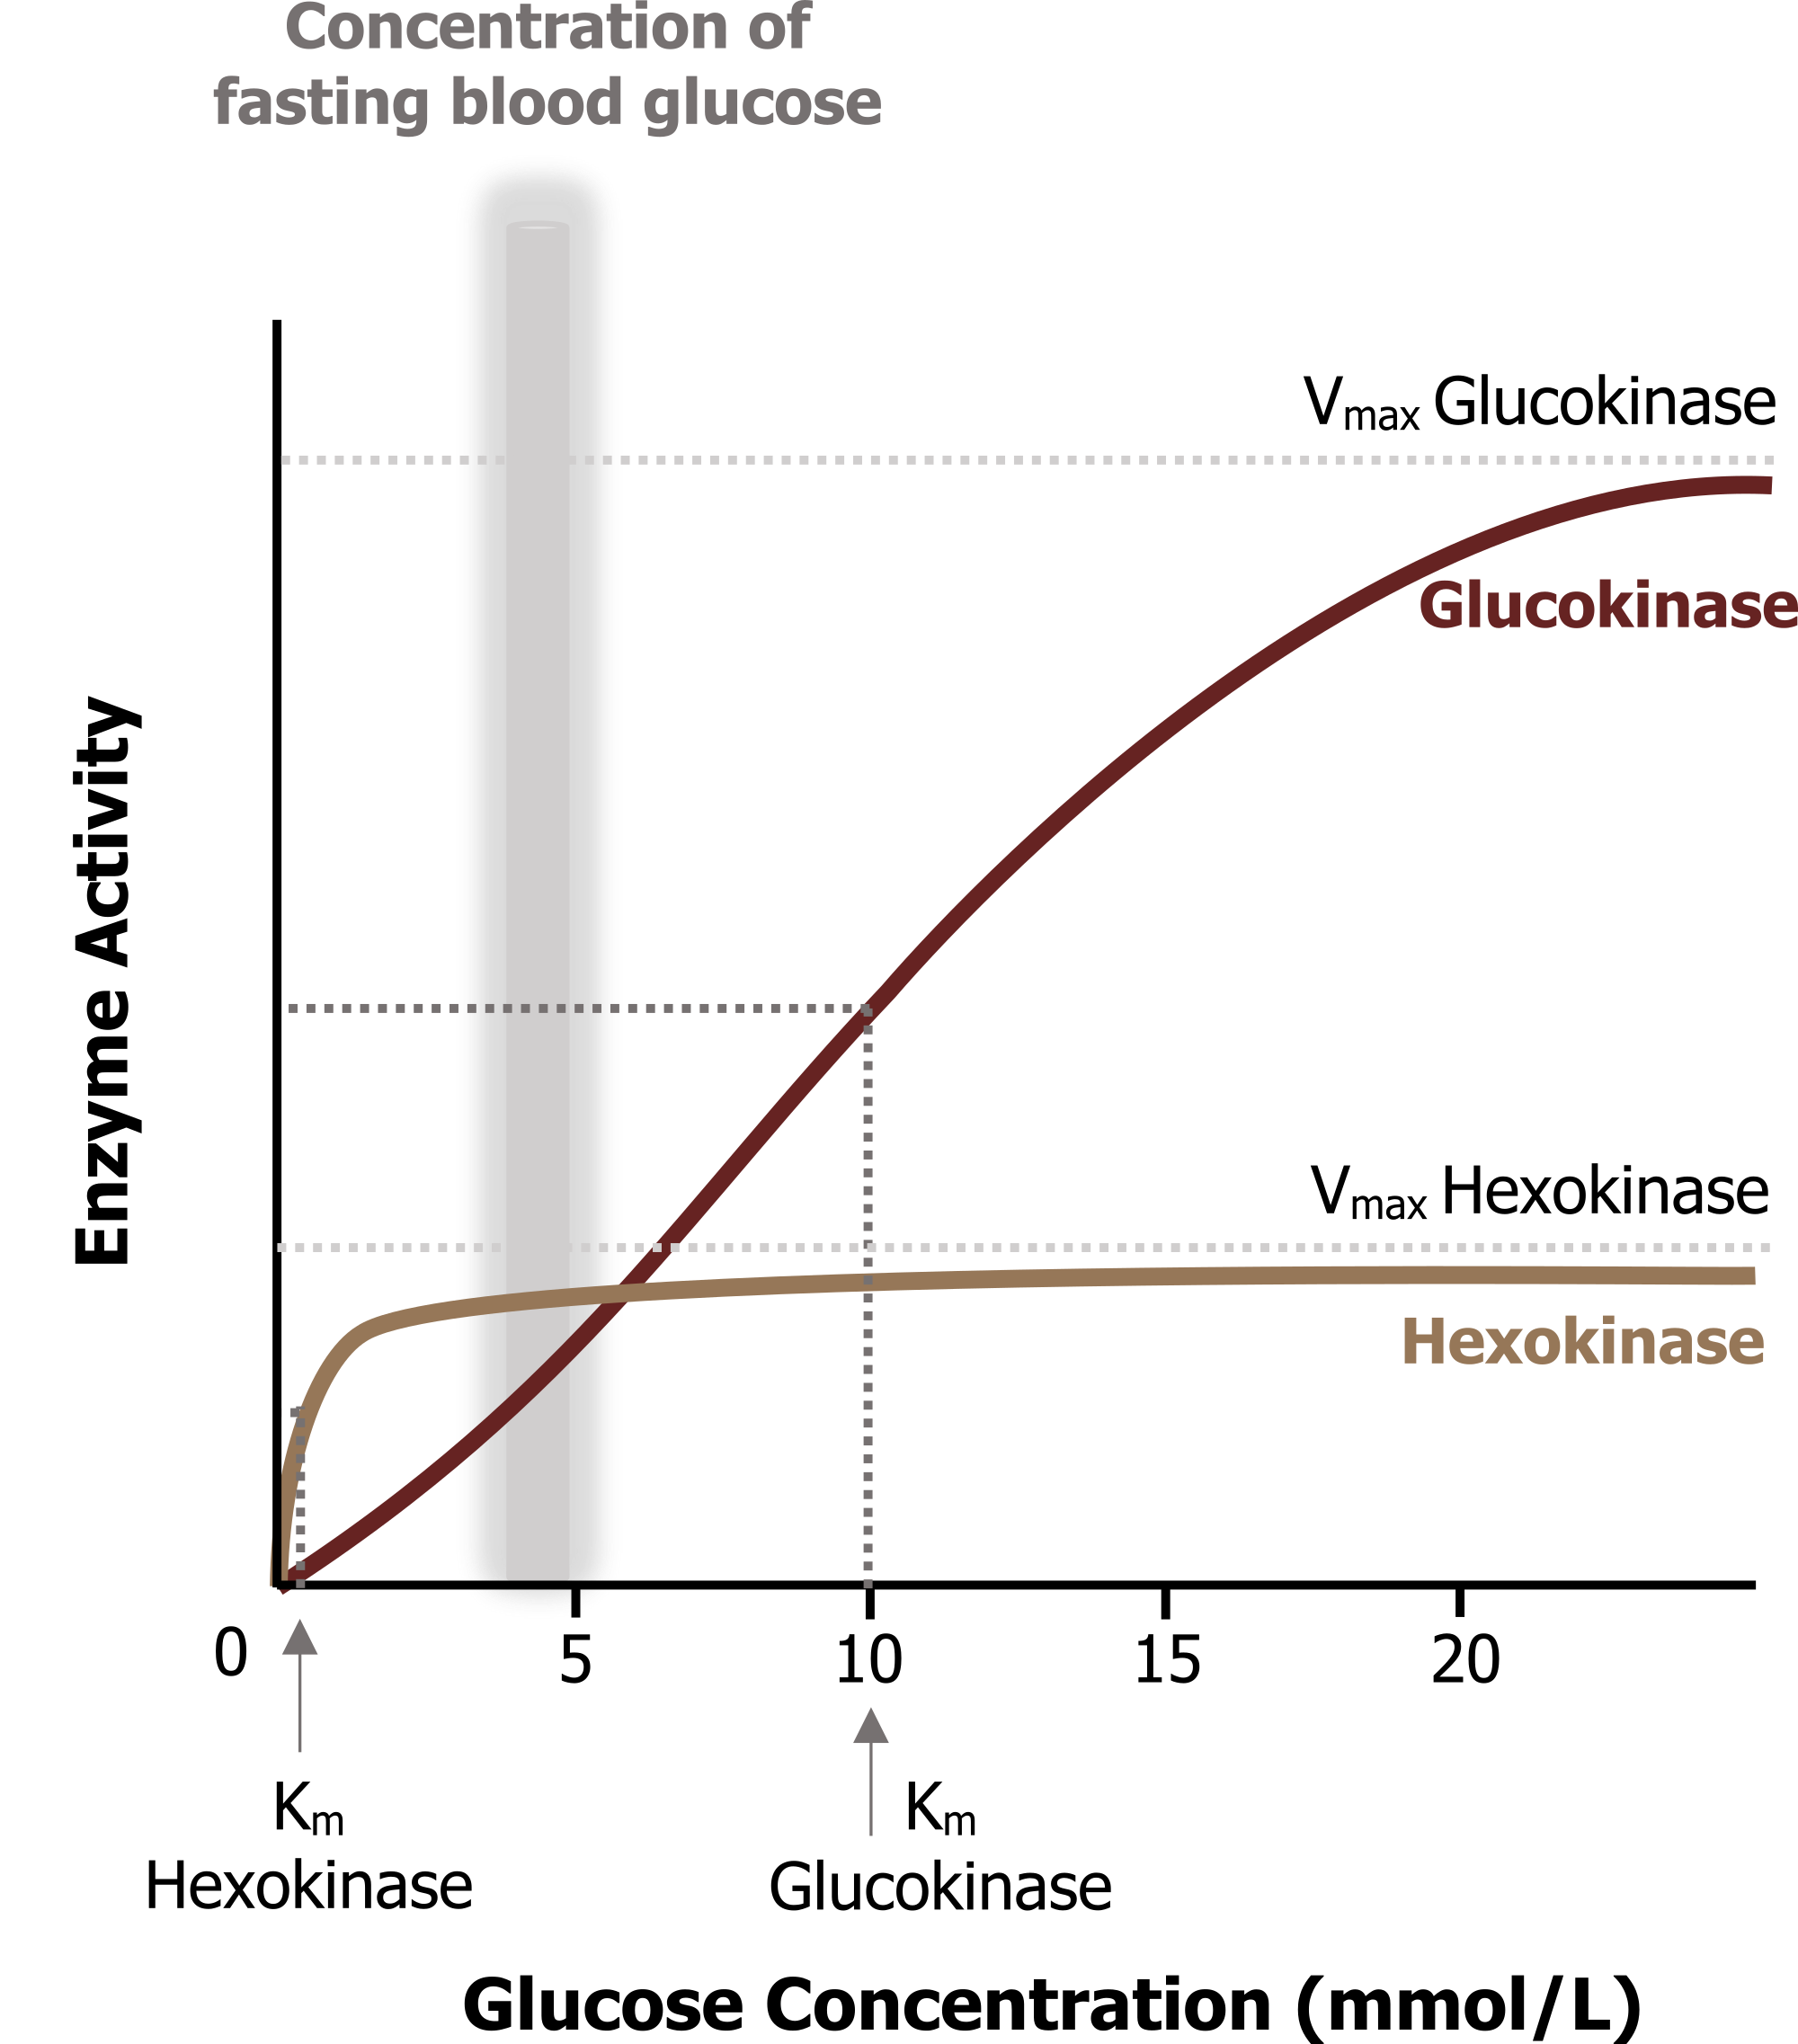
Glucokinase and hexokinase perform the same reaction but have very different enzyme kinetics. Glucokinase (in the liver) has a higher Km (lower affinity for glucose) when compared to hexokinase. In the liver, this enzyme will phosphorylate glucose only when glucose concentrations are high such as in the fed state. Glucokinase also has a high Vmax and is therefore not rapidly saturated. This allows for continuous glucose uptake when glucose levels are high allowing for glucose storage and the rapid removal of glucose from circulation, minimizing the likelihood of hyperglycemia. In contrast, hexokinase has a lower Km and a high affinity for glucose (figure 4.3). This enzyme becomes rapidly saturated over a very small range of glucose concentrations.
Regulation of glucokinase and hexokinase
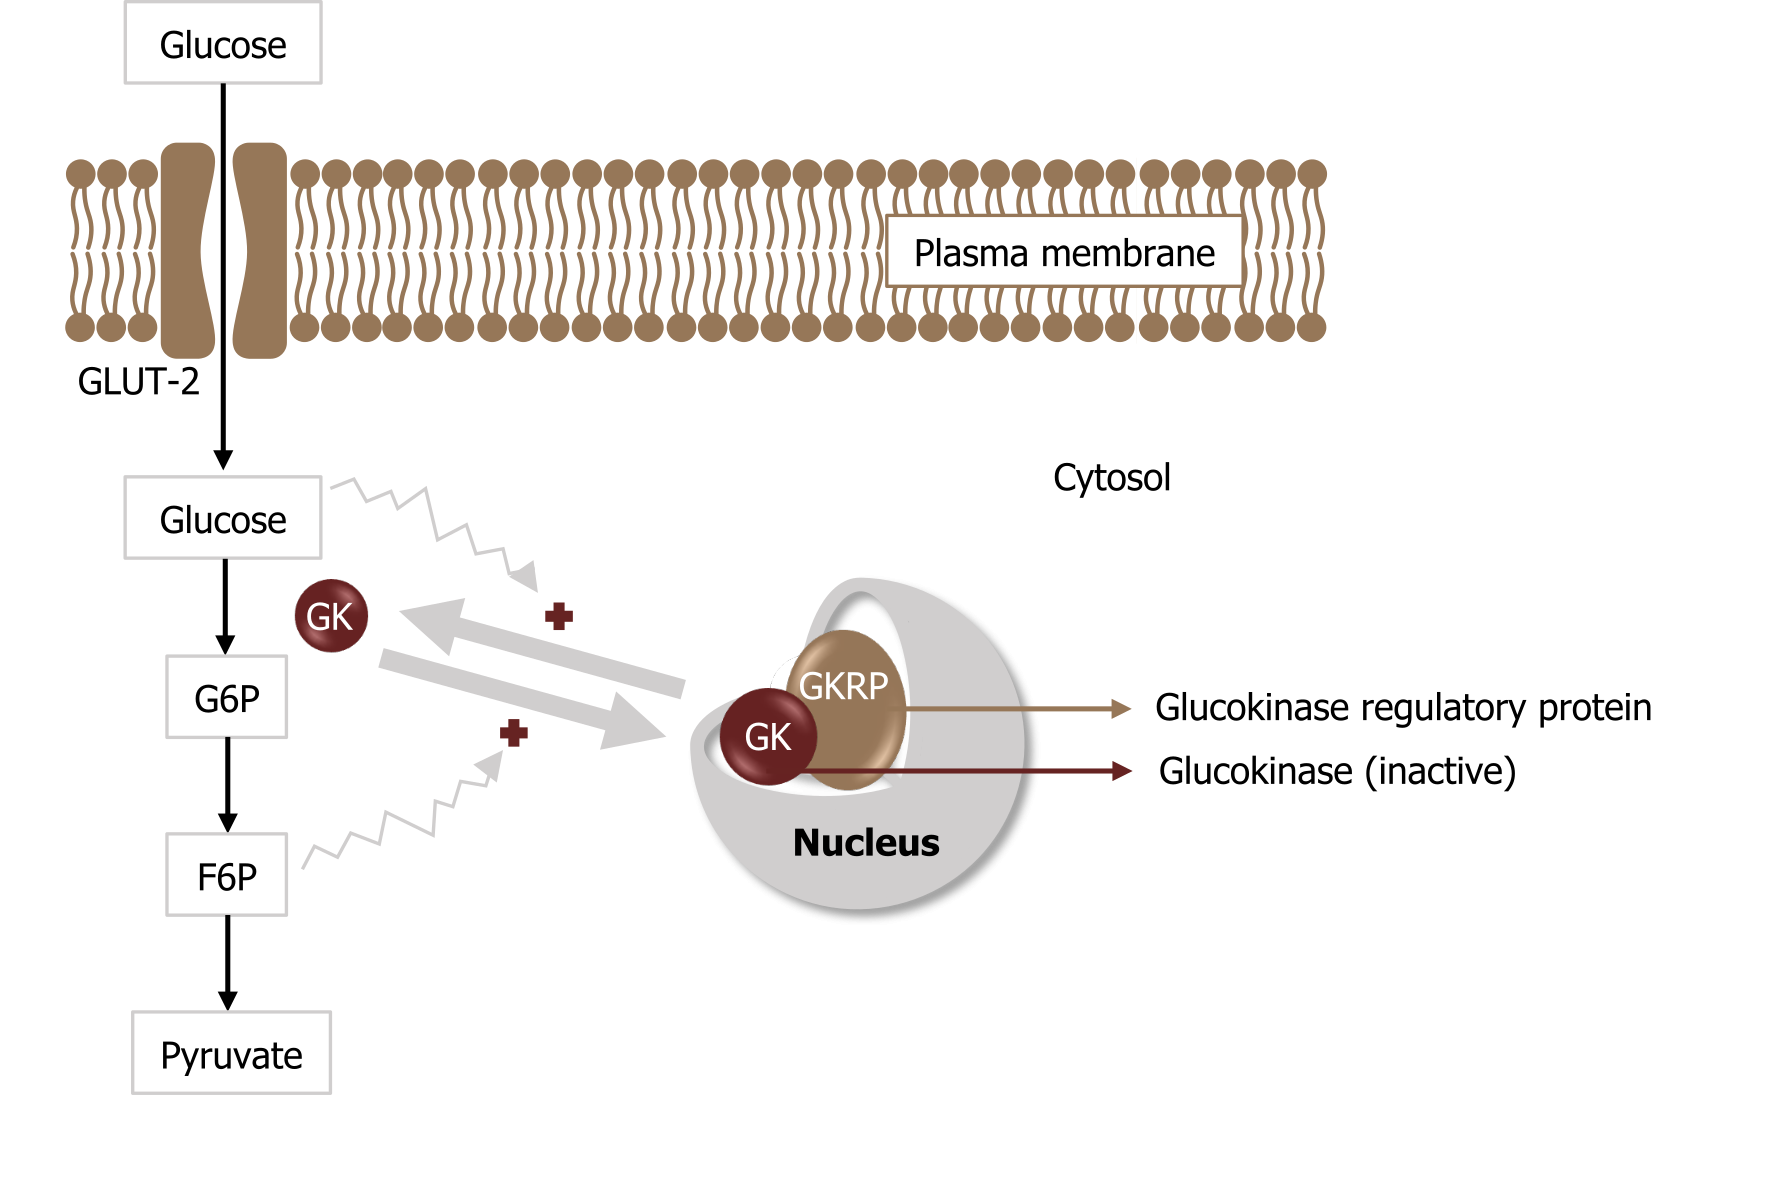
Hexokinase is regulated through feedback inhibition where glucose 6-phosphate will compete with glucose for substrate binding. On the other hand, glucokinase is regulated through an alternative mechanism involving the glucokinase regulatory binding protein (GKRP). This protein will bind glucokinase and trap it in the nucleus. When glucose is high, glucokinase is released into the cytosol to phosphorylate glucose. As fructose 6-phosphate levels increase, this will inhibit the glucokinase reaction by enhancing the rebinding of glucokinase to GKRP, trapping it in the nucleus (figure 4.4).
Phosphofructokinase 1 (PFK1): Fructose 6-phosphate to fructose 1,6-bisphosphate
Following glucose phosphorylation to glucose 6-phosphate, the glucose 6-phosphate can be used for glycogen synthesis or the pentose phosphate pathway. Substrate that continues through glycolysis is isomerized to fructose 6-phosphate, which is the substrate for the reaction catalyzed by phosphofructokinase 1 (PFK1).
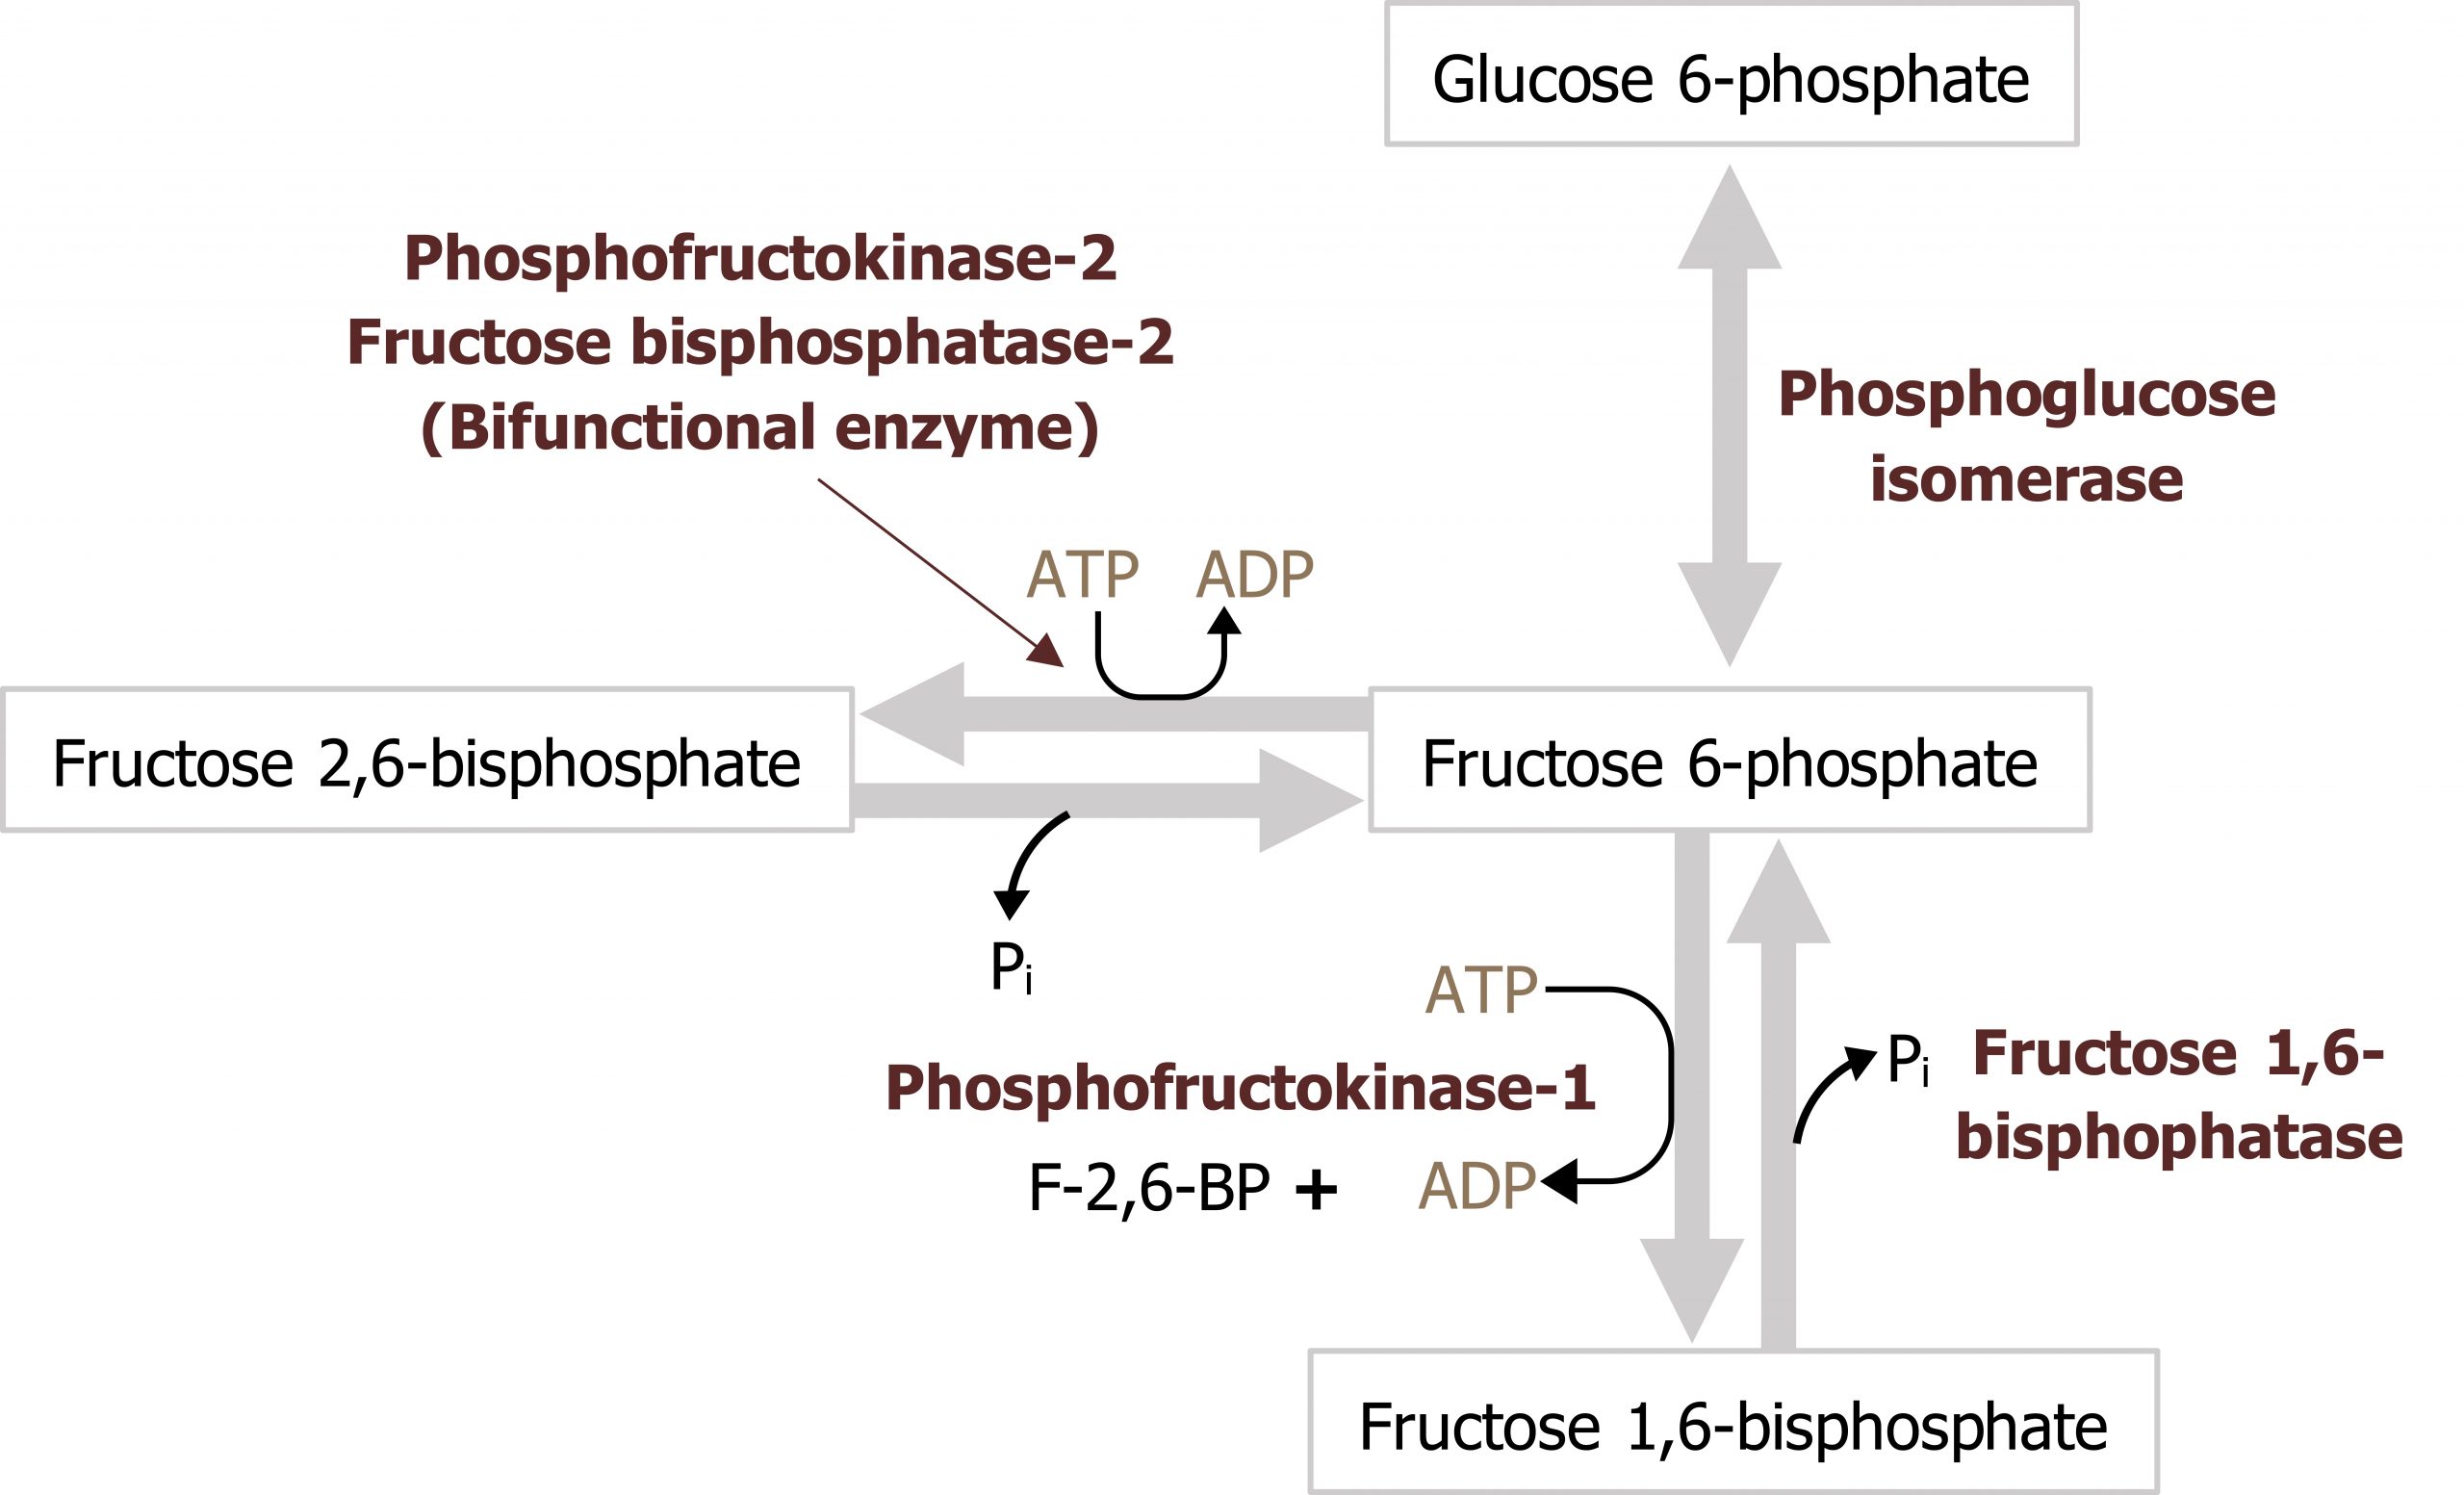
Regulation of phosphofructokinase 1 (PFK1)
Regulation of phosphofructokinase 1 is primarily through allosteric activation by AMP and fructose 2,6-bisphosphate. High AMP levels would indicate a lack of energy within the cell, and this would increase flux through glycolysis by enhancing the activity of PFK1. PFK1 is also inhibited by citrate and ATP; levels of these compounds are indicative of a high energy state, suggesting there are sufficient oxidation productions and glucose is diverted to storage pathways.
Fructose 2,6-bisphosphate is an important regulator of glycolysis, formed by a shunt in the glycolytic pathway. When there is an excess of fructose 6-phosphate in the cell, this substrate is accepted by phosphofructokinase 2 (PFK2) and converted to fructose 2,6-bisphosphate. This compound, fructose 2,6-bisphosphate, functions as an allosteric activator of PFK1. Additionally, PFK2 can be regulated by covalent modification such as phosphorylation. PFK2 is a bifunctional enzyme and only functions as a kinase when insulin is high and it is dephosphorylated. Under fasted conditions, when glucagon is high, this leads to the phosphorylation and inactivation of PFK2; when the enzyme is phosphorylated, it functions as a phosphatase and is referred to as fructose 2,6-bisphosphatase (FBP2) (figure 4.5).
Pyruvate kinase: Phosphoenol pyruvate to pyruvate
Following the synthesis of fructose 1,6-phosphate, aldolase will cleave this substrate into dihydroxyacetone and glyceraldehyde 3-phosphate. These three carbon compounds will be used to synthesize pyruvate in the final regulatory step of the pathway catalyzed by pyruvate kinase (PK).
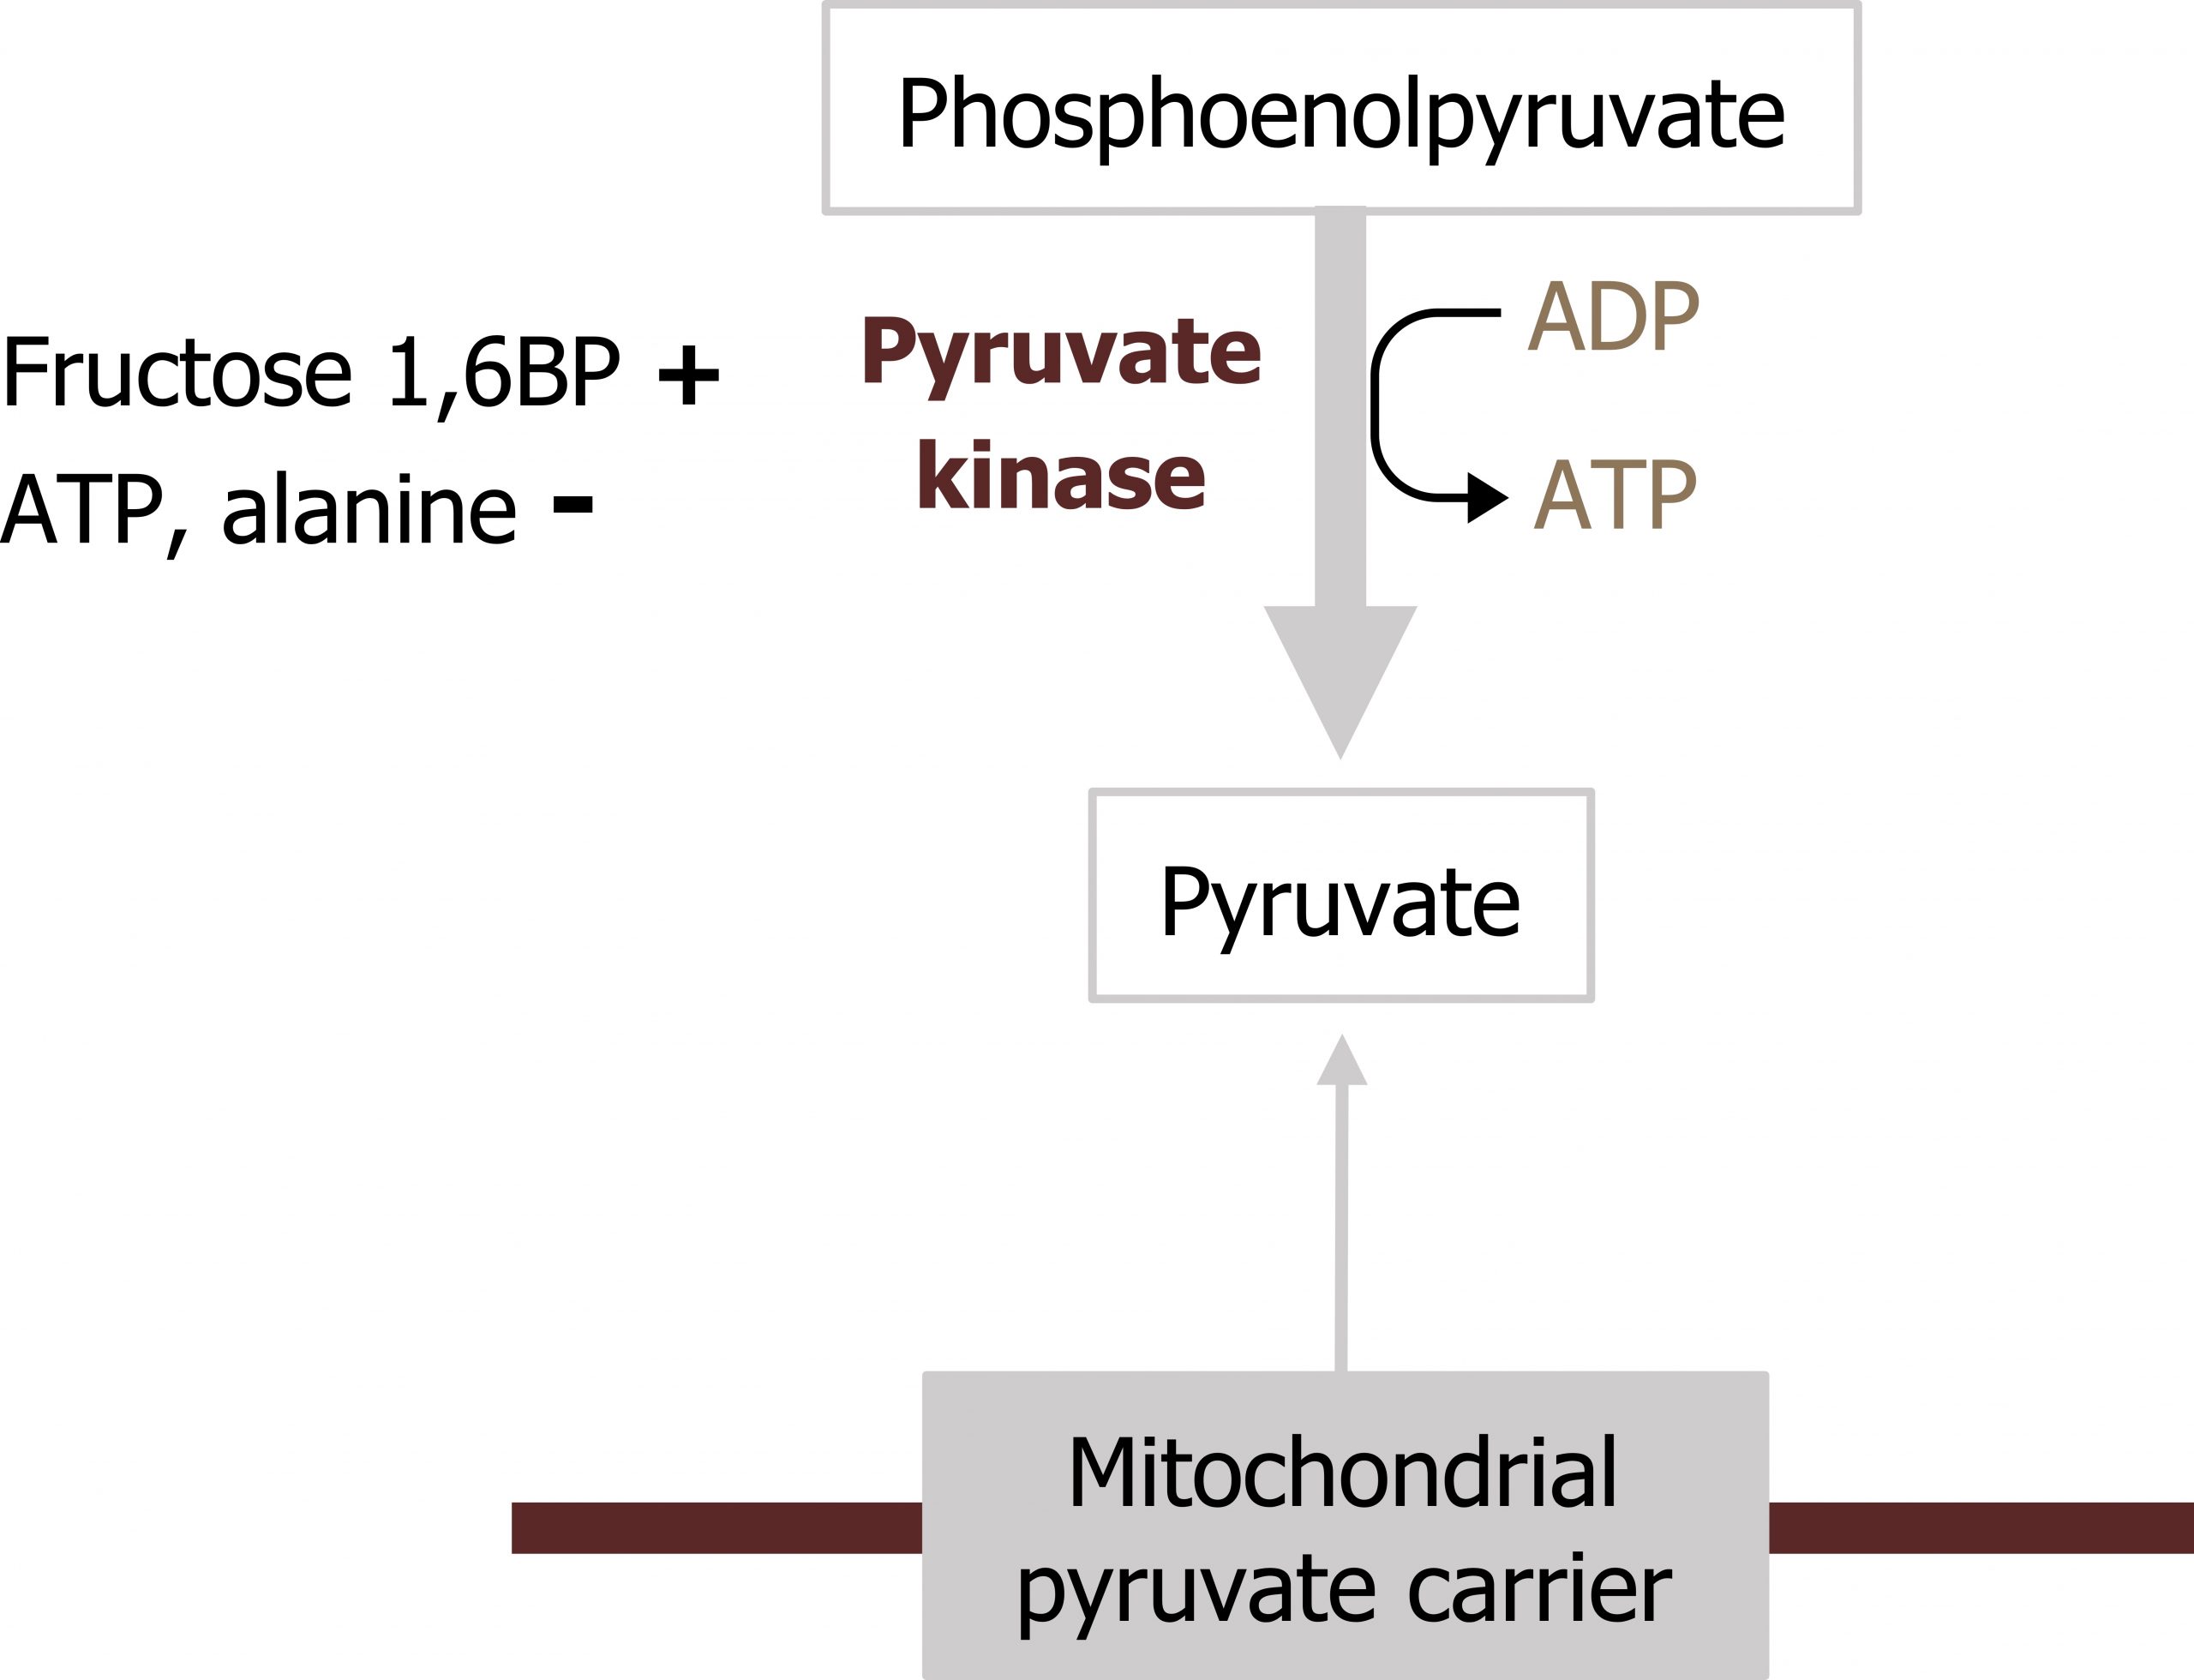
Regulation of pyruvate kinase (PK)
The final regulatory step of glycolysis is the reaction catalyzed by pyruvate kinase. The enzyme converts phosphoenol pyruvate (PEP) to pyruvate. PK can be regulated by phosphorylation and allosteric means. PK is subject to feed-forward activation by fructose 1,6-bisphosphate, which allosterically activates the enzyme, increasing flux in the downward direction. As energy levels in the cell increase, ATP levels will reduce enzyme activity through allosteric inhibition (figure 4.6). PK can also be regulated through phosphorylation. Similar to PFK2, PK is dephosphorylated and active in the fed state but phosphorylated during the fasted state, which renders the enzyme inactive; the phosphorylation is glucagon mediated.
Movement of NADH from the cytosol to the mitochondria
The NADH generated in the cytosol by glycolysis must be oxidized back to NAD+ in order to maintain a pool of NAD+ needed for glucose oxidation. As NADH oxidation takes place in the mitochondria, and the membrane is not permeable to NADH, two shuttles are used to move cytosolic NADH into the mitochondria. These processes are a way to get energy out of cytoplasmic NADH into the mitochondria.
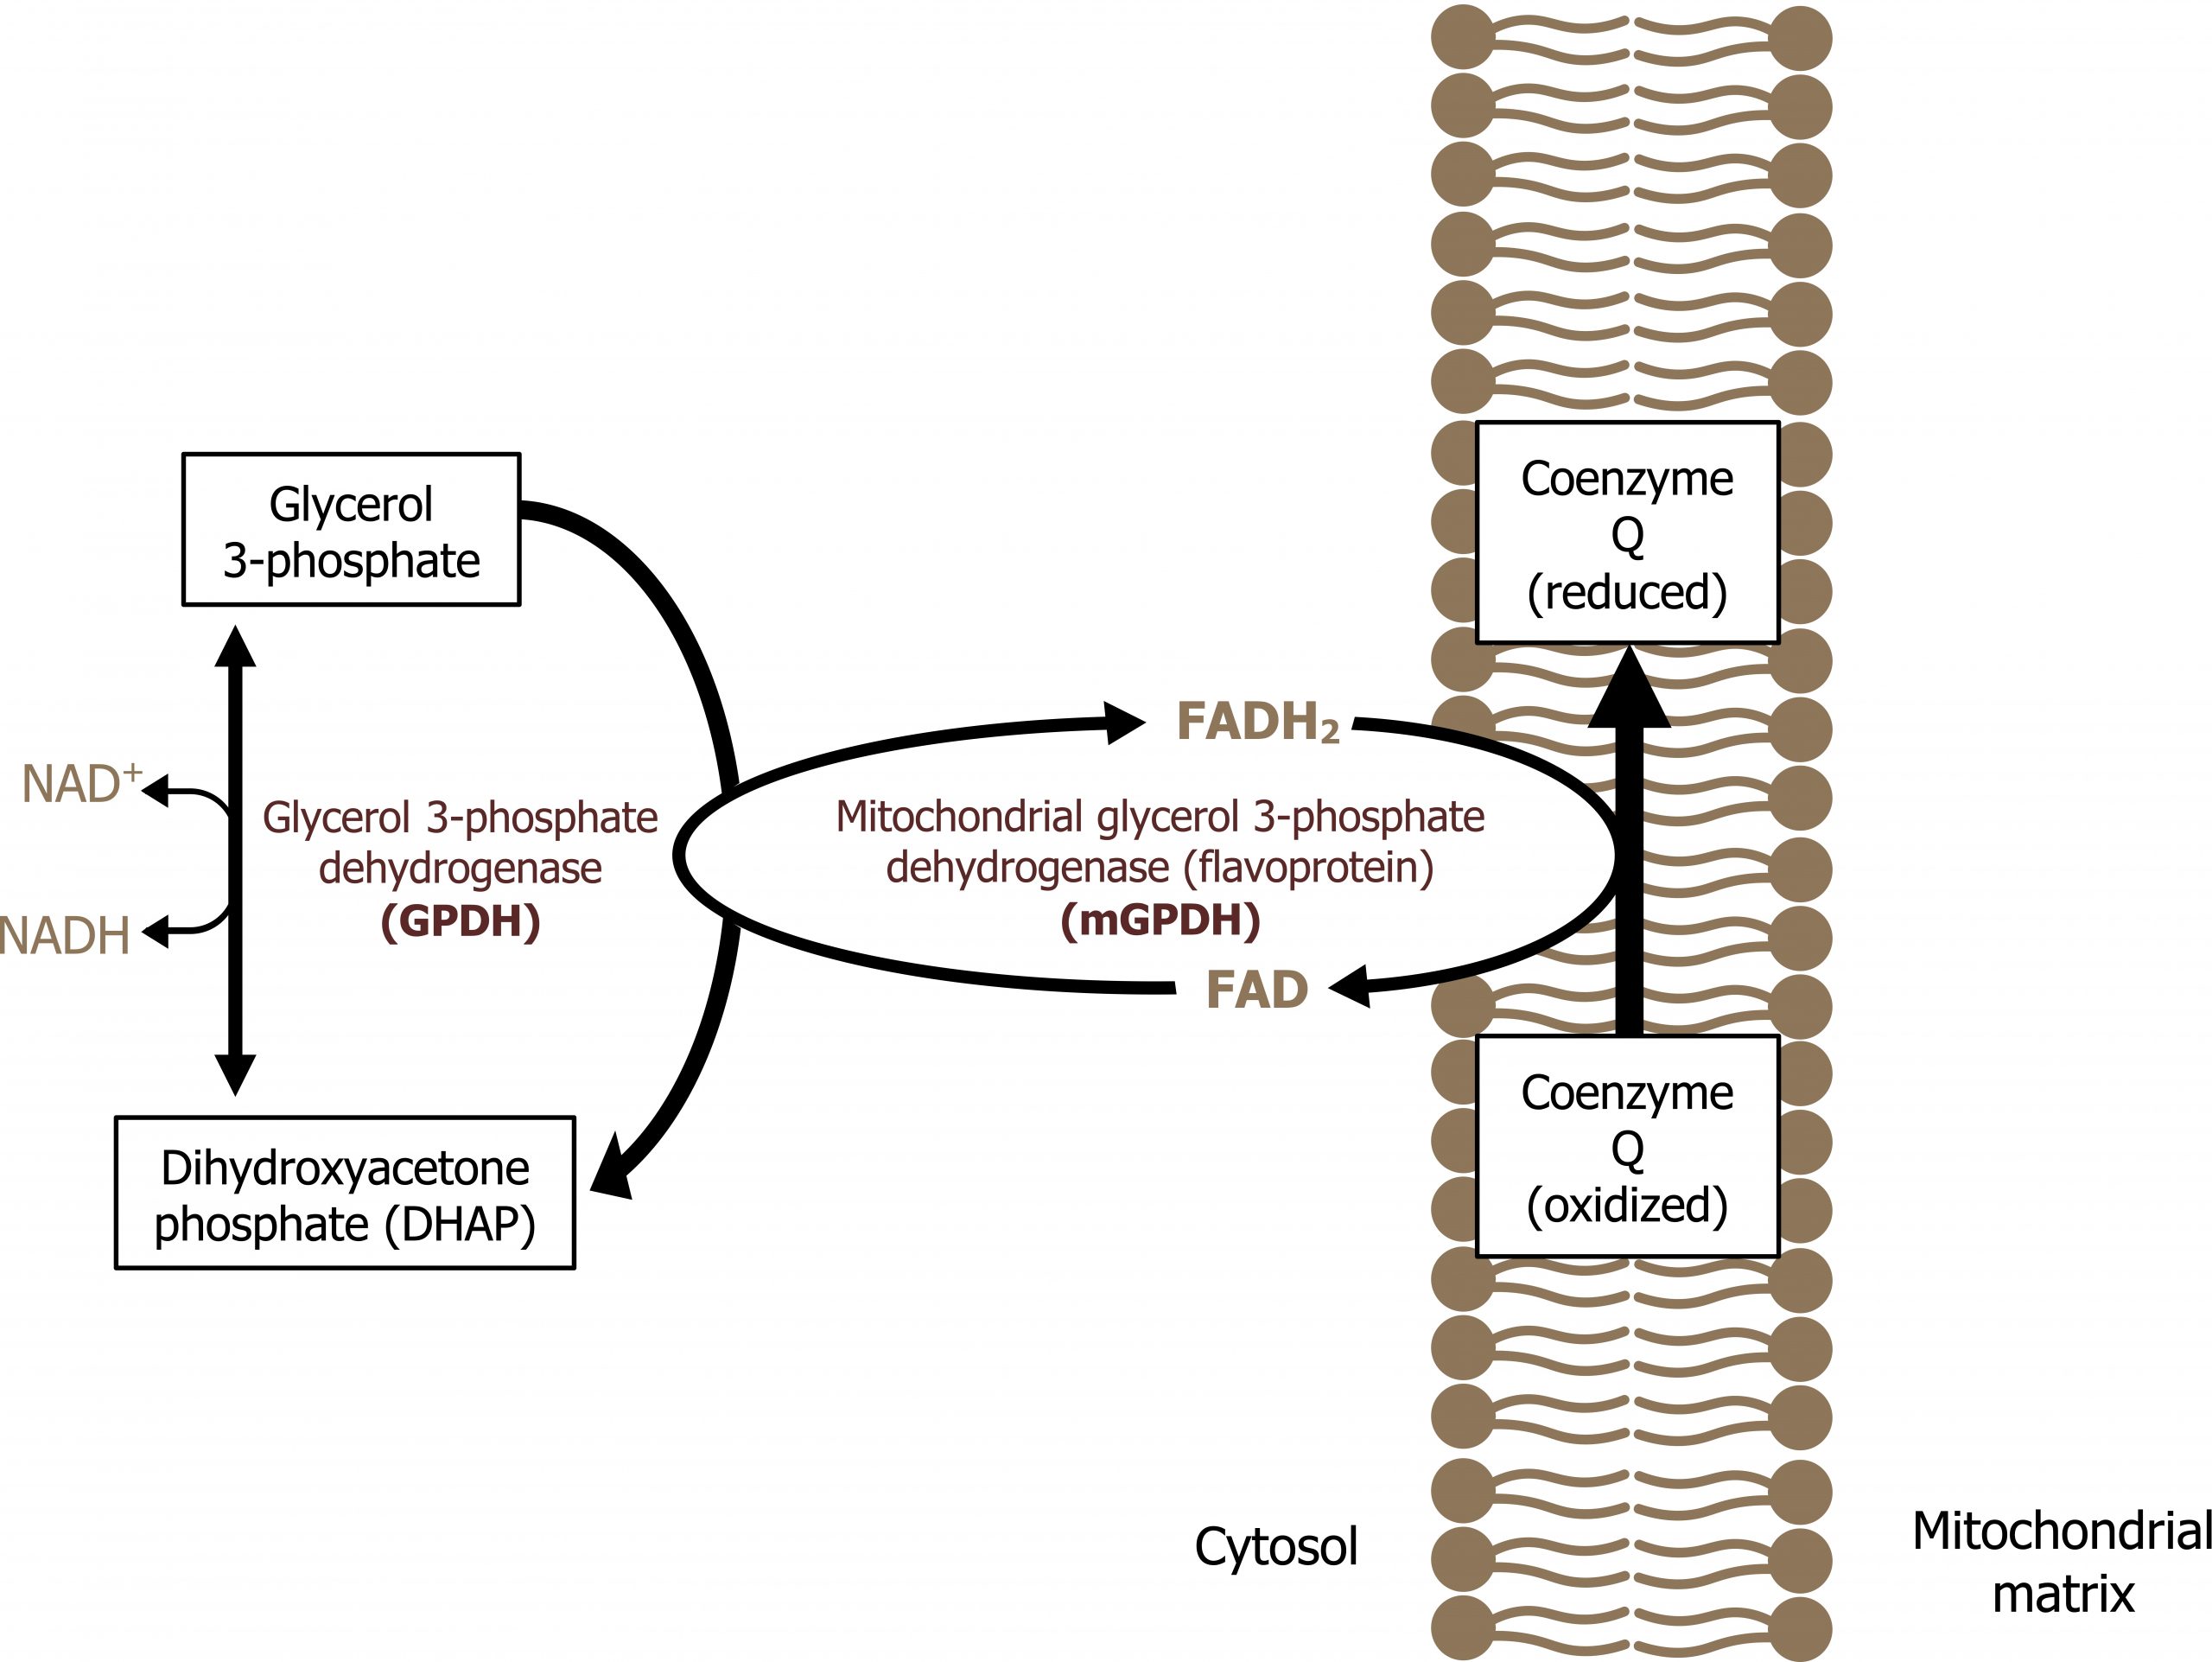
Glycerol 3-phosphate shuttle
The glycerol 3-phosphate shuttle is the major shuttle used in most tissues to move NADH from the cytosol to the mitochondria for oxidation. In this pathway, NAD+ is regenerated by glycerol 3-phosphate dehydrogenase, which transfers electrons from NADH to dihydroxyacetonephosphate to generate glycerol 3-phosphate. Glycerol 3-phosphate can diffuse across the mitochondrial membrane where it will donate electrons to membrane bound FAD (bound to succinate dehydrogenase) (figure 4.7).
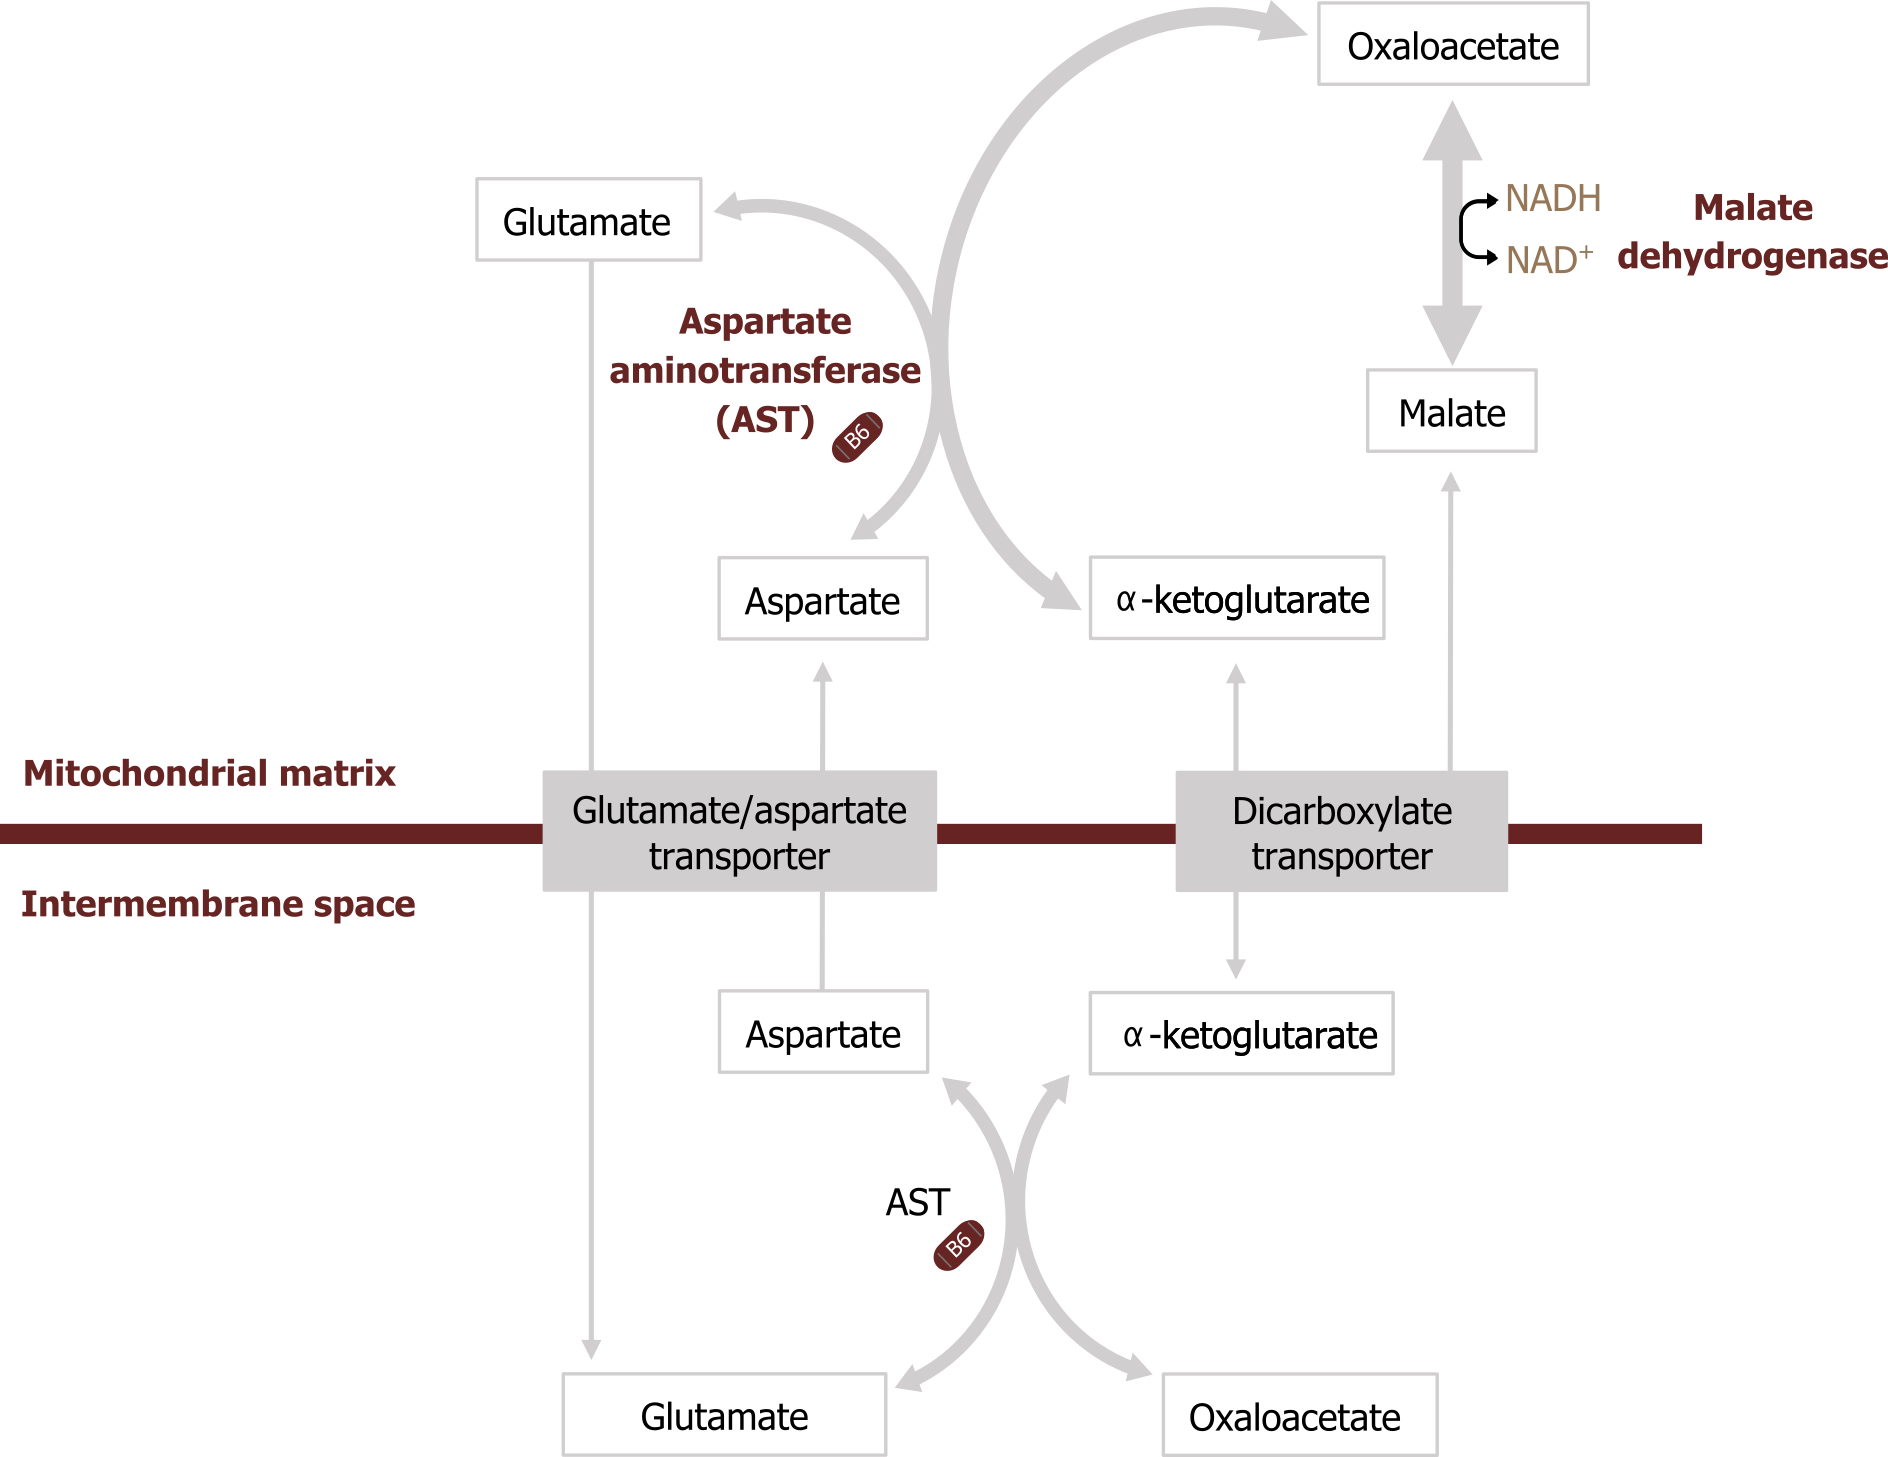
Malate-aspartate shuttle
Many tissues also contain the malate-aspartate shuttle, which can also carry cytosolic NADH into the mitochondria. Cytosolic NADH is used to reduce oxaloacetate (OAA) to malate, which can cross the mitochondrial membrane. Once inside the mitochondria, malate can be oxidized to OAA to produce NADH. OAA canʼt pass through the mitochondrial membrane, so it requires transamination to aspartate, which can be shuttled into the cytosol to regenerate the cycle (figure 4.8).
Pyruvate dehydrogenase complex
Under aerobic conditions, the pyruvate produced by glycolysis will be oxidized to acetyl-CoA using the pyruvate dehydrogenase complex (PDC). This enzyme is a key transition point between cytosolic and mitochondrial metabolism. This complex is composed of three subunits, which require the cofactors thiamine pyrophosphate, lipoic acid, and FADH2; NADH is also required for the reaction to move forward. The enzyme is highly regulated by both covalent and allosteric regulation. Deficiencies of the PDC can be recessive or X-linked (depending on the subunit deficient) and present with symptoms of lactic acidosis after consuming a meal high in carbohydrates. This metabolic deficiency can be managed by delivering a ketogenic diet and bypassing glycolysis all together.
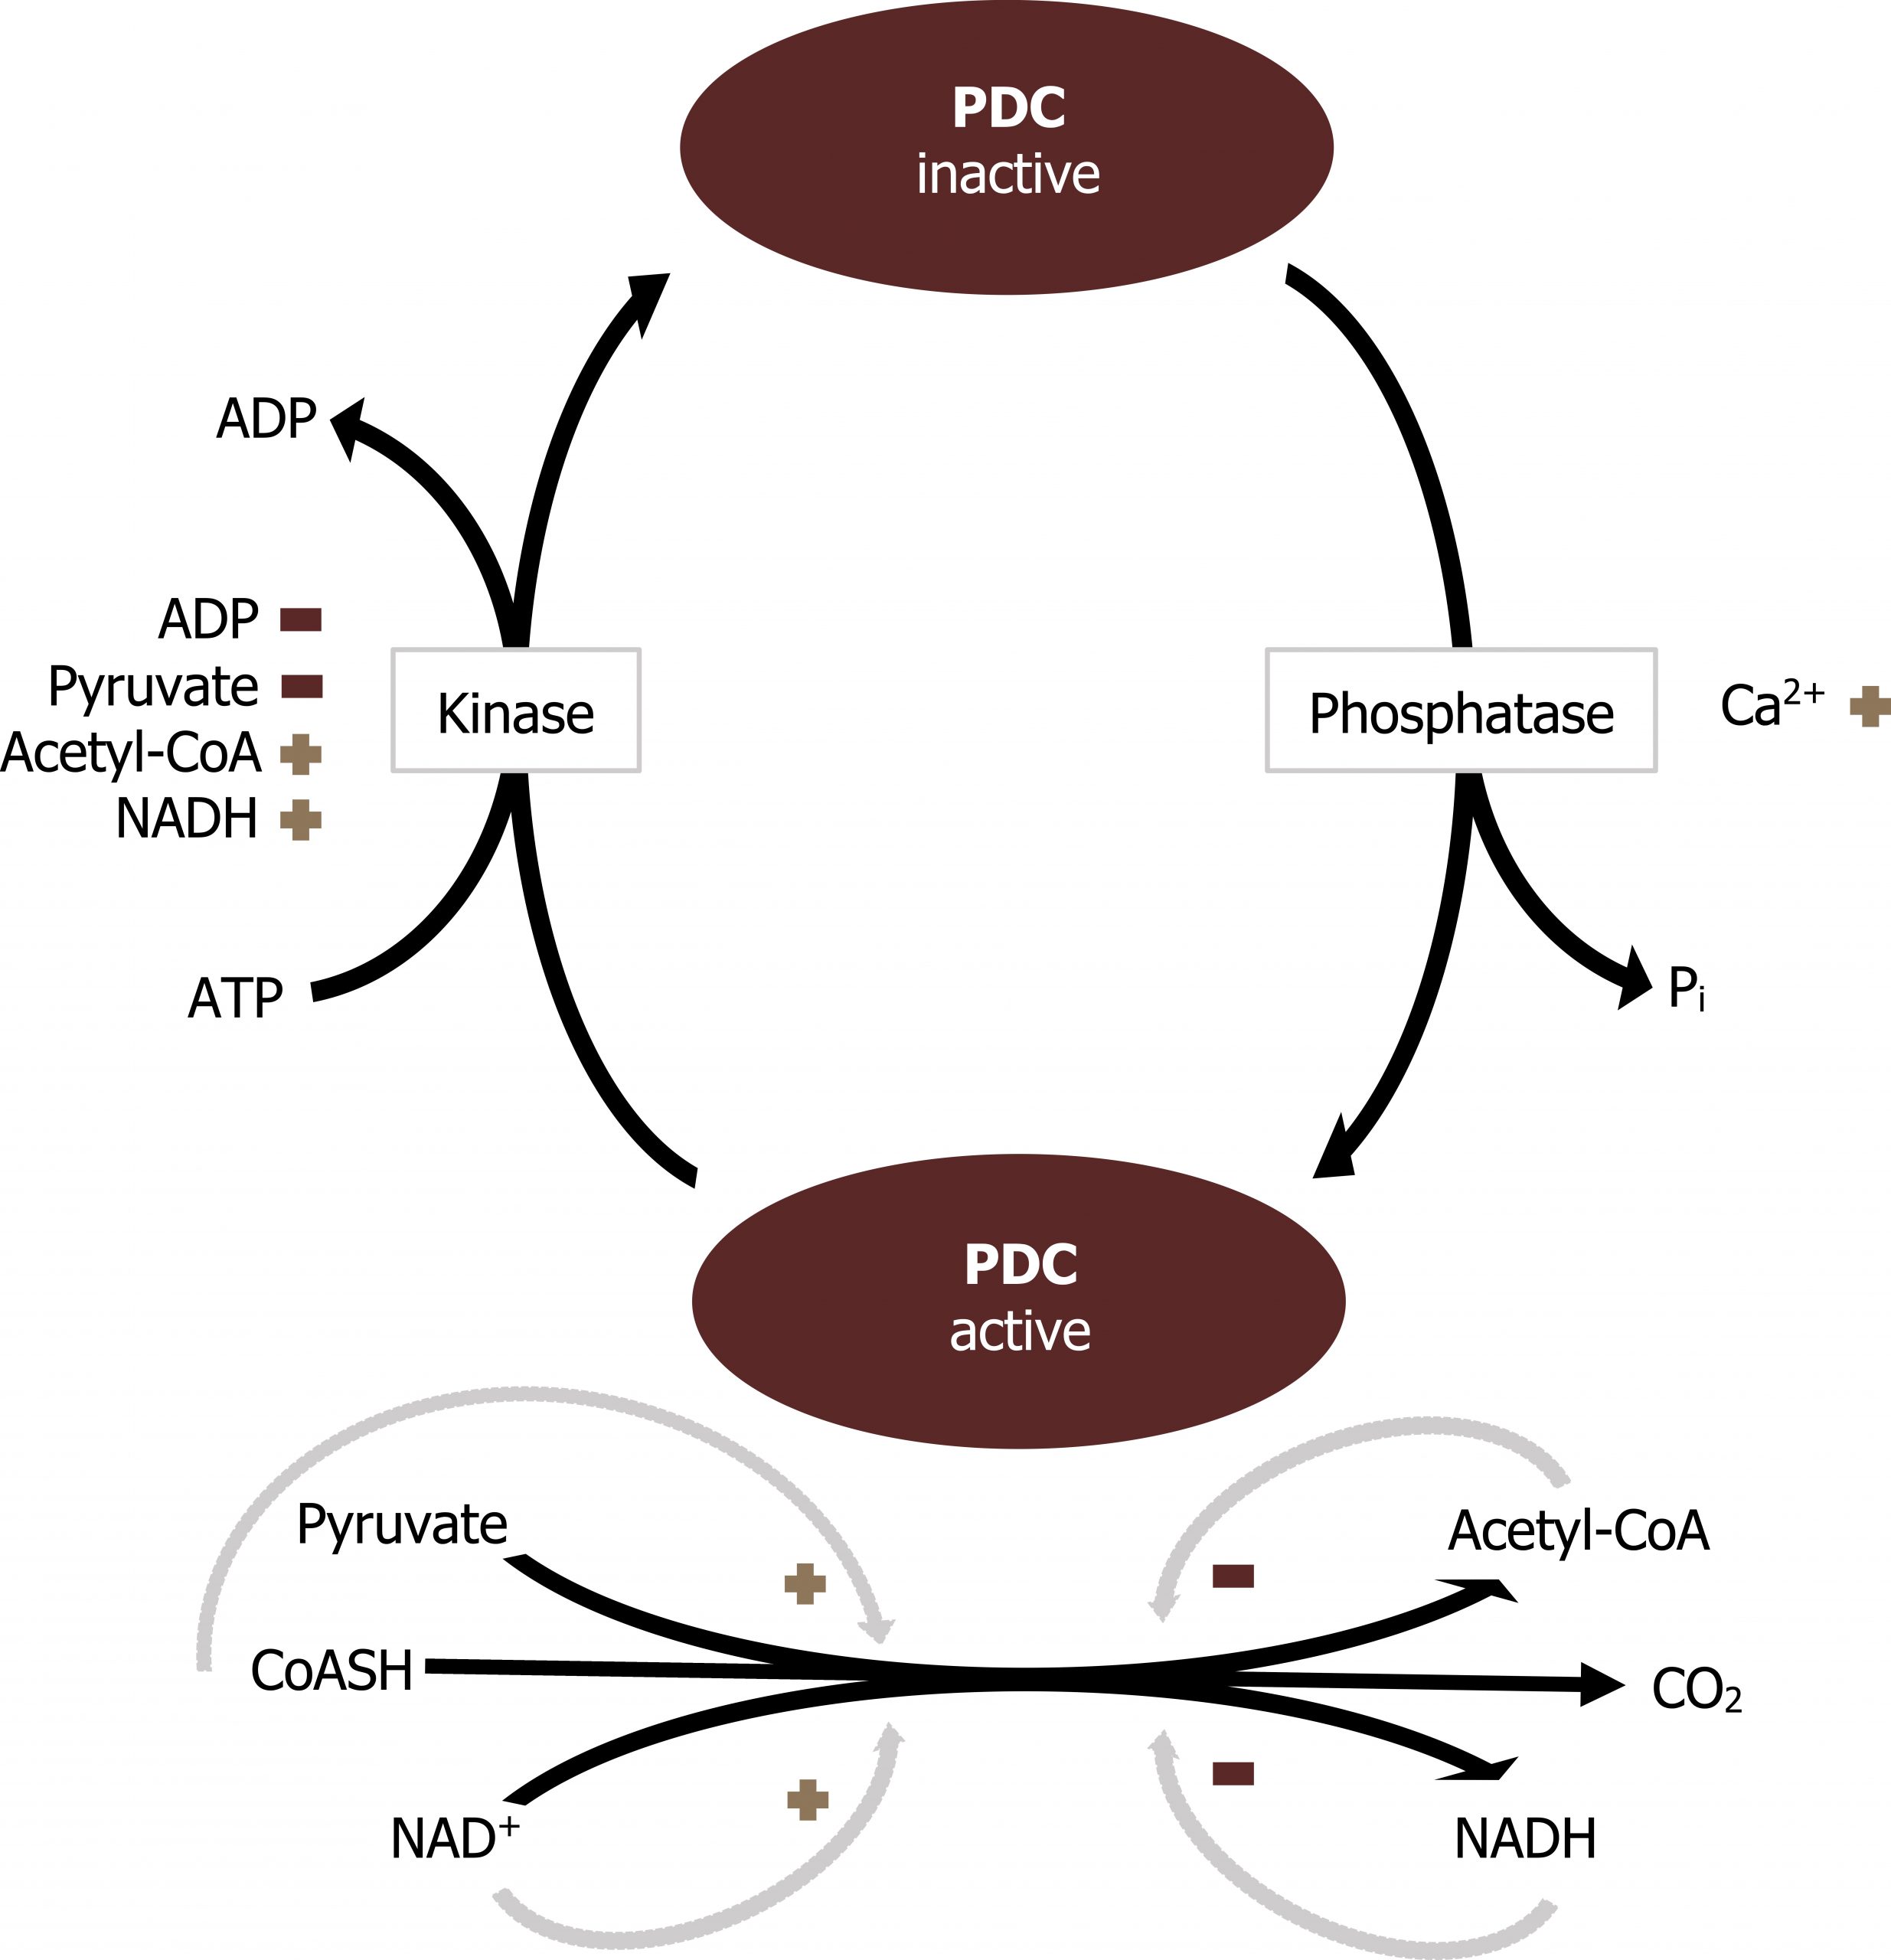
Regulation of the pyruvate dehydrogenase complex (PDC)
The PDC is regulated by allosteric and covalent regulations. The complex itself can be allosterically activated by pyruvate and NAD+. Elevation of substrate (pyruvate) will enhance flux through this enzyme as will the indication of low energy states as triggered by high NAD+ levels. The PDC is also inhibited by acetyl-CoA and NADH directly. Product inhibition is a very common regulatory mechanism, and high NADH would signal sufficient energy levels, therefore decreasing activity of the PDC.
The PDC is also regulated through covalent modification. Phosphorylation of the complex will decrease activity of the enzyme.
The enzyme responsible for phosphorylation of the PDC is pyruvate dehydrogenase kinase. The kinase is regulated inversely to the PDC (figure 4.9). The kinase is most active when acetyl-CoA and NADH are high. These compounds will stimulate the kinase to phosphorylate and inactivate the PDC. The PDC can be dephosphorylated by a calcium-mediated phosphatase.
Summary of pathway regulation
| Metabolic pathway | Major regulatory enzyme(s) | Allosteric effectors | Hormonal effects |
|---|---|---|---|
| Glycolysis (pyruvate oxidation) | Glucokinase (liver) | GKRP | |
| Glycolysis (pyruvate oxidation) | Hexokinase | Glucose 6-P (-) | |
| Glycolysis (pyruvate oxidation) | PFK-1 | Fructose 2,6-BP, AMP (+) Citrate (-) |
Insulin/glucagon ratio >1 → dephosphorylation of PFK2 and increased production of F 2,6-BP |
| Glycolysis (pyruvate oxidation) | Pyruvate kinase | Fructose 1,6-BP (+) ATP, alanine (-) |
Insulin/glucagon ratio >1 → dephosphorylation |
| Pyruvate dehydrogenase complex | PDC | Pyruvate, NAD+ (+) Acetyl-CoA, NADH, ATP (-) |
Insulin/glucagon ratio >1 → dephosphorylation |
Table 4.1: Summary of pathway regulation.
4.1 References and resources
Text
Ferrier, D. R., ed. Lippincott Illustrated Reviews: Biochemistry, 7th ed. Philadelphia: Wolters Kluwer Health/Lippincott Williams & Wilkins, 2017, Chapter 6: Bioenergetics and Oxidative Phosphorylation: Section V, VI, Chapter 8: Introduction to Metabolism and Glycolysis, Chapter 9: TCA Cycle and Pyruvate Dehydrogenase Complex: Section IIA, IIB, Chapter 11: Glycogen Metabolism: Section V, VI, Chapter 16: Fatty Acid Ketone Body and TAG Metabolism: Section II, IV, V, Chapter 23: Metabolic Effect of Insulin and Glucagon, Chapter 25: Diabetes Mellitus.
Le, T., and V. Bhushan. First Aid for the USMLE Step 1, 29th ed. New York: McGraw Hill Education, 2018, 72–78, 85–89.
Lieberman, M., and A. Peet, eds. Marks’ Basic Medical Biochemistry: A Clinical Approach, 5th ed. Philadelphia: Wolters Kluwer Health/Lippincott Williams & Wilkins, 2018, Chapter 2: The Fed or Absorptive State, Chapter 19: Basic Concepts of Regulation: Section IV.A.1.2, Chapter 20: Cellular Bioenergetics, Chapter 22: Generation of ATP from Glucose: Section I.A.B.C, III, Chapter 24: Oxidative Phosphorylation and the ETC: Section I.E, II, III, Chapter 31: Synthesis of Fatty Acids: Section I.A.B, IV, V.
Figures
Grey, Kindred, Figure 4.1 Summary of glycolysis… 2021. https://archive.org/details/4.1_20210924. CC BY 4.0.
Grey, Kindred, Figure 4.2 Regulatory step committed by hexo or glucokinase… 2021. https://archive.org/details/4.2_20210924. CC BY 4.0.
Lieberman M, Peet A. Figure 4.3 Comparison of glucokinase and hexokinase kinetics. Adapted under Fair Use from Marks’ Basic Medical Biochemistry. 5th Ed. pp 154. Figure 9.4 A comparison between hexokinase I and glucokinase. 2017.
Grey, Kindred, Figure 4.4 Regulation of glucokinase by glucokinase regulatory protein. 2021. https://archive.org/details/4.4_20210924. CC BY 4.0. Added ion channel by Léa Lortal from Noun Project and sphere by Pablo Rozenberg from Noun Project.
Grey, Kindred, Figure 4.5 Regulation of PFK1 by fructose 2,6-bisphosphate generated by PFK2. 2021. https://archive.org/details/4.5-new. CC BY 4.0.
Grey, Kindred, Figure 4.6 Regulation of pyruvate kinase phosphorylation and fructose 1,6-bisphosphate. 2021. https://archive.org/details/4.6-new. CC BY 4.0.
Grey, Kindred, Figure 4.7 Glycerol 3-phosphate shuttle. 2021. https://archive.org/details/4.7_20210924. CC BY 4.0. Added ion channel by Léa Lortal from the Noun Project.
Grey, Kindred, Figure 4.8 Malate-aspartate shuttle. 2021. https://archive.org/details/4.8_20210924. CC BY 4.0.
Lieberman M, Peet A. Figure 4.9 Regulation of the PDC. Adapted under Fair Use from Marks’ Basic Medical Biochemistry. 5th Ed. pp 471. Figure 23.15 Regulation of pyruvate dehydroenase complex (PDC). 2017.
4.2 Tricarboxylic Acid Cycle (TCA)
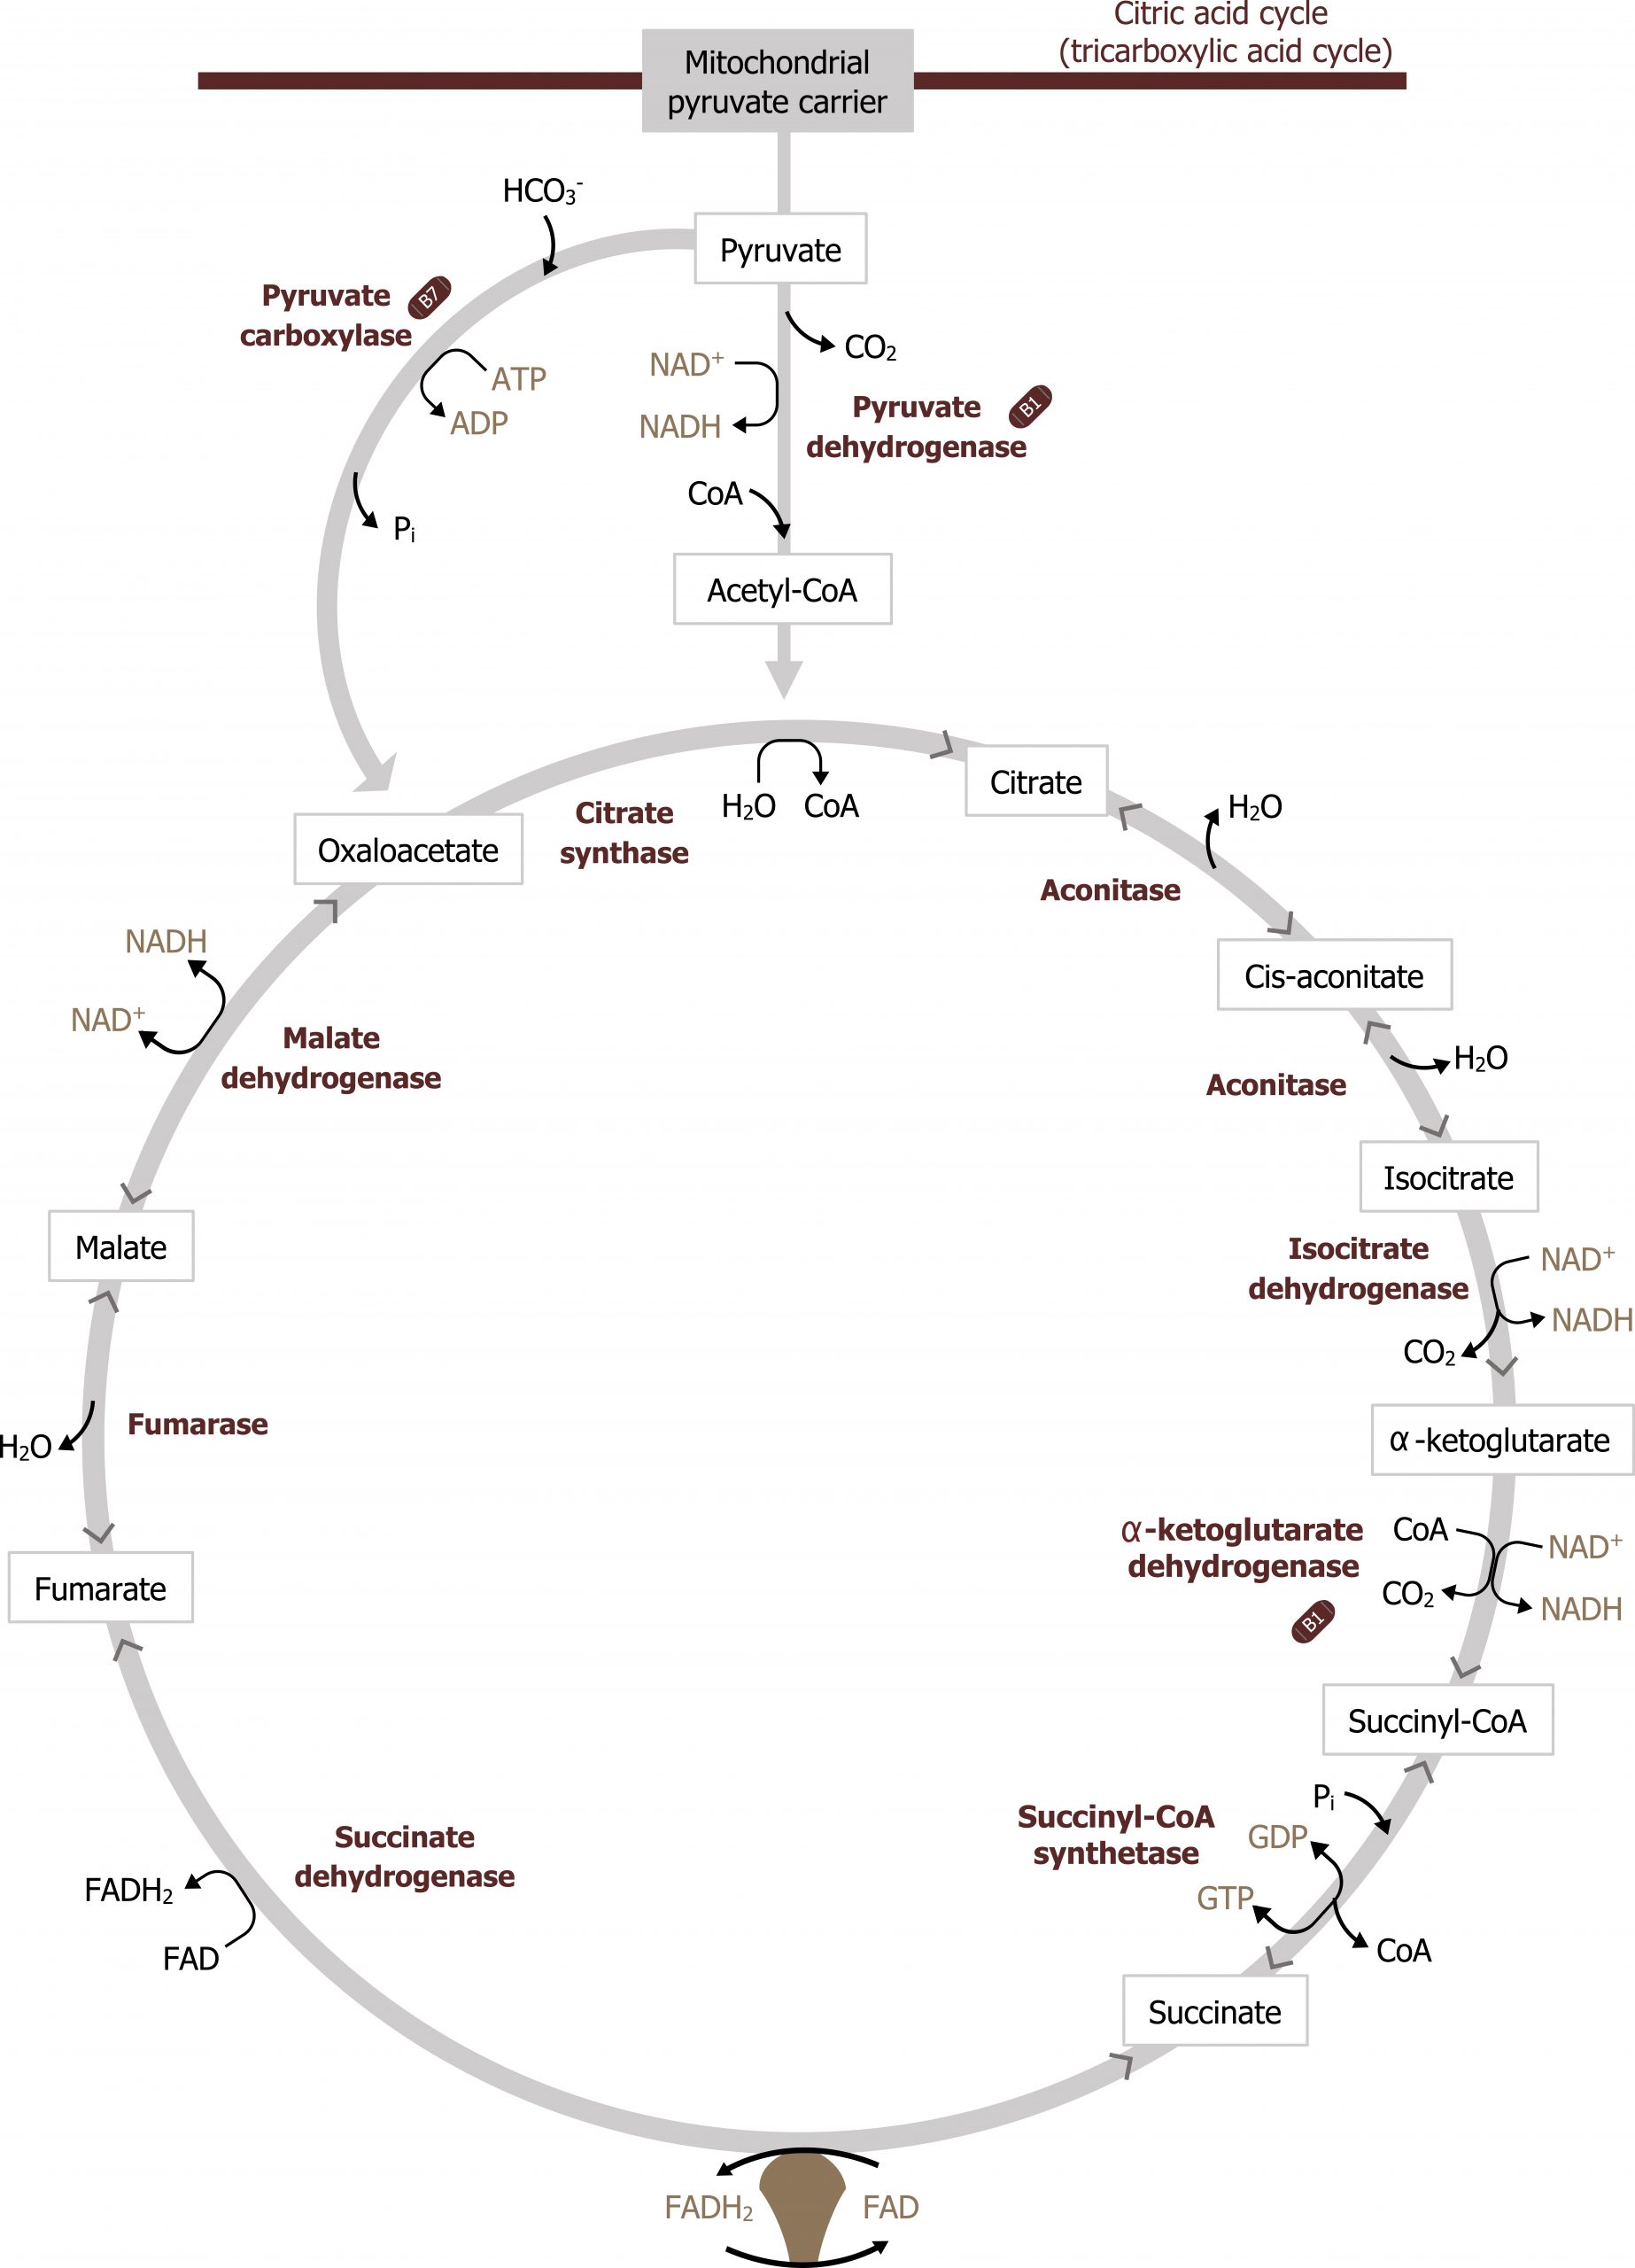
The TCA cycle is responsible for generating over half of the ATP from the oxidation of fuels. This is primarily because the substrate for the TCA cycle, acetyl-CoA, is generated by the oxidation of fatty acids, glucose, amino acids, and ketone bodies. With each turn of the TCA cycle, there is a net production of three NADH, FADH2, two CO2, and one GTP for every acetyl-CoA that enters (figure 4.10).
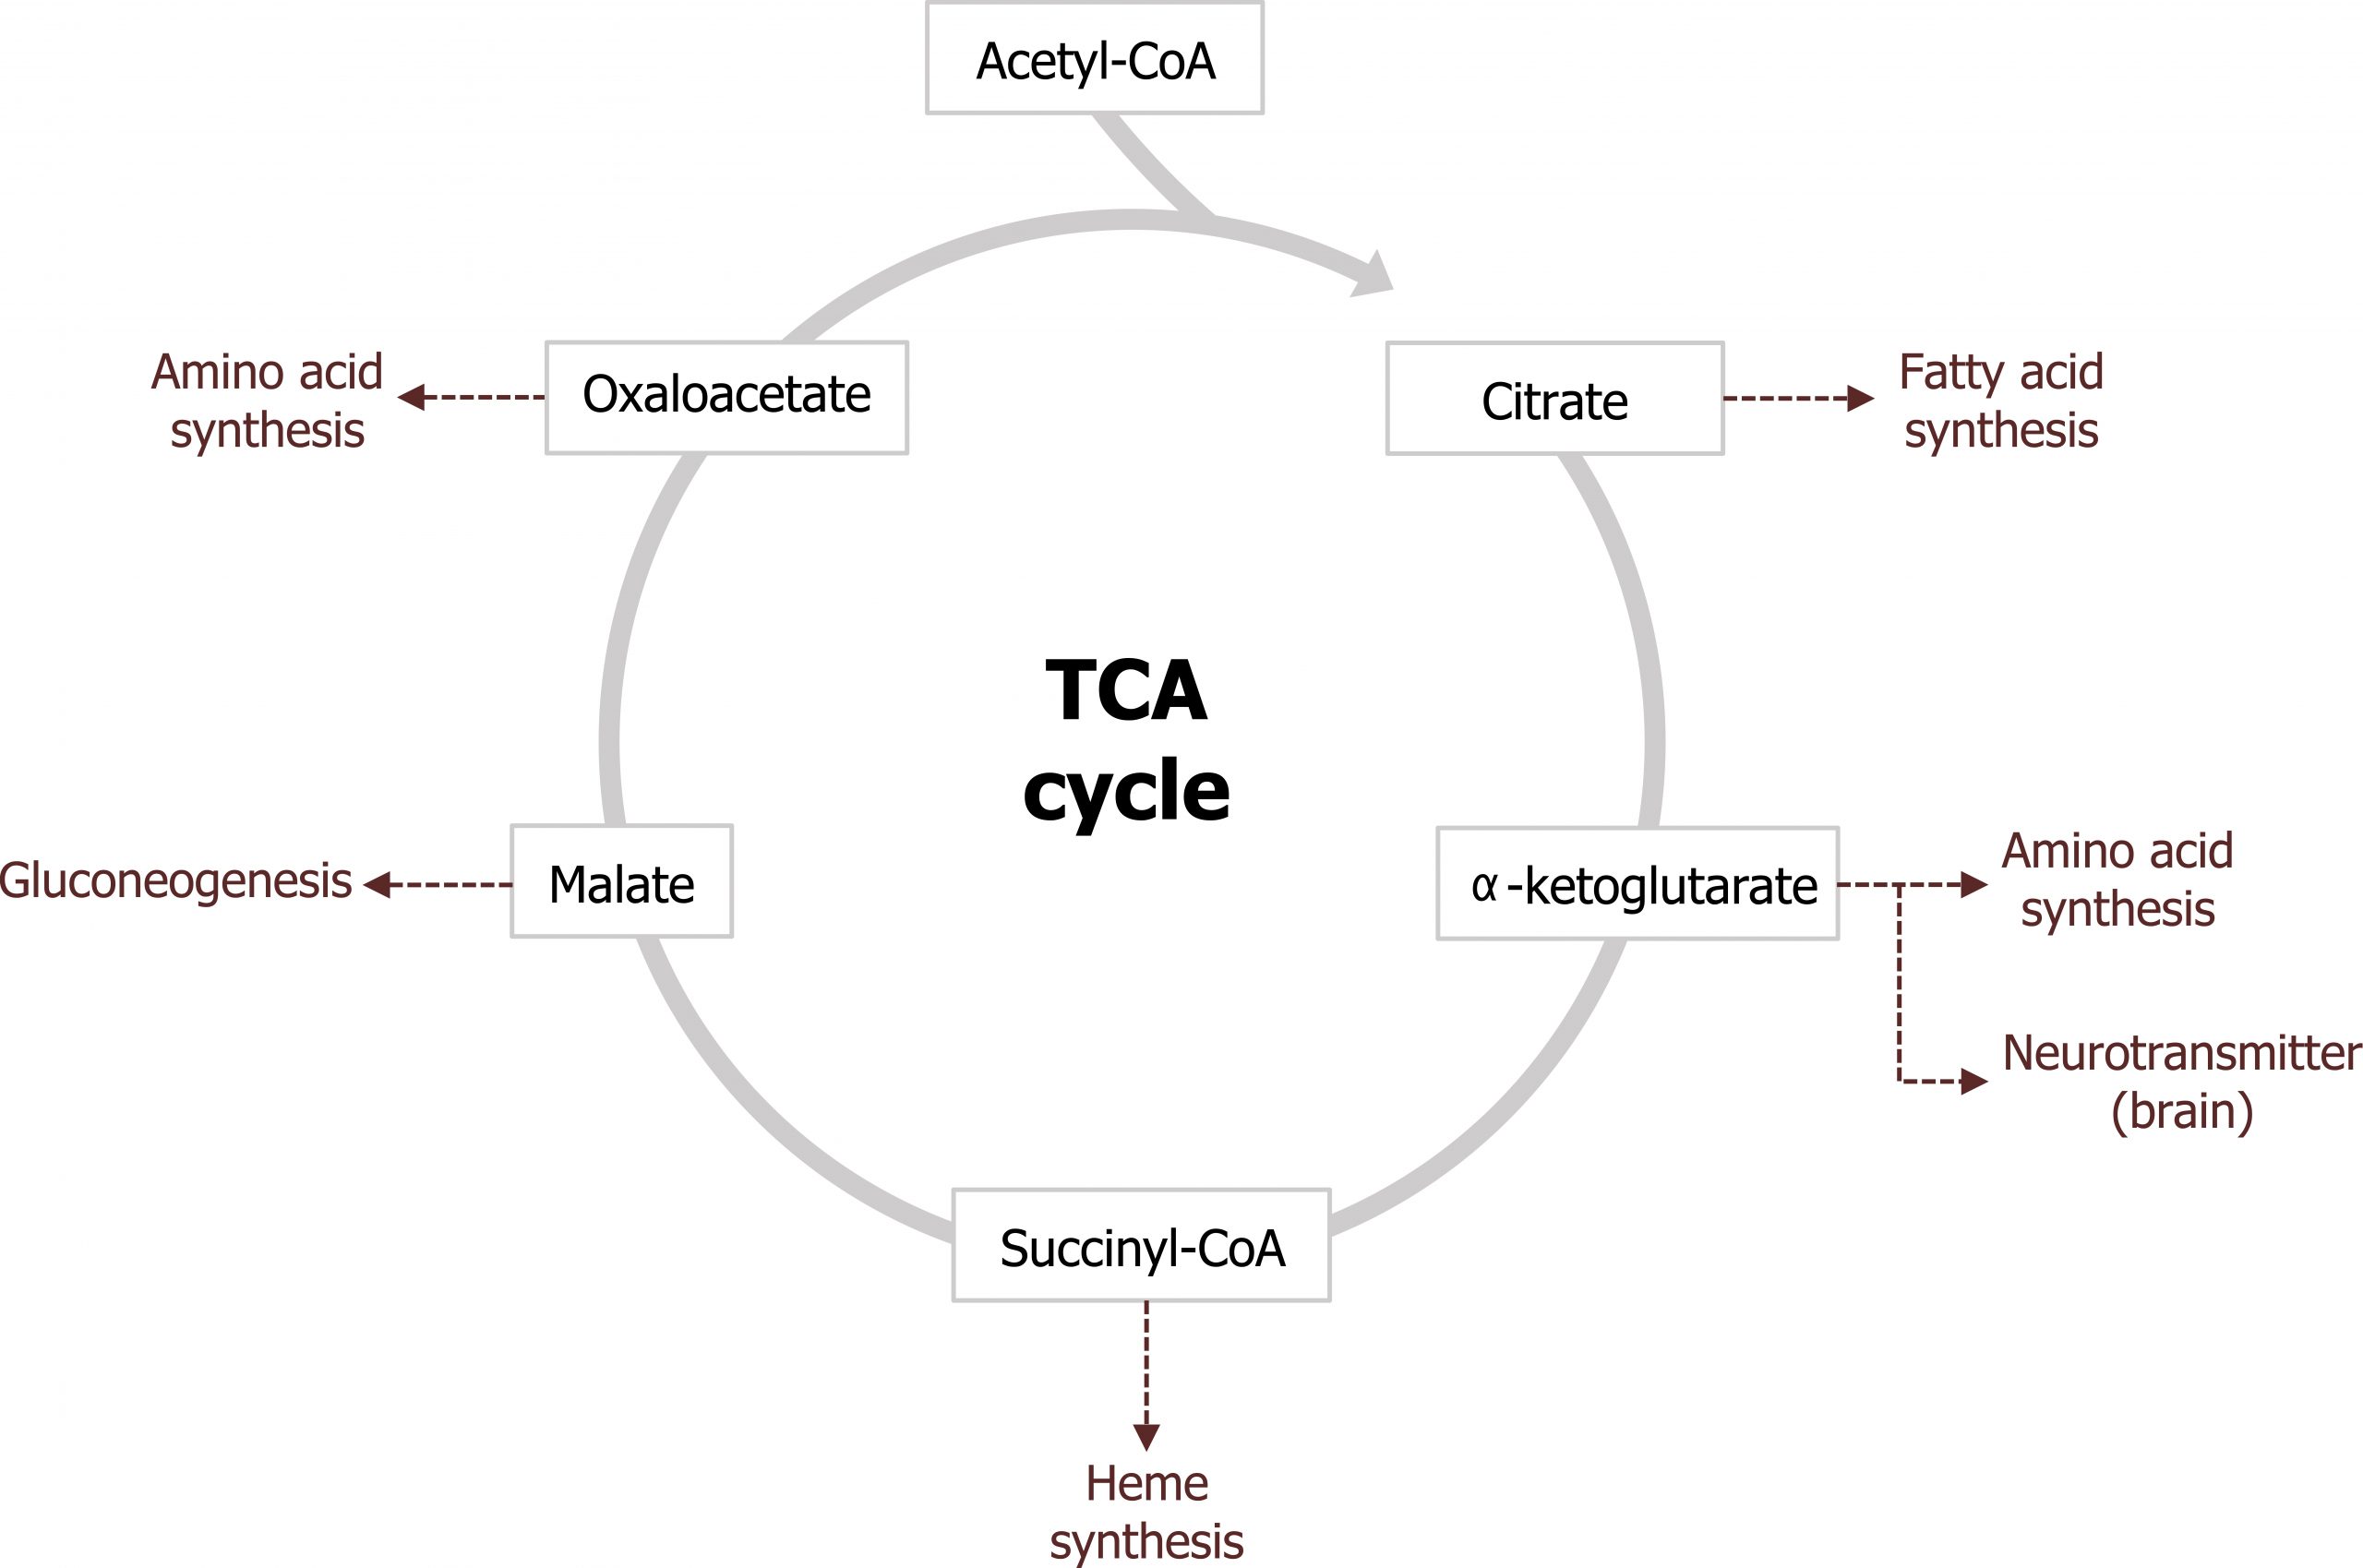
The other major role of the TCA cycle is to provide substrates for other synthetic pathways. Malate is shuttled out of the TCA cycle and used as a substrate for gluconeogenesis and oxaloacetate (OAA) and α-ketoglutarate are used as substrates for amino acid synthesis. Through transamination reactions, these two keto-acids can be converted into aspartate and glutamate, respectively. α-ketoglutarate is also a key substrate for the synthesis of neurotransmitters, and succinyl-CoA is the substrate for heme synthesis. Citrate is also a key compound as it is both an intermediate of the TCA cycle and can be shuttled into the cytosol to provide acetyl-CoA for both cholesterol and fatty acid synthesis (figure 4.11).
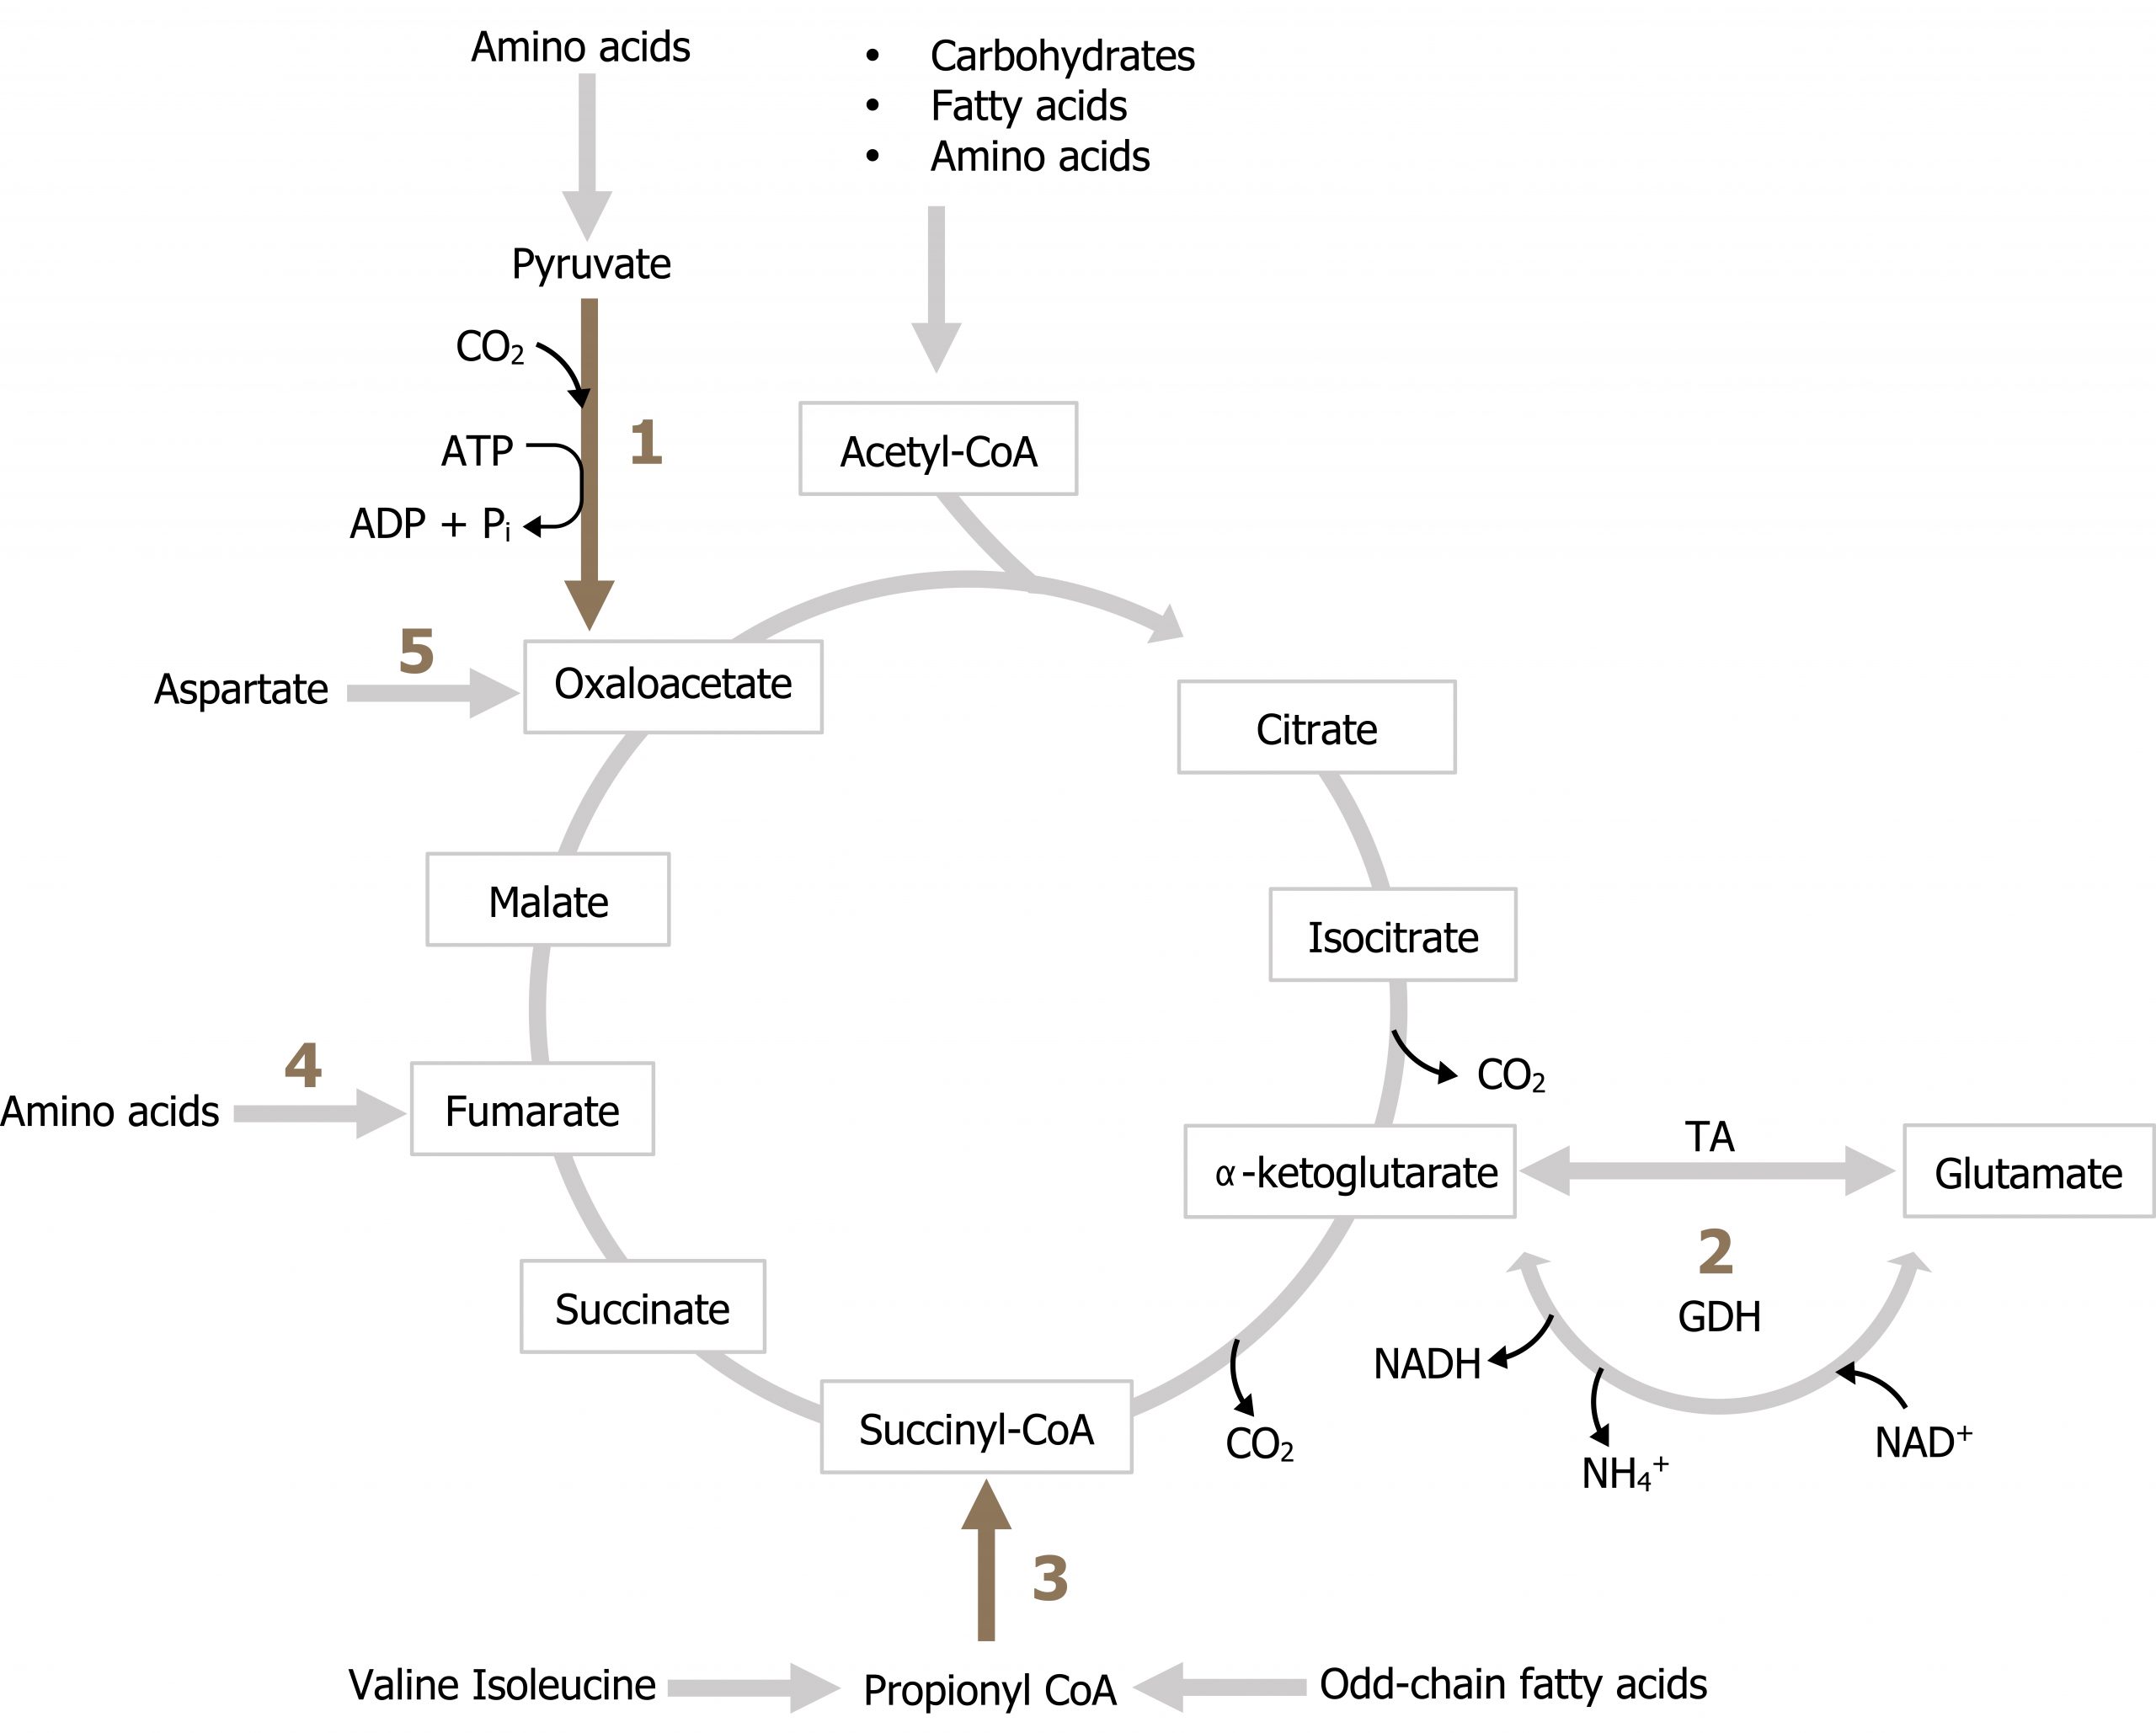
In order to maintain a pool of TCA cycle intermediates, as substrates are removed from the cycle, there are several key reactions (anaplerotic reactions) that are responsible for the addition of intermediates. These reactions are illustrated in figure 4.12. Notice all of these reactions add carbon back to the cycle from amino acids (reactions 1, 2, 3, 4, 5). These will become very important in the discussion of gluconeogenesis where these substrates will provide the majority of carbon for glucose production. Odd chain fatty acid oxidation can also provide carbon in the from of propionyl-CoA (3) although this is not a primary source of TCA cycle intermediates.
Regulation of the TCA cycle
Throughout the cycle, there are two key regulatory and irreversible steps to be aware of. The first is the conversion of isocitrate to α-ketoglutarate by isocitrate dehydrogenase, and the second is the conversion of α-ketoglutarate to succinyl-CoA by α-ketoglutarate dehydrogenase. The two key regulatory points are:
Isocitrate dehydrogenase, which can be activated by Ca2+ and ADP to increase flux through the cycle, and inhibited by NADH, which would suggest adequate energy in the cell.
Likewise, α-ketoglutarate dehydrogenase can be activated by Ca2+ and inhibited by NADH (and succinyl-CoA) (figure 4.13).
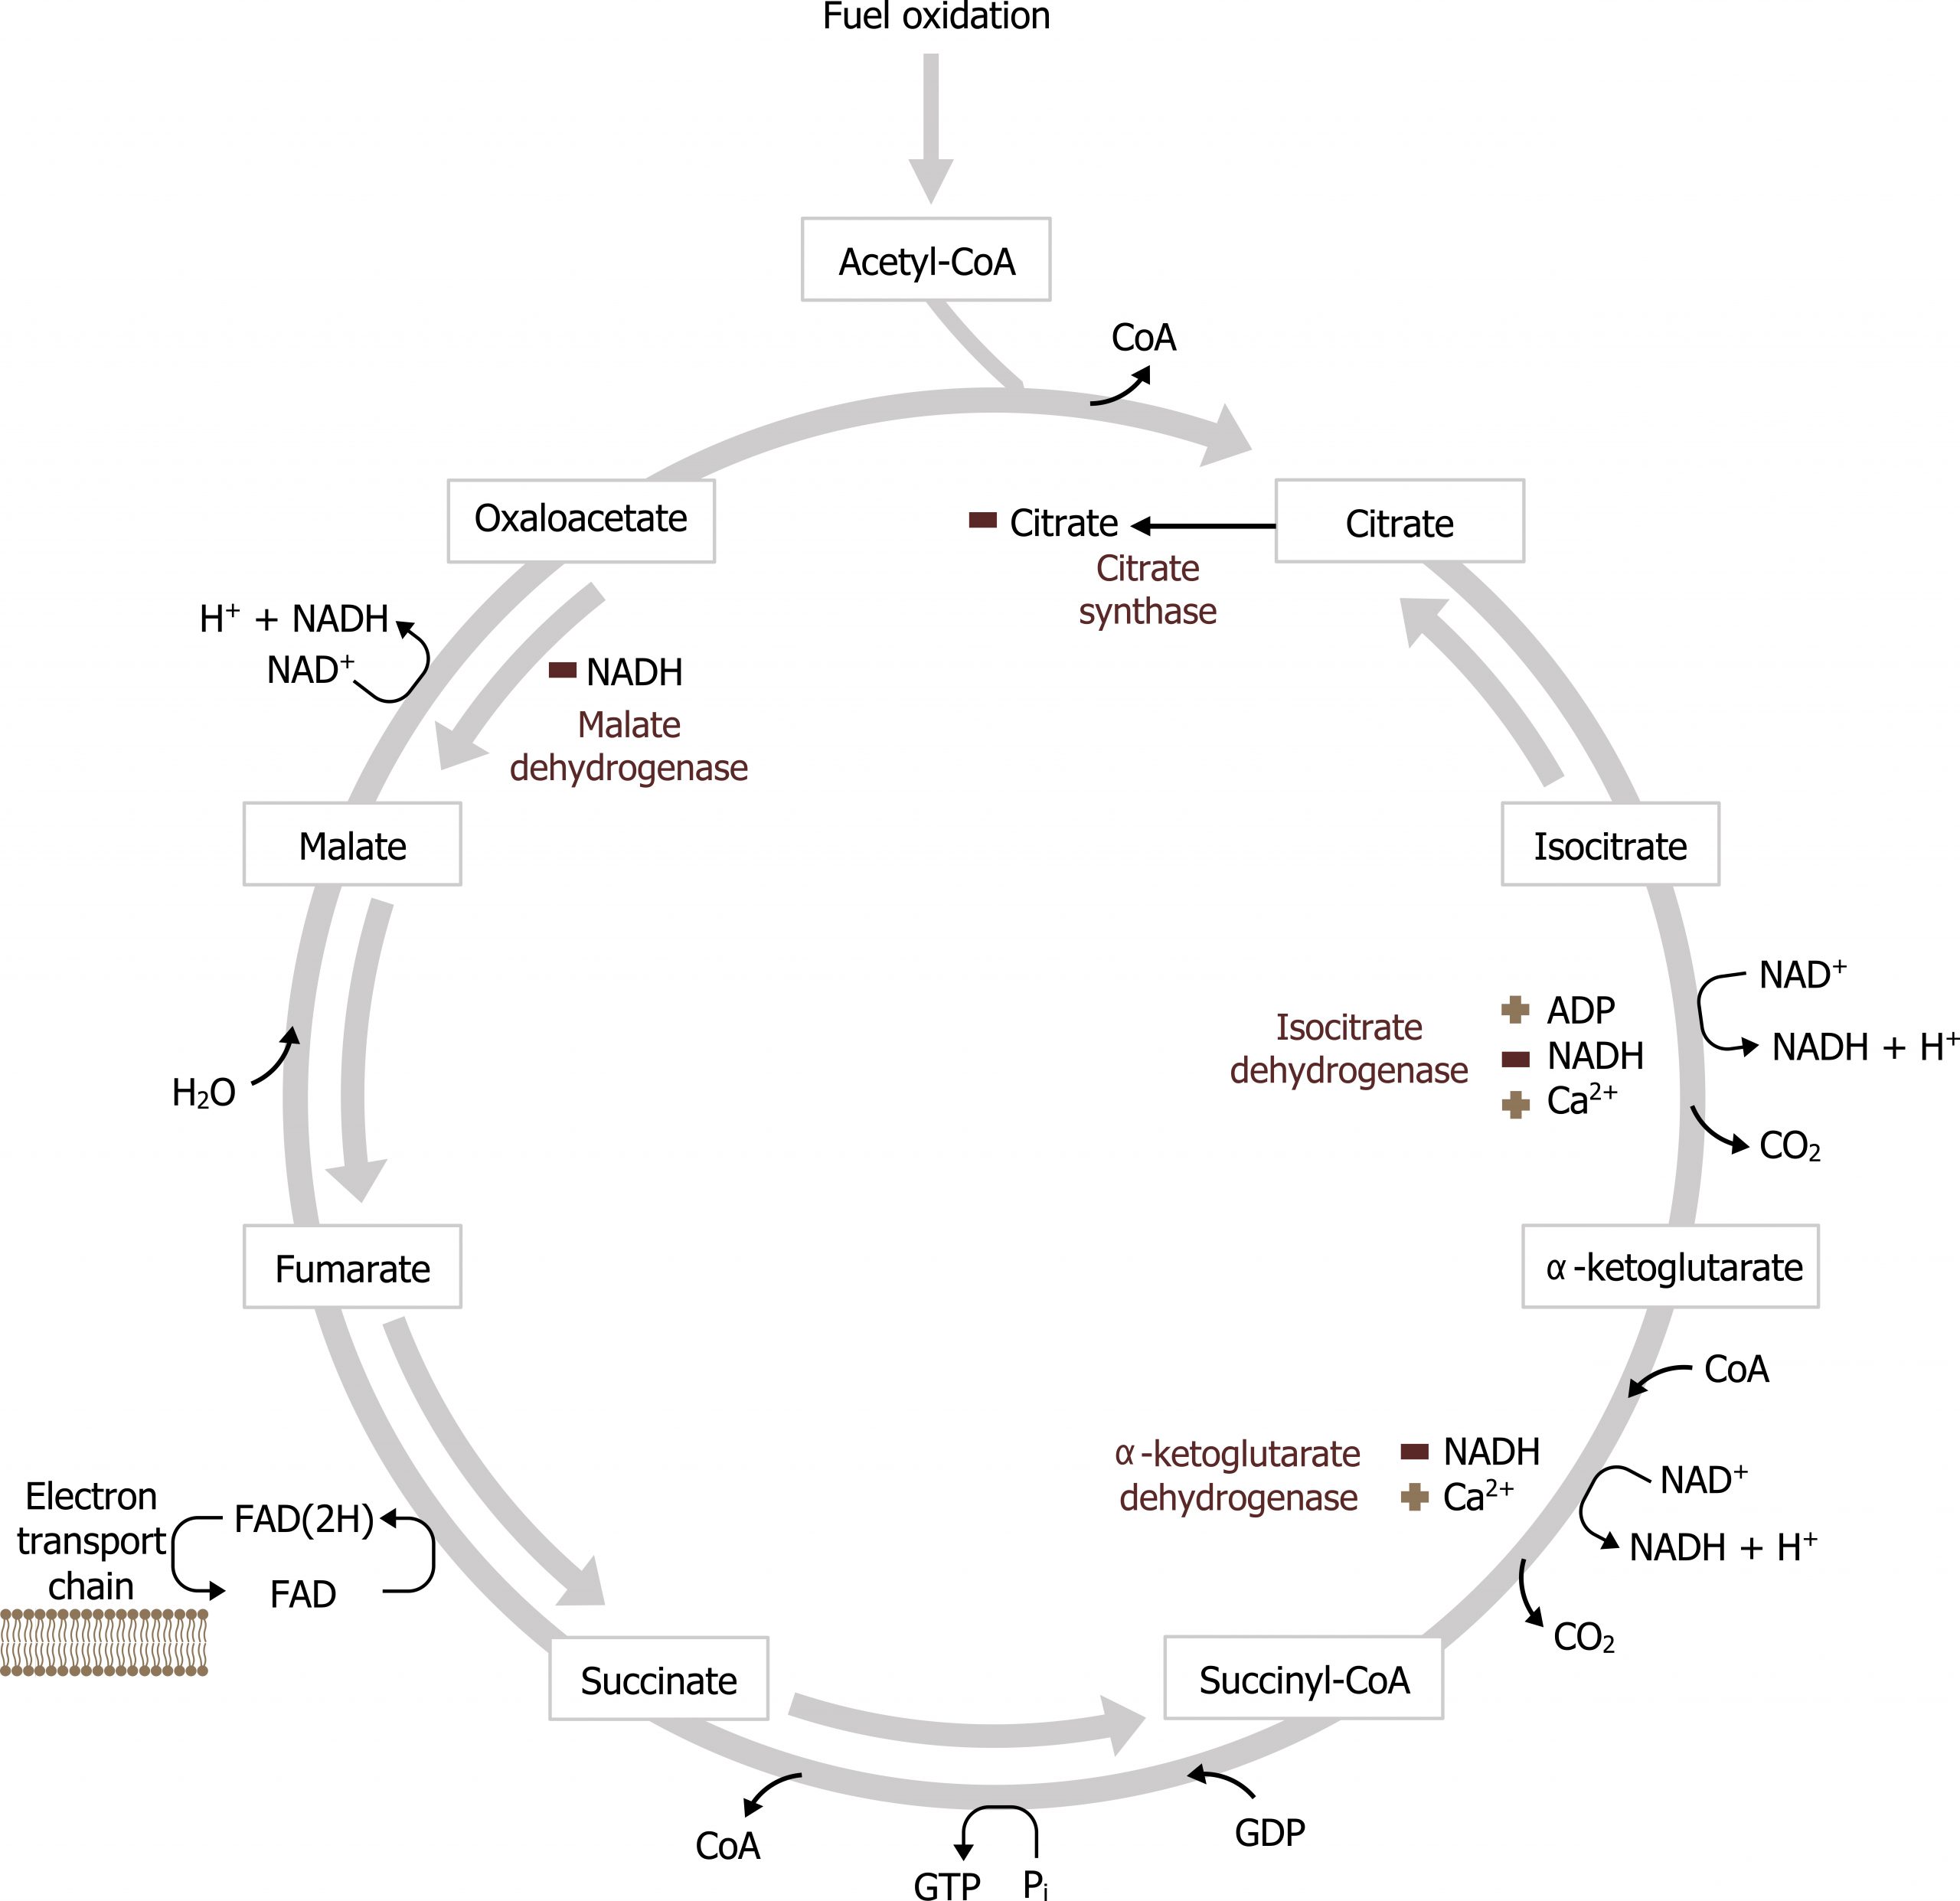
Malate dehydrogenase can also be inhibited by NADH, however, the reaction is reversible depending on levels of NADH. The oxidation of malate to OAA requires NAD+, and under certain pathological situations the lack of free NAD+ within the mitochondria will reduce the rate of this reaction (this is common in the case of alcohol metabolism).
Keep in mind that with the addition of each acetyl-CoA (comprised of 2 carbons) to the TCA cycle, two molecules of CO2 are released, thus there is no net gain or loss of carbons in the cycle. The process moves forward driven by energetics and substrate availability. The pathway can be active in both the fed and fasted states. In the fed state, acetyl-CoA is generated primarily through glucose oxidation. In contrast, in the fasted state acetyl-CoA is generated primarily from β-oxidation, and the majority of acetyl-CoA is used to synthesize ketones.
Summary of pathway regulation
| Metabolic pathway | Major regulatory enzyme(s) | Allosteric effectors | Hormonal effects |
|---|---|---|---|
| TCA cycle | Isocitrate dehydrogenase | ADP, Ca+ (+) NADH (-) | |
| TCA cycle | α-ketoglutarate dehydrogenase | Ca+ (+) NADH (-) |
Table 4.2: Summary of pathway regulation.
4.2 References and resources
Text
Ferrier, D. R., ed. Lippincott Illustrated Reviews: Biochemistry, 7th ed. Philadelphia: Wolters Kluwer Health/Lippincott Williams & Wilkins, 2017, Chapter 6: Bioenergetics and Oxidative Phosphorylation: Section V, VI, Chapter 8: Introduction to Metabolism and Glycolysis, Chapter 9: TCA Cycle and Pyruvate Dehydrogenase Complex: Section IIA, IIB, Chapter 11: Glycogen Metabolism: Section V, VI, Chapter 16: Fatty Acid Ketone Body and TAG Metabolism: Section II, IV, V, Chapter 23: Metabolic Effect of Insulin and Glucagon, Chapter 25: Diabetes Mellitus.
Le, T., and V. Bhushan. First Aid for the USMLE Step 1, 29th ed. New York: McGraw Hill Education, 2018, 72–78, 85–89.
Lieberman, M., and A. Peet, eds. Marks’ Basic Medical Biochemistry: A Clinical Approach, 5th ed. Philadelphia: Wolters Kluwer Health/Lippincott Williams & Wilkins, 2018, Chapter 2: The Fed or Absorptive State, Chapter 19: Basic Concepts of Regulation: Section IV.A.1.2, Chapter 20: Cellular Bioenergetics, Chapter 22: Generation of ATP from Glucose: Section I.A.B.C, III, Chapter 24: Oxidative Phosphorylation and the ETC: Section I.E, II, III, Chapter 31: Synthesis of Fatty Acids: Section I.A.B, IV, V.
Figures
Grey, Kindred, Figure 4.10 Overview of the TCA cycle. 2021. https://archive.org/details/4.10-new. CC BY 4.0.
Grey, Kindred, Figure 4.11 Substrates produced by the TCA cycle. 2021. https://archive.org/details/4.11_20210924. CC BY 4.0.
Lieberman M, Peet A. Figure 4.12 Anaplerotic reactions of the TCA cycle. Adapted under Fair Use from Marks’ Basic Medical Biochemistry. 5th Ed. pp 473. Figure 23.18 Major anaplerotic pathways of the tricarboxylic acid (TCA) cycle. 2017.
Lieberman M, Peet A. Figure 4.13 Regulation of the TCA cycle. Adapted under Fair Use from Marks’ Basic Medical Biochemistry. 5th Ed. pp 468. Figure 23.11 Major regulatory interaction in the tricarboxylic acid (TCA) cycle. 2017. Added ion channel by Léa Lortal from the Noun Project.
4.3 Electron Transport Chain (ETC)
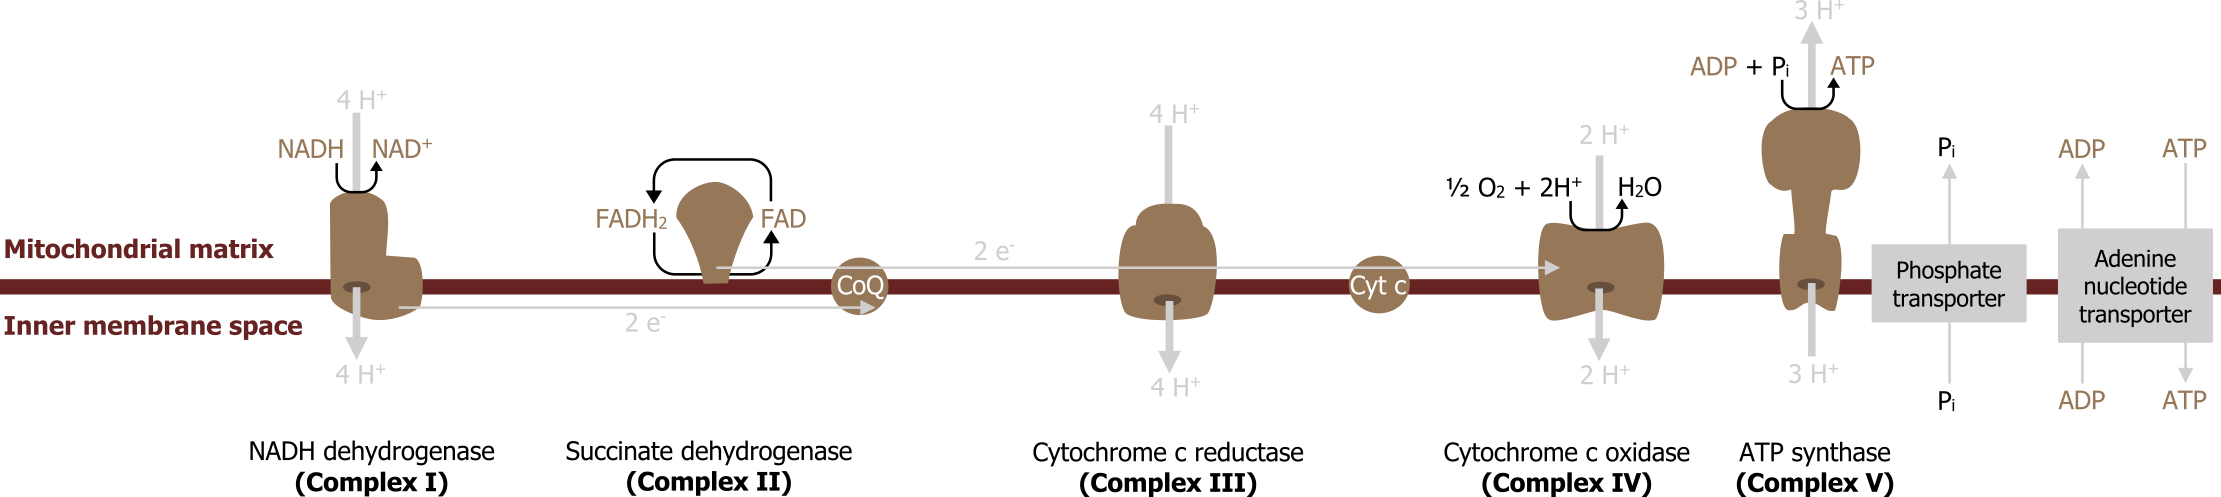
In the production of NADH and FADH2 by the TCA cycle, β-oxidation or glycolysis is funneled directly into the electron transport chain (ETC) where each of these reduced coenzymes will donate two electrons to electron carriers. As the electrons are passed down their oxidation gradient, some of the energy is lost, but much of this energy is used to pump protons into the intermembrane space of the mitochondria.
The process of oxidative phosphorylation (figure 4.14) involves the coupling of electron transfer with the pumping of protons to generate an electrochemical gradient across the mitochondrial membrane. With the exception of CoQ all proteins are bound to the mitochondria membrane, and electrons are passed between metal containing cytochromes. Complex I and Complex II function in parallel (rather than series) with each other having preference for NADH or FADH2, respectively. Complex II (succinate dehydrogenase) is not required for oxidative phosphorylation because it does not span the mitochondrial membrane (figure 4.14). Electrons are passed down an electrochemical gradient, and molecular oxygen is the final electron acceptor (molecular oxygen).
There are site specific inhibitors of the ETC to be aware of, and these will disrupt electron flow reducing overall ATP production.
Inhibitors
Inhibitors block oxidation and reduce both ATP generation and oxygen consumption; this is in contrast to uncouplers, which disrupt the mitochondrial membrane and reduce ATP production but increase oxygen consumption.
A common inhibitor of the ETC is carbon monoxide; this will bind to Complex IV and therefore halt the passing of electrons. Without electrons passing through the complexes, the pumping of protons is diminished and ATP is not produced. Other common inhibitors are cyanide (Complex IV), rotenone (Complex I), antimycin C (Complex III), and oligomycin, which is a Complex V inhibitor.
Uncouplers
Uncoupling of the ETC by the addition of agents such as dinitrophenol have different consequences. Uncouplers disrupt the permeability of the inner membrane (either physically or chemically) and dissipate the proton gradient.
In these cases, the release of protons across the membrane is coupled with the release of heat, rather than harnessed in the form of a phosphate bond. NADH oxidation continues rapidly, oxygen consumption is increased, and ATP production decreases. Valinomycin is another common uncoupler.
Biological uncoupling through the expression of uncoupling proteins (UPC) is also likely. These proteins form a physical pore within the mitochondrial membrane allowing the proton gradient to equilibrate. In brown fat, this nonshivering thermogenesis is a means of generating heat, and other members of this protein family (UPC) are expressed in various tissues but have similar roles.
4.3 References and resources
Text
Ferrier, D. R., ed. Lippincott Illustrated Reviews: Biochemistry, 7th ed. Philadelphia: Wolters Kluwer Health/Lippincott Williams & Wilkins, 2017, Chapter 6: Bioenergetics and Oxidative Phosphorylation: Section V, VI, Chapter 8: Introduction to Metabolism and Glycolysis, Chapter 9: TCA Cycle and Pyruvate Dehydrogenase Complex: Section IIA, IIB, Chapter 11: Glycogen Metabolism: Section V, VI, Chapter 16: Fatty Acid Ketone Body and TAG Metabolism: Section II, IV, V, Chapter 23: Metabolic Effect of Insulin and Glucagon, Chapter 25: Diabetes Mellitus.
Le, T., and V. Bhushan. First Aid for the USMLE Step 1, 29th ed. New York: McGraw Hill Education, 2018, 72–78, 85–89.
Lieberman, M., and A. Peet, eds. Marks’ Basic Medical Biochemistry: A Clinical Approach, 5th ed. Philadelphia: Wolters Kluwer Health/Lippincott Williams & Wilkins, 2018, Chapter 2: The Fed or Absorptive State, Chapter 19: Basic Concepts of Regulation: Section IV.A.1.2, Chapter 20: Cellular Bioenergetics, Chapter 22: Generation of ATP from Glucose: Section I.A.B.C, III, Chapter 24: Oxidative Phosphorylation and the ETC: Section I.E, II, III, Chapter 31: Synthesis of Fatty Acids: Section I.A.B, IV, V.
Figures
Grey, Kindred, Figure 4.14 Overview of the electron transport chain (ETC). 2021. https://archive.org/details/4.14_20210924. CC BY 4.0.
4.4 Fatty Acid Synthesis
The synthesis of fatty acids is an anabolic pathway that occurs in the cytosol under fed conditions. As glucose is taken up by the liver and the flux through the TCA cycle increases, excess citrate is removed via the citrate shuttle. Once in the cytosol, citrate is cleaved by citrate lyase back into oxaloacetate (OAA) and acetyl-CoA. The OAA can be reduced to malate by cytosolic malate dehydrogenase and decarboxylated by malic enzyme producing pyruvate and NADPH (figure 4.15).
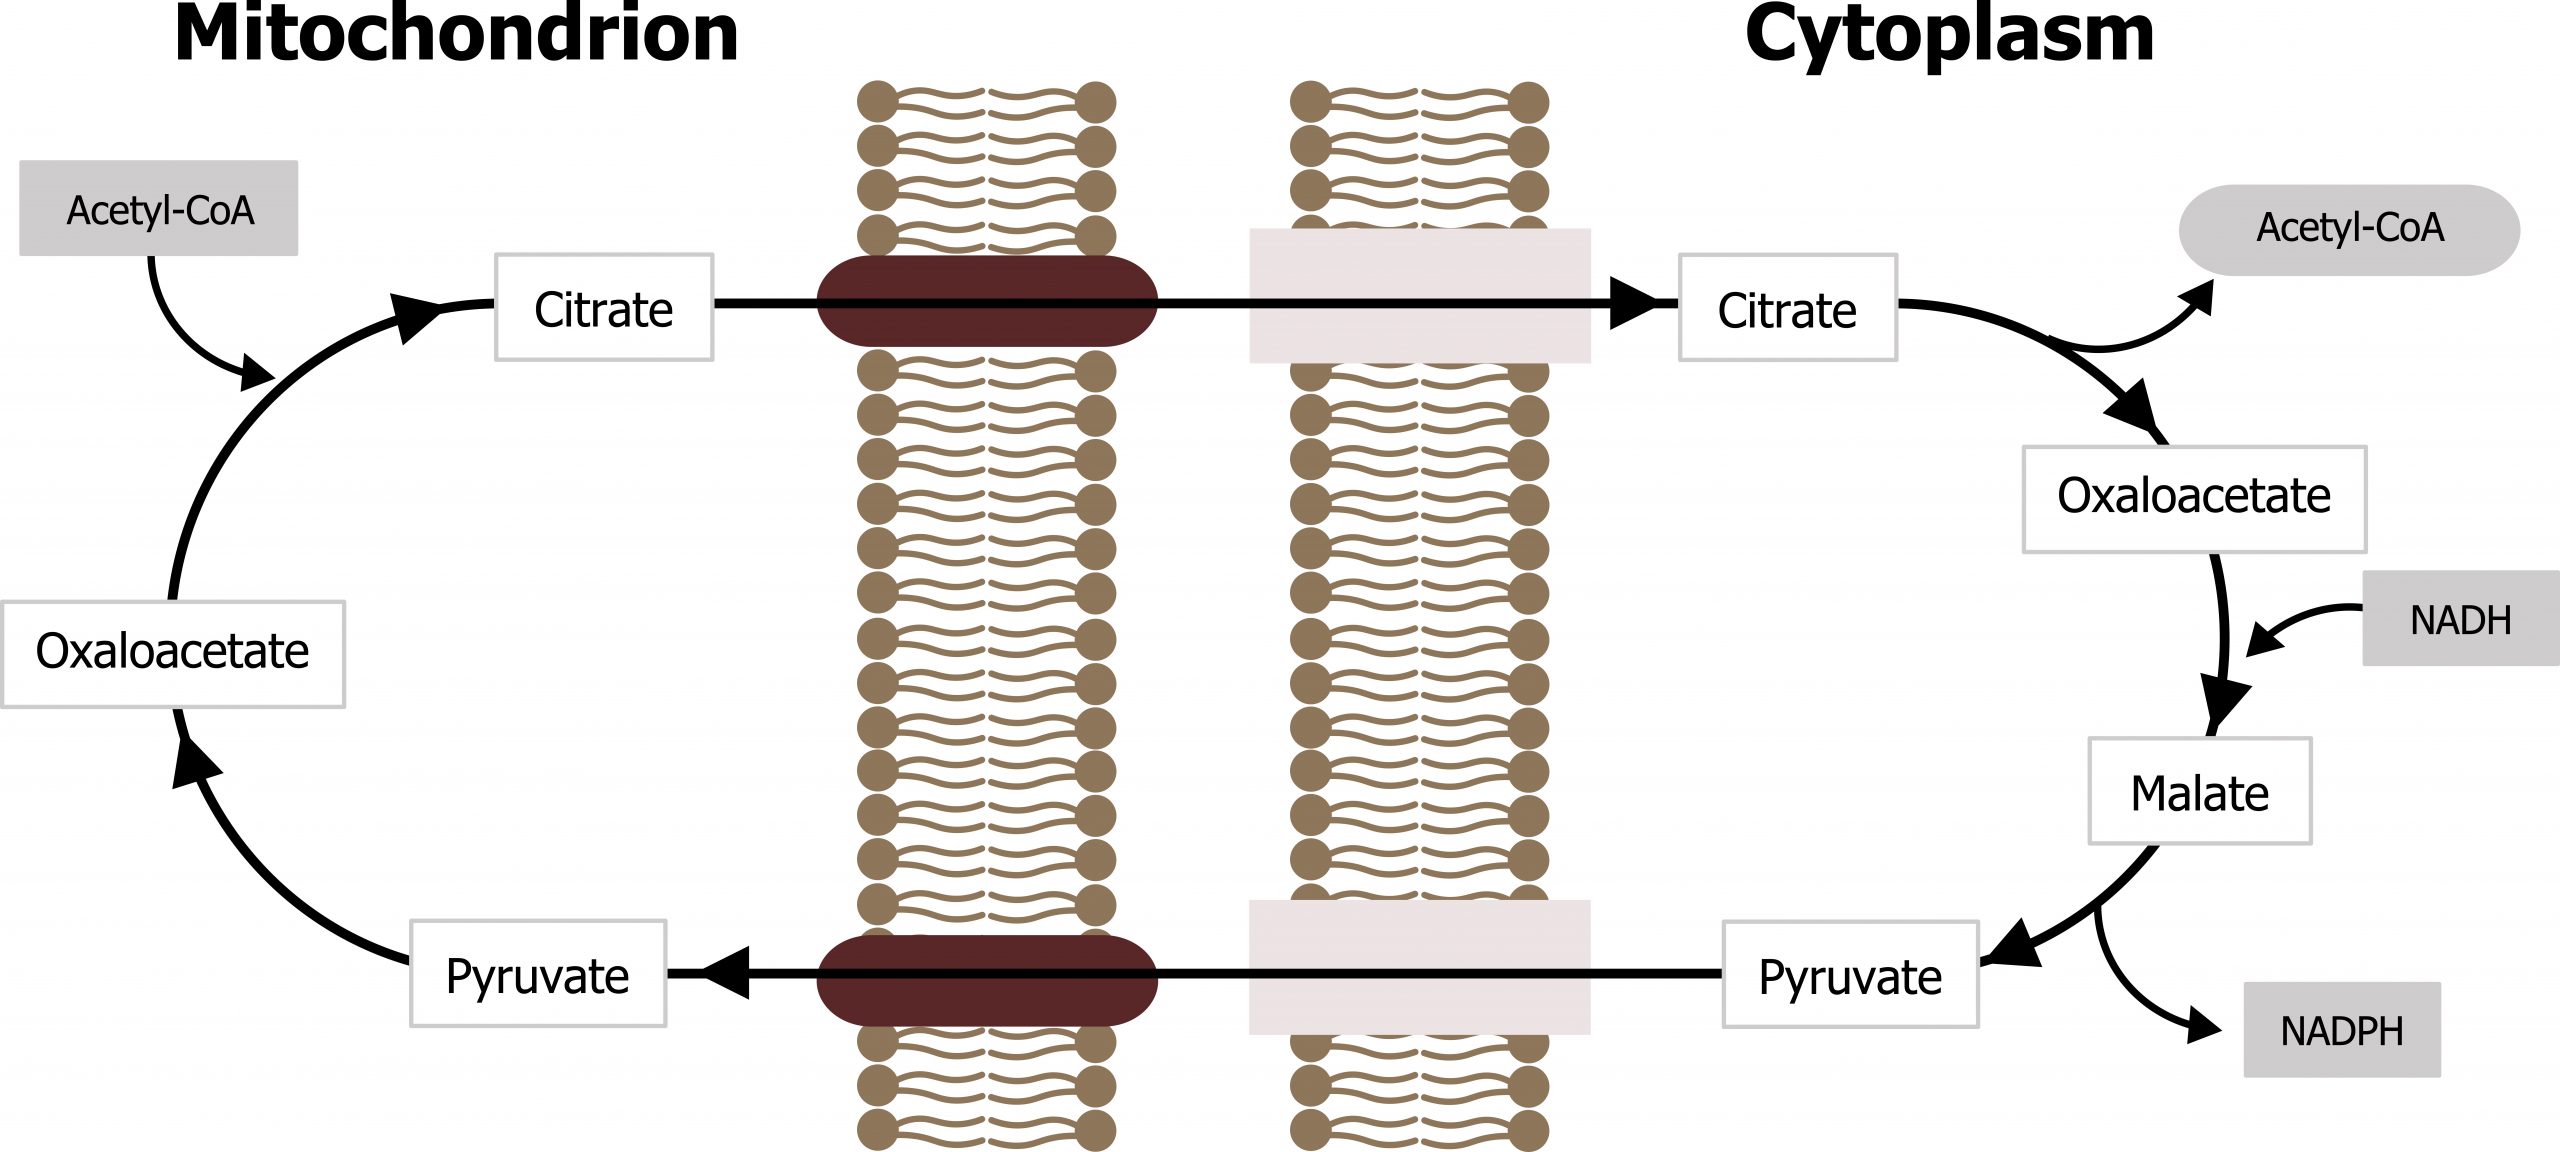
The NADPH generated through this process is necessary for fatty acid synthesis. This is one of the primary pathways that produces NADPH, and the other is the oxidative portion of the pentose pathway.
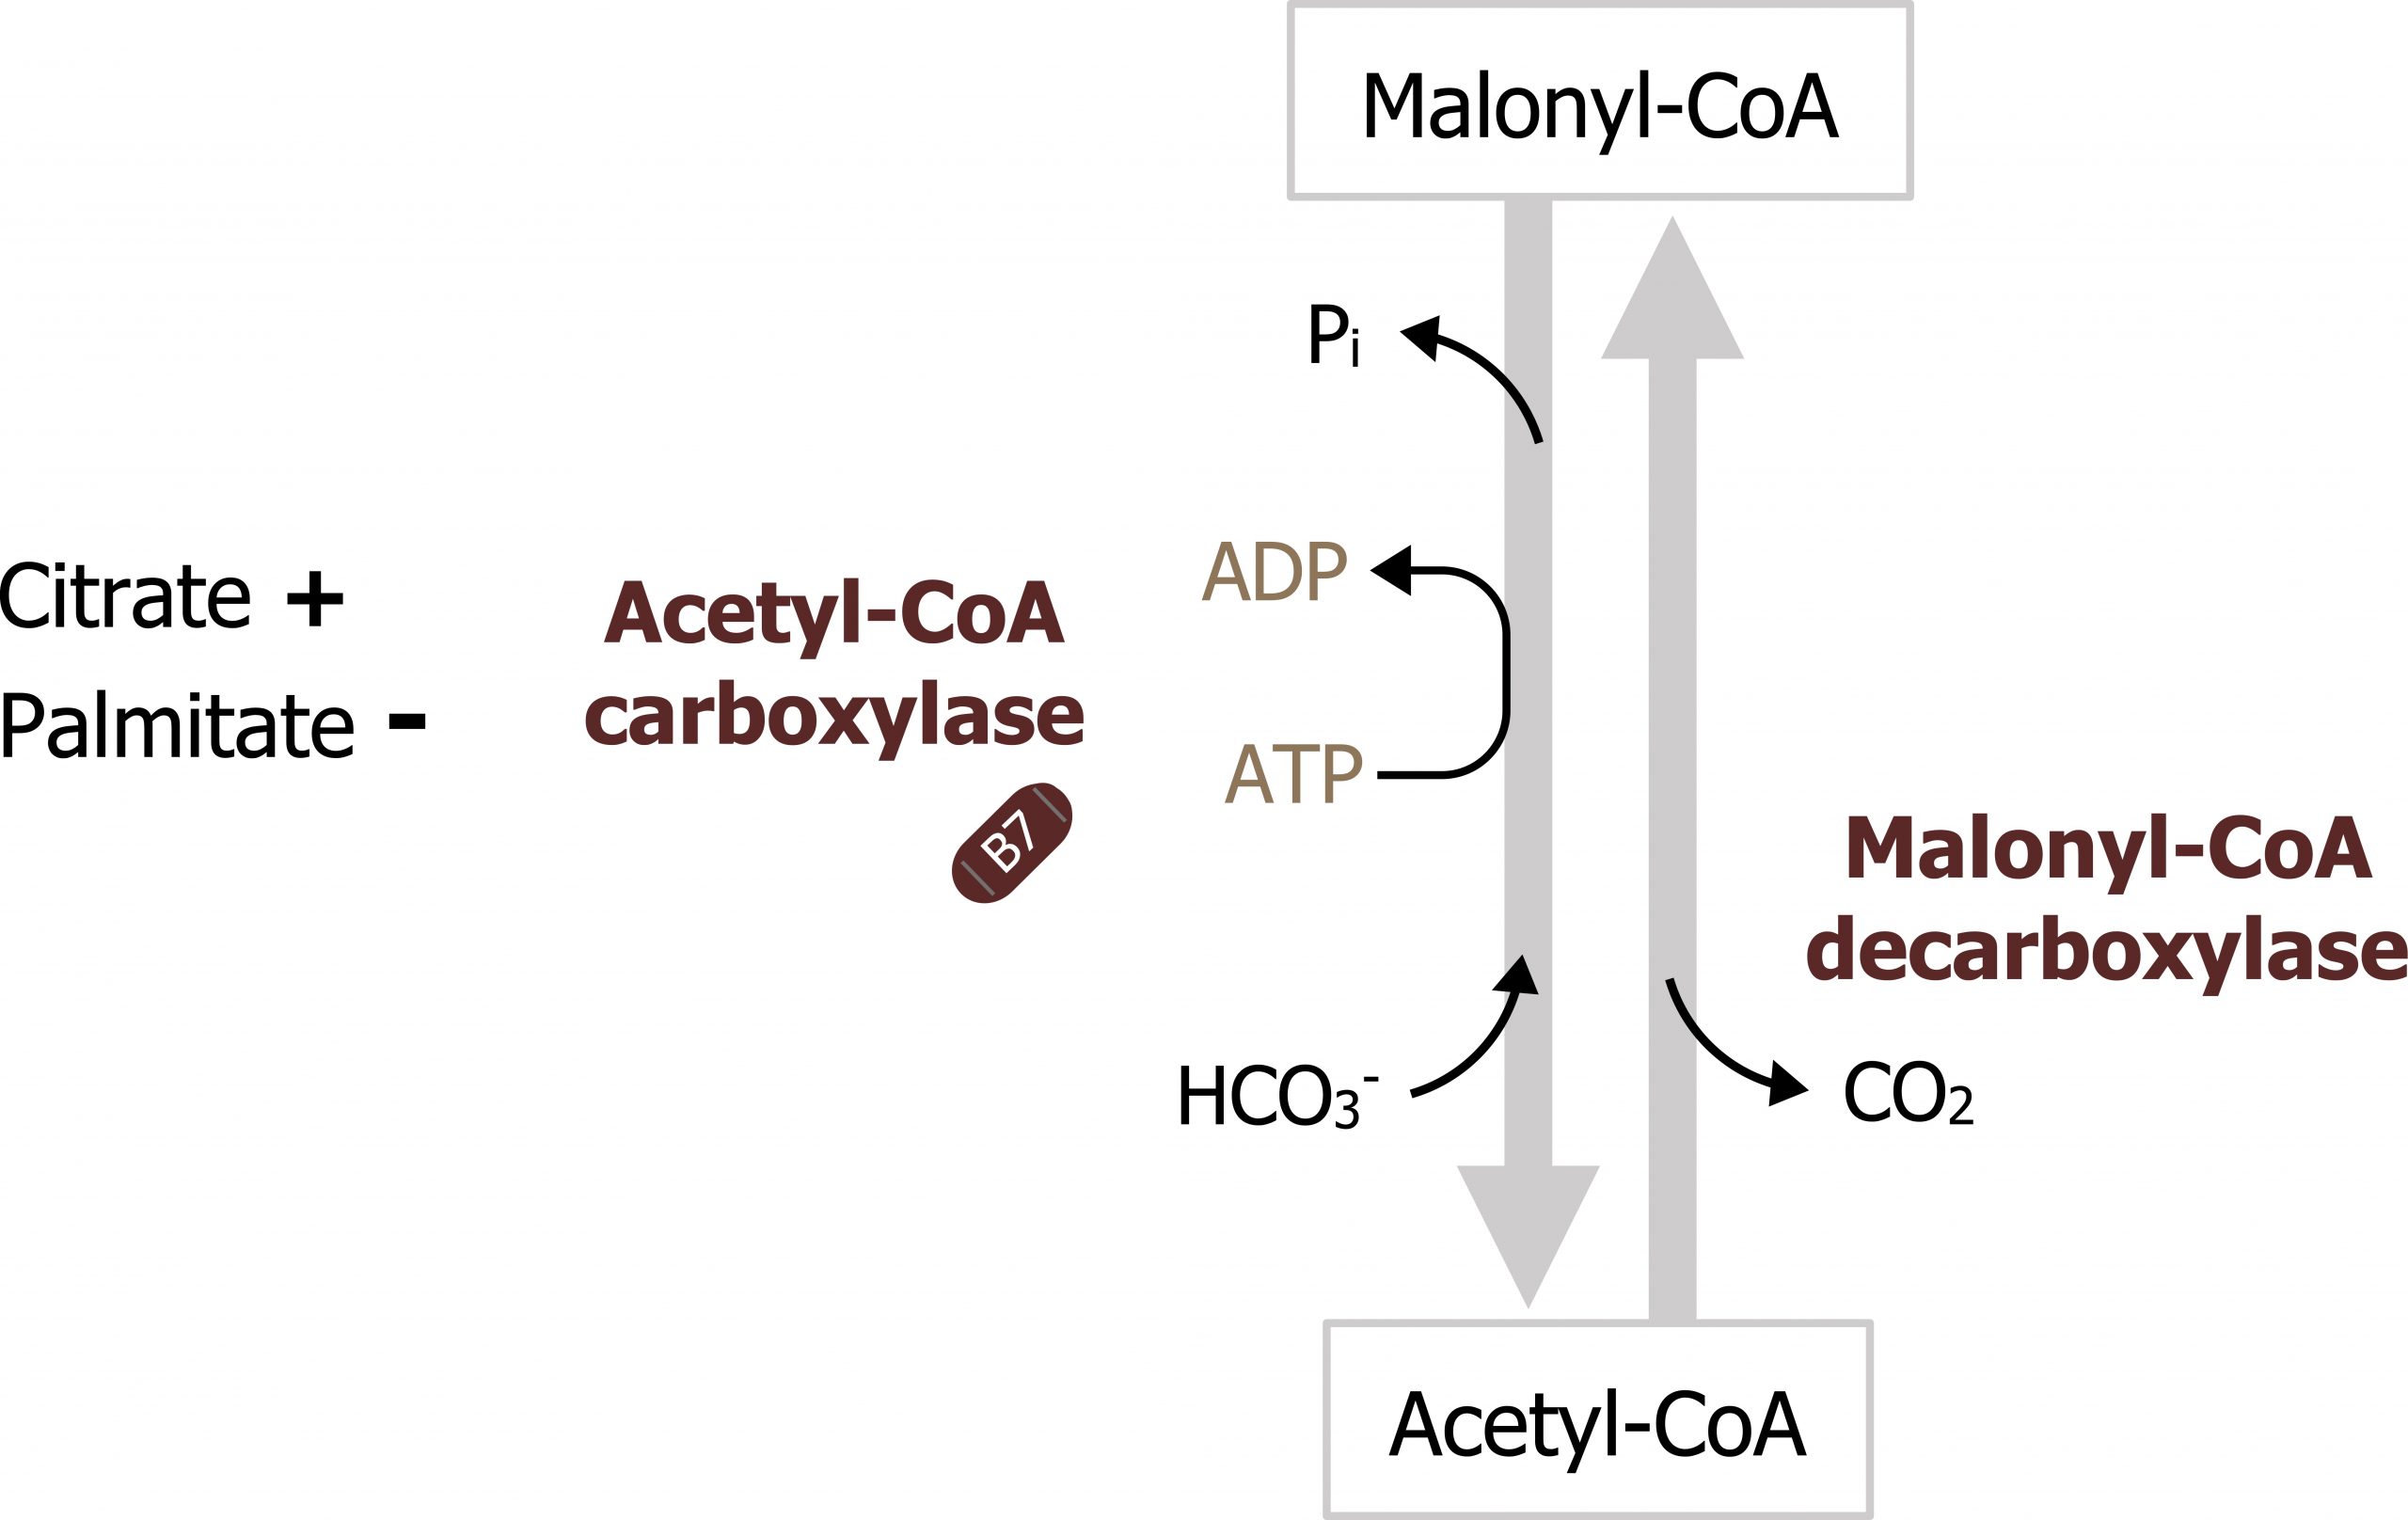
The process of fatty acid synthesis starts with the carboxylation of acetyl-CoA to form malonyl-CoA (figures 4.16 and 4.17). The enzyme involved, acetyl-CoA carboxylase, is the regulatory enzyme for this pathway and requires biotin as a cofactor. After the initial priming of fatty acid synthase with acetyl-CoA, all other carbon units are added to the elongating fatty acid chain in the form of malonyl-CoA. You will see later that this intermediate is also a key inhibitor of β-oxidation.
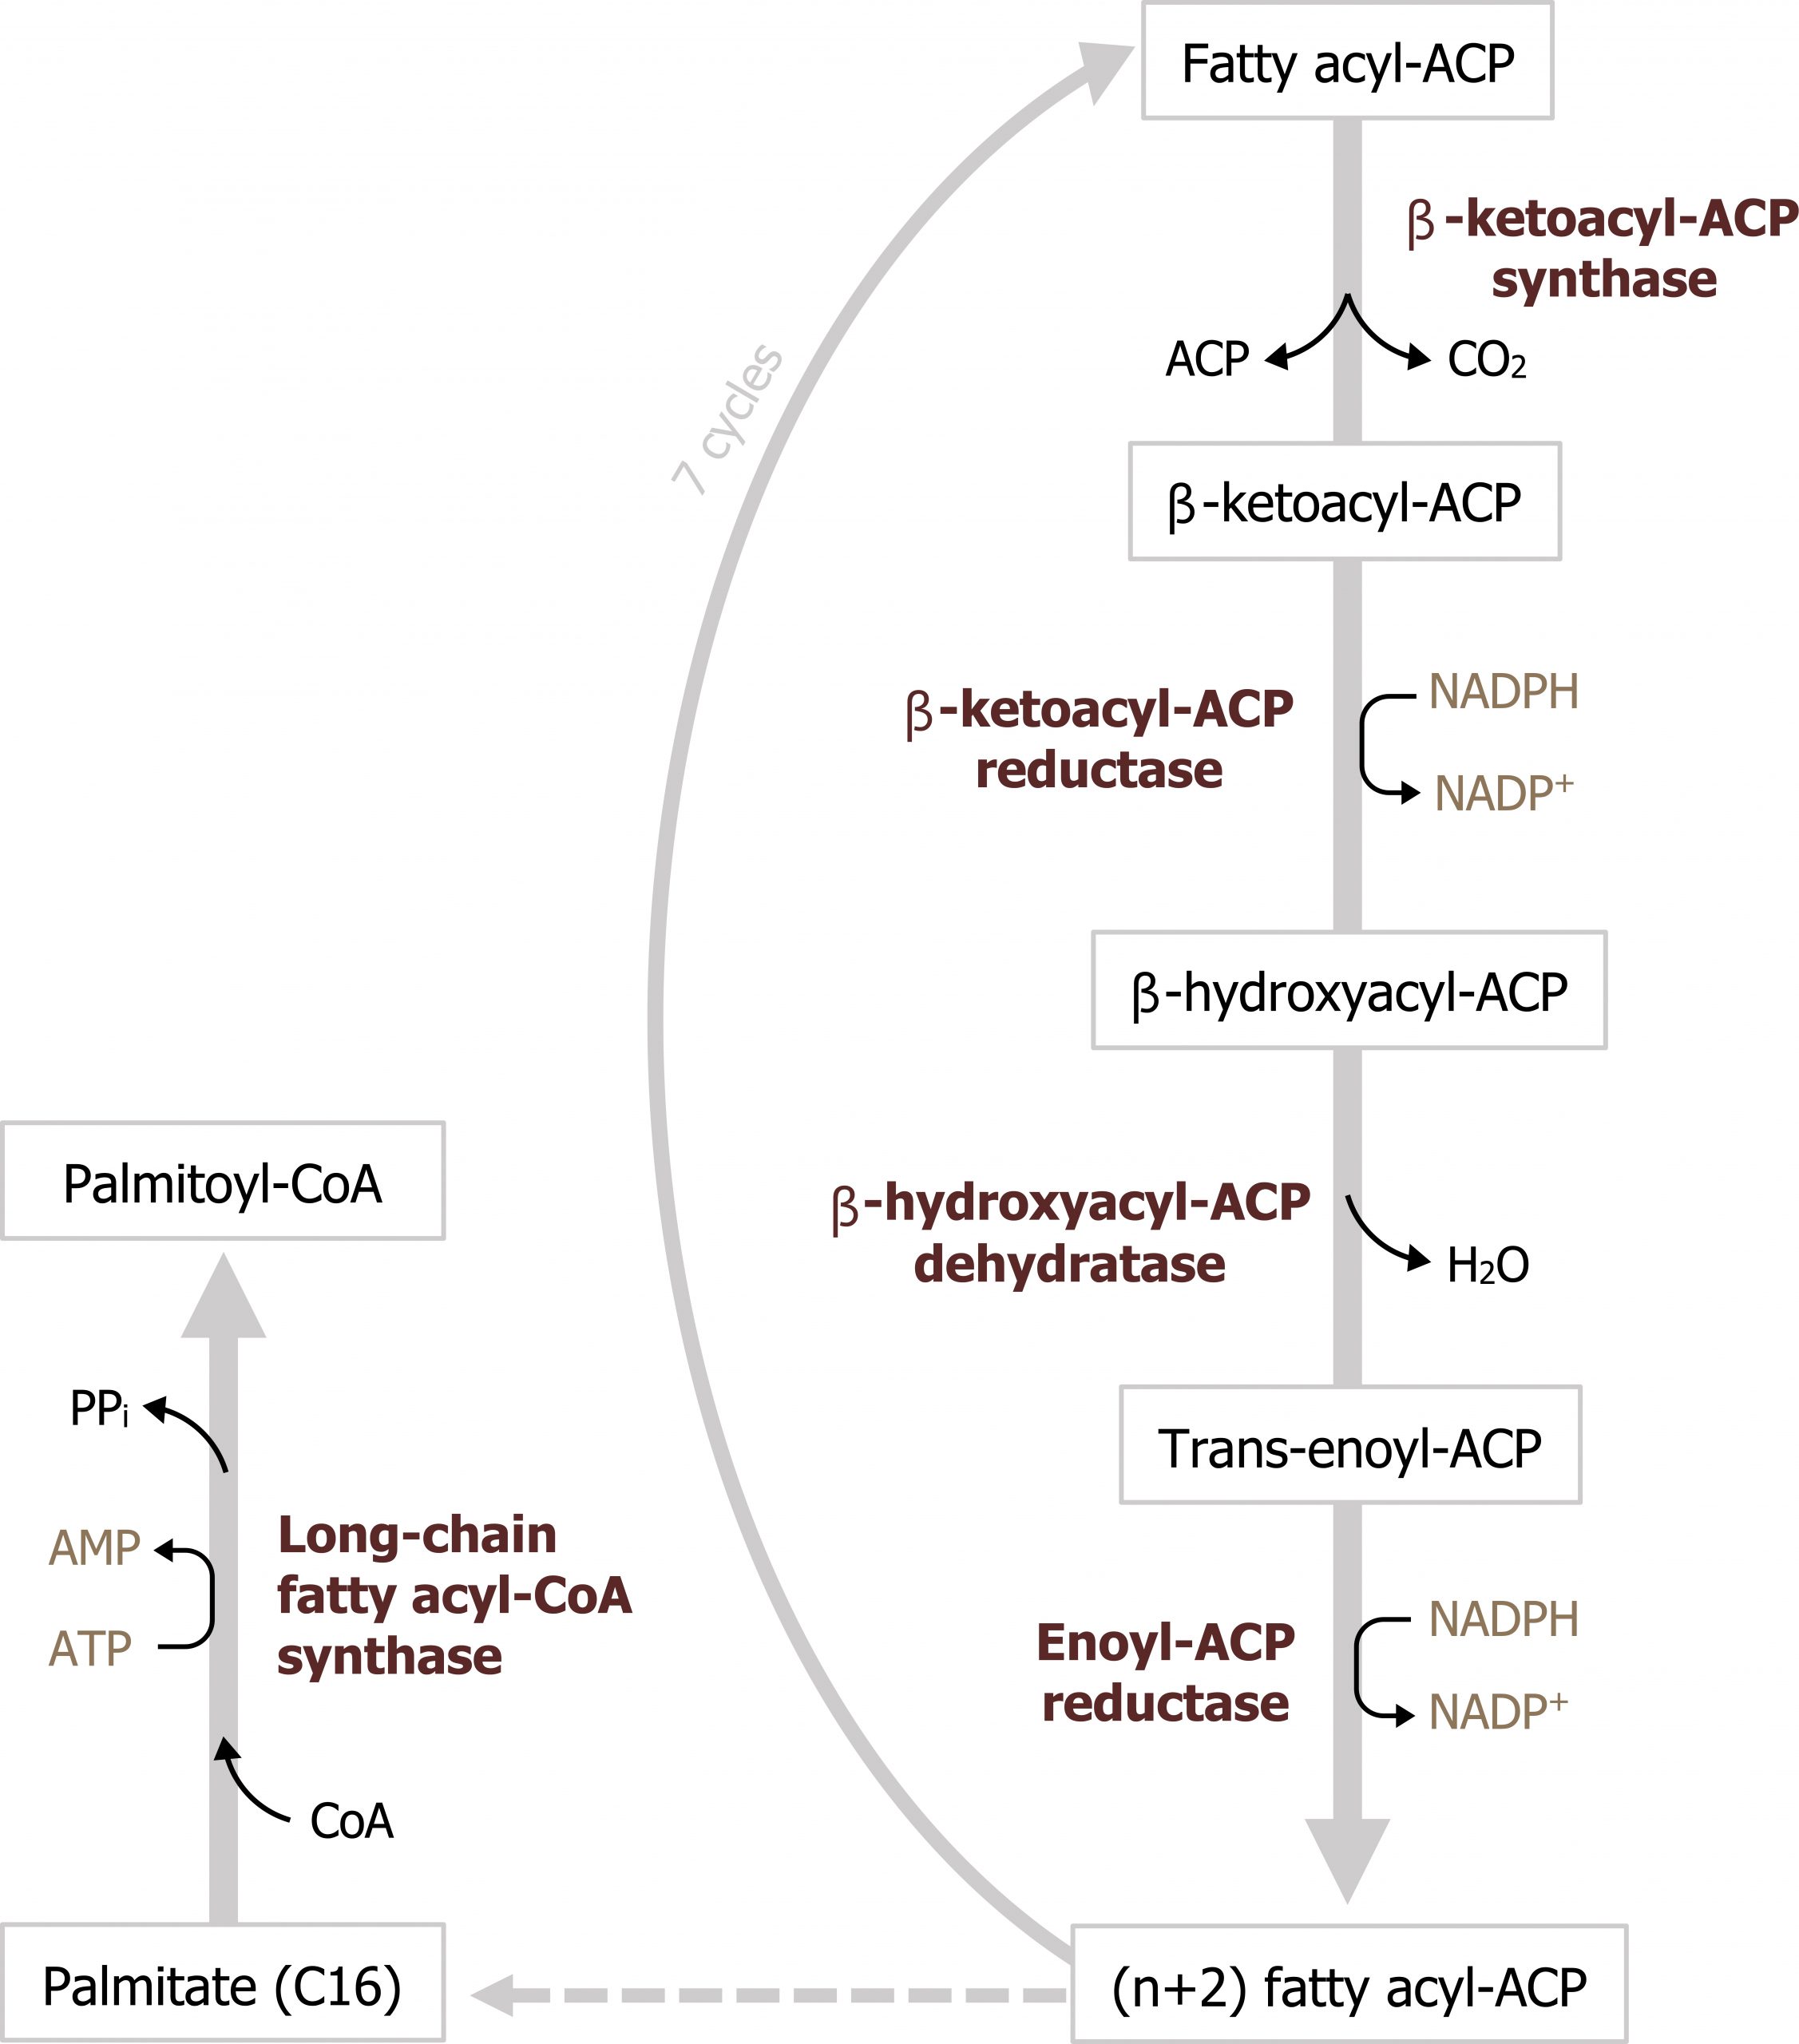
The synthesis of fatty acids by fatty acid synthase initially starts with the transfer of an acetyl moiety from acetyl-CoA to the acyl carrier protein within fatty acid synthase. Malonyl-CoA is added to the acetyl group and decarboxylated to form a four-carbon β-keto chain. From here, the fatty acid chain is elongated through a series of dehydration and reduction reactions, which use NADPH as a reducing agent. The final product is palmitate, a C-16 molecule (figure 4.16). Fatty acids are not stored in the liver and must be packaged into VLDL particles for transport to peripheral tissues for storage. To produce VLDL particles, the newly synthesized fatty acids are packaged into triacylglycerols (TAGs). TAG synthesis can take place in both the liver and adipose tissue. Synthesis requires glycerol 3-phosphate, which can be derived from glycolysis or from the phosphorylation of glycerol using glycerol kinase in the liver. Three fatty acyl-CoA groups react with the glycerol 3-phosphate to form a TAG. TAGs, along with cholesterol, are packaged into VLDLs distributed into circulation (section 6.2).
Regulation of fatty acid synthesis
Acetyl-CoA carboxylase is the regulatory enzyme for fatty acid synthesis. This enzyme is regulated both allosterically and through covalent modification. It is allosterically activated by high levels of citrate and inhibited by its product, fatty acyl-CoA. It can also be inhibited by elevated levels of glucagon, epinephrine, and adenosine monophosphate (AMP)-activated protein kinase phosphorylation. Insulin will stimulate the dephosphorylation and activation of the enzyme such that it can be active in the fed state (figure 4.17).
Summary of pathway regulation
| Metabolic pathway | Major regulatory enzyme(s) | Allosteric effectors | Hormonal effects |
|---|---|---|---|
| Fatty acid synthesis | Acetyl-CoA carboxylase | Citrate (+) | Insulin ↑ |
| Fatty acid synthesis | Acetyl-CoA carboxylase | Palmitate (-) | Glucagon ↓ |
Table 4.3: Summary of pathway regulation.
4.4 References and resources
Text
Ferrier, D. R., ed. Lippincott Illustrated Reviews: Biochemistry, 7th ed. Philadelphia: Wolters Kluwer Health/Lippincott Williams & Wilkins, 2017, Chapter 6: Bioenergetics and Oxidative Phosphorylation: Section V, VI, Chapter 8: Introduction to Metabolism and Glycolysis, Chapter 9: TCA Cycle and Pyruvate Dehydrogenase Complex: Section IIA, IIB, Chapter 11: Glycogen Metabolism: Section V, VI, Chapter 16: Fatty Acid Ketone Body and TAG Metabolism: Section II, IV, V, Chapter 23: Metabolic Effect of Insulin and Glucagon, Chapter 25: Diabetes Mellitus.
Le, T., and V. Bhushan. First Aid for the USMLE Step 1, 29th ed. New York: McGraw Hill Education, 2018, 72–78, 85–89.
Lieberman, M., and A. Peet, eds. Marks’ Basic Medical Biochemistry: A Clinical Approach, 5th ed. Philadelphia: Wolters Kluwer Health/Lippincott Williams & Wilkins, 2018, Chapter 2: The Fed or Absorptive State, Chapter 19: Basic Concepts of Regulation: Section IV.A.1.2, Chapter 20: Cellular Bioenergetics, Chapter 22: Generation of ATP from Glucose: Section I.A.B.C, III, Chapter 24: Oxidative Phosphorylation and the ETC: Section I.E, II, III, Chapter 31: Synthesis of Fatty Acids: Section I.A.B, IV, V.
Figures
Grey, Kindred, Figure 4.15 Citrate shuttle reaction moves citrate from the mitochondria to the cytosol for fatty acid synthesis. 2021. https://archive.org/details/4.15-new. CC BY 4.0.
Grey, Kindred, Figure 4.16 Fatty acid synthesis is an iterative process which begins with the transfer of an acetyl moiety from acetyl-CoA to fatty acid synthase, following this activation, carbons are added to the growing chain in the form of malonyl-CoA. 2021. https://archive.org/details/4.16_20210924. CC BY 4.0.
Grey, Kindred, Figure 4.17 Regulatory reaction of fatty acid synthesis. The synthesis of malonyl-CoA by acetyl-CoA carboxylase is highly regulated within the cytosol. 2021. https://archive.org/details/4.17-new. CC BY 4.0.
4.5 Glycogen Synthesis
Glycogen synthesis is the process of storing glucose and occurs primarily in the liver and the skeletal muscle. The metabolic pathways in these tissues are similar, but the utility of glycogen stores is different. Briefly, liver glycogen is catabolized primarily in response to elevated glucagon, and the glucose 6-phosphate generated is dephosphorylated and released into circulation. In contrast, muscle glycogen is only used by the muscle itself; muscle lacks glucose 6-phosphatase and glucose 6-phosphate released from muscle glycogen is oxidized in glycolysis. Although discussed here as a point of comparison, glycogenolysis is a fasted state pathway and occurs in response to glucagon and epinephrine. This will be discussed in section 5.1.
Glycogen synthesis
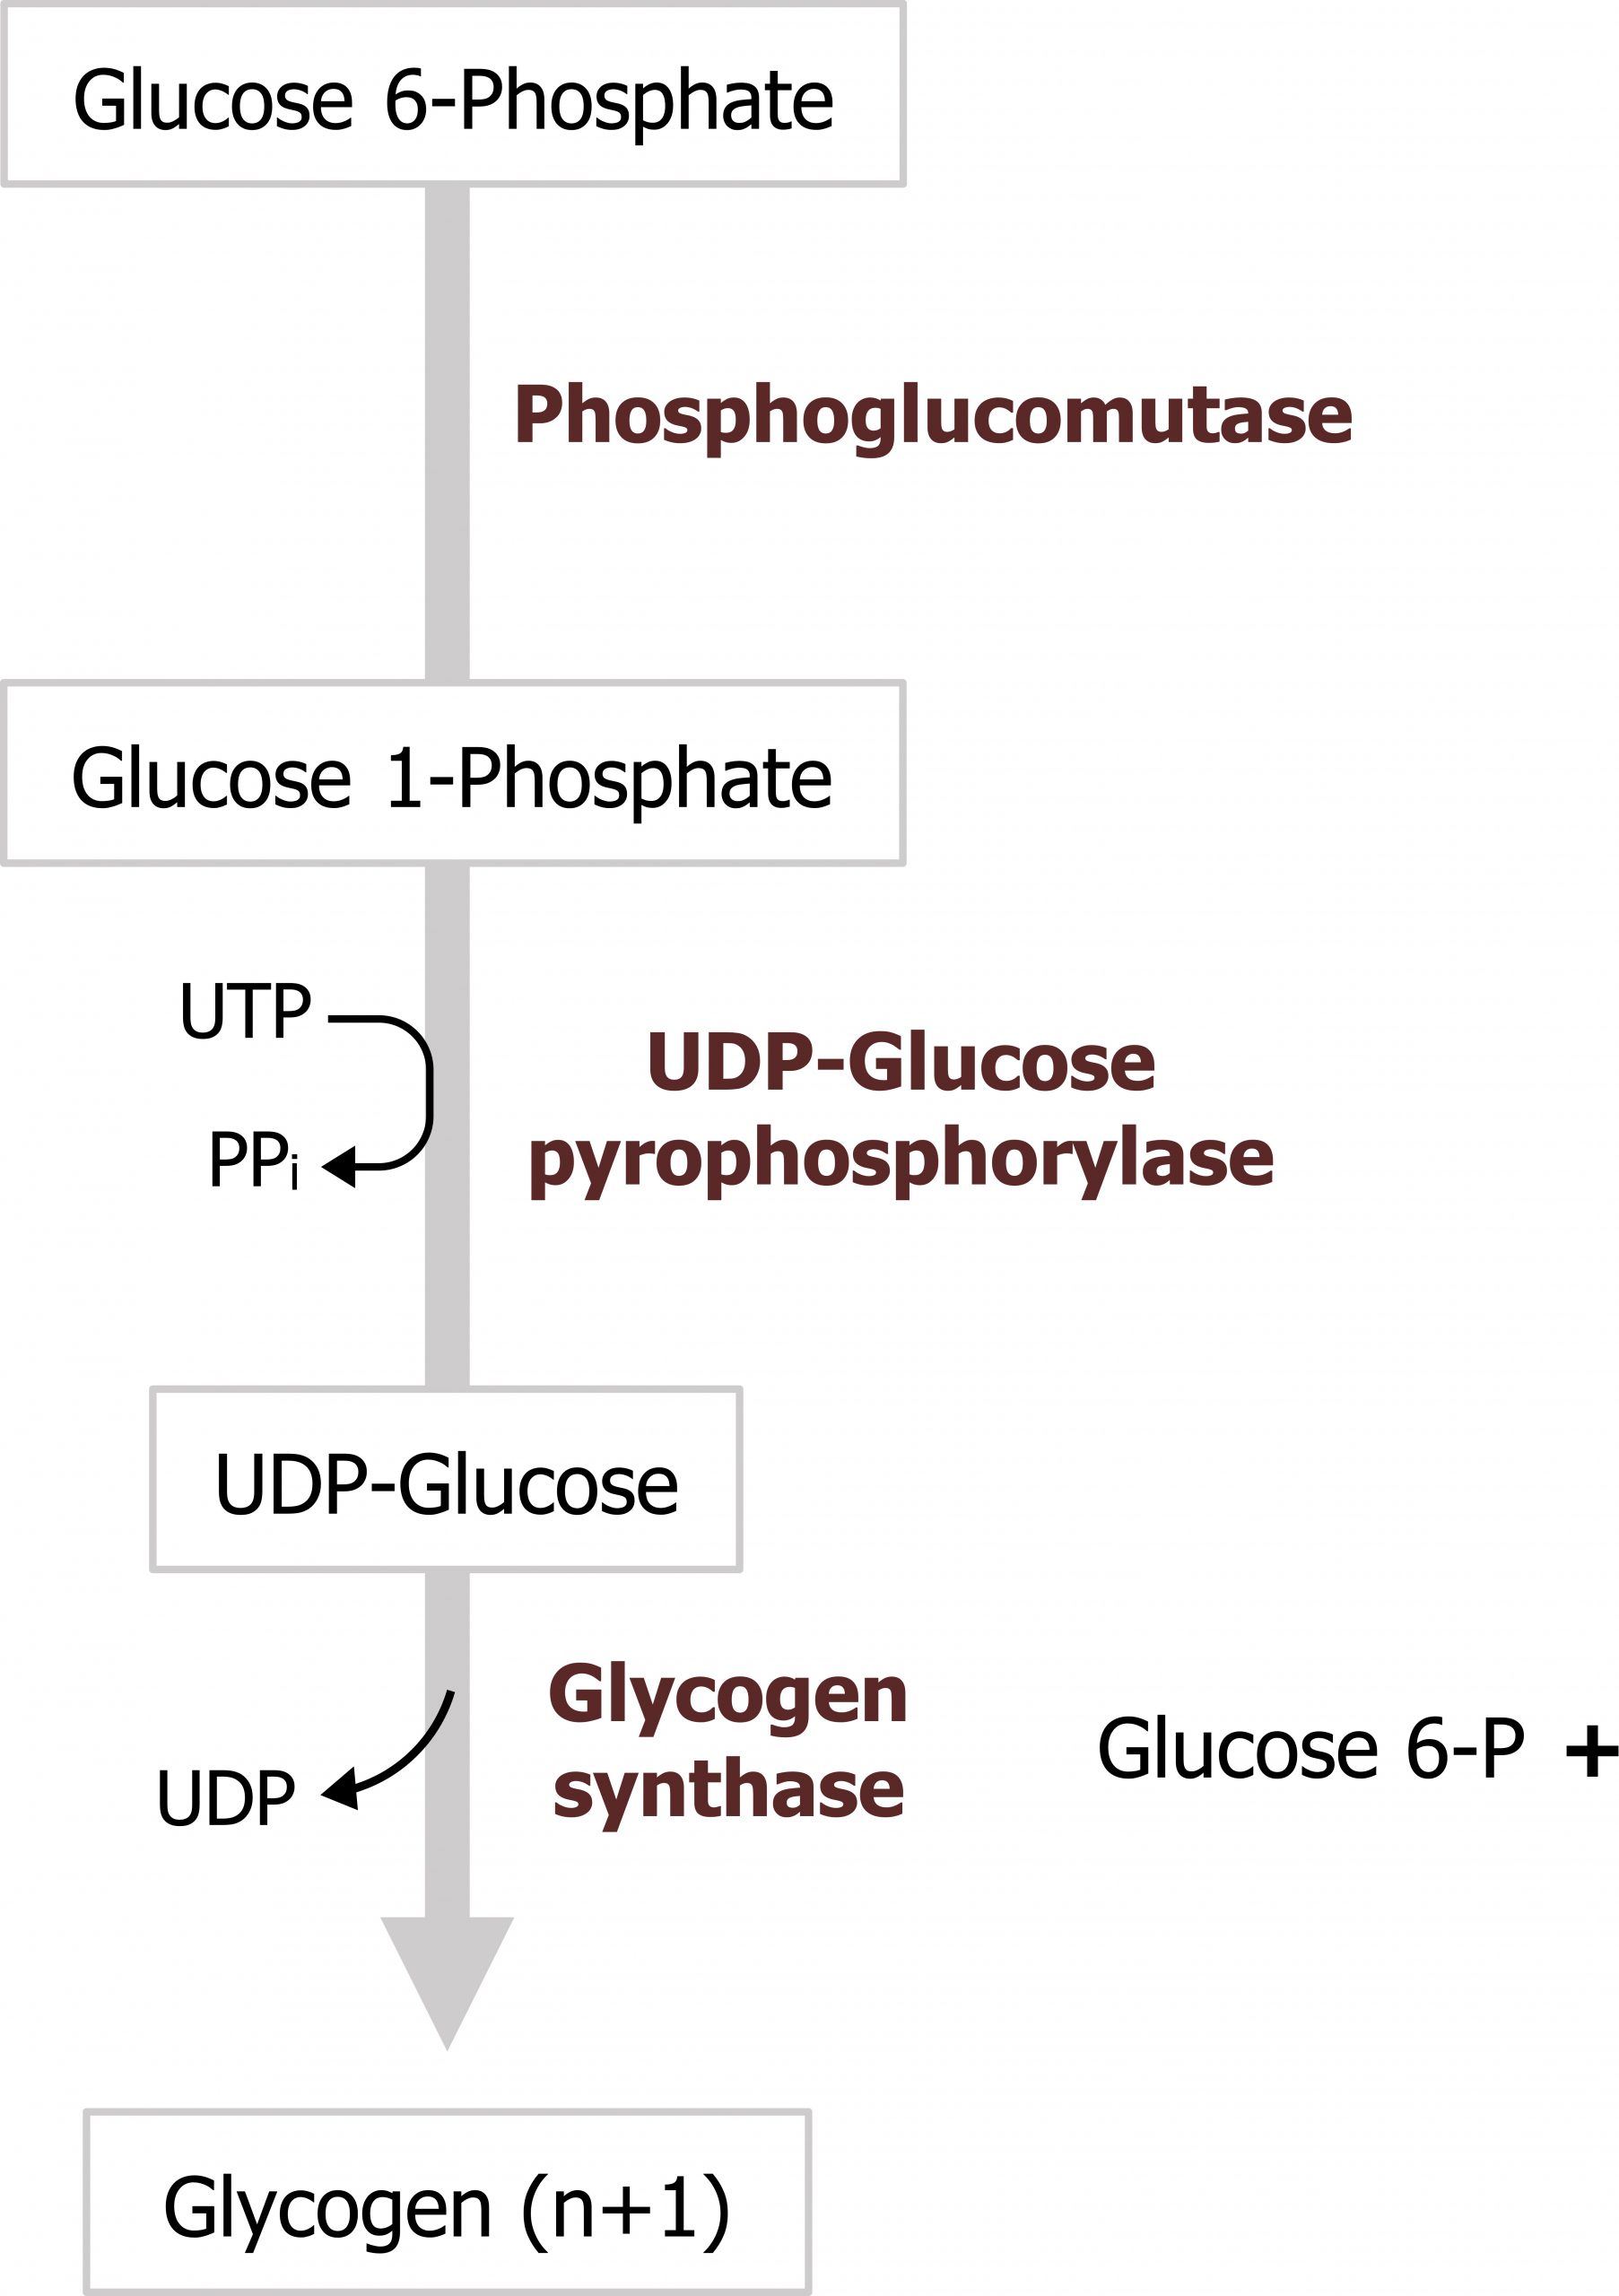
Initially glucose 6-phosphate, is isomerized to glucose 1-phosphate. UDP-glucose pyrophosphorylase synthesizes UDP-glucose from glucose 1-phosphate and UTP, and this is the source of all the glycosyl residues added to the growing glycogen chain (figure 4.18). Glycogen synthase is the regulatory enzyme for the pathway and is responsible for linking glycosyl residues in a 1,4 linkage. The reaction typically occurs on existing glycogen stores; however, in the absence of any stored glycogen the reaction can occur on the protein primer, glycogenin.
Regulation of glycogen synthesis
Glycogen synthesis is regulated by a single enzyme, glycogen synthase. This enzyme is primarily regulated through covalent modification. It is active when dephosphorylated and inactive when phosphorylated. The phosphorylation/dephosphorylation is facilitated by glucagon and insulin levels, respectively (table 4.4).
Summary of pathway regulation
| Metabolic pathway | Major regulatory enzyme(s) | Allosteric effectors | Hormonal effects |
|---|---|---|---|
| Glycogenesis | Glycogen synthase | Glucose 6-P (+) | Insulin ↑ Glucagon ↓ (liver) Epi ↓ (muscle) |
| Glycogenolysis (see section 5.1) | Glycogen phosphorylase | AMP (+) muscle Ca2+ in muscle |
Glucagon ↑ (liver) Epi ↑ (muscle) |
Table 4.4: Summary of pathway regulation.
4.5 References and resources
Text
Ferrier, D. R., ed. Lippincott Illustrated Reviews: Biochemistry, 7th ed. Philadelphia: Wolters Kluwer Health/Lippincott Williams & Wilkins, 2017, Chapter 6: Bioenergetics and Oxidative Phosphorylation: Section V, VI, Chapter 8: Introduction to Metabolism and Glycolysis, Chapter 9: TCA Cycle and Pyruvate Dehydrogenase Complex: Section IIA, IIB, Chapter 11: Glycogen Metabolism: Section V, VI, Chapter 16: Fatty Acid Ketone Body and TAG Metabolism: Section II, IV, V, Chapter 23: Metabolic Effect of Insulin and Glucagon, Chapter 25: Diabetes Mellitus.
Le, T., and V. Bhushan. First Aid for the USMLE Step 1, 29th ed. New York: McGraw Hill Education, 2018, 72–78, 85–89.
Lieberman, M., and A. Peet, eds. Marks’ Basic Medical Biochemistry: A Clinical Approach, 5th ed. Philadelphia: Wolters Kluwer Health/Lippincott Williams & Wilkins, 2018, Chapter 2: The Fed or Absorptive State, Chapter 19: Basic Concepts of Regulation: Section IV.A.1.2, Chapter 20: Cellular Bioenergetics, Chapter 22: Generation of ATP from Glucose: Section I.A.B.C, III, Chapter 24: Oxidative Phosphorylation and the ETC: Section I.E, II, III, Chapter 31: Synthesis of Fatty Acids: Section I.A.B, IV, V.
Figures
Grey, Kindred, Figure 4.18 Glycogen synthesis. 2021. https://archive.org/details/4.18_20210924. CC BY 4.0.
