15 Cellular Signaling
Learning Objectives
- Outline the general characteristics of signal transduction systems.
- Describe the mechanism by which G protein coupled receptors produce secondary messengers.
- Describe the points at which cascades can be regulated by phosphatases and inhibitors.
- Describe phosphatidylinositol-derived second messengers and the functions of Ca2+ as a second messenger and the downstream effectors that both activate.
- Describe the characteristics of the receptor tyrosine kinase signaling pathway.
- Describe the signal transduction principles used in regulating glucose levels (pathways initiated by glucagon, epinephrine, and insulin).
- Describe the general processes of cellular apoptosis
- Describe the physiological role of membrane potential in signal transduction.
15.1 Cell Communication
Cell communication is a fundamental homeostatic process.
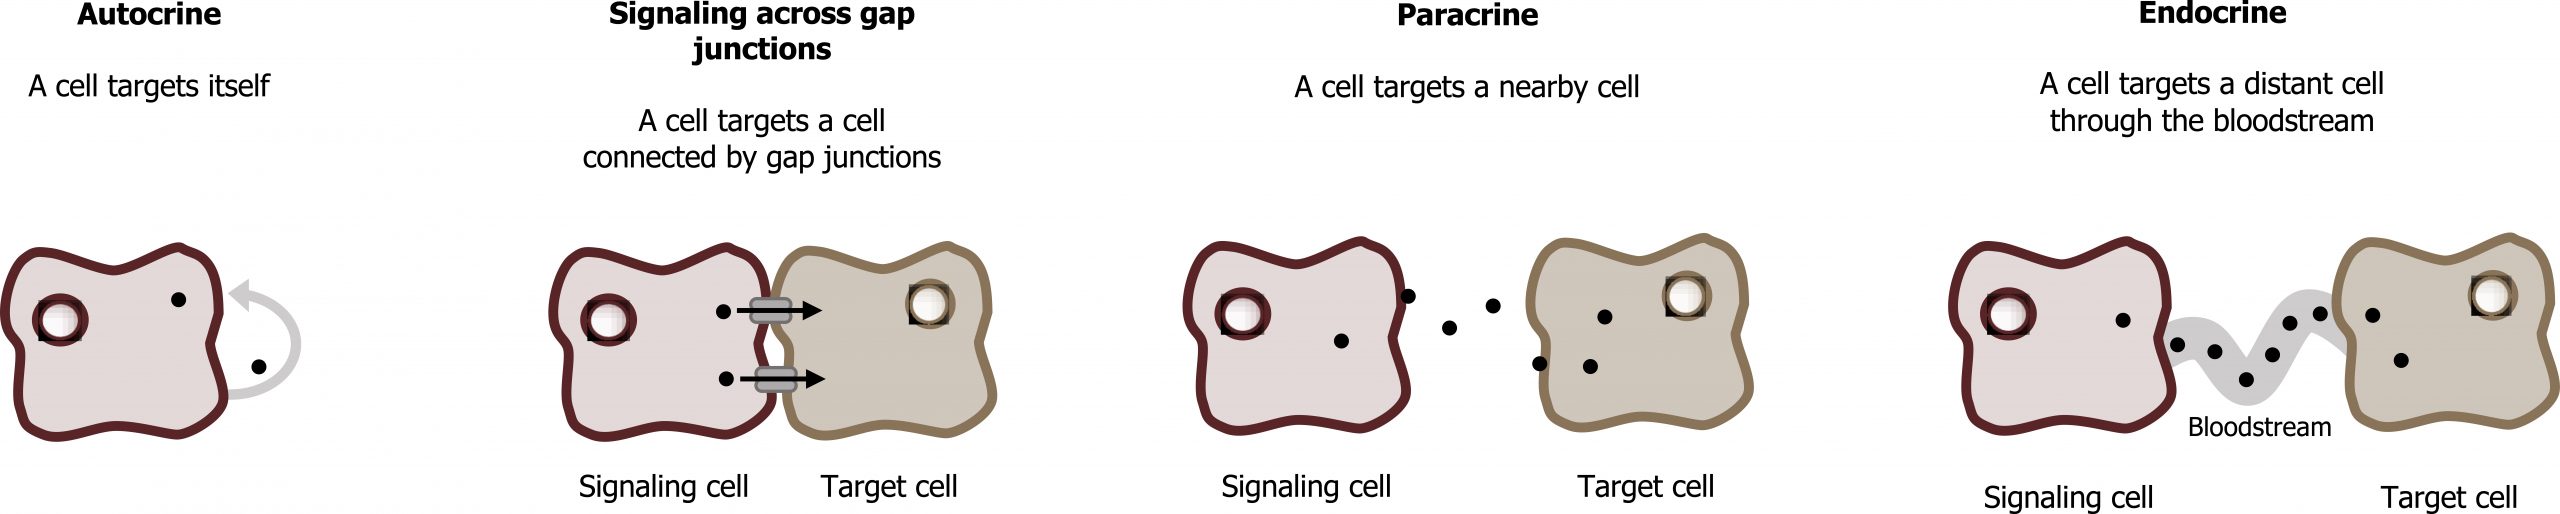
Generally speaking, it uses various communication modalities to sense and respond to neighboring cells and environmental cues, which can be categorized into the following types of communication (figure 15.1):
- Autocrine: These signals act on the cell from which it is secreted or on nearby cells that are the same type of cell as the secreting cell. Most autocrine cells are also paracrine cells.
- Juxtocrine or signaling through gap junctions: These types of signals require physical contact between cells in order for a signal to be transduced. These are two different types of signaling that both involve cell contact.
- Paracrine: The paracrine substance is secreted from cells that are not normally thought of as endocrine cells. Actions are performed on nearby cells and very low amounts are too dilute to affect distance cells. The location of the cell plays a role in the specificity of the response.
- Endocrine: Endocrine cells secrete the hormone into the blood and exerts its action on specific target cells that can be very far away (for example: insulin, glucagon, and cortisol).
General characteristics:
- Cellular signaling begins with the release of a chemical messenger, which will either diffuse or is transported in the blood/extracellular fluids to its location of action.
Once at the intended location it will bind to its receptor, which can be intracellular or extracellular, to elicit a response.
This could be in the form of:
- A conformational change
- Activation of a second messenger
- Protein recruitment
- Cleavage of a receptor
Finally, the signal can be terminated by:
- Degradation of the receptor or ligand.
The outcome of a signaling cascade is diverse. For example, elevated insulin may signal for increased uptake and storage of glucose (see section 15.3) or a signal may initiate apoptosis (see section 15.2).
Types of ligands
![Estradiol IUPAC ID: (8R,9S,13S,14S,17S)-13-methyl-6,7,8,9,11,12,14,15,16,17-decahydrocyclopenta[a]phenanthrene-3,17-diol. Testosterone IUPAC ID: (8R,9S,10R,13S,14S,17S)-17-hydroxy-10,13-dimethyl-1,2,6,7,8,9,11,12,14,15,16,17-dodecahydrocyclopenta[a]phenanthren-3-one. Cholesterol IUPAC ID: (3S,8S,9S,10R,13R,14S,17R)-10,13-dimethyl-17-[(2R)-6-methylheptan-2-yl]-2,3,4,7,8,9,11,12,14,15,16,17-dodecahydro-1H-cyclopenta[a]phenanthren-3-ol.](https://pressbooks.lib.vt.edu/app/uploads/sites/66/2021/11/15.2-scaled.jpg)
- Steroid hormones: These are often cholesterol-derived and can diffuse through membranes to bind intracellular receptors (figure 15.2).
- Amino acid metabolites: These types of hormones are often neurotransmitters and contain nitrogenous groups.
- Gases: Both NO and CO are common gases that elicit unique signaling cascades.
- Proteins: These can be small polypeptides (e.g., insulin) or larger membrane-bound proteins that elicit a cellular response.
- Lipids: Eicosanoids and other phospholipids can function as cell signals either in a membrane bound or free form.
General G-protein-coupled receptor cascade
G-protein-coupled receptors (GPCR) can come in several different classes: Gαs, Gαi, and Gαq. Activation of a Gαs (activated by glucagon) will increase the second messenger cAMP, while both Gαi or Gαt cascades function to reduce cAMP, either through inhibition of adenylyl cyclase (also known as adenylate cyclase) or through activation of phosphodiesterase, respectively.
The classic cascade starts with hormone binding, to an extracellular domain of a seven-helix receptor (GPCR), which causes a conformational change in the receptor that is transmitted to a G protein on the cytosolic side of the membrane (figure 15.3).
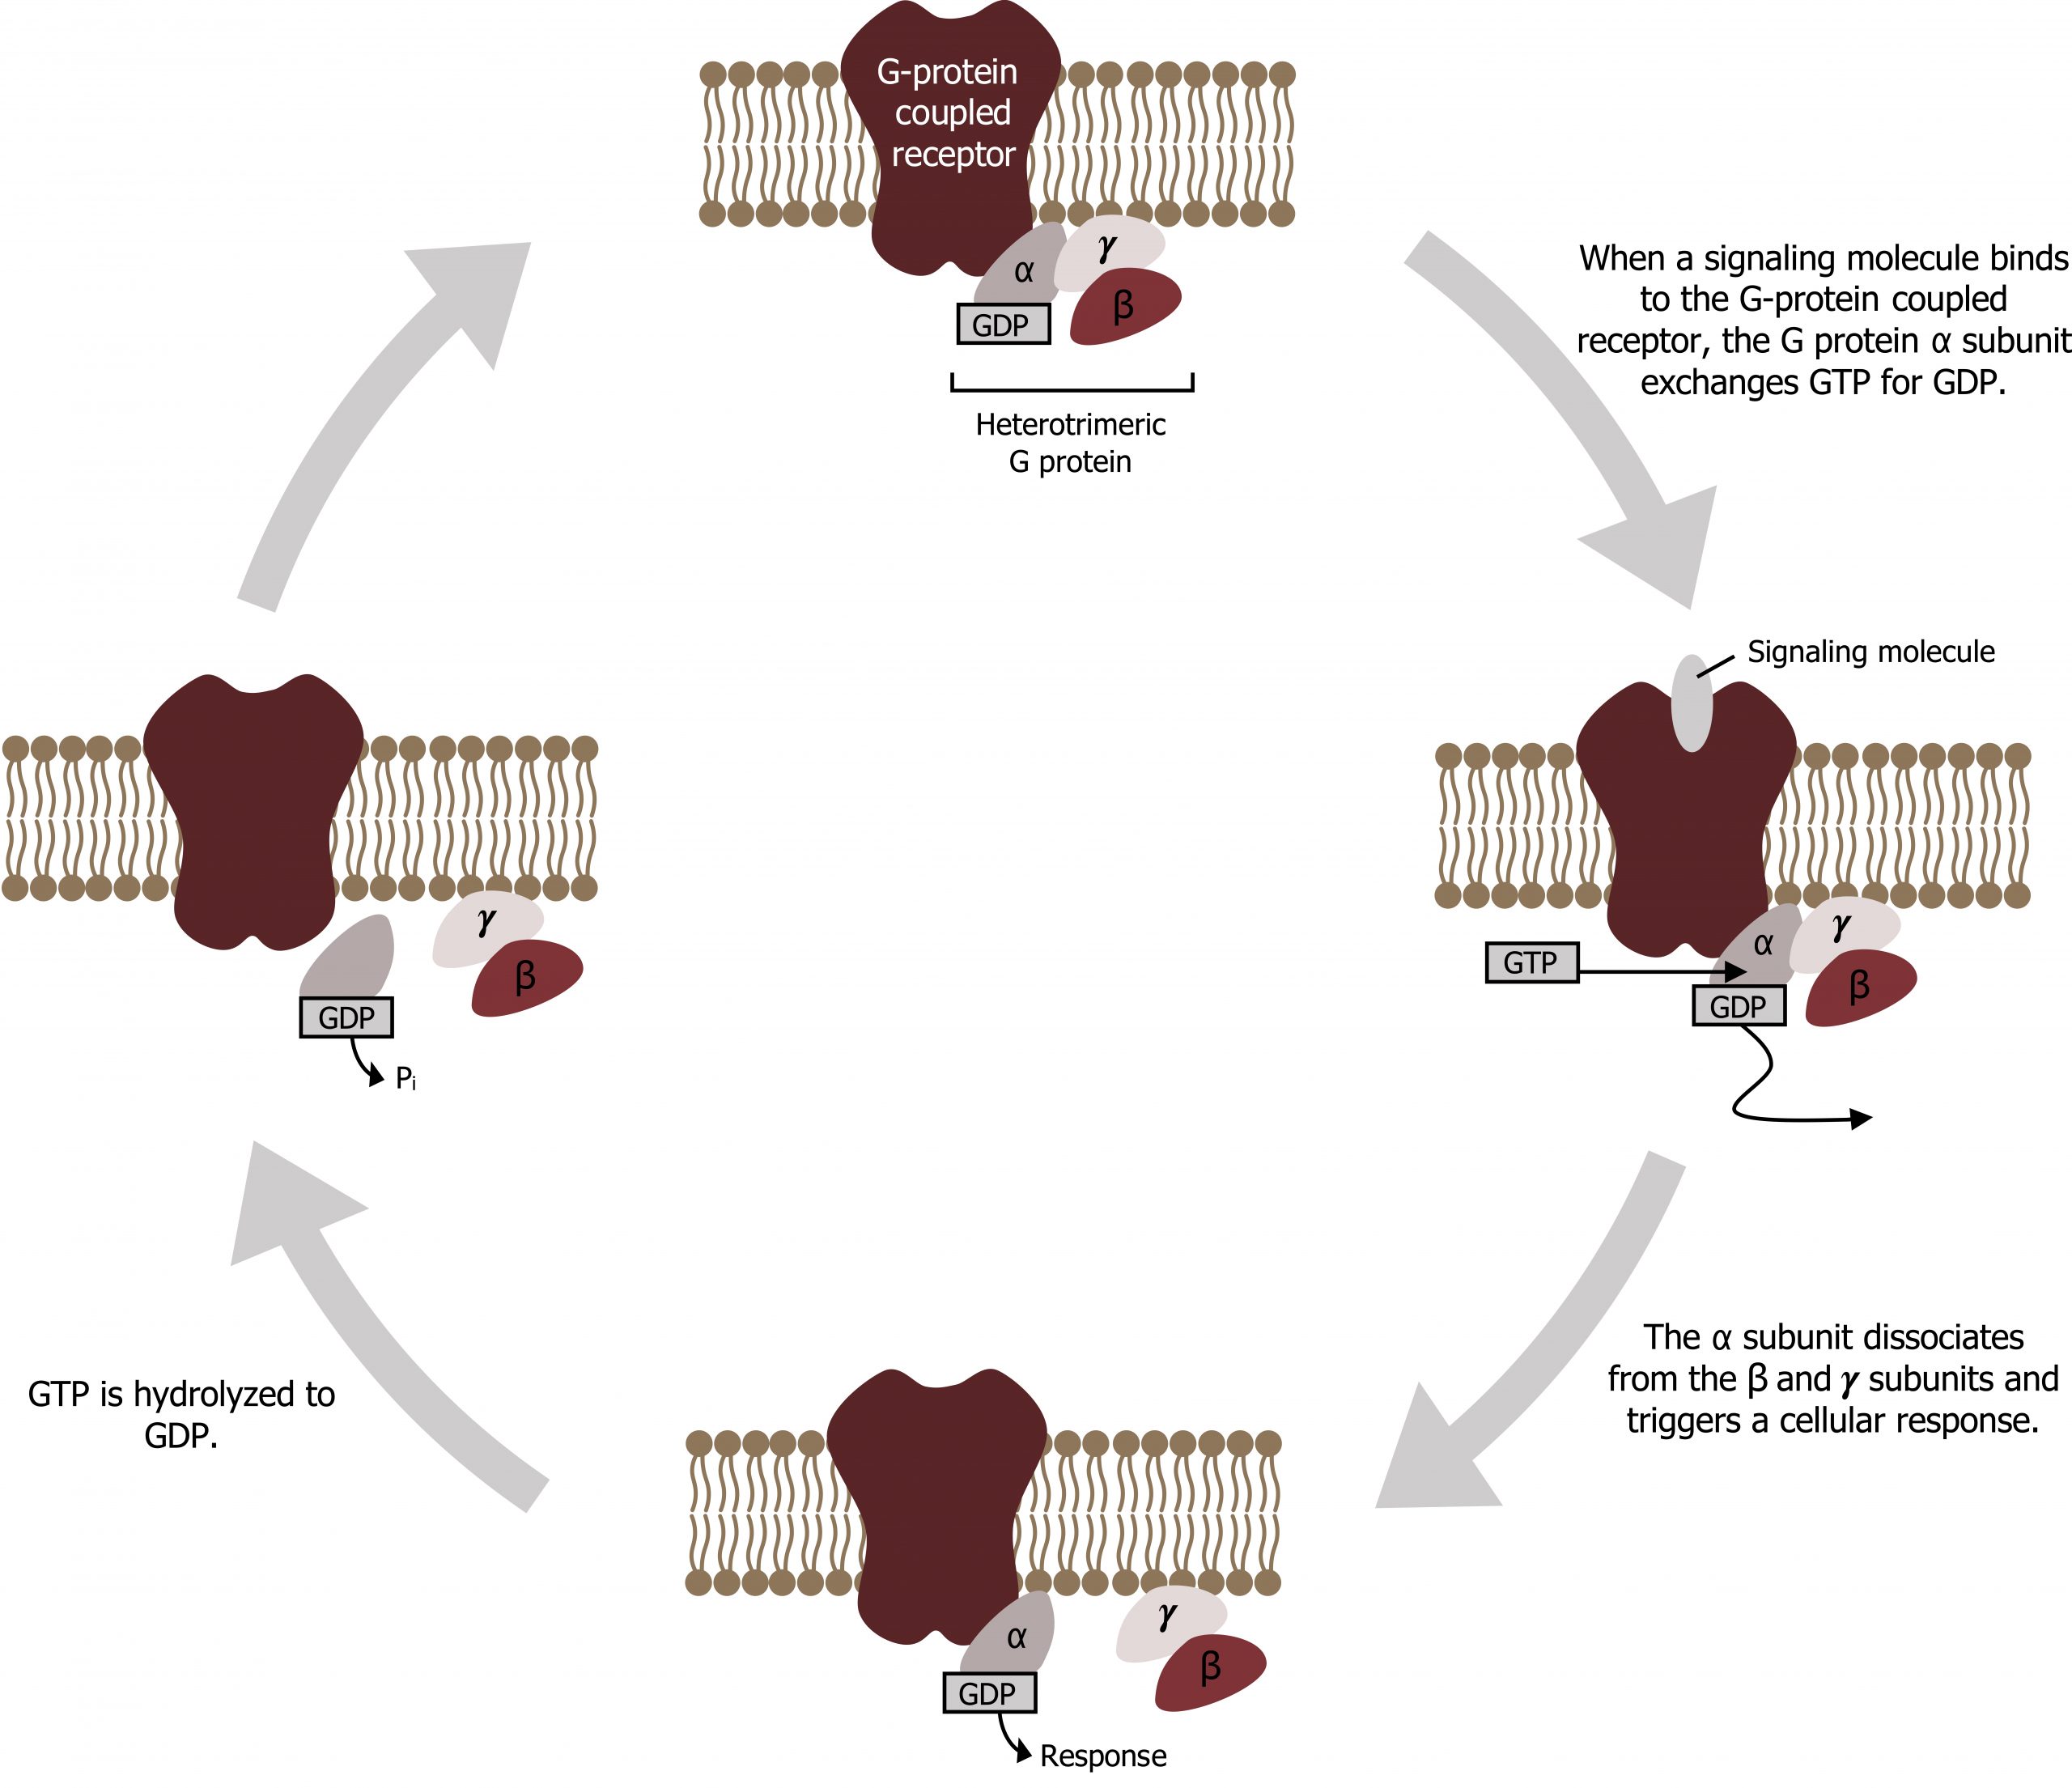
- The nucleotide-binding site on Gαs becomes more accessible to the cytosol, where [GTP] is usually higher than [GDP]. Gα releases GDP and binds GTP (GDP–GTP exchange). Substitution of GTP for GDP causes another conformational change in Gα.
- Gα-GTP dissociates from the inhibitory subunit complex and activates adenylyl cyclase.
- Adenylyl cyclase catalyzes synthesis of cAMP (second messenger), and in turn cAMP activates protein kinase A (cAMP-dependent protein kinase).
- The cascade can be terminated by the action of phosphodiesterase, which can degrade cAMP and terminate signal.
Phosphatidylinositol-derived second messengers
Phosphatidylinositols are membrane-bound compounds that can be phosphorylated or cleaved to function as second messengers in a signaling cascade (figure 15.4).
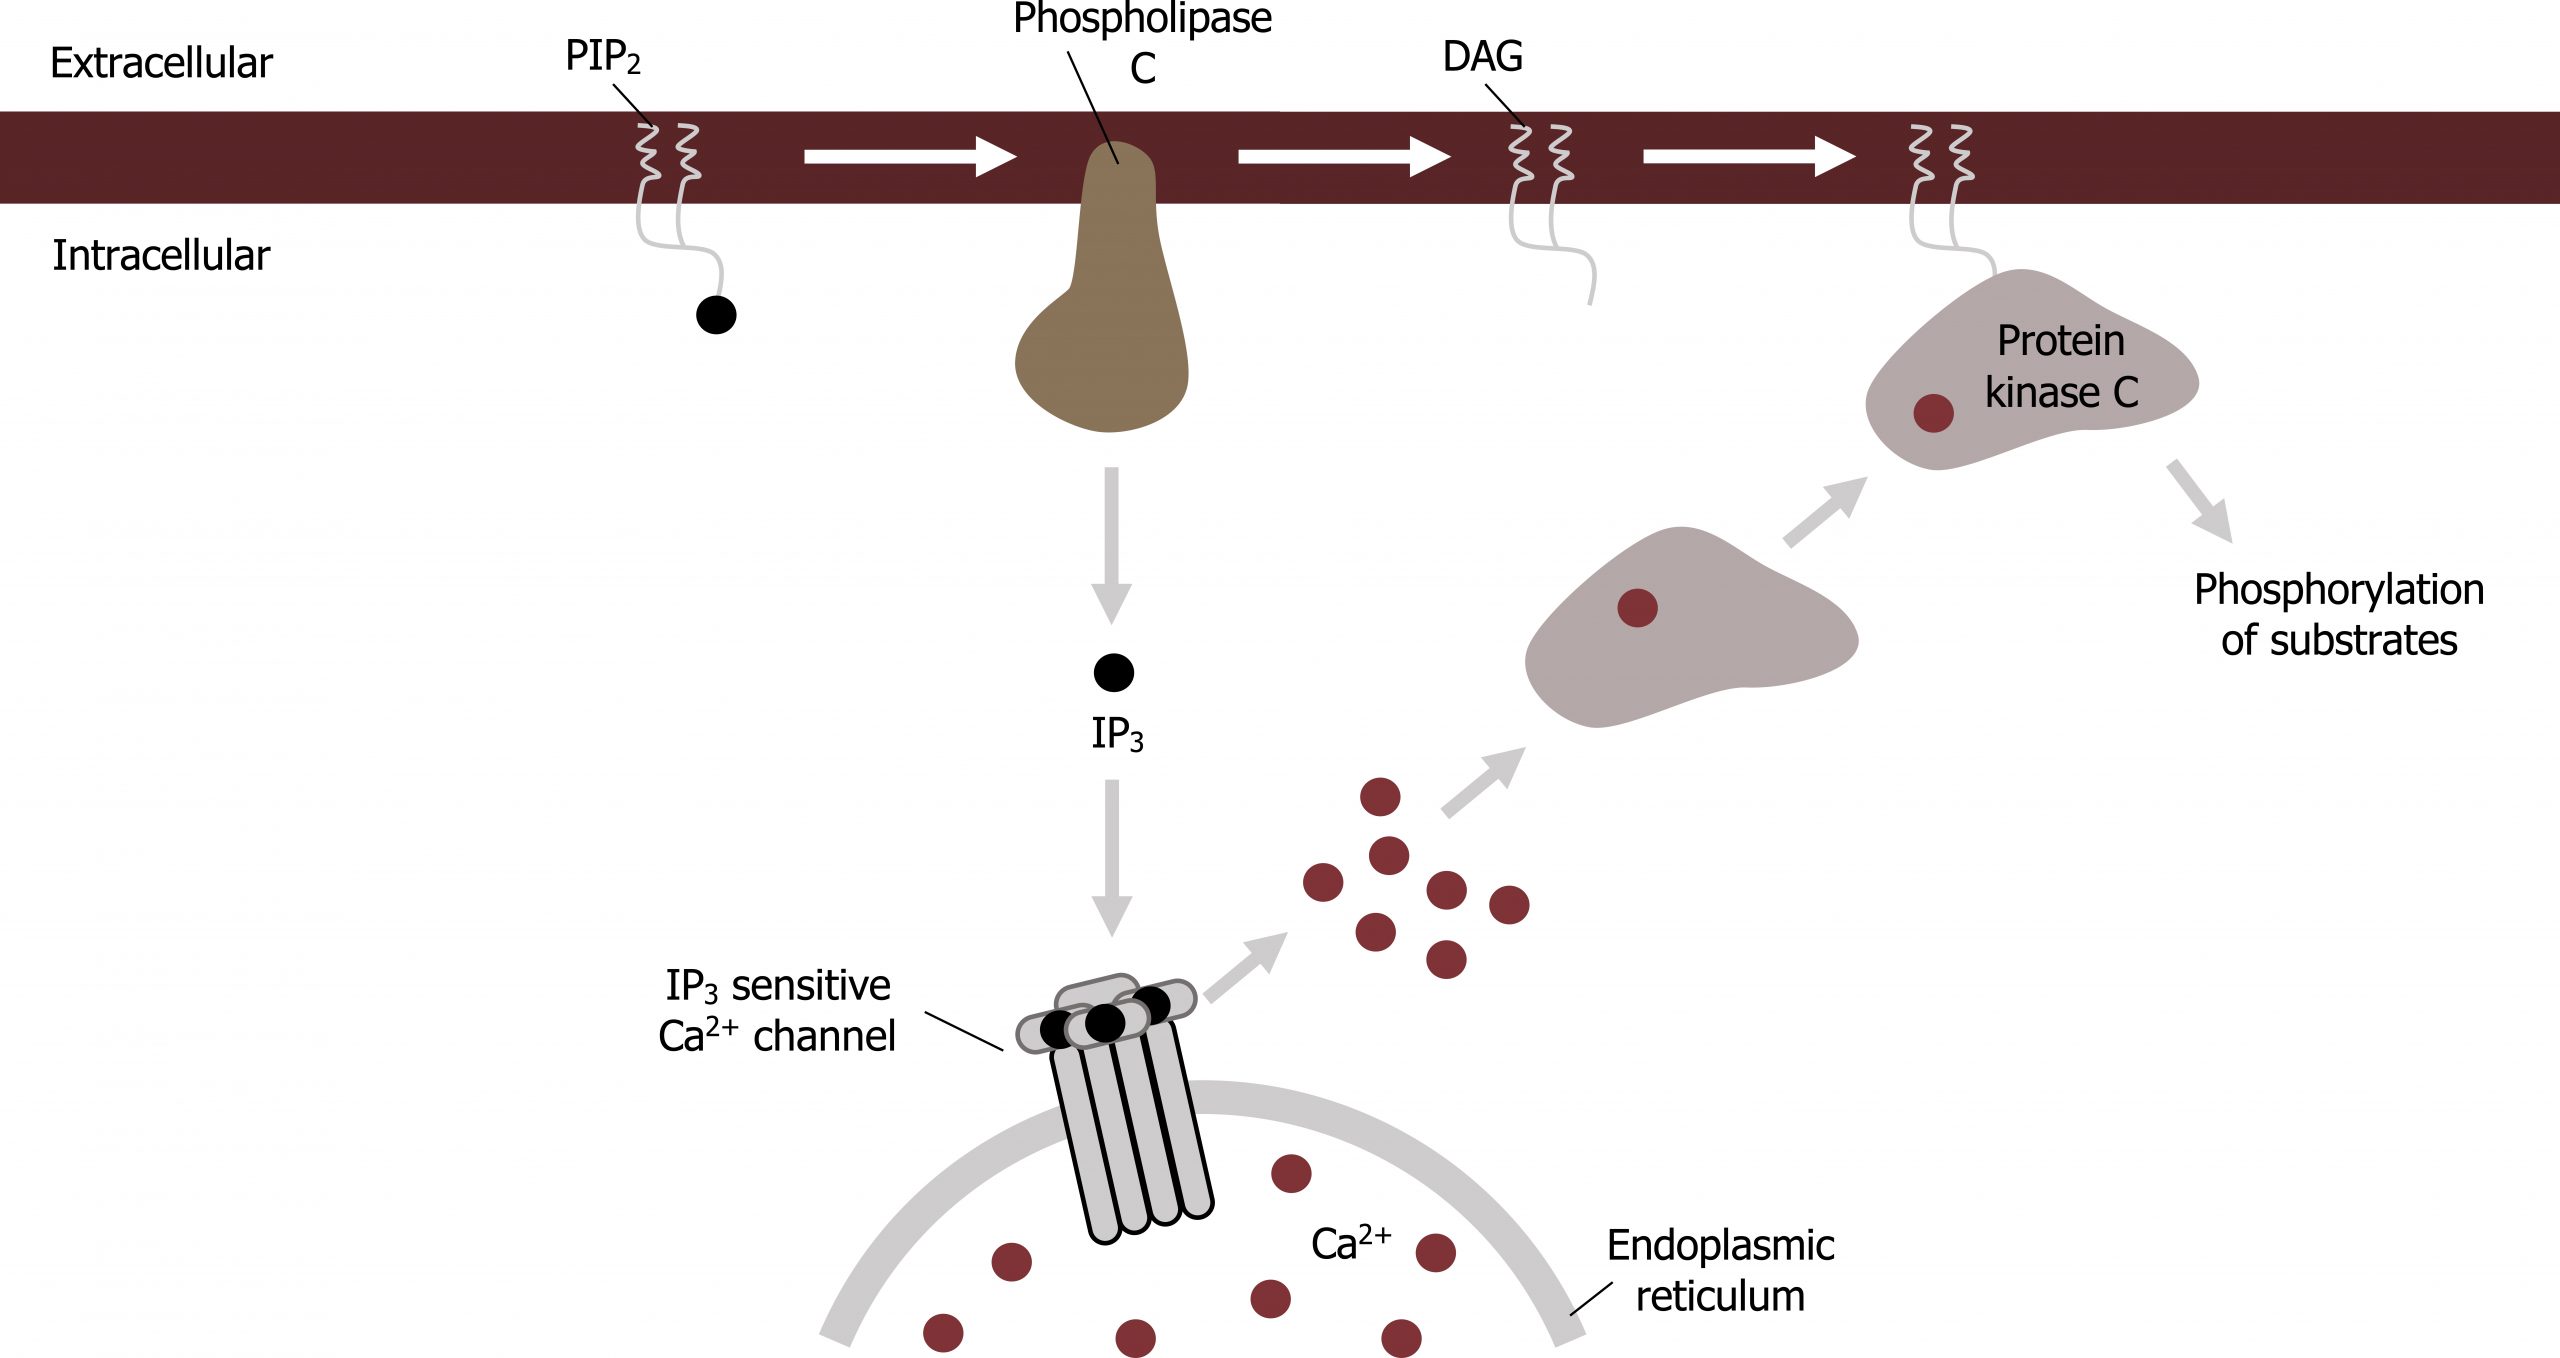
The common membrane component, phosphatidylinositol (PI), can be phosphorylated (by any number of kinases) to form PI 4,5-bisphosphate. This molecule can undergo two different fates.
- First it could be phosphorylated by a kinase, such as P-I3kinase, downstream of insulin; this produces phosphatidylinositol 3′,4′,5′-trisphosphate (PI-3,4,5-trisP), which can serve as a plasma-membrane docking site for signal transduction proteins with pleckstrin homology domains (PH).
- Alternatively, PI 4,5-bisphosphate can be cleaved into two second messengers: inositol-1,4,5-trisphosphate (IP3) and diacylglycerol (DAG) by activation of phospholipase C (PLC). Phospholipase C is downstream of a Gαq cascade.
This cascade will become important for calcium signaling, which is modulated through interactions of IP3 with the mitochondria.
- DAG recruits protein kinase C.
- IP3 initiates release of CA2+ from the smooth ER.
Changes in intracellular calcium can alter membrane permeability through calcium-induced calcium release.
Receptor Tyrosine Kinase (RTK)
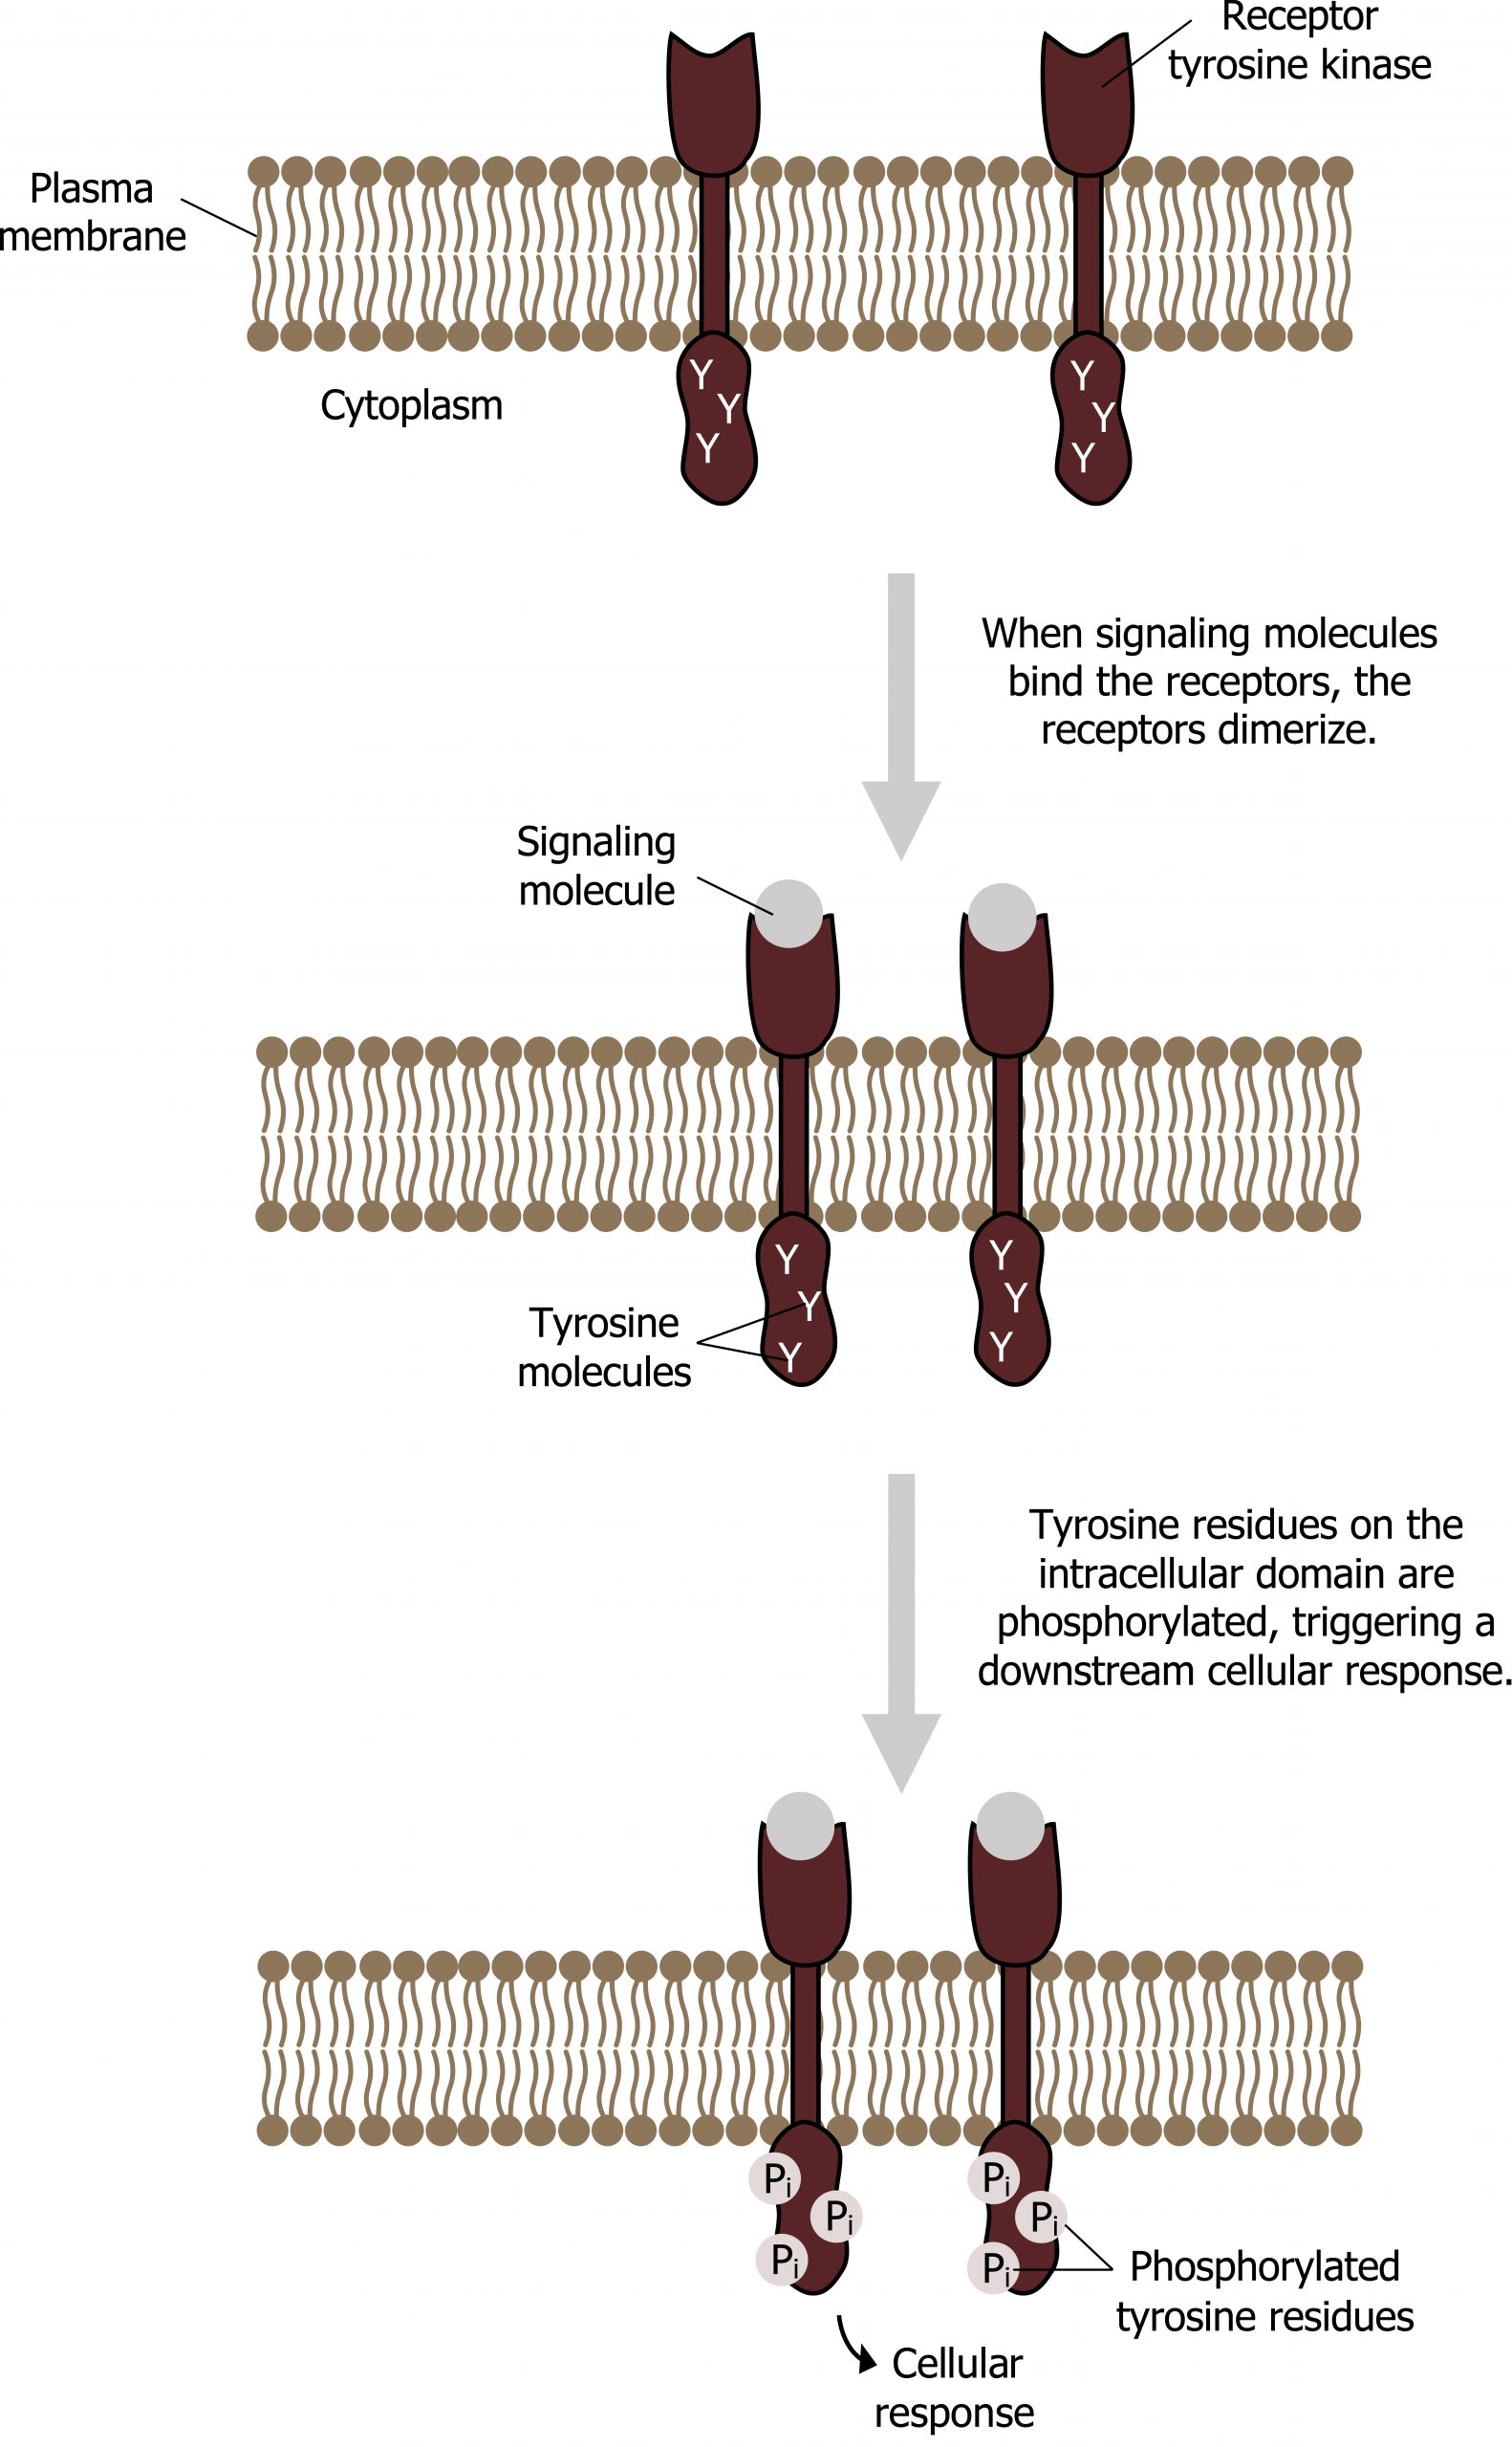
RTKs are in the cell membrane and typically function as a dimer.
- Upon binding of the hormone to the receptor, autophosphorylation occurs on the inner side of the membrane. This forms a phosphorylated tyrosyl residue that will act as a docking site for proteins with SH2 domains. In the case of insulin signaling, the insulin receptor substrate (IRS) will bind this activated receptor (figure 15.5).
- The IRS protein will also become phosphorylated at subsequent tyrosine residues, and in this manner insulin signaling can be amplified. Other proteins such as PI 3-kinase, PLC, and Grb2 all have SH2 domains and all bind to different tyrosyl residues on the IRS.
Two major cascades are activated downstream of insulin and other growth hormones:
- Ras-dependent signaling: The activated Grb2 binds a SOS-Ras complex leading to a conformational change exchanging GDP for GTP. Ras-GTP binds Raf, and activated Raf is the first step in a MAP-kinase cascade that can lead to a change in gene transcription.
- Ras-independent signaling: This involves activation of phosphoinositol 3-kinase and is discussed under phosphatidylinositol-derived second messengers.
Jak-STAT and serine threonine kinases
Jak-STATs are also types of tyrosine kinases. The difference here is that these receptors lack autocatalytic abilities and require an intracellular kinase (Jak) to phosphorylate the transcription factor STAT. Jak-STAT signaling is most commonly associated with immune cell signaling.
Serine threonine kinase
This receptor family encompasses many of the growth factors for the body (EGF, VEGF, and TGF-β). These receptors usually form heterodimers, and the Type II receptor will autophosphorylate the Type I receptor upon ligand binding. These receptors have an autocatalytic domain that will phosphorylate and typically activate a transcription factor.
Intracellular receptors
Intracellular receptors bind hydrophobic chemical messengers such as steroid hormones. Binding of the intracellular receptor (which could be cytosolic or nuclear) usually elicits a transcriptional response. Cortisol is an example of a hormone that binds an intracellular receptor. It is released from the adrenal cortex and diffuses into the bloodstream attached to serum albumin and steroid hormone-binding globulin. After diffusing through the plasma membrane, it binds to the cortisol receptor (intracellular receptor) in the cytosol and forms a homodimer exposing a nuclear localization signal (NLS). Exposure of the NLS targets the complex to the nucleus.
Intracellular receptors commonly have three domains:
- Transactivation domain,
- DNA-binding domain, and
- Ligand-binding domain.
Intracellular receptors will function as a transcriptional activator by binding specific DNA elements, altering transcription of downstream genes. The signal is terminated by the lowering of the concentration of the hormone.
NO as a messenger
Nitric oxide NO is a gas that also acts as a ligand. It is able to diffuse directly across the plasma membrane, and one of its roles is to interact with receptors in smooth muscle and induce relaxation of the tissue.
NO has a very short half-life and, therefore, only functions over short distances. It activates guanylyl cyclase to synthesize cGMP. This in turn results in smooth muscle relaxation.
Nitroglycerin, a treatment for heart disease, acts by triggering the release of NO, which causes blood vessels to dilate (expand), thus restoring blood flow to the heart. NO has become better known recently because the pathway that it affects is targeted by prescription medications for erectile dysfunction, such as Viagra (erection involves dilated blood vessels).
15.1 References and resources
Text
Clark, M. A. Biology, 2nd ed. Houston, TX: OpenStax College, Rice University, 2018, Chapter 9: Cell Communication, Chapter 10: Cell Reproduction.
Karp, G., and J. G. Patton. Cell and Molecular Biology: Concepts and Experiments, 7th ed. Hoboken, NJ: John Wiley, 2013, Chapter 15: Cell Signaling and Signal Transduction.
Le, T., and V. Bhushan. First Aid for the USMLE Step 1, 29th ed. New York: McGraw Hill Education, 2018, 85, 208, 238.
Figures
Grey, Kindred, Figure 15.1 Summary of types of cell signaling. 2021. https://archive.org/details/15.1_20210926. CC BY 4.0.
Grey, Kindred, Figure 15.2 Examples of steroid hormones. 2021. Chemical structure by Henry Jakubowski. https://archive.org/details/15.2_20210926. CC BY 4.0.
Grey, Kindred, Figure 15.3 Common G-protein coupled receptor signaling cascade. 2021. CC BY 4.0. Added ion channel by Léa Lortal from the Noun Project.
Grey, Kindred, Figure 15.4 Signaling cascade initiated by DAG and IP3. 2021. https://archive.org/details/15.4_20210926. CC BY 4.0.
Grey, Kindred, Figure 15.5 Receptor Tyrosine kinase signaling. 2021. CC BY 4.0. Added ion channel by Léa Lortal from the Noun Project.
15.2 Apoptosis
Both cell proliferation and apoptosis (controlled/programed cell death) are decisive processes within a cell. Keep in mind, apoptosis is distinct from cell necrosis, in which cell death is usually attributable to physical or chemical damage and rapidly spontaneous; think explosion.
Apoptosis is genetically programmed cell death, which leads to “tidy” breakdown and disposal of cells. Morphologically, apoptosis is characterized by shrinking of the cell, changes in the cell membrane (with the formation of small blebs known as “apoptotic bodies”), shrinking of the nucleus, chromatin condensation, and fragmentation of DNA. Macrophages and other phagocytic cells recognize this signal and remove apoptotic cells by phagocytosis without inflammatory phenomena developing. Apoptosis regulates the growth of normal tissues and removes unwanted cells in a controlled manner.
Caspases are a family of enzymes that control this process. These are cysteine proteases that cleave proteins next to aspartate residues when they become activated. When a cell receives an apoptotic signal, the procaspases become active and begin the process of protein degradation starting with the cleavage of laminins in the nuclear envelope, protein kinases, transcription factors, snRP proteins, and inhibitors of special DNAses, which are able to fragment the nuclear DNA (figure 15.6).
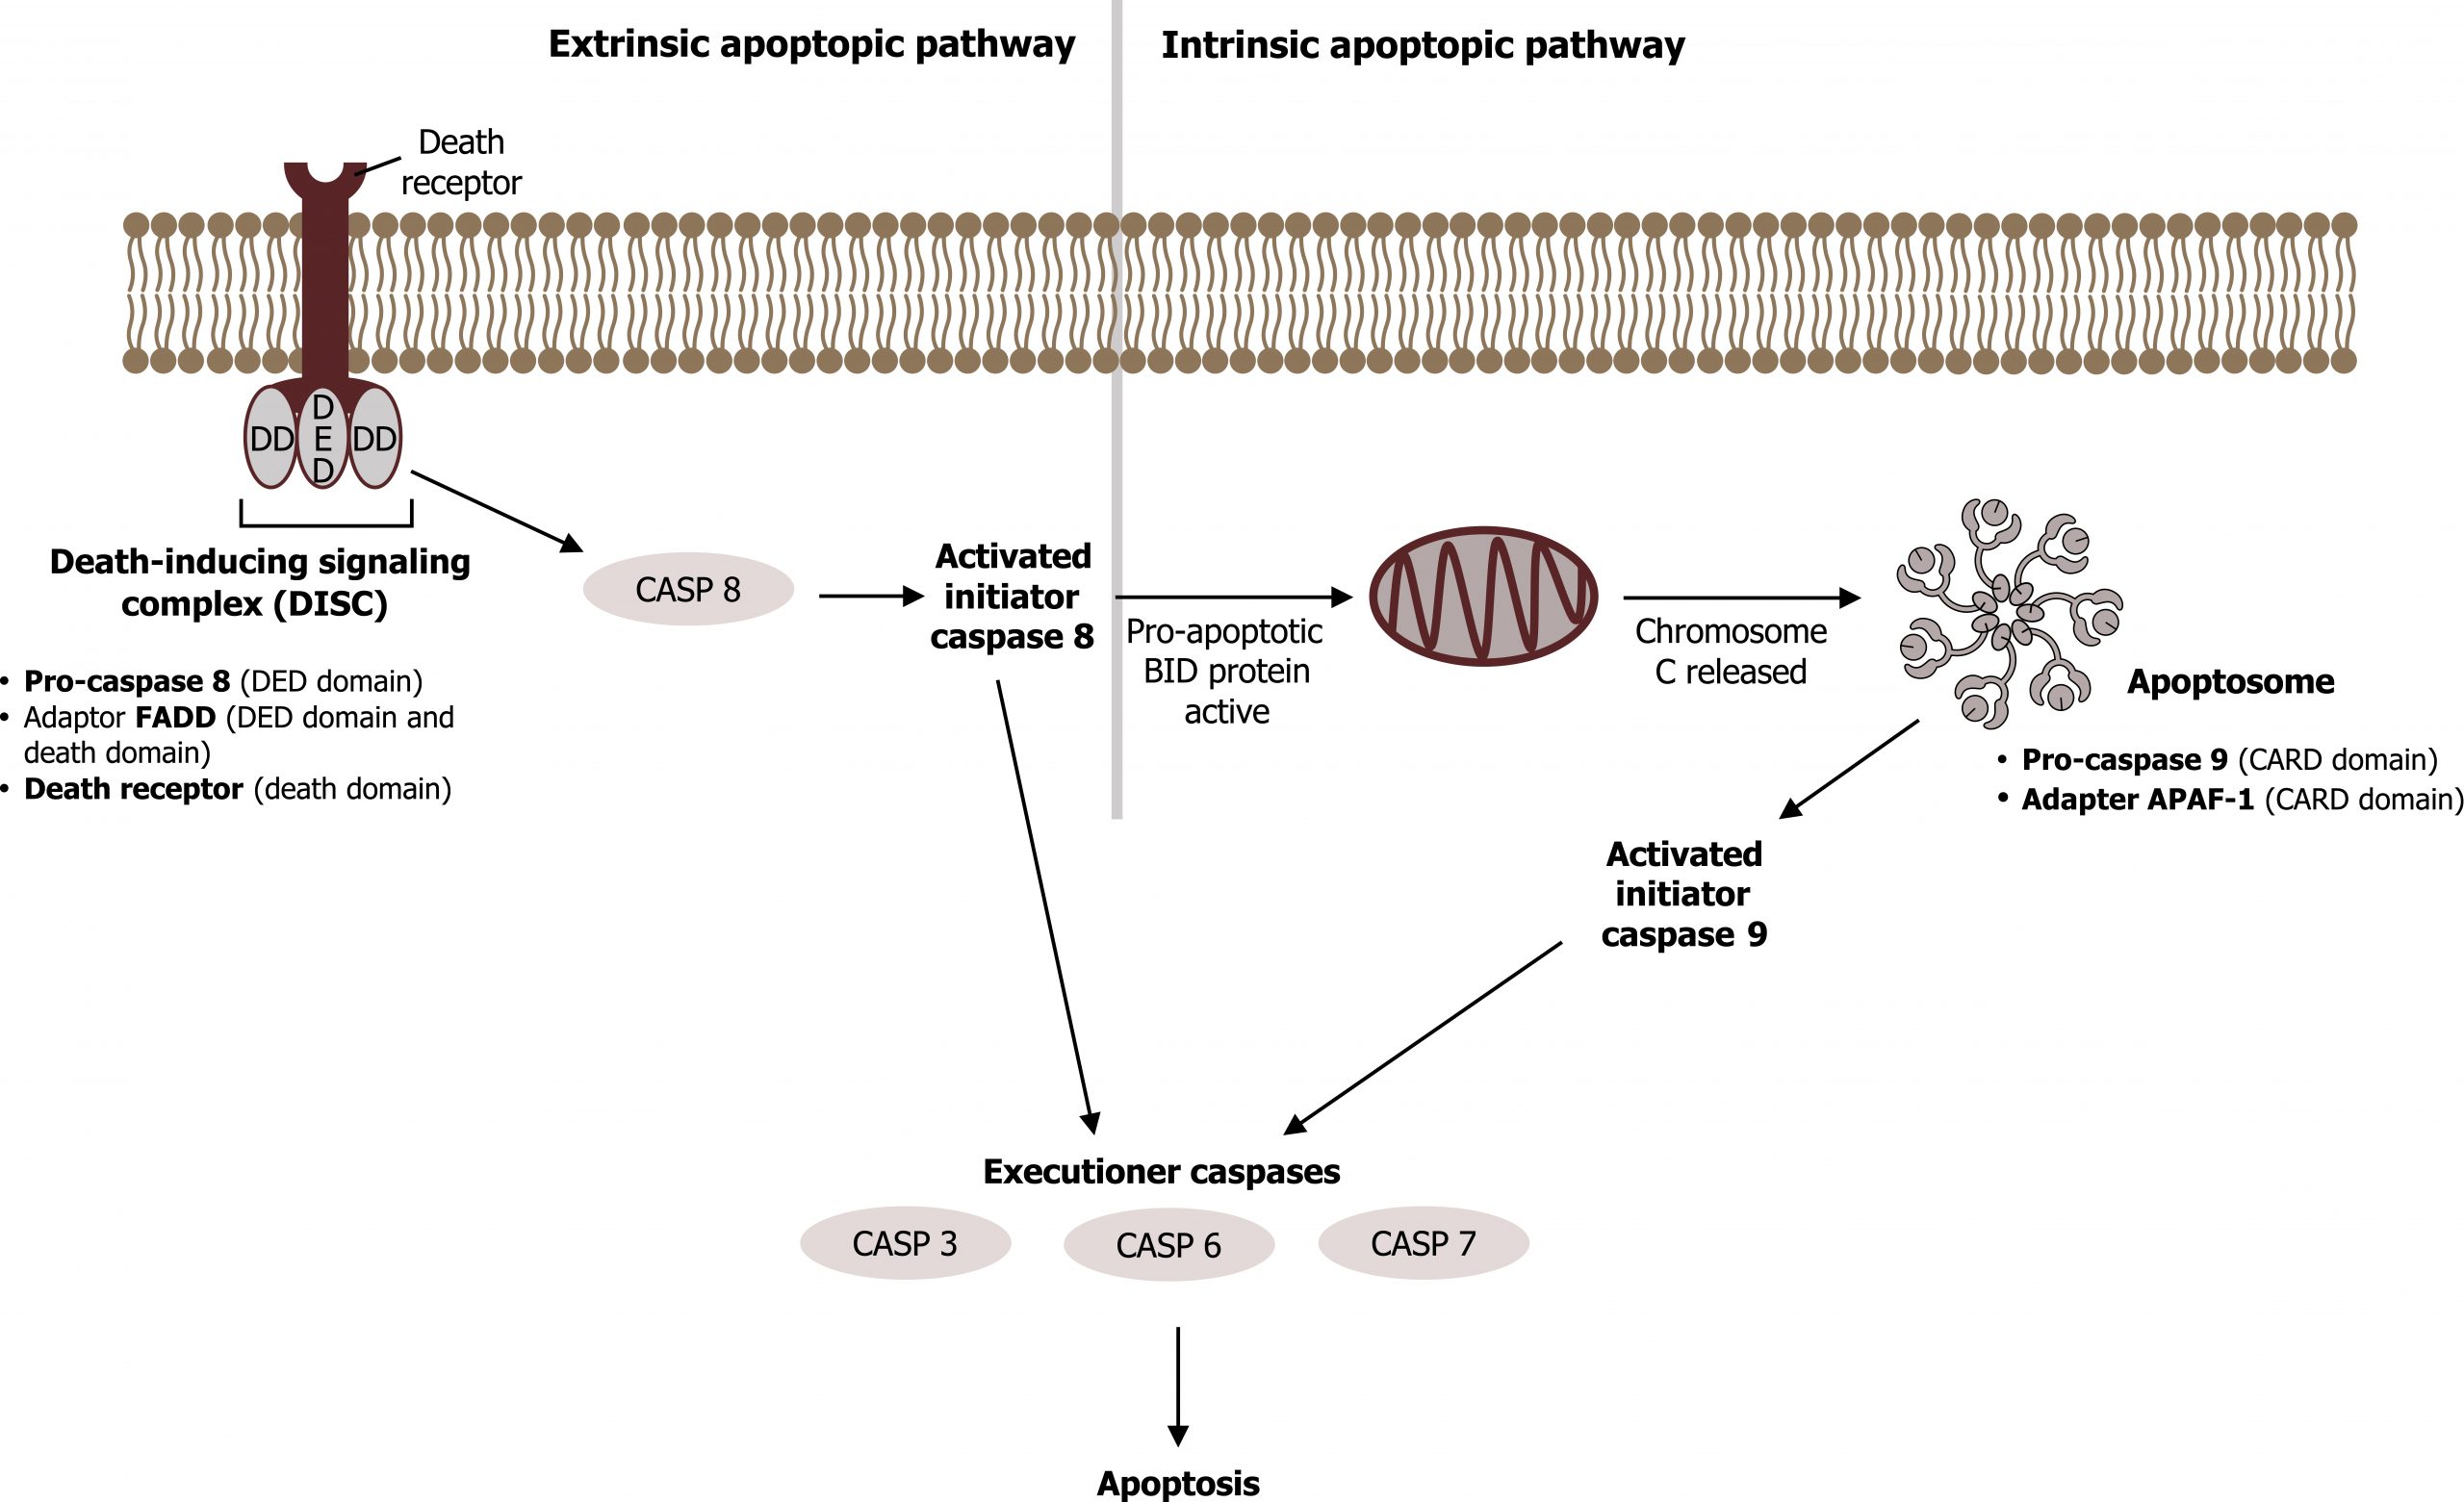
The extrinsic pathway for apoptosis is triggered on the cell surface by ligands that bind to receptors of the tumor necrosis factor family (TNFR, “death receptors”). These include Fas receptors, which are present on the plasma membrane of most cells in the body. When Fas ligands bind to a cellʼs Fas receptors, trimerization of the receptors takes place via the adapter protein FADD (“Fas-associated death domain”), which activates the initiator caspases 8 and 10 inside the cell, setting in motion the apoptotic process.
The intrinsic, mitochondrial pathway is triggered by genotoxic (DNA damage) or oxidative stress. Aided by Bcl proteins, chemical stress makes the outer mitochondrial membrane leaky. As a result, mitochondrial proteins reach the cytoplasm. Cytochrome c in particular then triggers the caspase cascade by binding to the adapter protein Apaf1 and promoting formation of an apoptosome, a wheel-shaped heptamer that recruits initiator procaspase 9 and activates it to caspase 9.
The Bcl protein family not only includes proapoptotic proteins (Bax, Bak, and Bim) but also proteins that inhibit apoptosis (including Bcl2). Extracellular growth factors ensure inactivation of Bad or replication of Bcl 2, thus preventing apoptosis.
15.2 References and resources
Text
Clark, M. A. Biology, 2nd ed. Houston, TX: OpenStax College, Rice University, 2018, Chapter 9: Cell Communication, Chapter 10: Cell Reproduction.
Karp, G., and J. G. Patton. Cell and Molecular Biology: Concepts and Experiments, 7th ed. Hoboken, NJ: John Wiley, 2013, Chapter 15: Cell Signaling and Signal Transduction.
Le, T., and V. Bhushan. First Aid for the USMLE Step 1, 29th ed. New York: McGraw Hill Education, 2018, 85, 208, 238.
Figures
Grey, Kindred, Figure 15.6 Comparison of intrinsic and extrinsic apoptosis pathways. 2021. https://archive.org/details/15.6_20210926. CC BY-SA 3.0. Added Model № 2 of apoptosome formation and activation of caspase-9 and caspase-3 (hy) by Brat Ural. CC BY-SA 3.0. From Wikimedia Commons. Added ion channel by Léa Lortal from the Noun Project.
15.3 Membrane Potential
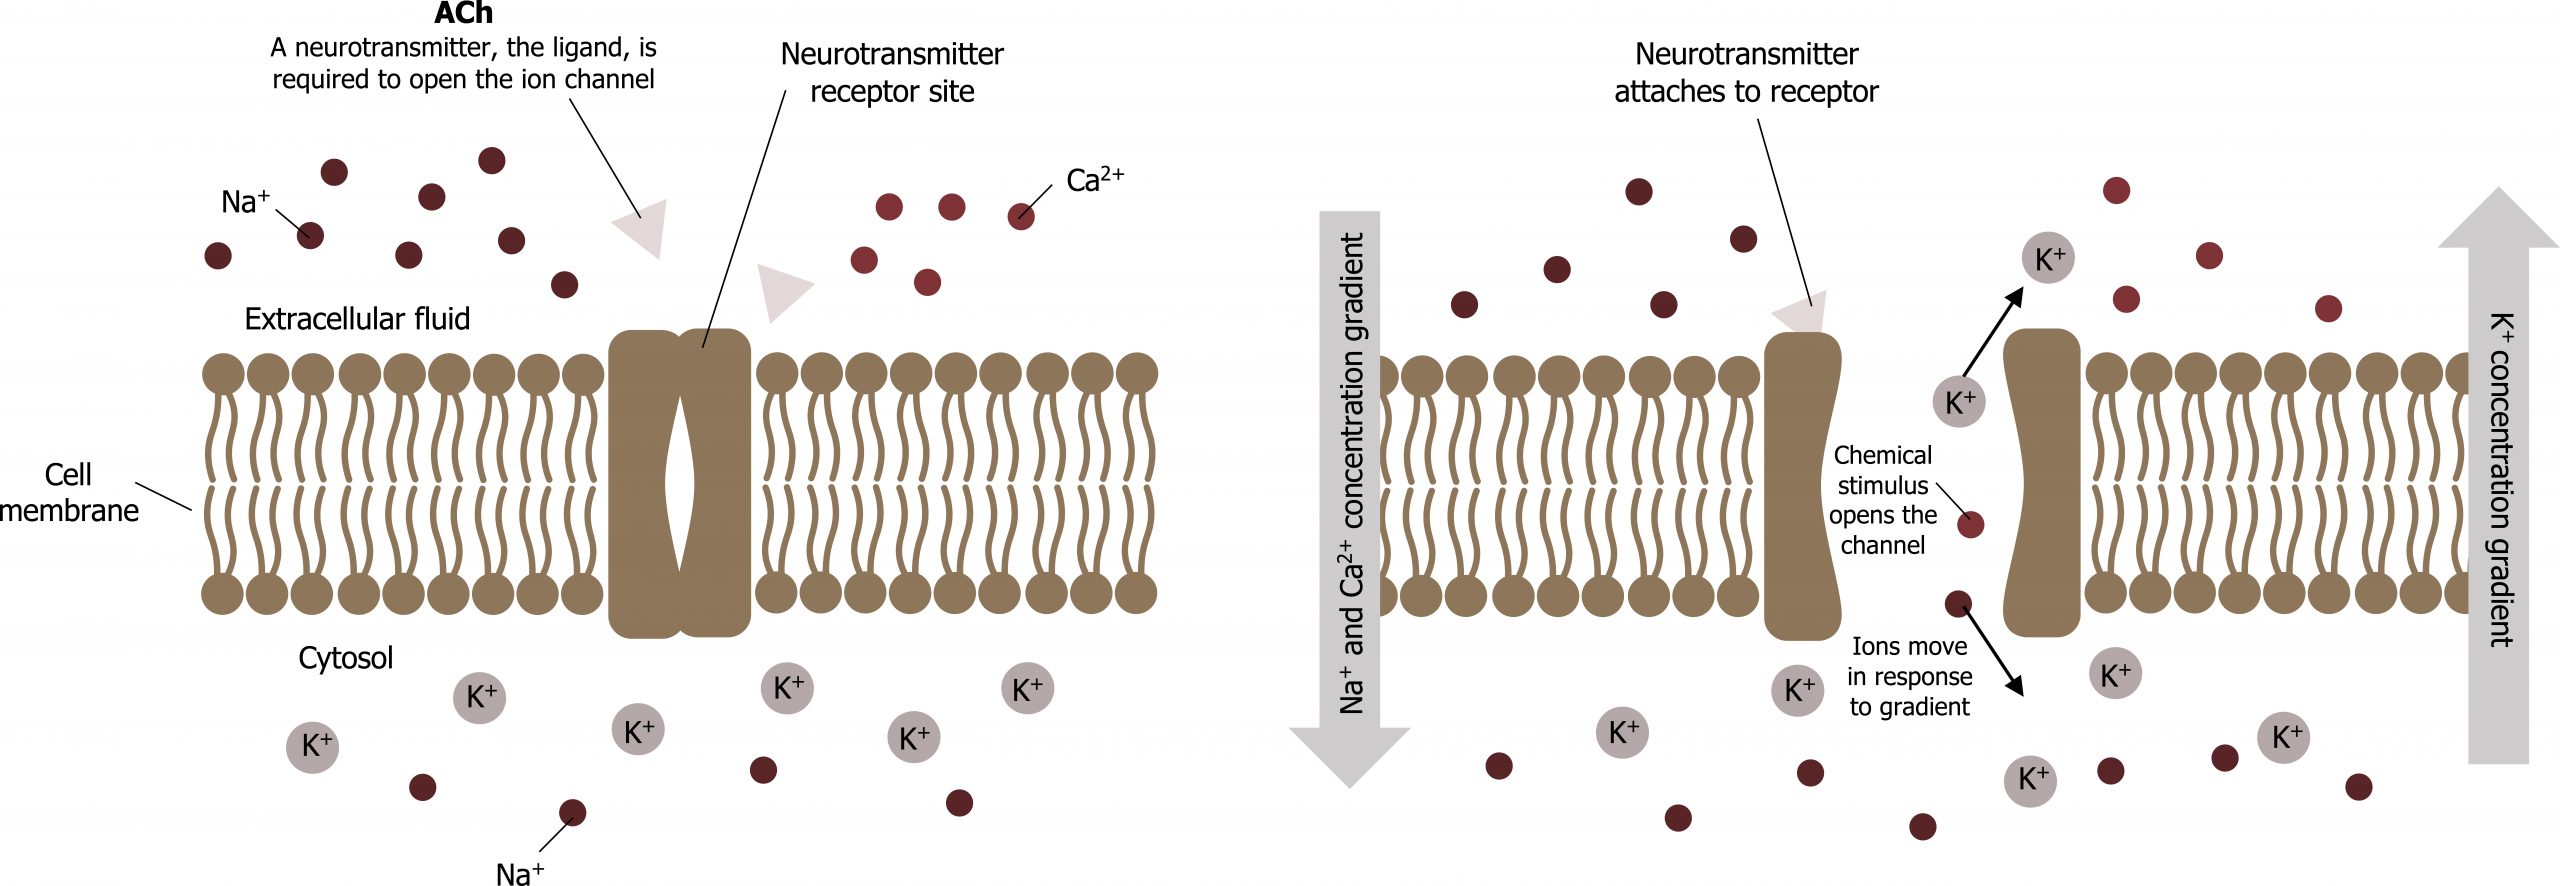
The electrical state of the cell membrane can have several variations. These are all variations in the membrane potential. A potential is a distribution of charge across the cell membrane, measured in millivolts (mV). The standard is to compare the inside of the cell relative to the outside, so the membrane potential is a value representing the charge on the intracellular side of the membrane based on the outside being zero, relatively speaking. Neurons harvest this membrane potential to generate or propagate a nerve impulse (figure 15.7).
The action potential
Resting membrane potential describes the steady state of the cell, which is a dynamic process that is balanced by ion leakage and ion pumping. Without any outside influence, it will not change. To get an electrical signal started, the membrane potential has to change (summary in figures 15.8 and 15.9).
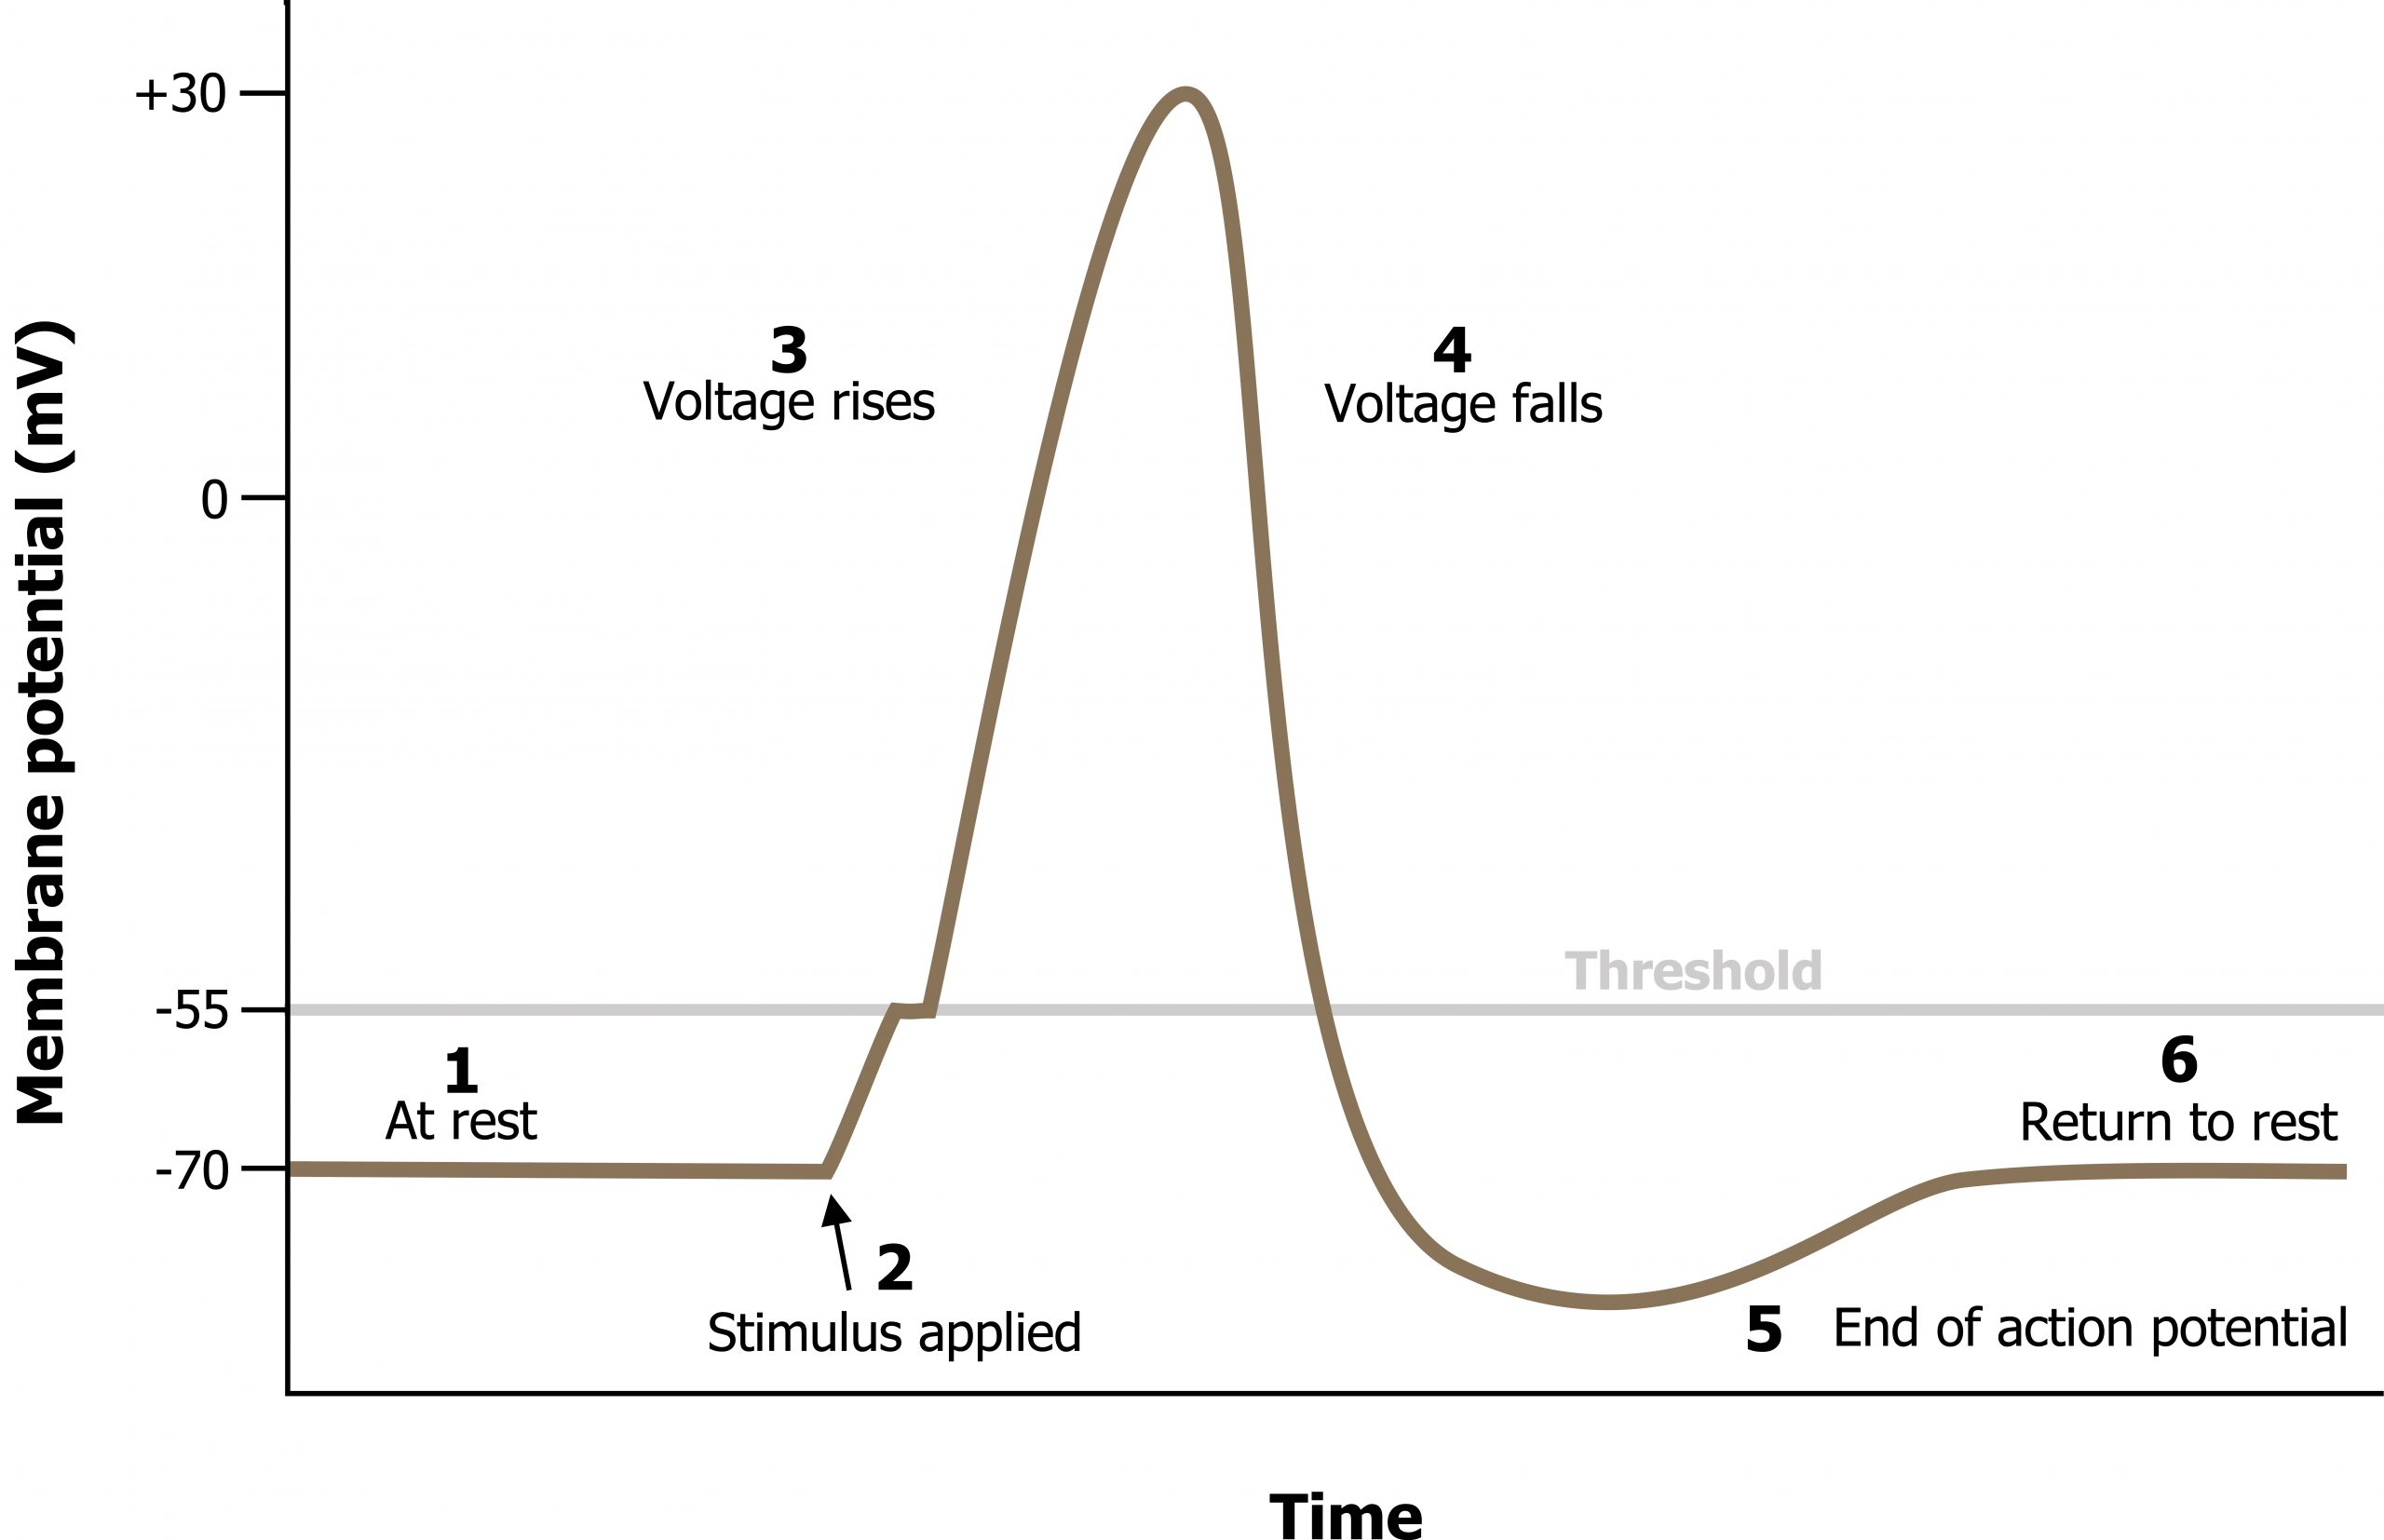
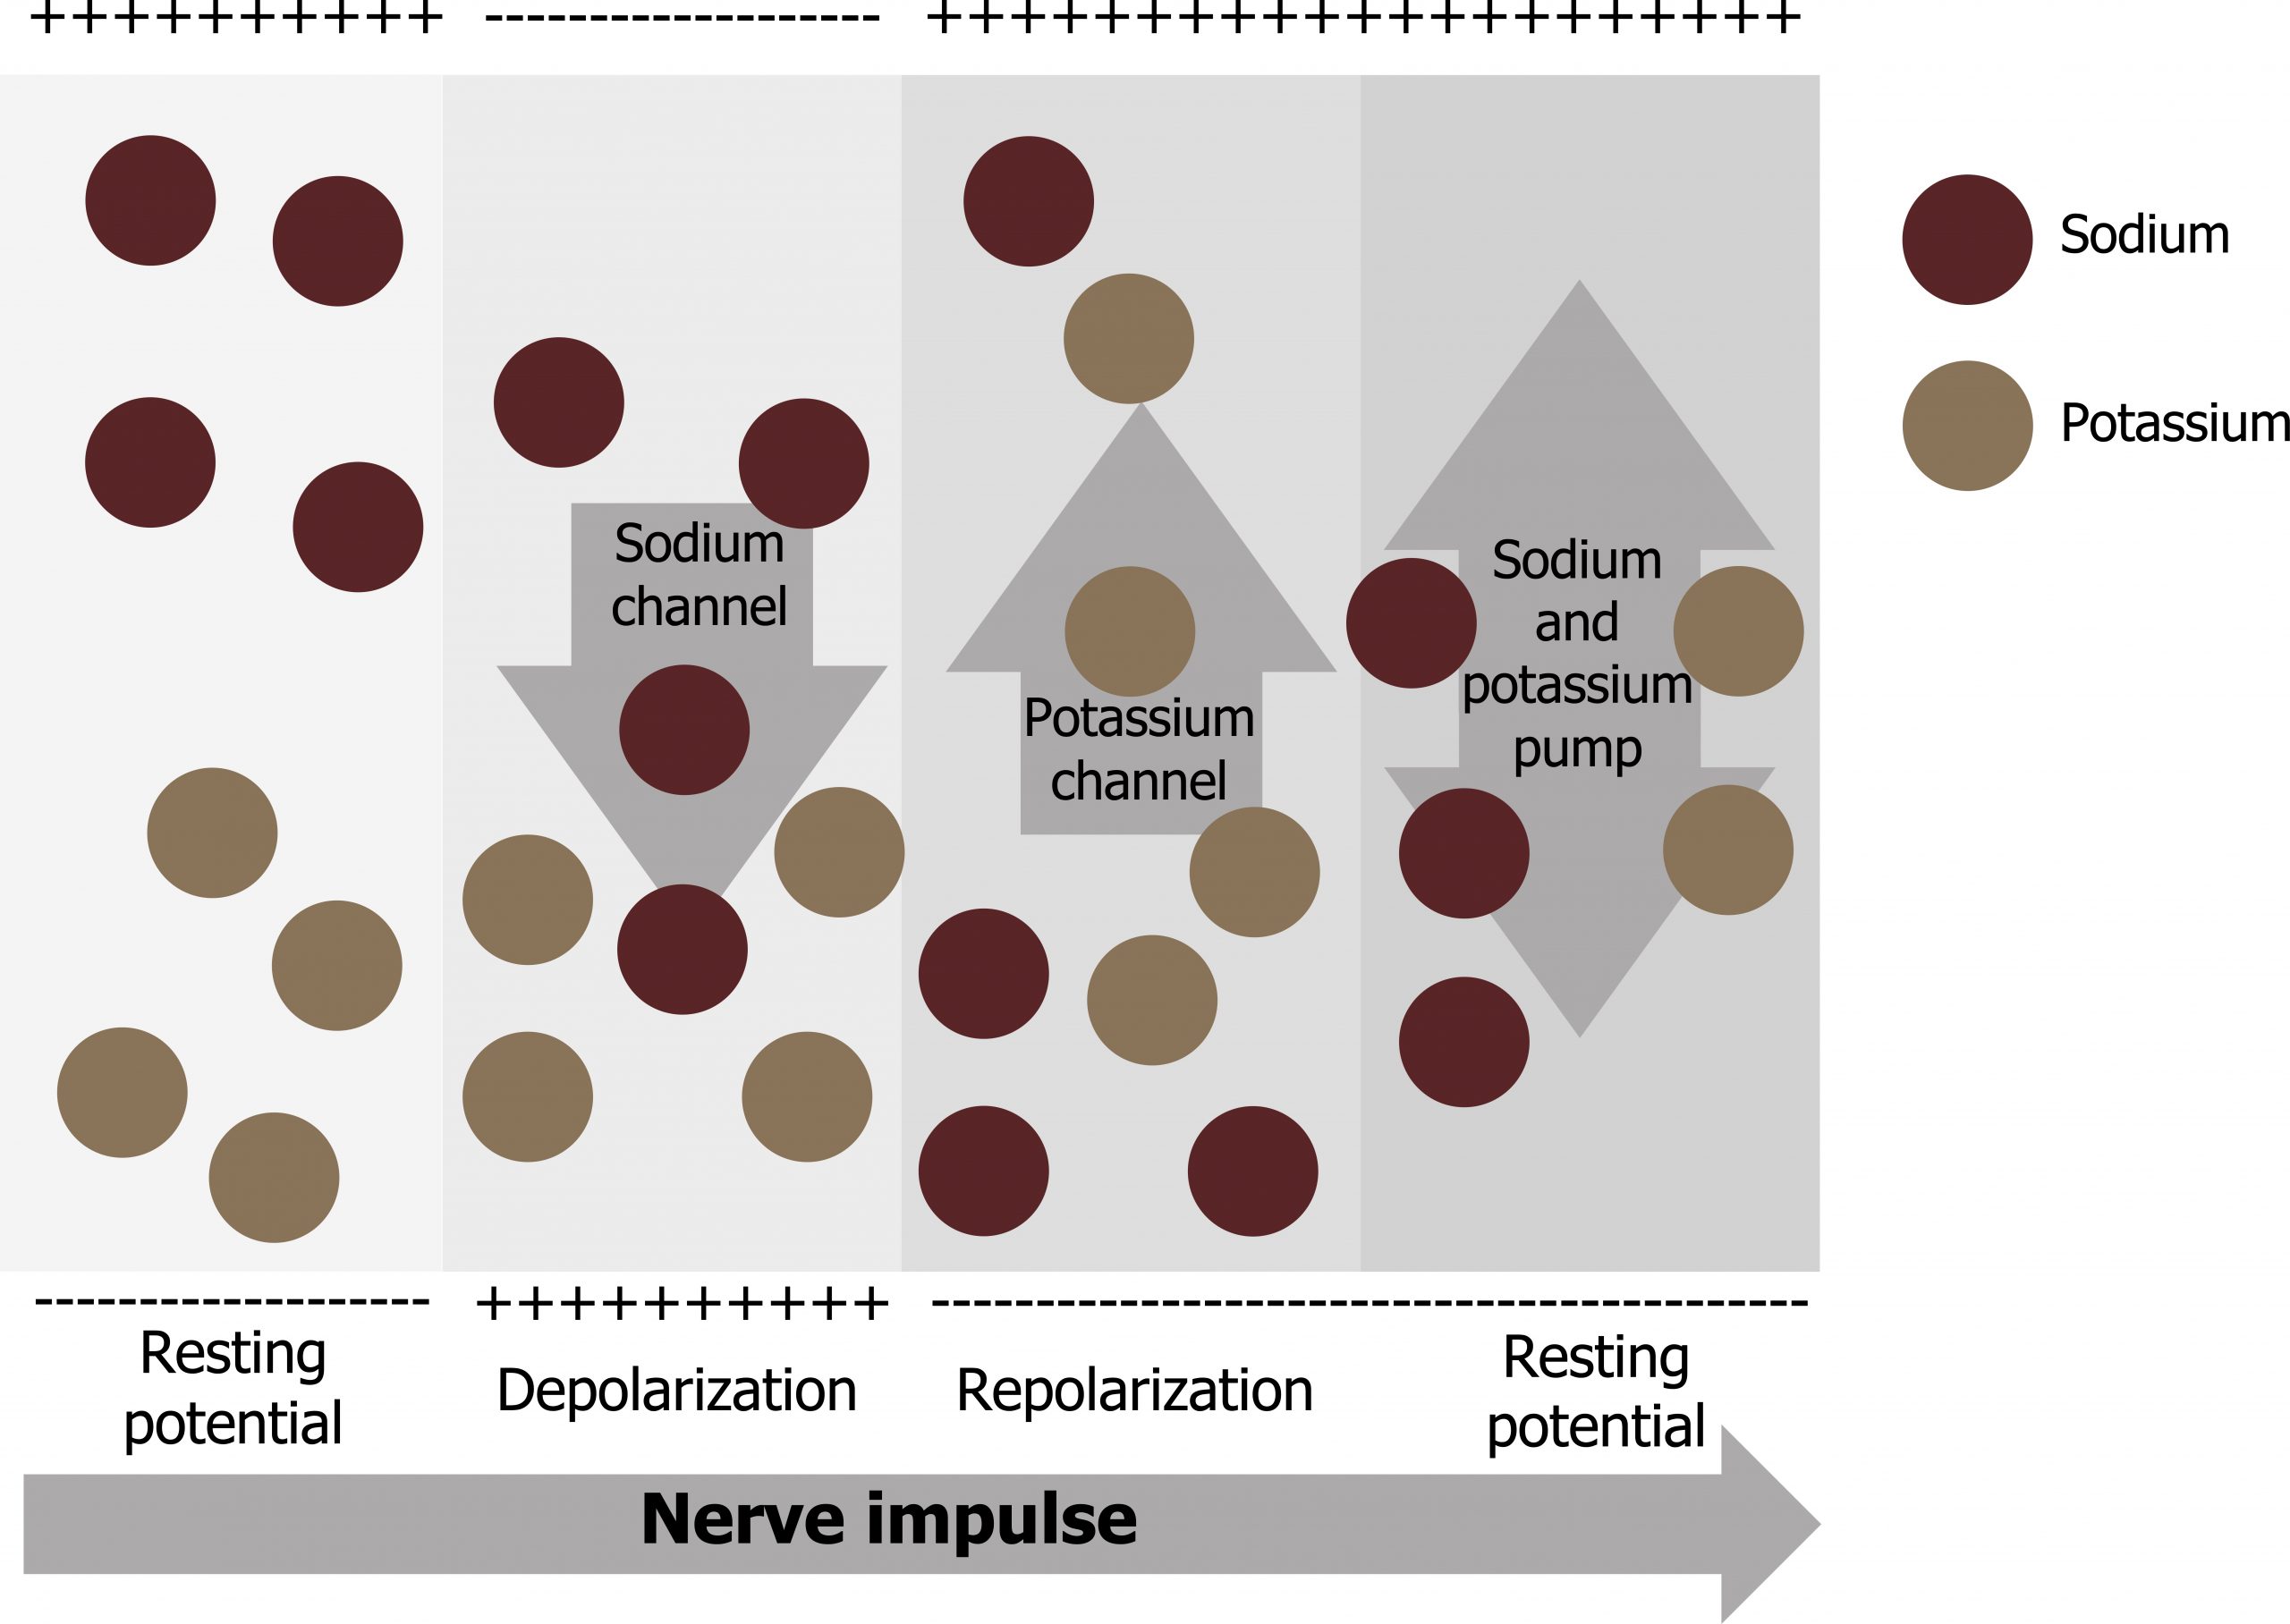
- This starts with a channel opening for Na+ in the membrane. Because the concentration of Na+ is higher outside the cell than inside the cell by a factor of 10, ions will rush into the cell that are driven largely by the concentration gradient. Because sodium is a positively charged ion, it will change the relative voltage immediately inside the cell relative to immediately outside.
- The resting potential is the state of the membrane at a voltage of −70 mV, so the sodium cation entering the cell will cause it to become less negative. This is known as depolarization, meaning the membrane potential moves toward zero.
- The concentration gradient for Na+ is so strong that it will continue to enter the cell even after the membrane potential has become zero, so that the voltage immediately around the pore begins to become positive. The electrical gradient also plays a role, as negative proteins below the membrane attract the sodium ion. The membrane potential will reach +30 mV by the time sodium has entered the cell.
- As the membrane potential reaches +30 mV, other voltage-gated channels are opening in the membrane. These channels are specific for the potassium ion. A concentration gradient acts on K+ as well. As K+ starts to leave the cell, taking a positive charge with it, the membrane potential begins to move back toward its resting voltage. This is called repolarization, meaning that the membrane voltage moves back toward the −70 mV value of the resting membrane potential.
- Repolarization returns the membrane potential to the −70 mV value that indicates the resting potential, but it actually overshoots that value. Potassium ions reach equilibrium when the membrane voltage is below −70 mV, so a period of hyperpolarization occurs while the K+ channels are open. Those K+ channels are slightly delayed in closing, accounting for this short overshoot.
15.3 References and resources
Text
Clark, M. A. Biology, 2nd ed. Houston, TX: OpenStax College, Rice University, 2018, Chapter 9: Cell Communication, Chapter 10: Cell Reproduction.
Karp, G., and J. G. Patton. Cell and Molecular Biology: Concepts and Experiments, 7th ed. Hoboken, NJ: John Wiley, 2013, Chapter 15: Cell Signaling and Signal Transduction.
Le, T., and V. Bhushan. First Aid for the USMLE Step 1, 29th ed. New York: McGraw Hill Education, 2018, 85, 208, 238.
Figures
Grey, Kindred, Figure 15.7 Neurotransmission by acetylcholine. 2021. https://archive.org/details/15.7_20210926. CC BY 4.0. Added ion channel by Léa Lortal from the Noun Project.
Grey, Kindred, Figure 15.9 Summary of the action potential as it relates to change in ion concentration across the membrane. 2021. https://archive.org/details/15.9_20210926. CC BY 4.0.
Lieberman M, Peet A. Figure 15.8 Summary of the action potential to membrane potential. Adapted under Fair Use from Marks’ Basic Medical Biochemistry. 5th Ed. pp 199. Figure 11.11 Signal transduction by tyrosine receptors. 2017.
