9 Disorders of Monosaccharide Metabolism and Other Metabolic Conditions
Learning Objectives
Monosaccharide metabolism
- Describe fructose and galactose metabolism, including the location of the pathway, substrate, and regulatory enzymes.
- Apply knowledge of metabolic regulation to determine how deficiencies in monosaccharide metabolism lead to hypoglycemia.
Alcohol metabolism
- Determine clinical consequences of increased NADH on the metabolic pathways of β-oxidation and gluconeogenesis.
- Describe the two-step process of alcohol metabolism by ADH and ALDH.
About this Chapter
Metabolism to this point has focused on the oxidation of carbohydrates (primarily glucose), lipids, and amino acids. We have addressed these processes under normal conditions without much consideration for potential interactions of other metabolites or pathologies. This section will address how some additional situations can impact the metabolism of these macromolecules. First, metabolism of both galactose and fructose is important and will be addressed. Heritable deficiencies in either of these pathways can potentially cause severe symptoms, and learning how to identify key symptoms is essential. Metabolism of alcohol is also a process to be aware of, as excess flux through this pathway has the potential to interfere with normal glucose and lipid metabolism.
9.1 Monosaccharide Metabolism
Fructose metabolism
Fructose is a dietary component of sucrose in fruit, as a free sugar in honey, and in high-fructose corn syrup. It is taken up by cells through facilitated diffusion through the GLUT5 transporter. Fructose is metabolized principally in the liver, and the initial step involves phosphorylation at the 1-position to form fructose 1-phosphate (figure 9.1). Fructokinase, the major kinase involved, phosphorylates fructose in the 1-position. Fructokinase has a high Vmax and rapidly phosphorylates fructose as it enters the cell. Aldolase B cleaves fructose 1-phosphate into glyceraldehyde 3-phosphate and dihydroxyacetone-phosphate, which can enter directly into glycolysis.
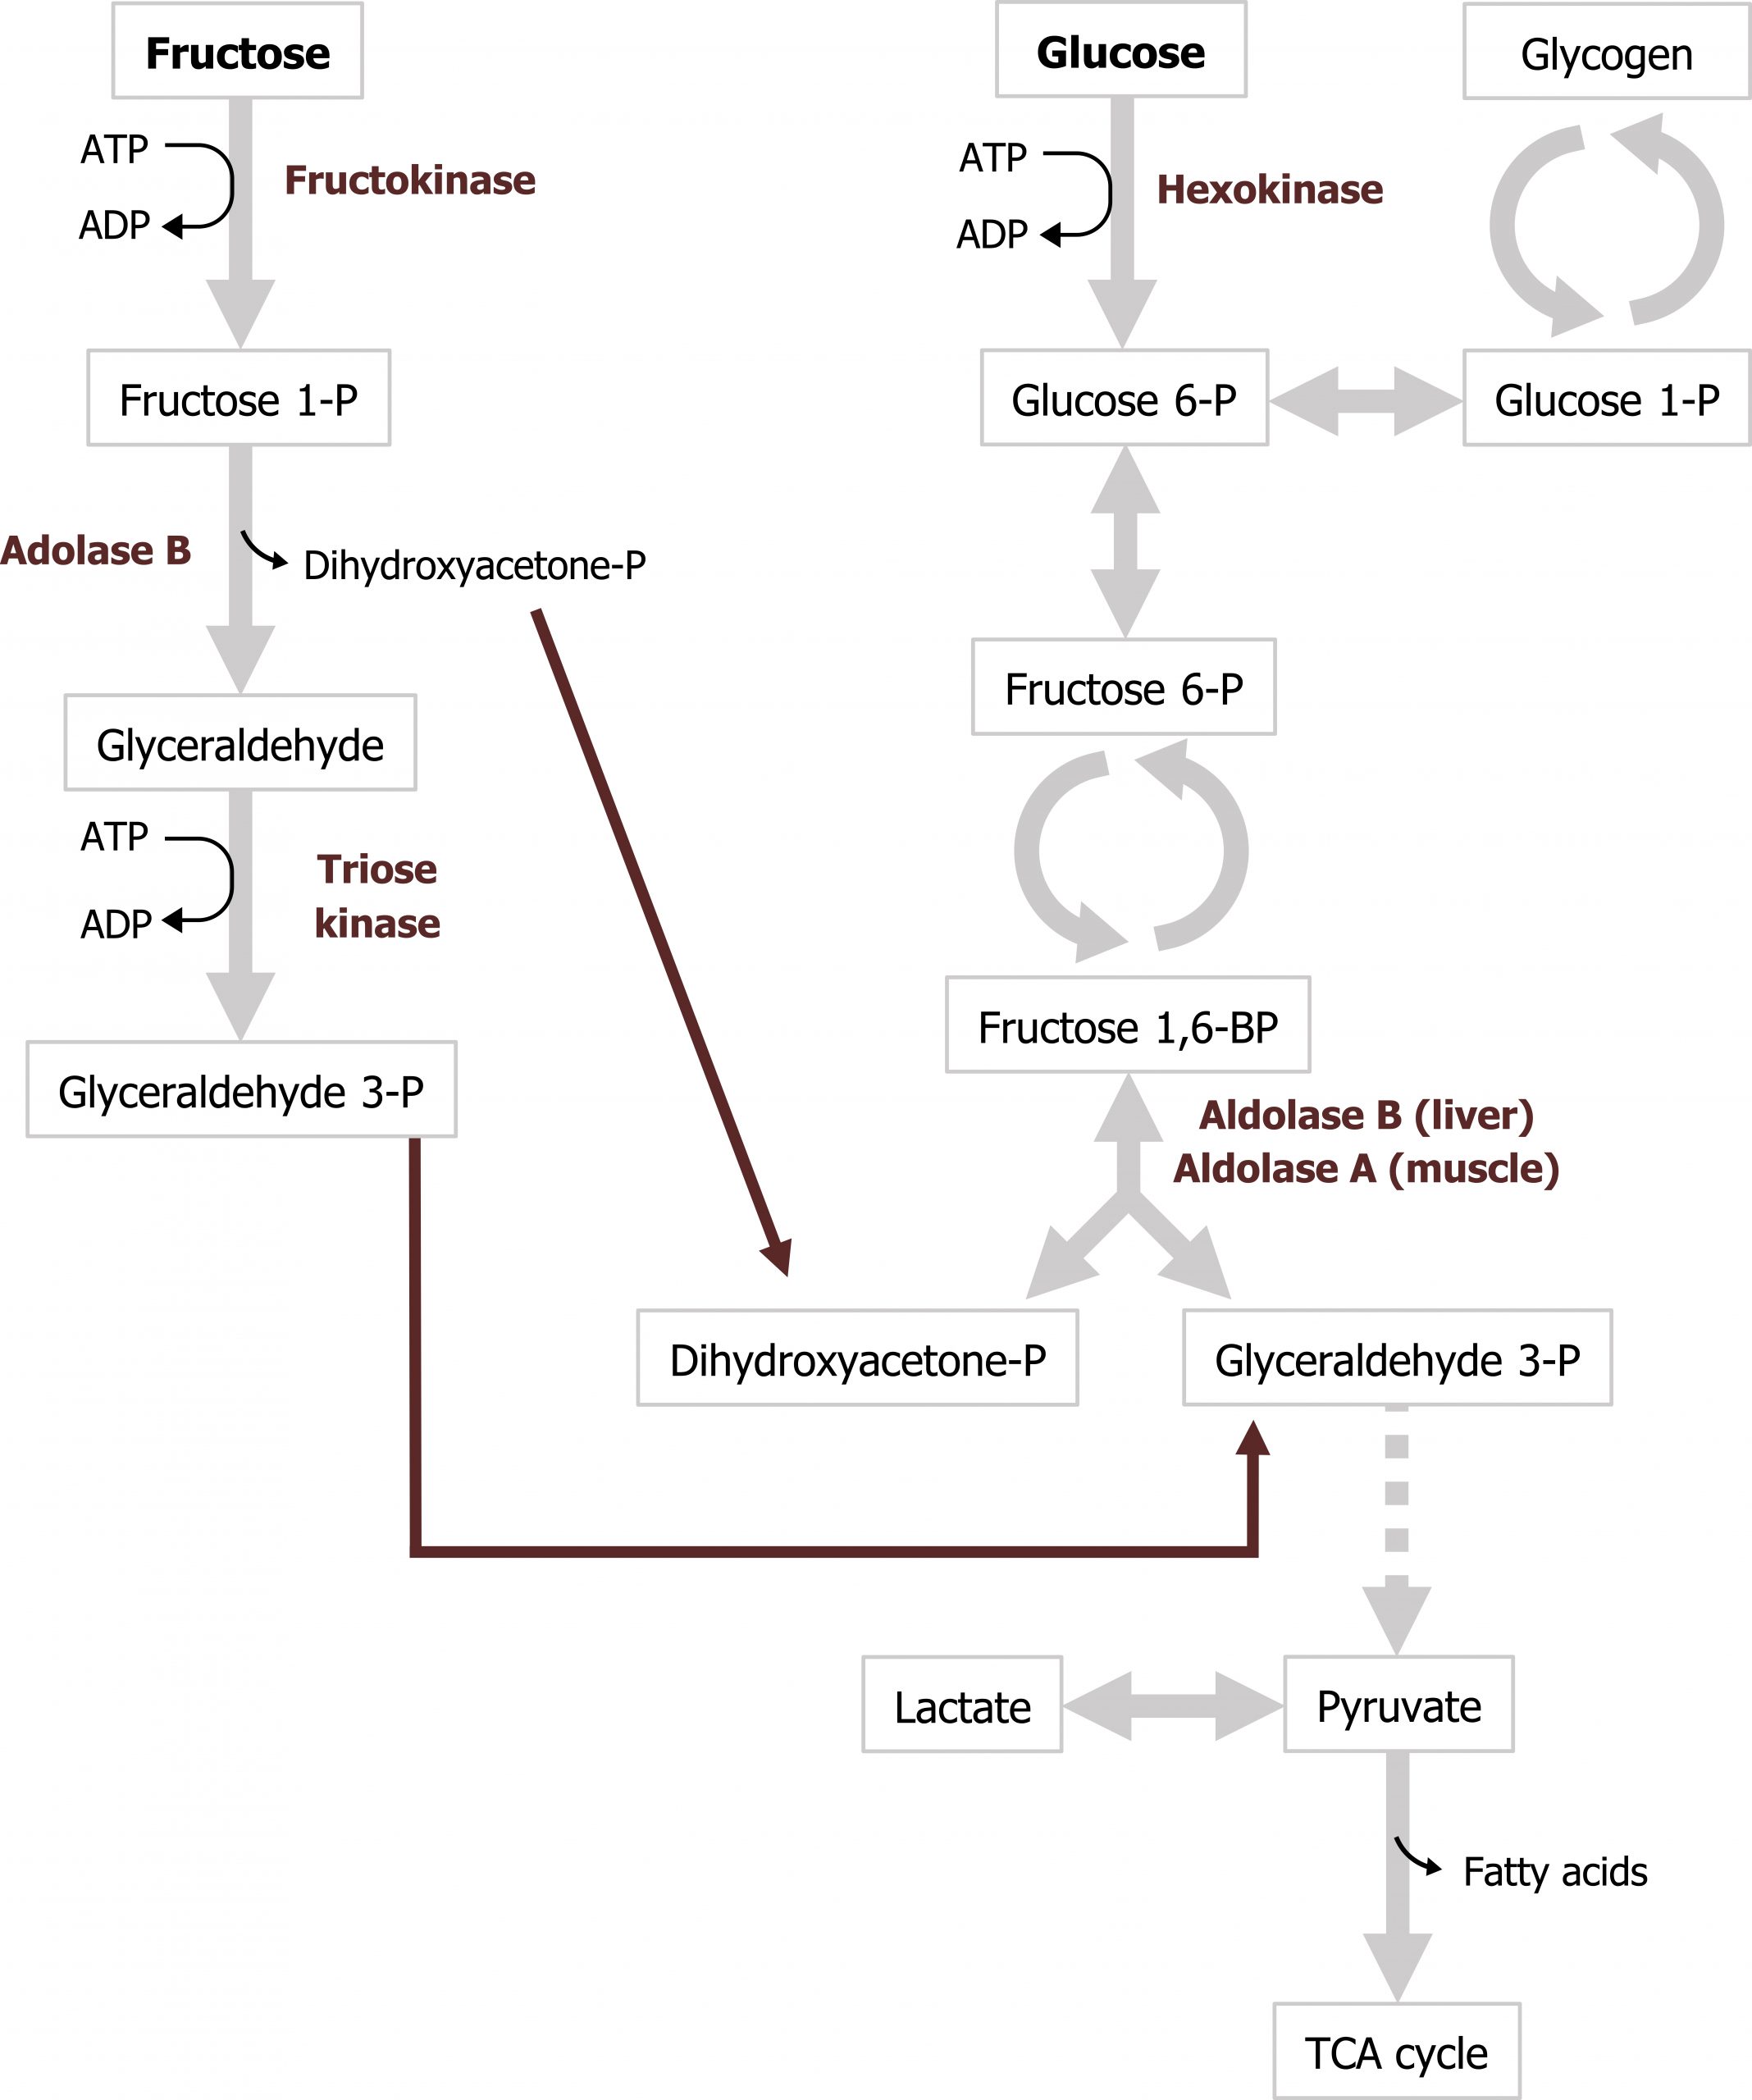
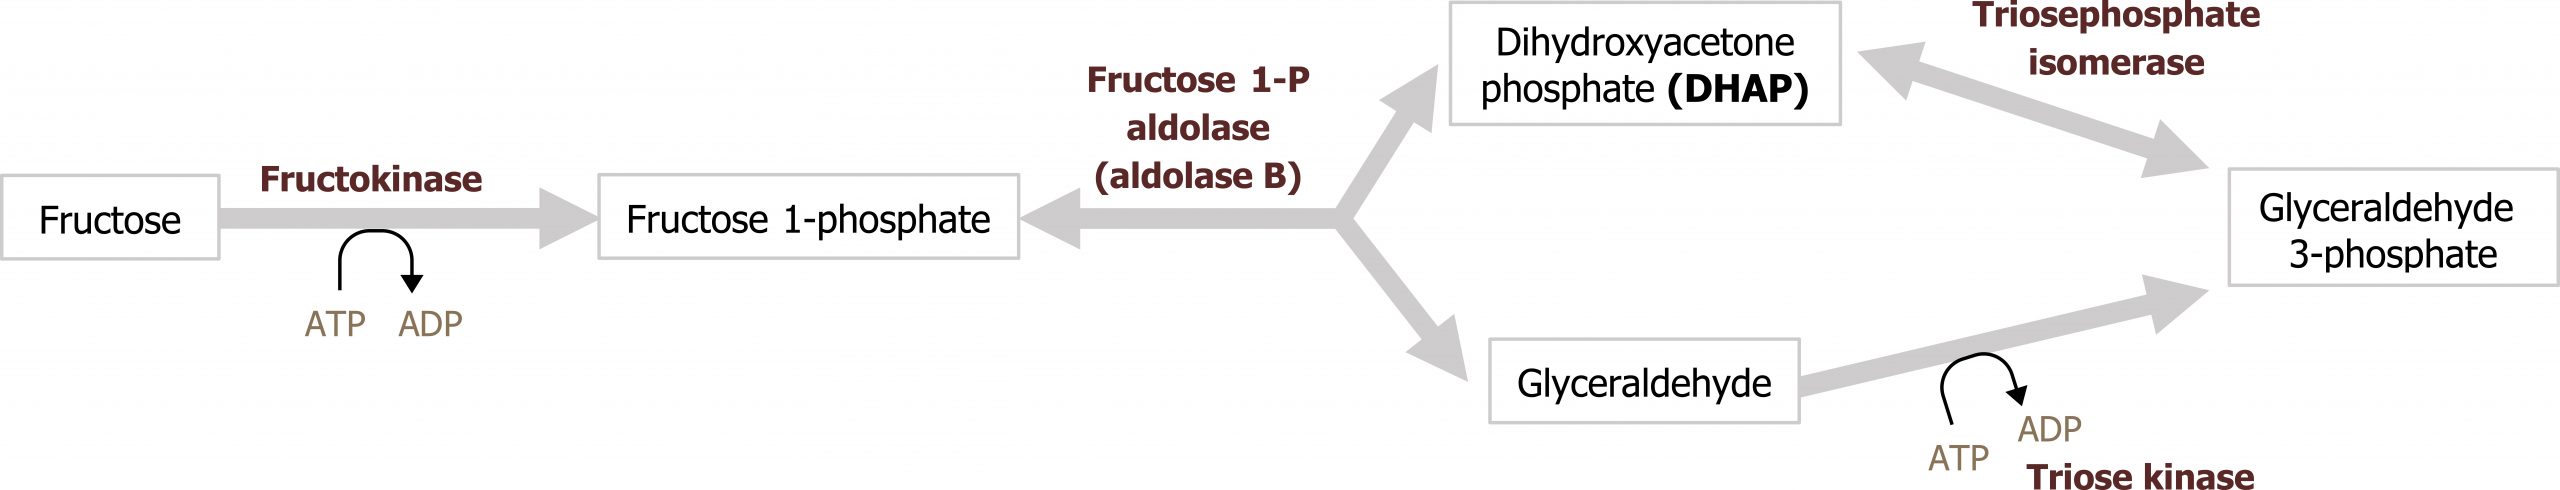
Aldolase B is the rate-limiting enzyme of fructose metabolism, although it is not a rate-limiting enzyme of glycolysis. Aldolase B’s affinity for fructose 1-phosphate is lower than fructose 1,6-bisphosphate and is very slow at physiological levels of fructose 1-phosphate. Consequently, after high fructose consumption, fructose 1-phosphate will accumulate in the liver, and it is slowly converted to glycolytic intermediates over time (figures 9.1 and 9.2).
Deficiencies in fructose metabolism
Essential fructosuria (fructokinase deficiency) and hereditary fructose intolerance (HFI) (a deficiency of the fructose 1-phosphate cleavage by aldolase B) are inherited disorders of fructose metabolism. A deficiency in fructokinase is a benign genetic disorder. In this case, an individual will have fructosuria; fructose is not phosphorylated and trapped in the cell. Consequently, any ingested fructose is shed in the urine. Hereditary fructose intolerance is caused by a deficiency in aldolase B and results in an accumulation of fructose 1-phosphate in the hepatocytes. Inability to metabolize fructose 1-phosphate can cause significant clinical symptoms, most notably hepatomegaly and fasting hypoglyemia. The accumulation of fructose 1-phosphate eventually inhibits both glycogenolysis and gluconeogenesis (due to a lack of free phosphate), leading to bouts of fasting hypoglycemia.
Galactose metabolism
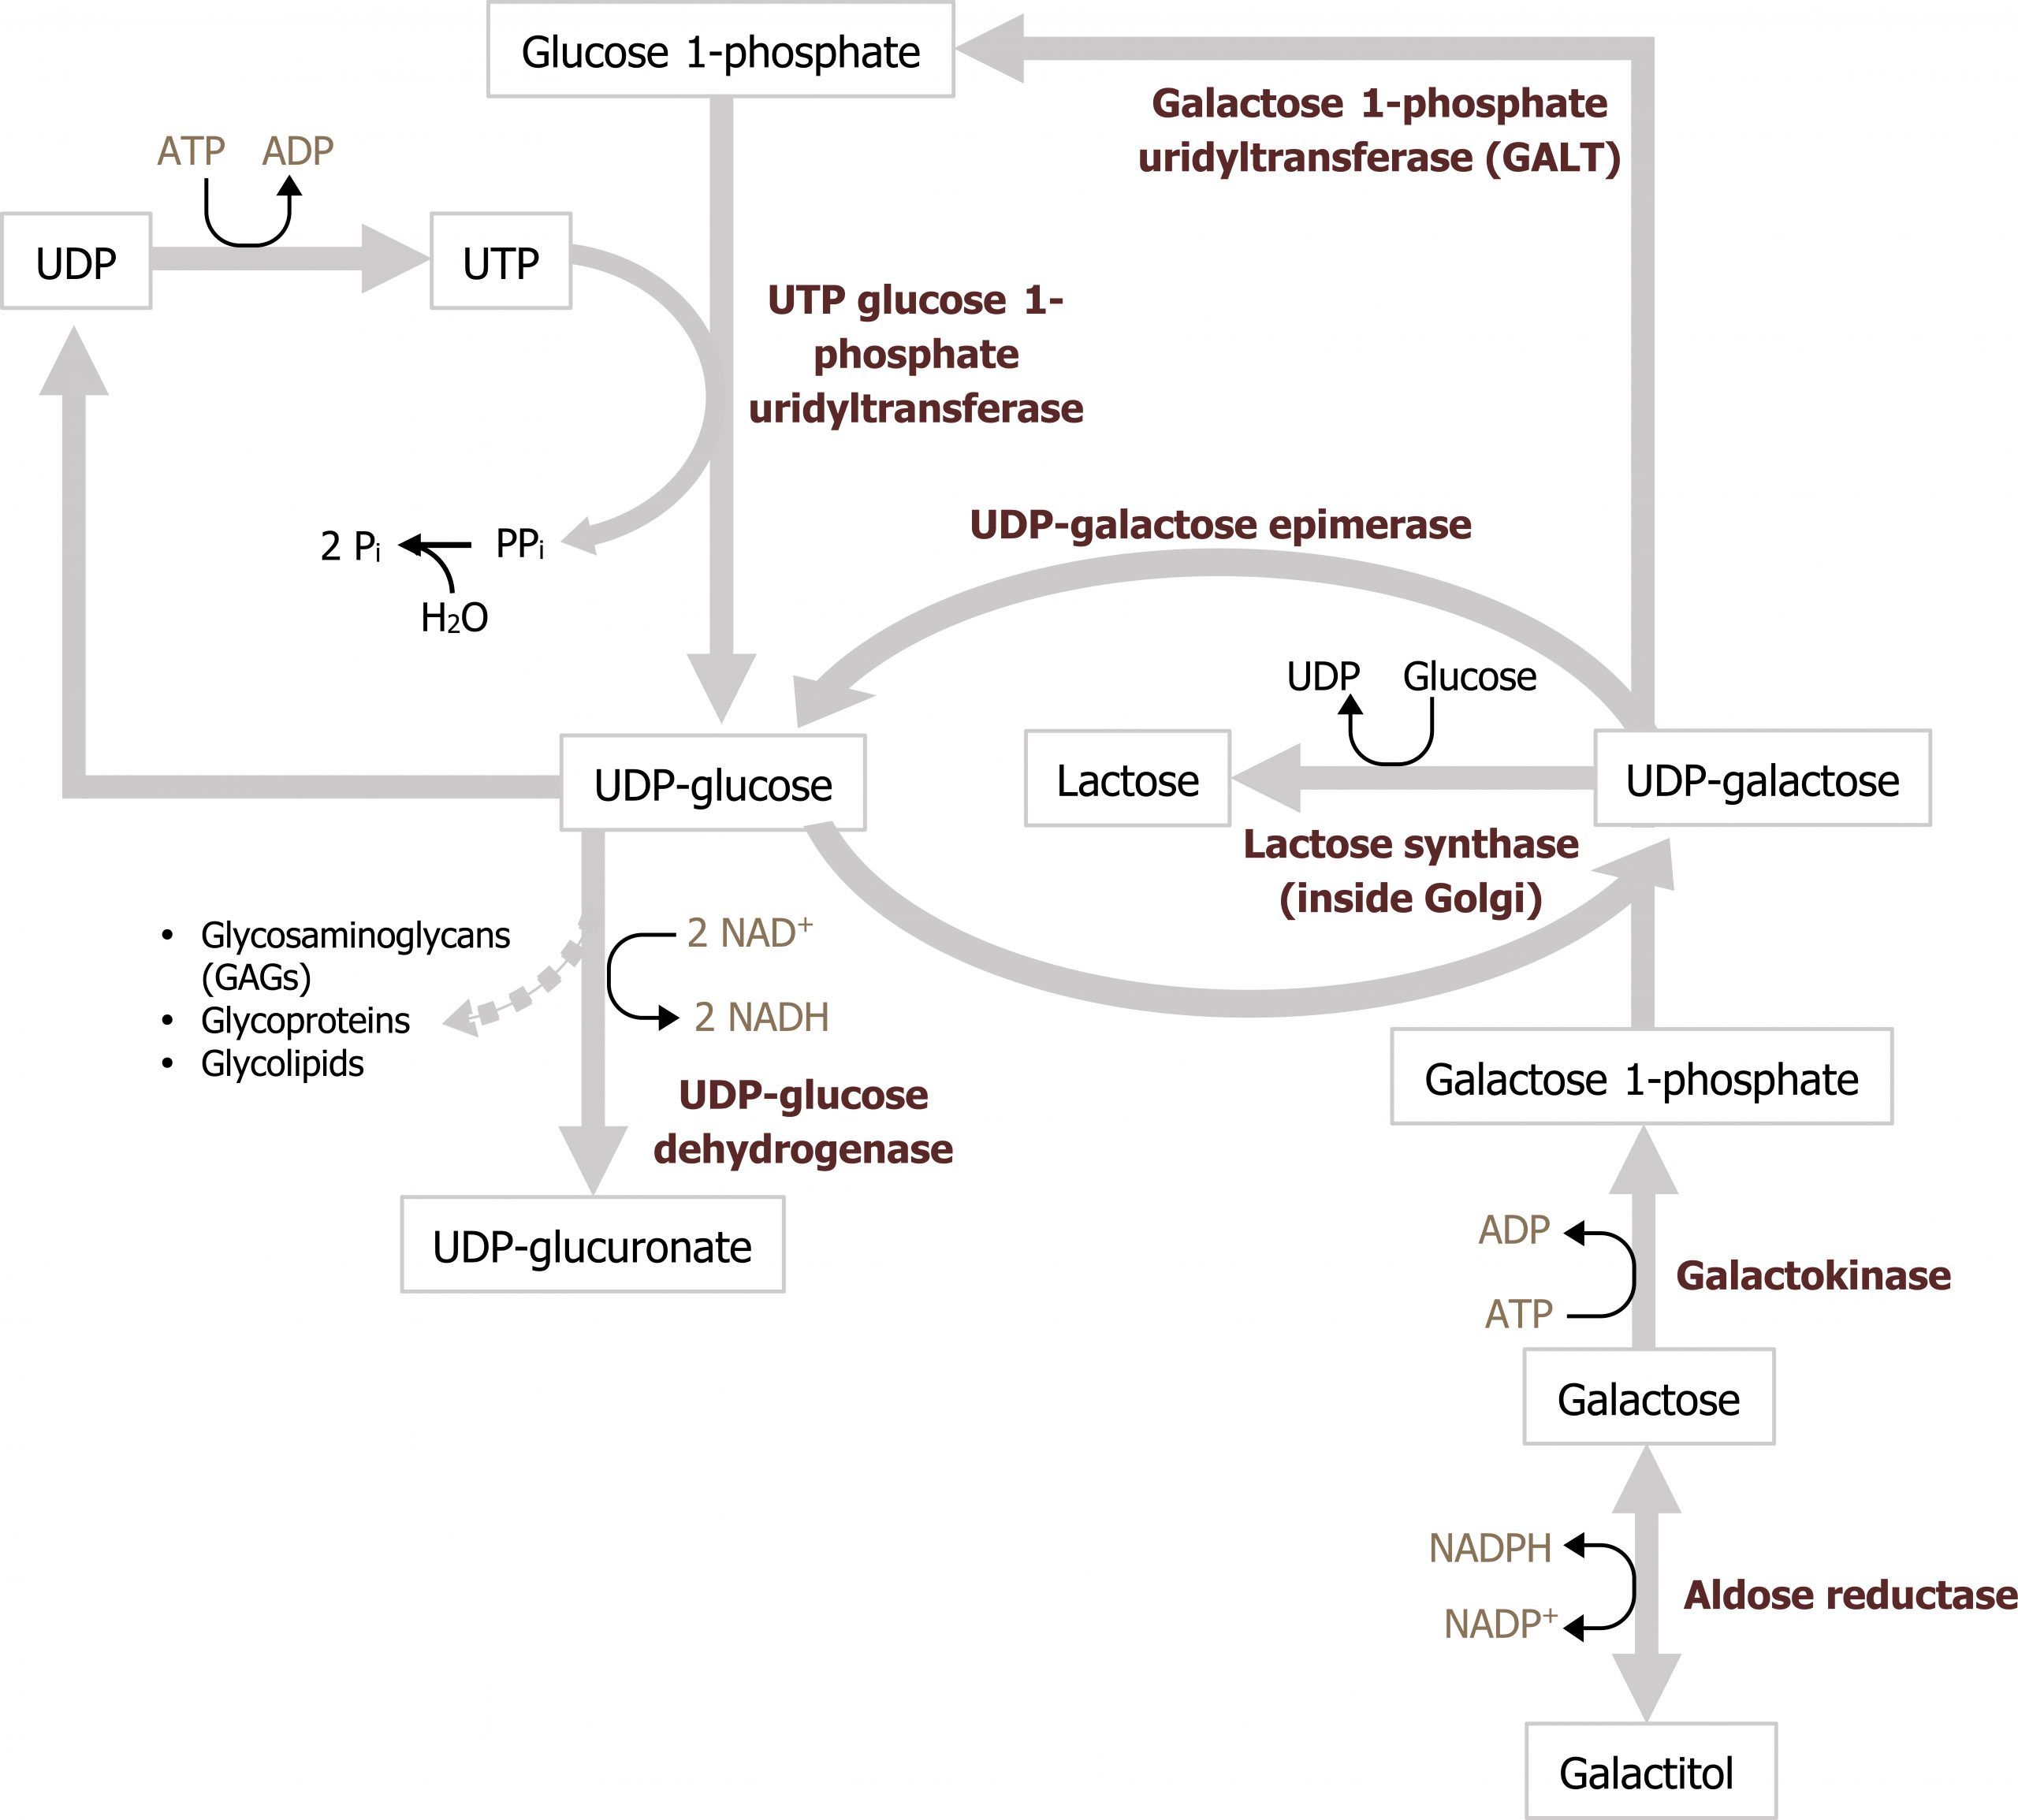
Galactose is consumed principally as lactose, which is cleaved to galactose and glucose in the intestine. Galactose is subsequently phosphorylated to galactose 1-phosphate by galactokinase (primarily in the liver). Following phosphorylation, galactose 1-phosphate is activated to a uridine diphosphate (UDP)-sugar by galactosyl uridylyltransferase (GALT). The metabolic pathway subsequently generates glucose 1-phosphate, which enters into the glycolytic pathway (figure 9.2)
Deficiencies in galactose metabolism
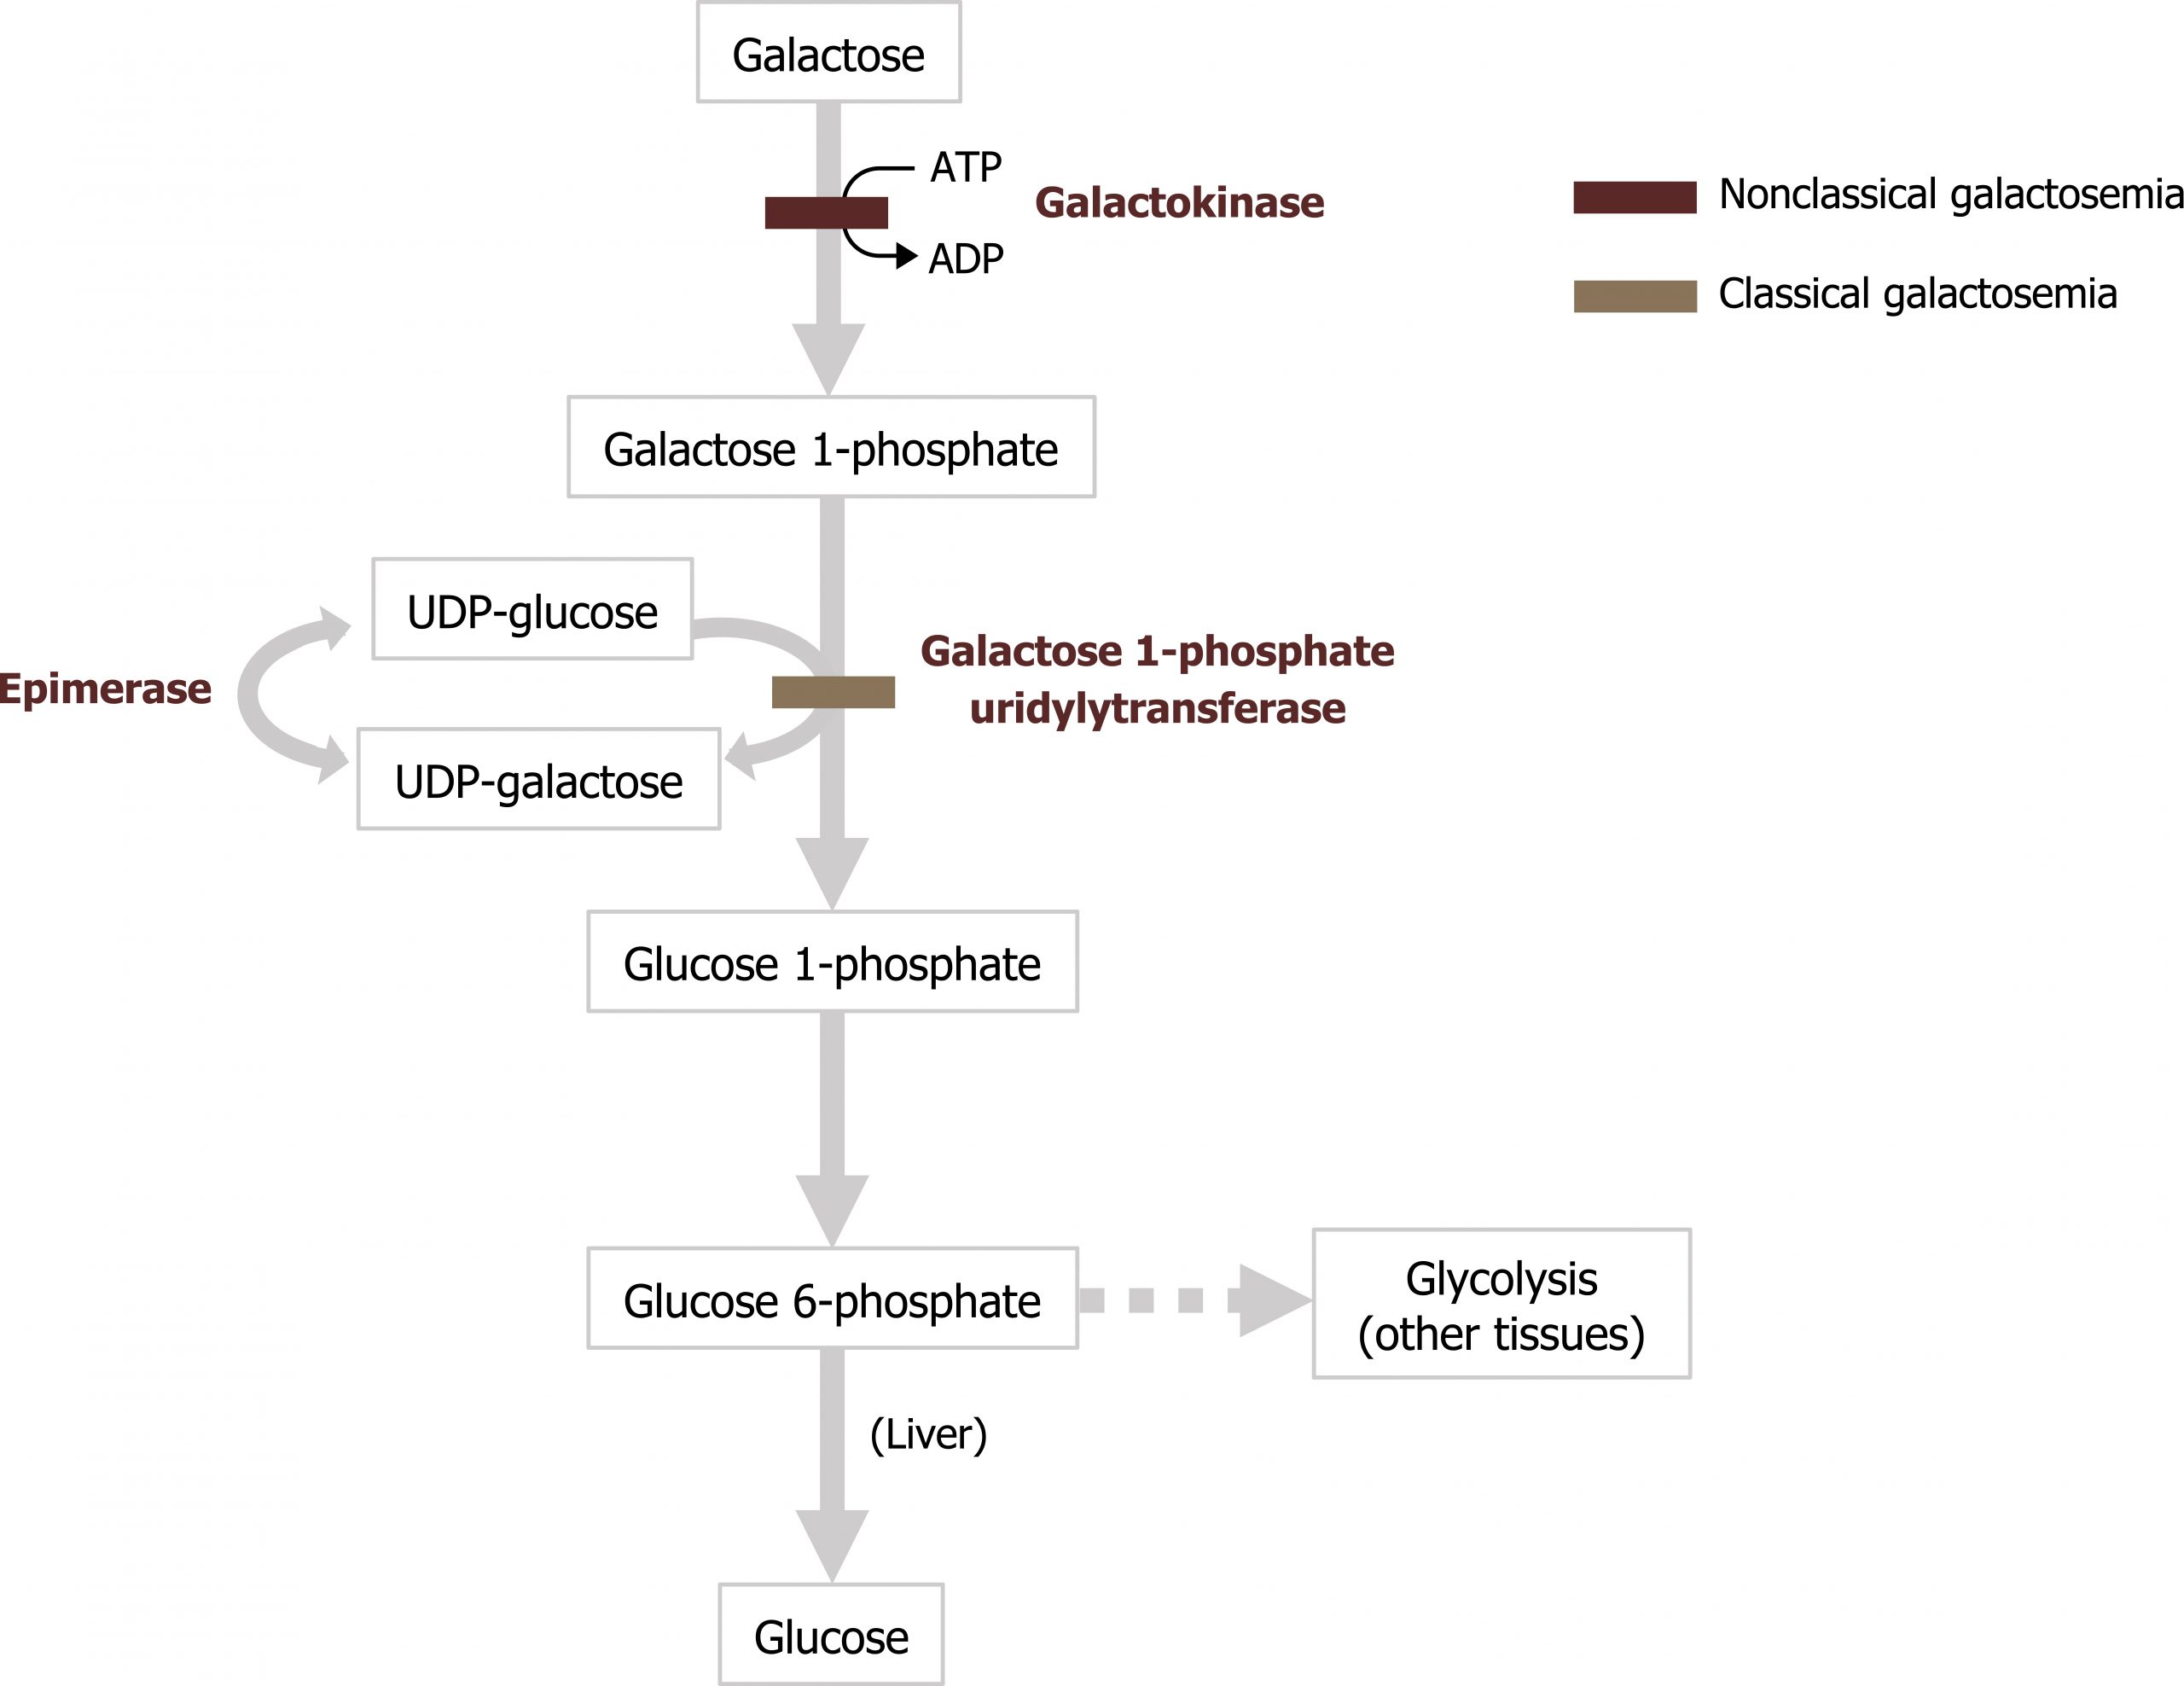
Classical galactosemia, a deficiency of galactosyl uridylyltransferase (GALT), results in the accumulation of galactose 1-phosphate in the liver and the inhibition of hepatic glycogen metabolism and other pathways that require UDP-sugars. Cataracts can occur from the accumulation of galactose in the blood, which is converted to galactitol (the sugar alcohol of galactose) in the lens of the eye.
The accumulating galactose 1-phosphate is especially toxic for the liver, kidneys, and central nervous system. If left untreated, the disease is fatal due to complications such as gram-negative sepsis or hepatic and renal failure. The absence of GALT activity can be detected any time after birth and screened for as part of newborn screening. It is essential to obtain results promptly, because children with classic galactosemia can have a life-threatening crisis within the first few days after birth. Infants with a positive result are placed on a lactose-free formula, and confirmatory testing is accomplished by measuring specific metabolite concentrations and enzyme activity in erythrocytes.
Nonclassical galactosemia causes fewer medical complications and presents with a different pattern of symptoms. Presentations can involve cataracts, delayed development, and kidney problems.
9.1 References and resources
Text
Ferrier, D. R., ed. Lippincott Illustrated Reviews: Biochemistry, 7th ed. Philadelphia: Wolters Kluwer Health/Lippincott Williams & Wilkins, 2017, Chapter 12: Metabolism of Monosaccharides and Disaccharides, Chapter 23: Effects of Insulin and Glucagon: Section IV.
Le, T., and V. Bhushan. First Aid for the USMLE Step 1, 29th ed. New York: McGraw Hill Education, 2018, 72, 80–81.
Lieberman, M., and A. Peet, eds. Marks’ Basic Medical Biochemistry: A Clinical Approach, 5th ed. Philadelphia: Wolters Kluwer Health/Lippincott Williams & Wilkins, 2018, Chapter 22: Generation of ATP from Glucose, Fructose and Galactose, Chapter 33: Ethanol Metabolism.
Figures
Grey, Kindred, Figure 9.1 Convergence of fructose and glucose metabolism. 2021. https://archive.org/details/9.1_20210926. CC BY 4.0.
Grey, Kindred, Figure 9.2 Fructose metabolism and reaction by Aldolase B. Deficiencies in aldolase B can result in hereditary fructose intolerance while deficiencies in frutokinase can result in essential fructosuria. 2021. https://archive.org/details/9.2_20210926. CC BY 4.0.
Grey, Kindred, Figure 9.3 Galactose metabolism; glucose 6-phosphate is converted to glucose 1-phosphate which enters the pathway. 2021. https://archive.org/details/9.3_20210926. CC BY 4.0.
Grey, Kindred, Figure 9.4 Comparison of Classical and Nonclassical galatosemia. 2021. https://archive.org/details/9.4_20210926. CC BY 4.0.
9.2 Alcohol Metabolism
Metabolism of alcohol occurs primarily in the liver through two different oxidative pathways. The activity of each pathway depends on the ethanol concentration and the frequency of ethanol consumption.
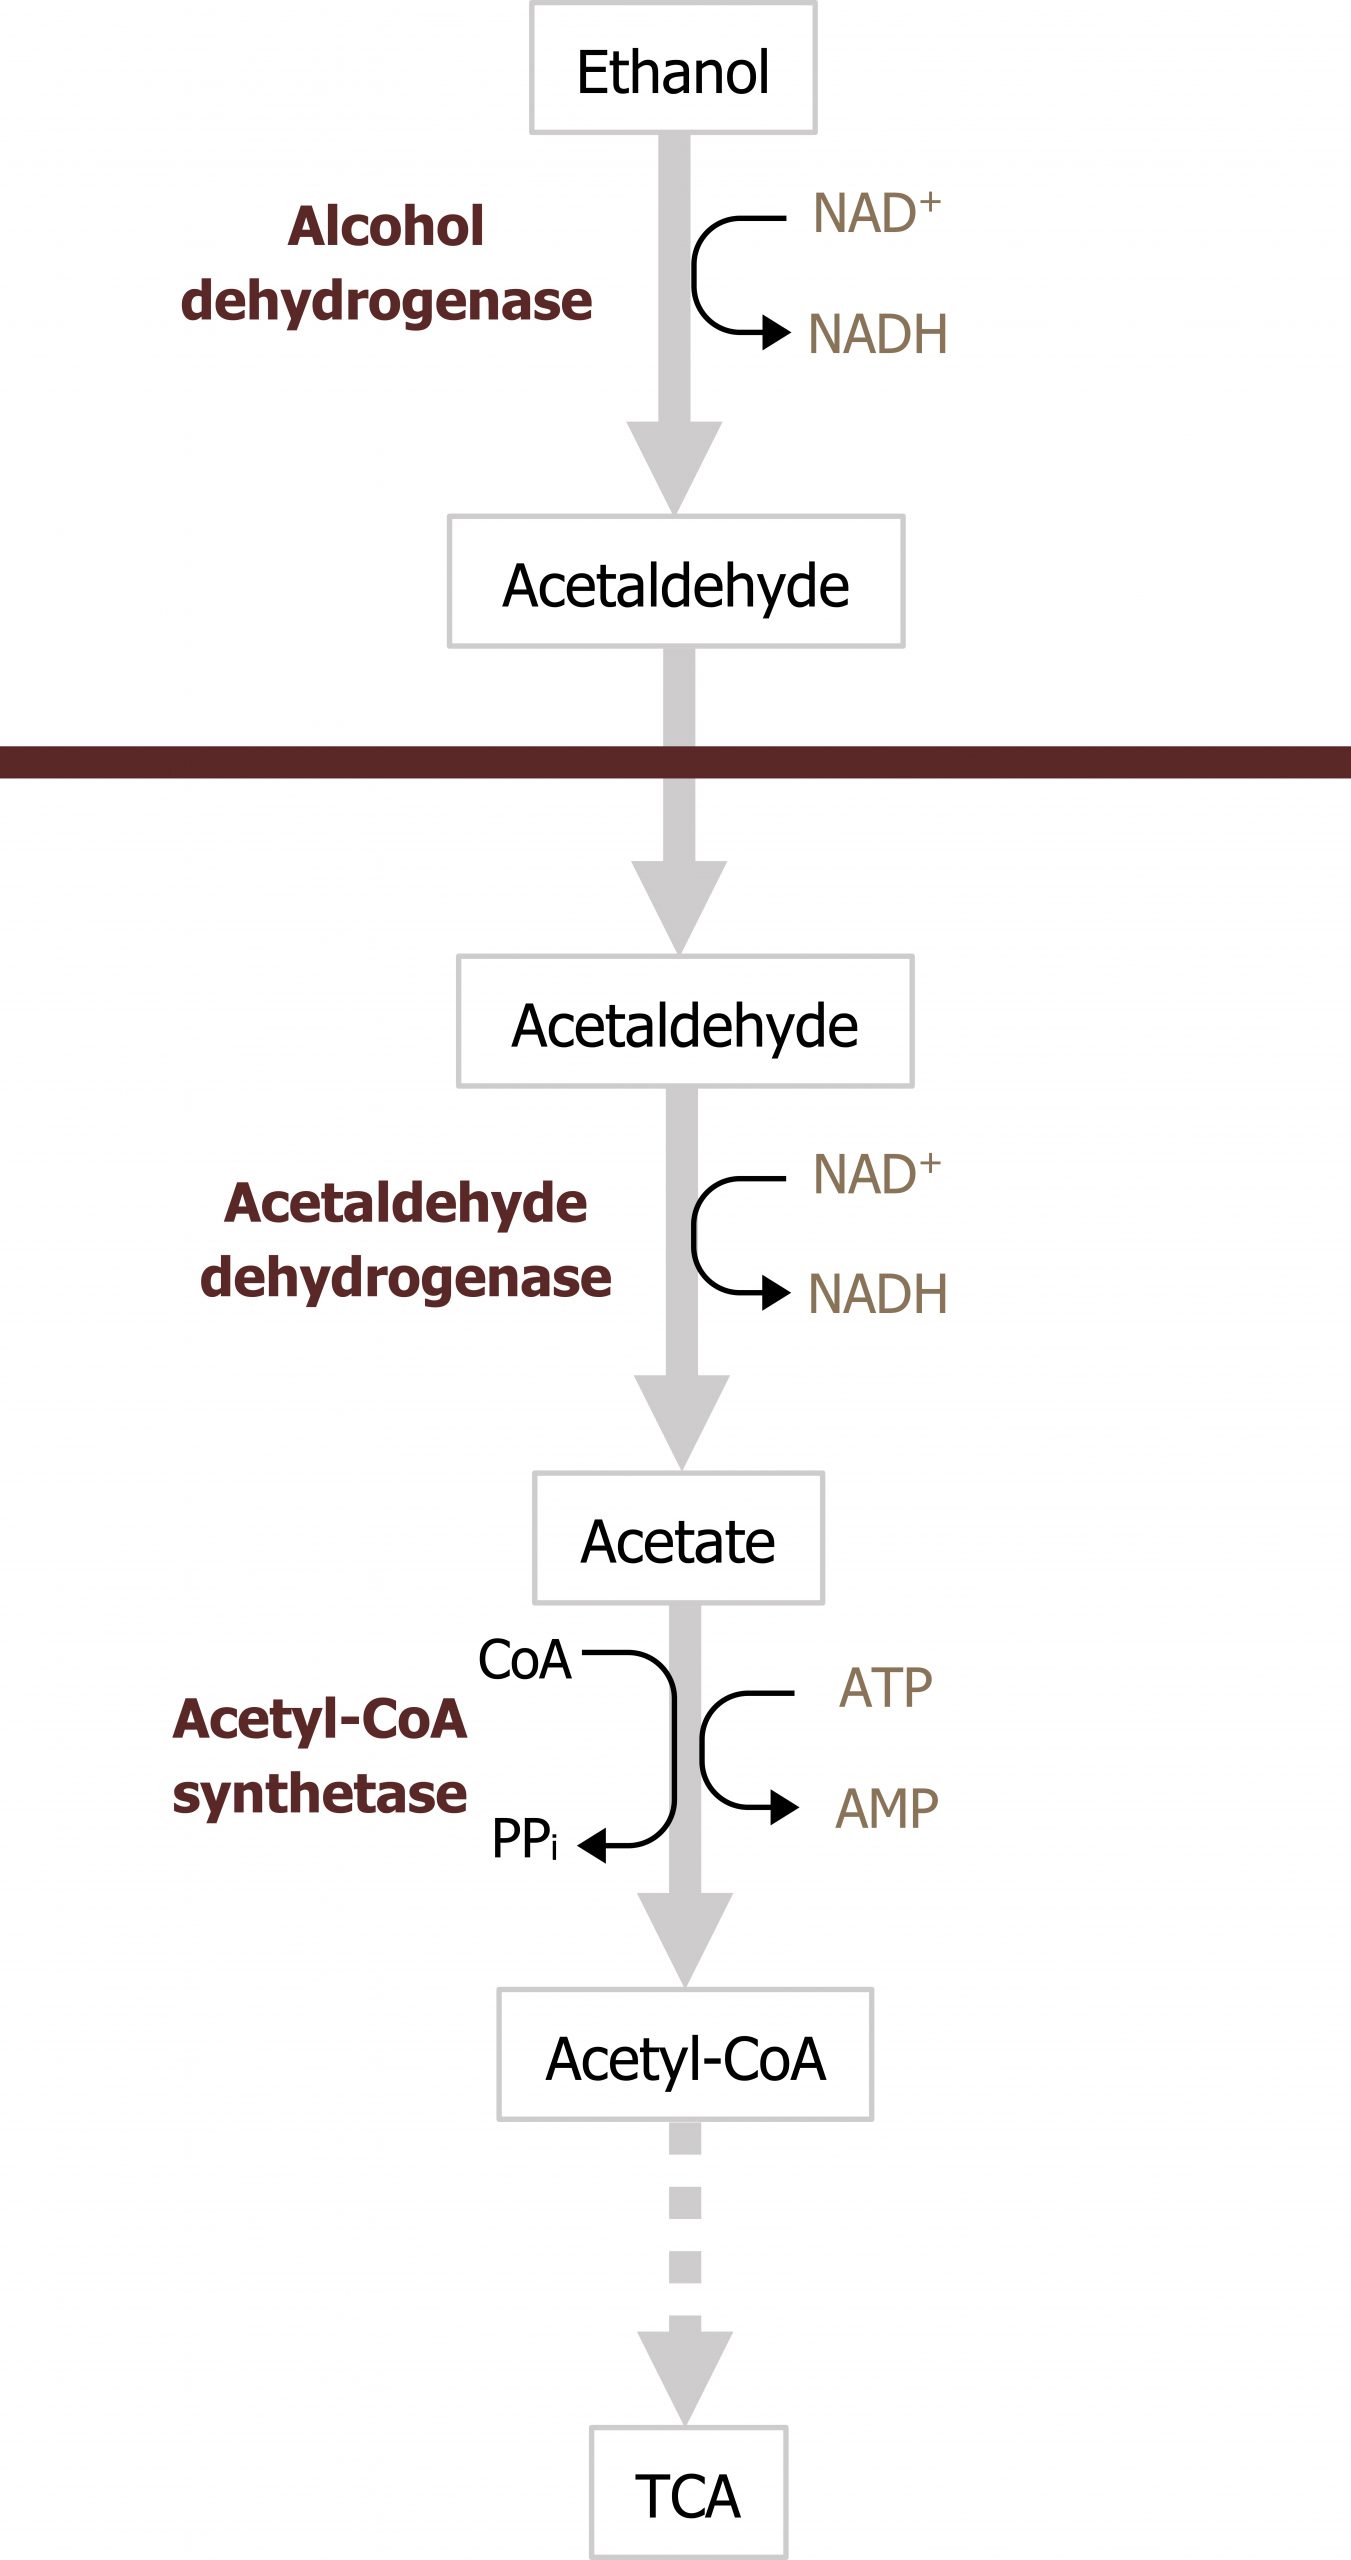
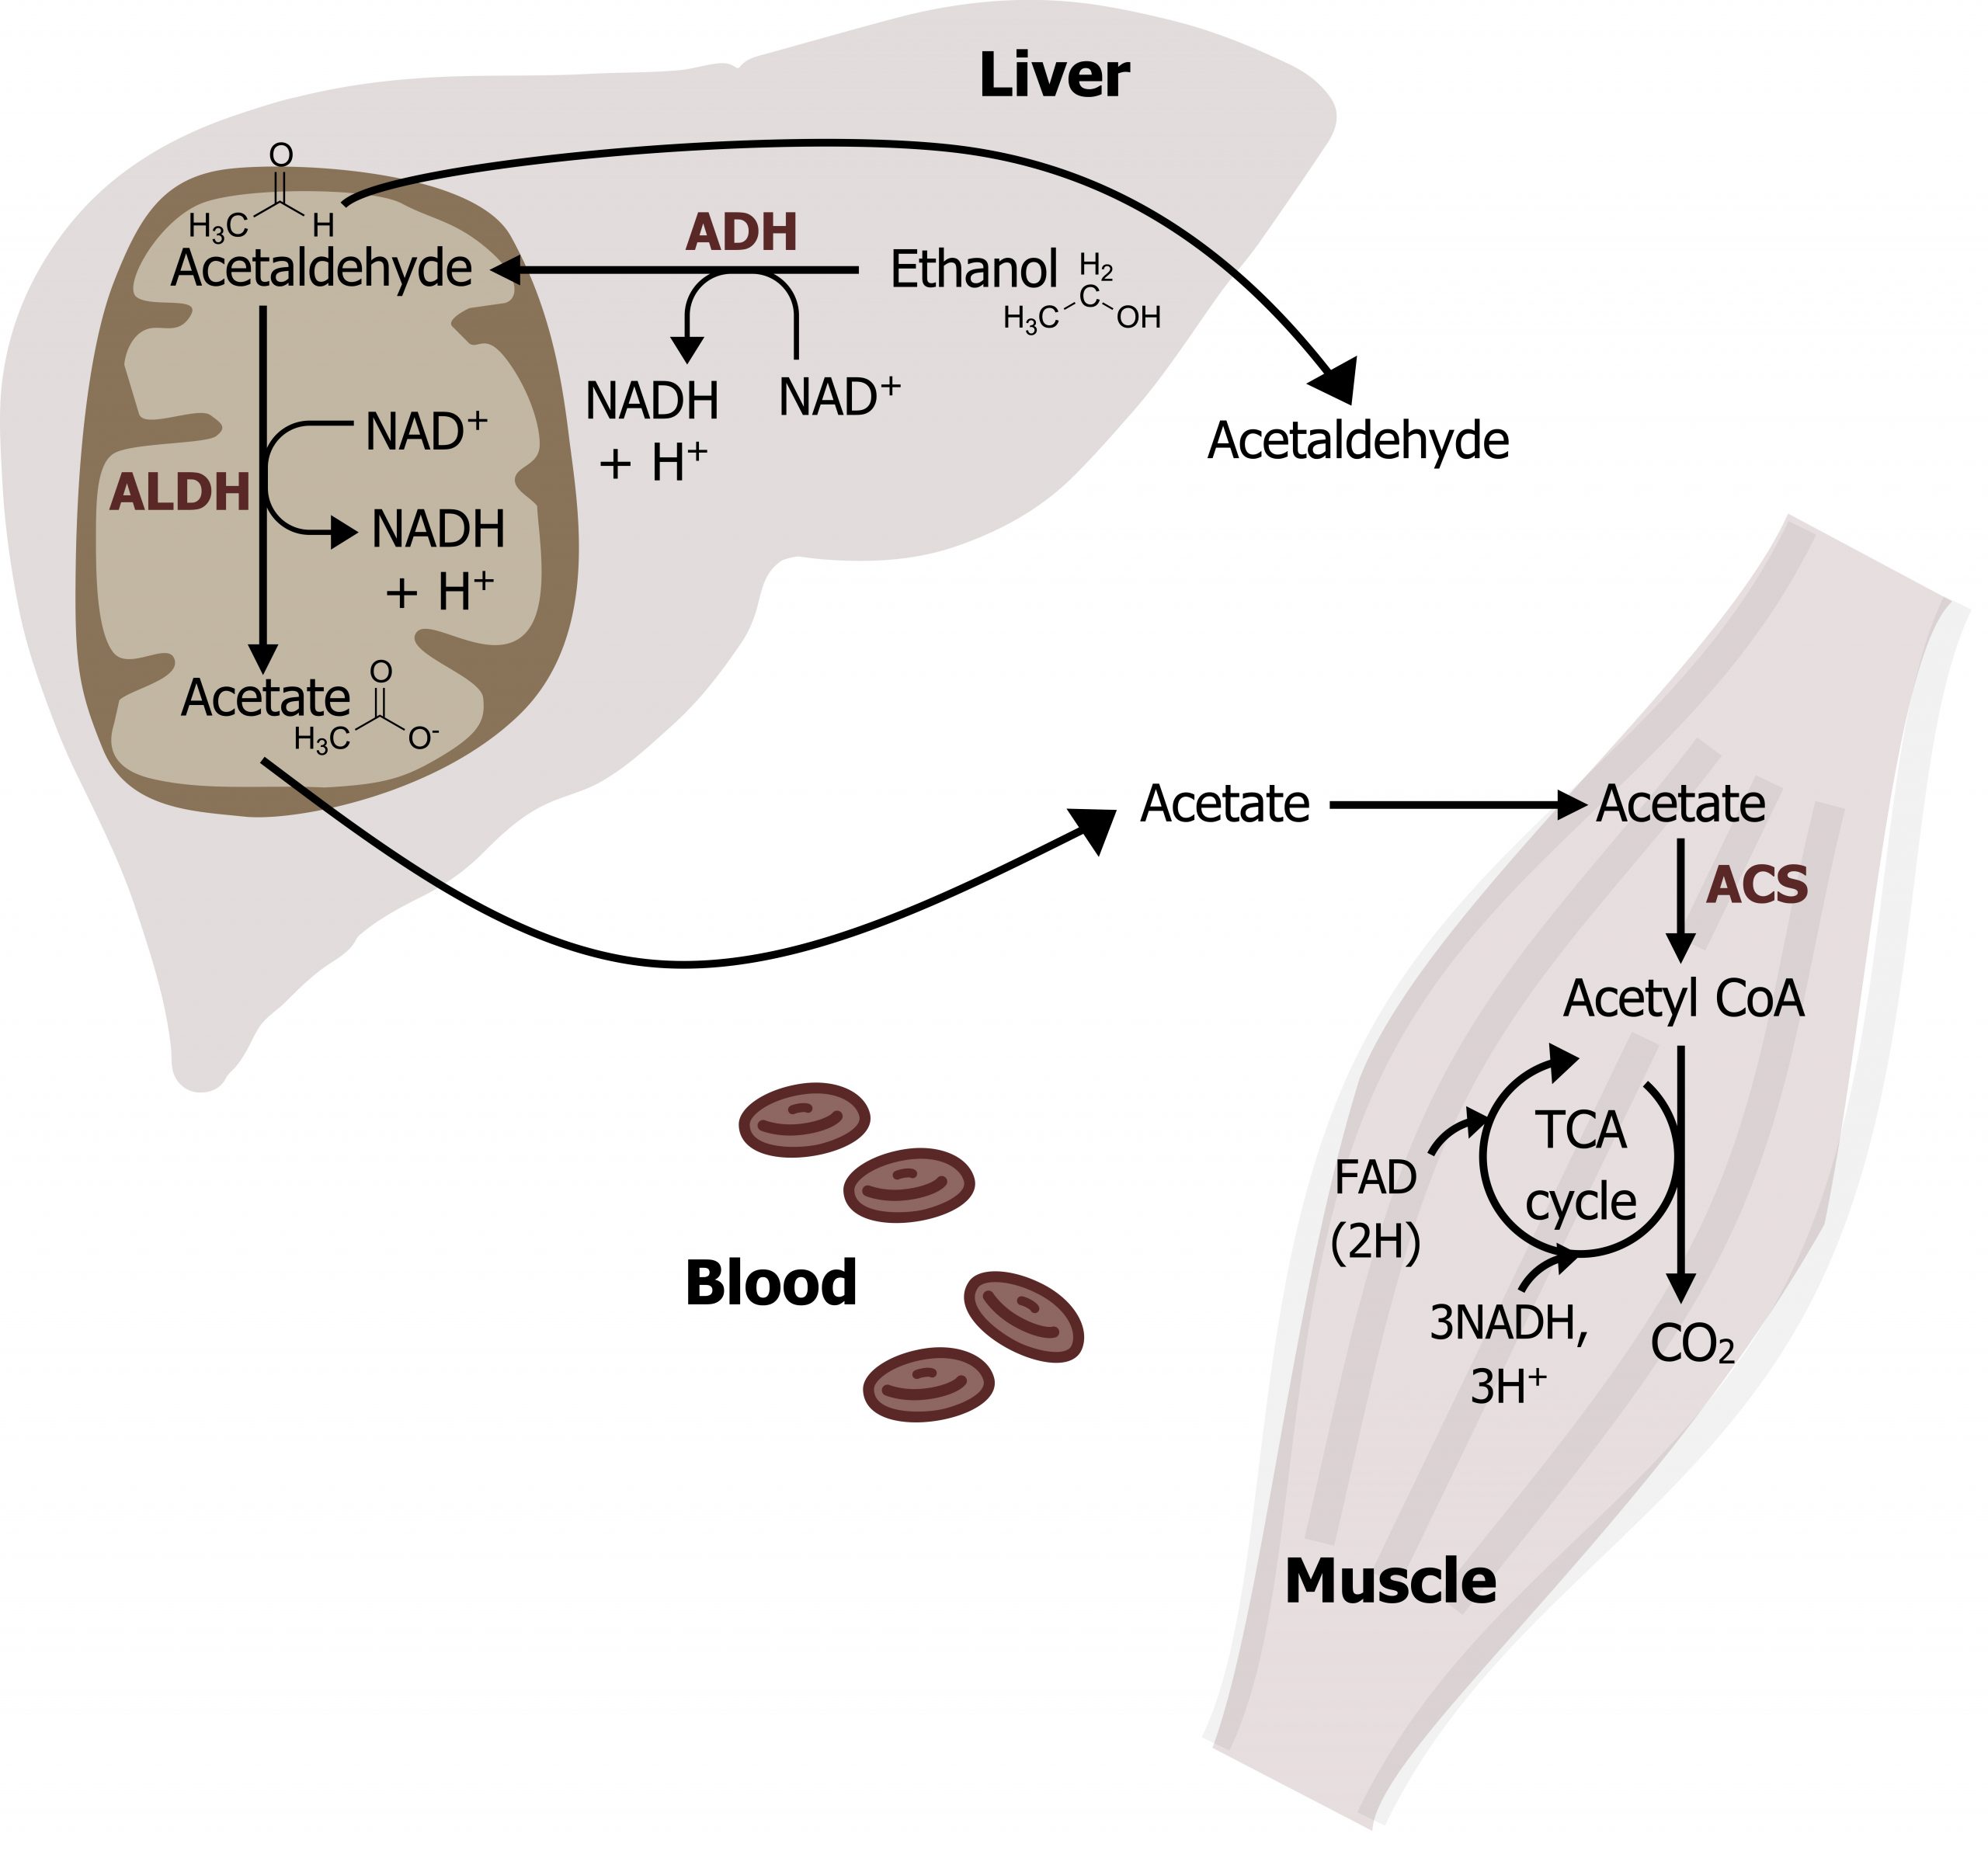
At low concentrations, oxidation of ethanol is a two-step process that occurs in both the cytosol and the mitochondria (figure 9.5). The first step of the reaction by alcohol dehydrogenase (ADH) occurs in the cytosol and produces acetaldehyde. Acetaldehyde is converted into acetate in the mitochondria by acetaldehyde dehydrogenase (ALDH) and can be transported in the blood to be used as an energy source for peripheral tissues (figure 9.5). The acetate can be converted to acetyl-CoA by acetyl-CoA synthetase (figure 9.6), and this will be oxidized in the TCA cycle. Each step in the oxidation of ethanol produces NADH, which increases the ratio of NADH/NAD+. The increase in this ratio can alter metabolism of other substrates and cause metabolic dysfunction, which will be discussed below.
Consequences of ethanol metabolism in the liver
At each step in ethanol oxidation, NADH is generated in both the mitochondrial and cytosolic compartments (figure 9.5). This can have major metabolic ramifications depending on the underlying metabolic environment (figure 9.7).
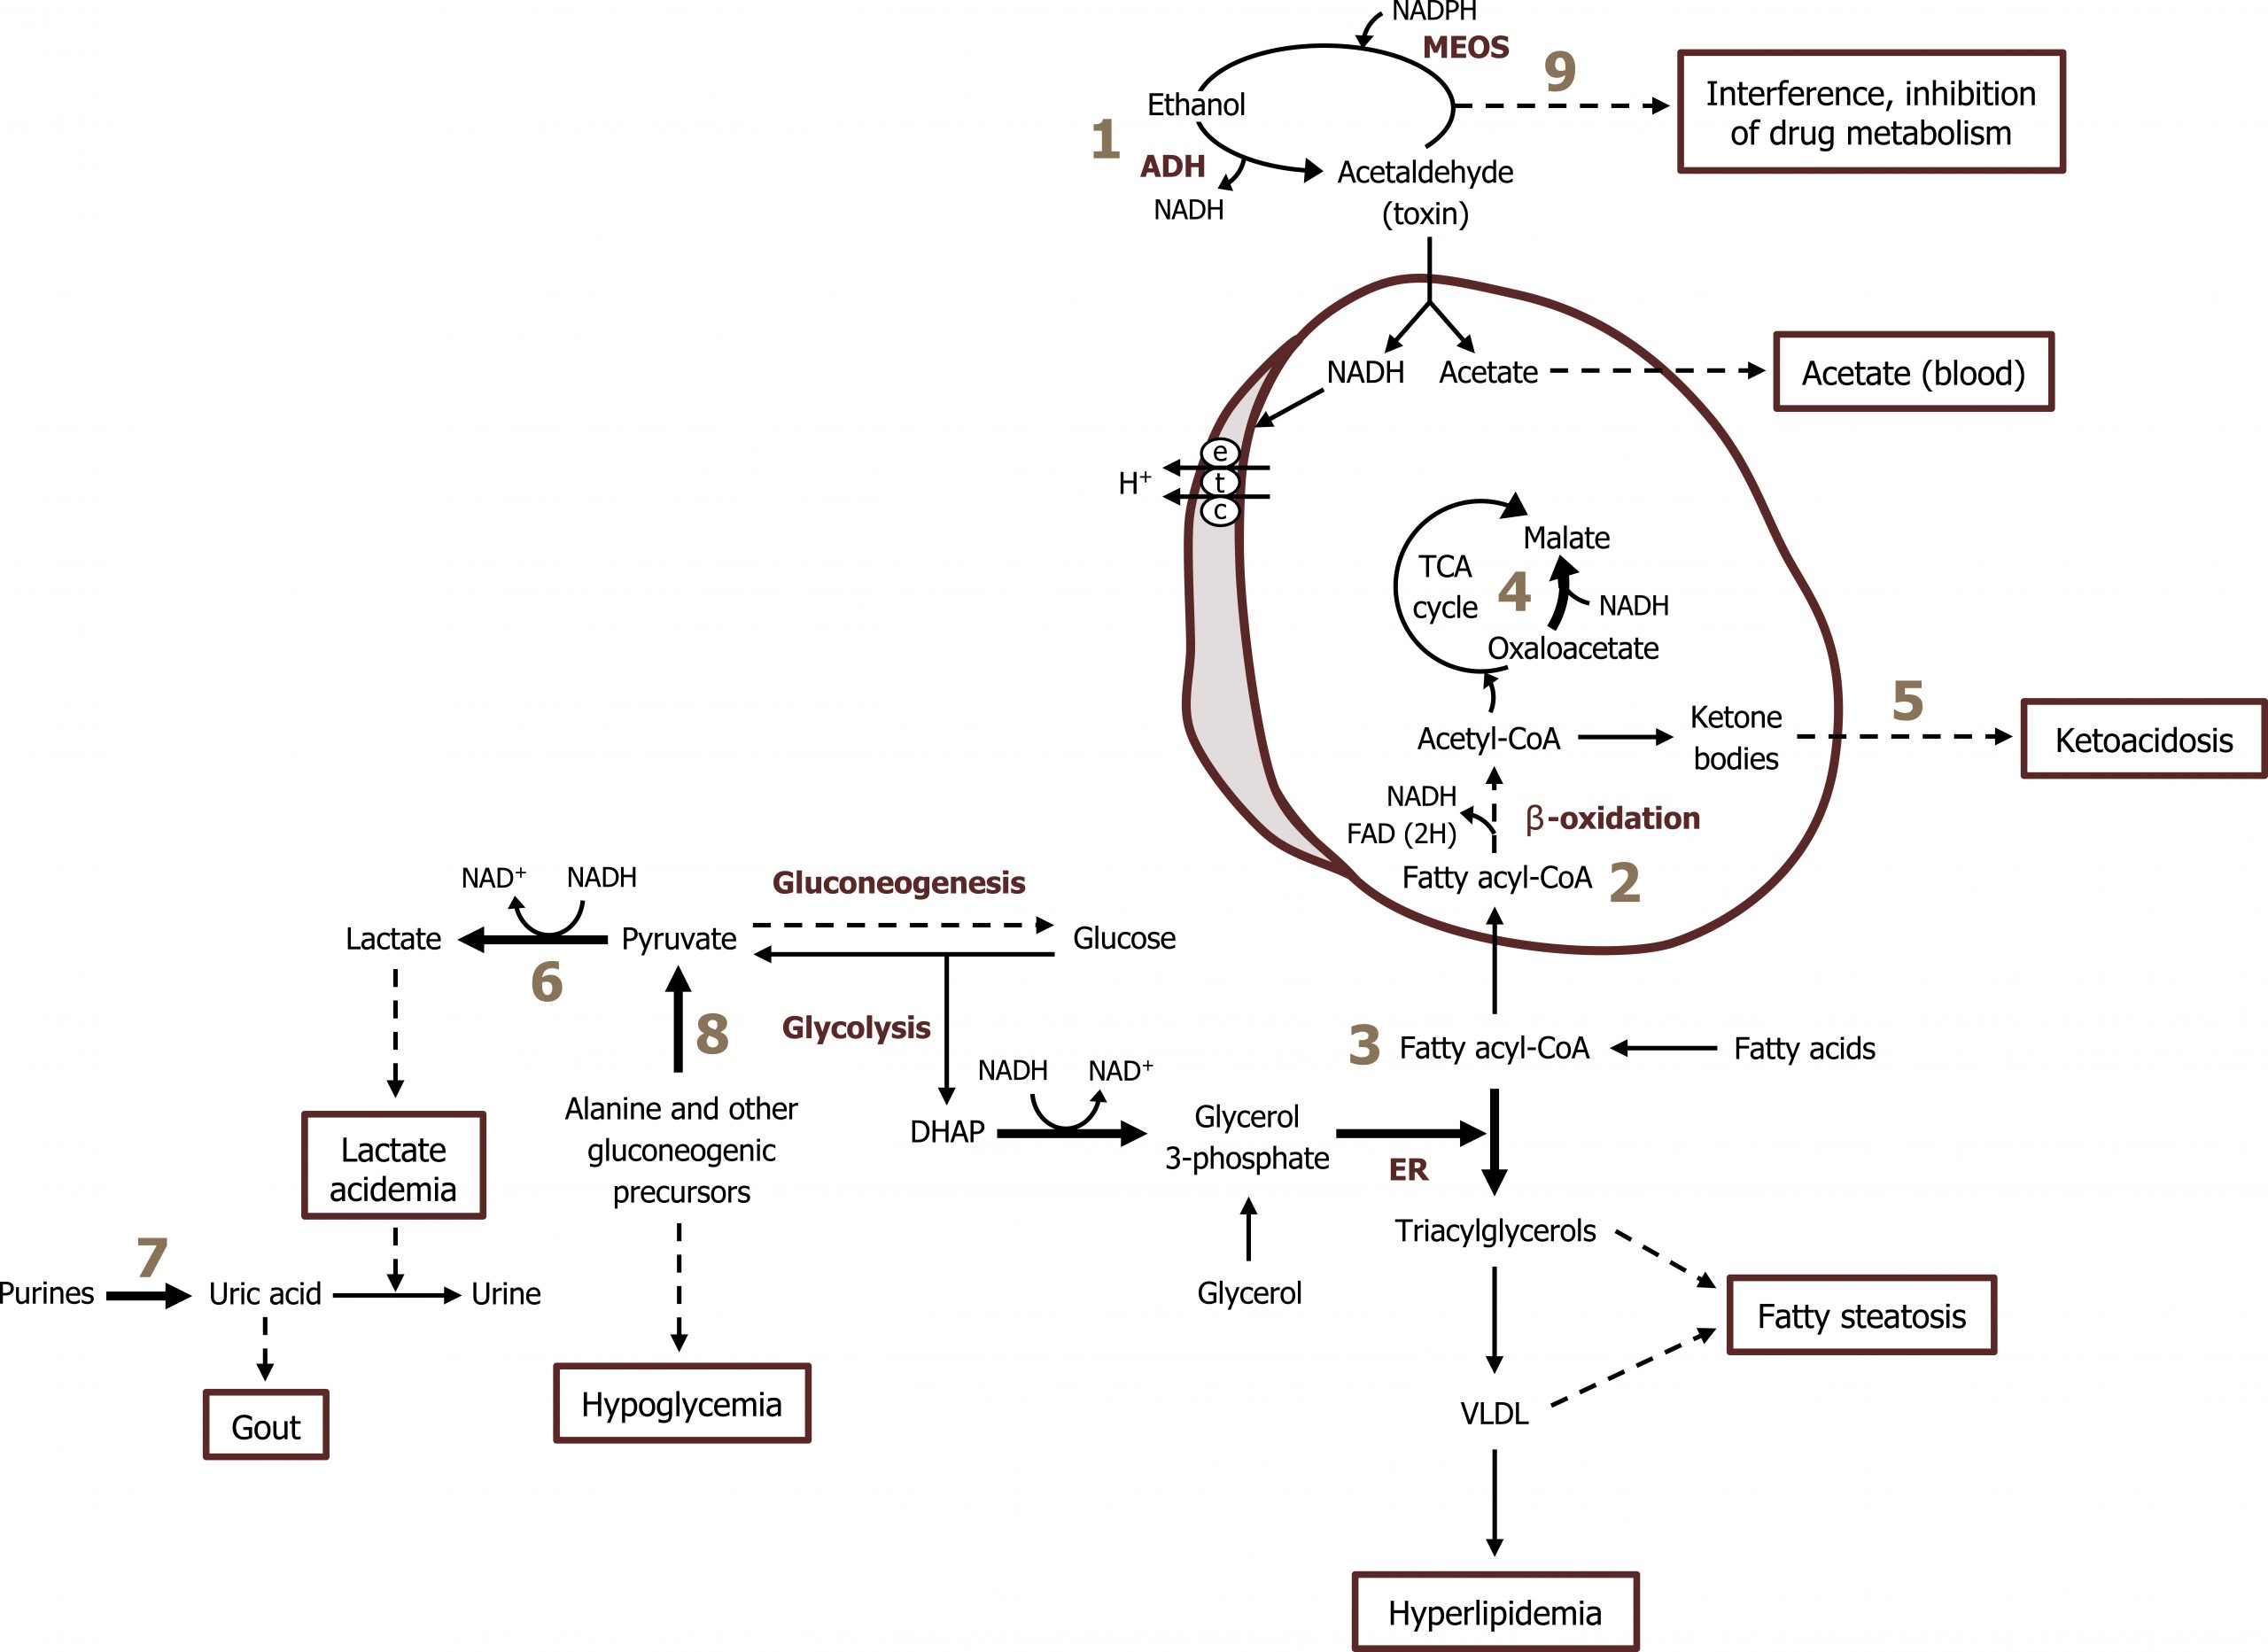
- Hypoglycemia: High NADH produced by alcohol metabolism (figure 9.7; label 1) contributes to the diversion of the gluconeogenic substrates OAA and pyruvate. The higher NADH/NAD+ ratio drives the reactions toward malate and lactate, respectively. This can lead to the presentation of fasting hypoglycemia (figure 9.7; labels 4, 6, and 8).
- Fatty steatosis: High NADH/NAD+ ratio also increases the conversion of dihydroxyacetone phosphate to glycerol 3-phosphate, contributing to increased synthesis of triacylglycerol. Additionally, increases in reactive oxygen species, which can impair protein synthesis, prevent the assembly and secretion of VLDLs. This can ultimately contribute to fatty liver disease (figure 9.7; label 3).
- Acidosis: Increases in alternative substrates for peripheral tissues (acetate from alcohol oxidation) can cause an elevation of ketones leading to ketoacidosis (figure 9.7; label 5).
- Hyperlipidemia: The elevated NADH will negatively impact flux through the TCA by reducing the activity of the two key regulatory enzymes. This can lead to an increased shunting of citrate for fatty acid synthesis (figure 9.7; labels 2 and 3).
- Acetaldehyde is a toxic compound that forms adducts with other proteins reducing their ability to function.
Excessive alcohol consumption
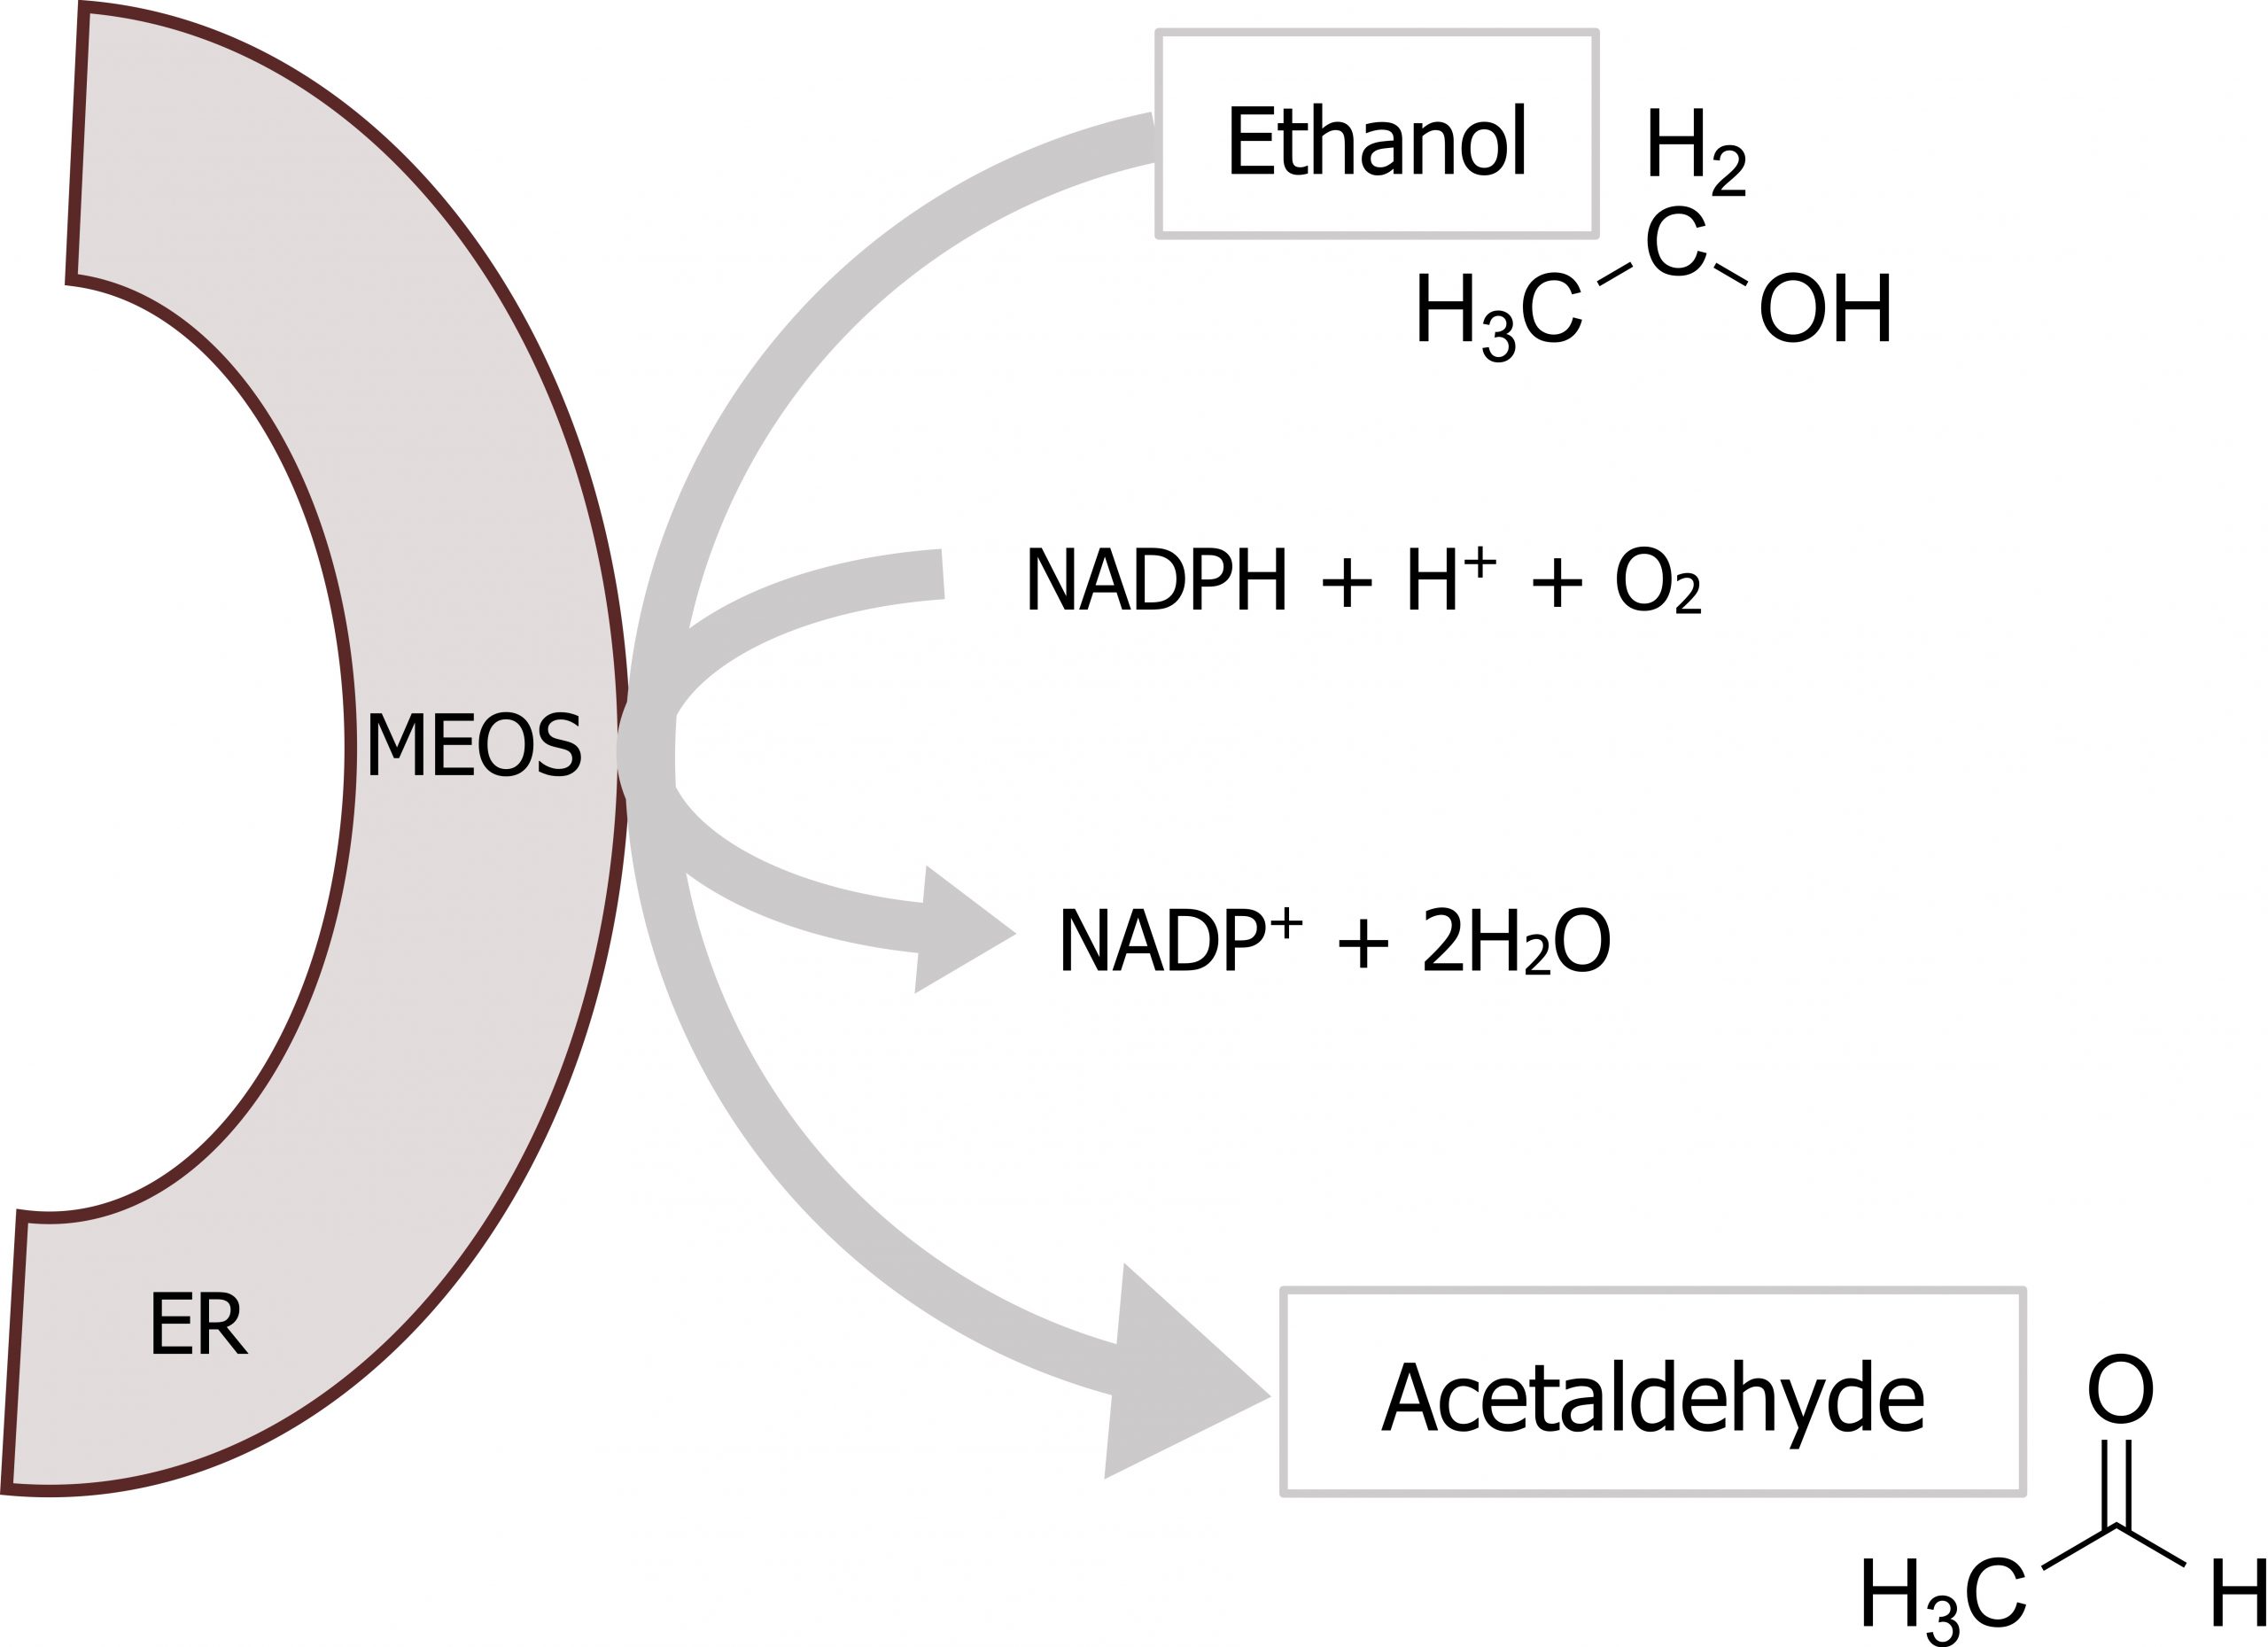
At higher concentrations of ethanol, the microsomal ethanol oxidizing system (MEOS) becomes activated (figure 9.7; label 9). This pathway consists of a series of cytochrome P450 enzymes, which have a relatively high Km for ethanol and are located in the hepatic smooth endoplasmic reticulum (SER). This microsomal-ethanol oxidizing system also detoxifies drugs such as barbiturates (figure 9.8).
- Chronic consumption of alcohol will increase the expression of the MEOS and proliferation of hepatic SER. Increases in expression of both CYP2E1 (P450 enzyme) and γ-glutamyltransferase (GGT), an enzyme located in the SER, are excellent markers of alcohol ingestion.
- Ethanol oxidation by MEOS does not affect the NADH/NAD+ ratio substantially, therefore, it does not have the metabolic effects described for low concentrations of ethanol.
Although the MEOS system does not impact the NADH/NAD+ ratio, that is not to suggest that induction of this system is without metabolic consequences. Induction of the P450 system can negatively impact the metabolism of other drugs causing serious side effects. One example of this is altered metabolism of acetaminophen (Tylenol). Acetaminophen can be glucuronylated or sulfated in the liver for safe excretion by the kidney. However, the cytochrome P450 system can metabolize acetaminophen to the toxic intermediate N-acetyl-p-benzoquinone imine (NAPQI), which requires conjugation with glutathione prior to excretion. The enzyme that produces NAPQI, CYP2E1, is induced by alcohol through the MEOS. Thus, individuals who chronically abuse alcohol have increased sensitivity to acetaminophen toxicity because a higher percentage of acetaminophen metabolism is directed toward NAPQI, compared with an individual with low levels of CYP2E1.
Ethanol is also an inhibitor of the phenobarbital-oxidizing P450 system. When large amounts of ethanol are consumed, the inactivation of phenobarbital is directly or indirectly inhibited. Therefore, when high doses of phenobarbital and ethanol are consumed at the same time, toxic levels of the barbiturate can accumulate in the blood.
9.2 References and resources
Text
Ferrier, D. R., ed. Lippincott Illustrated Reviews: Biochemistry, 7th ed. Philadelphia: Wolters Kluwer Health/Lippincott Williams & Wilkins, 2017, Chapter 12: Metabolism of Monosaccharides and Disaccharides, Chapter 23: Effects of Insulin and Glucagon: Section IV.
Le, T., and V. Bhushan. First Aid for the USMLE Step 1, 29th ed. New York: McGraw Hill Education, 2018, 72, 80–81.
Lieberman, M., and A. Peet, eds. Marks’ Basic Medical Biochemistry: A Clinical Approach, 5th ed. Philadelphia: Wolters Kluwer Health/Lippincott Williams & Wilkins, 2018, Chapter 22: Generation of ATP from Glucose, Fructose and Galactose, Chapter 33: Ethanol Metabolism.
Figures
Grey, Kindred, Figure 9.5 Overview of ethanol metabolism. The pathway spans the cytosol and the mitochondria and NADH is produced in both steps of the pathway. 2021. https://archive.org/details/9.5_20210926. CC BY 4.0.
Grey, Kindred, Figure 9.6 Overview of alcohol metabolism. 2021. Chemical structure by Henry Jakubowski. https://archive.org/details/9.6_20210926. CC BY 4.0. Added Liver by Liam Mitchell from the Noun Project, Muscle by Laymik from the Noun Project, and red blood cells by Lucas Helle from the Noun Project.
Lieberman M, Peet A. Figure 9.7 Clinical consequences of alcoholism. Adapted under Fair Use from Marks’ Basic Medical Biochemistry. 5th Ed. pp 709. Figure 33.6 Acute effects of ethanol metabolism on lipid metabolism in the liver. 2017.
Lieberman M, Peet A. Figure 9.8 Ethanol detoxification by MEOS. Adapted under Fair Use from Marks’ Basic Medical Biochemistry. 5th Ed. pp 704. Figure 33.3 The reaction catalyzed by the microsomal ethanol-oxidizing system (MEOS; which includes CYP2E1) in the endoplasmic reticulum (ER). 2017. Chemical structure by Henry Jakubowski.
