12 Gene Regulation and the Cell Cycle
Learning Objectives
- Describe the structure of the nucleus and the nuclear envelope.
- Describe the role of transcription factors in the control of gene expression in eukaryotes.
- Describe the common features of transcription factor structure, especially DNA-binding sites.
- Describe the strategies used by eukaryotes to regulate gene expression at the level of transcription, mRNA processing, translation, and post-translation.
- Outline and define the stages in the cell cycle: M, G1, S, G2, and, occasionally, G0.
- Describe the control of the cell cycle, emphasizing the participation of protein kinases and cyclins in the process.
- Emphasize the idea of checkpoints in the cell cycle and their importance to cell survival.
- Describe what is known about the mechanisms of genetic recombination during meiosis.
About this Chapter
Gene expression patterns are complex and dynamic. The expression of a gene can be regulated on many levels and will be influenced in a tissue-specific (basis for different cell types) pattern, can be developmentally controlled (temporal and spatial expression patterns), or can be environmentally influenced (induction in response to external stimuli).
Some genes (the so-called “house-keeping genes”) are likely (constitutively) expressed in all cell types since certain proteins (and RNAs) are involved in the basic metabolic processes common to all cell types. Other genes are expressed in one cell type but not another (e.g., certain immune cells normally synthesize antibodies, but neurons do not). Thus, different cell types arise because of differential gene expression, and the RNA and protein content of different cell types shows considerable variation.
12.1 Eukaryotic Gene Regulation
Control of gene expression can be exerted at many levels and can be broadly divided into: changes in DNA content or position and changes in gene activity (e.g., expression patterns).
Changes to DNA content and rearrangement are addressed elsewhere. Briefly, DNA of different cell types does not vary in either amount or type. However, highly specialized cases are known to exist where DNA loss, rearrangement, and amplification profoundly influence gene expression in isolated situations.
This section will focus on changes in gene expression.
Regulation is known to occur at several different points of a multistep gene expression pathway. Four main levels of control include:
1. Transcriptional control: Determines if, how much, and when an mRNA is made.
2. Processing or post-transcriptional control: Determines if, how much, and when an mRNA is available for translation into a protein.
3. Translational control: Determines if, how much, and when a protein is made.
4. Post-translational control: Determines if, how much, and when a protein is functional.
Transcriptional control
Control of transcriptional initiation is a primary means used to regulate gene expression in eukaryotic organisms. Most eukaryotic genes are controlled at the level of transcription by proteins (trans-acting factors) that interact with specific gene sequences (cis-acting regulatory sequences).
Transcription factors: Enhancers
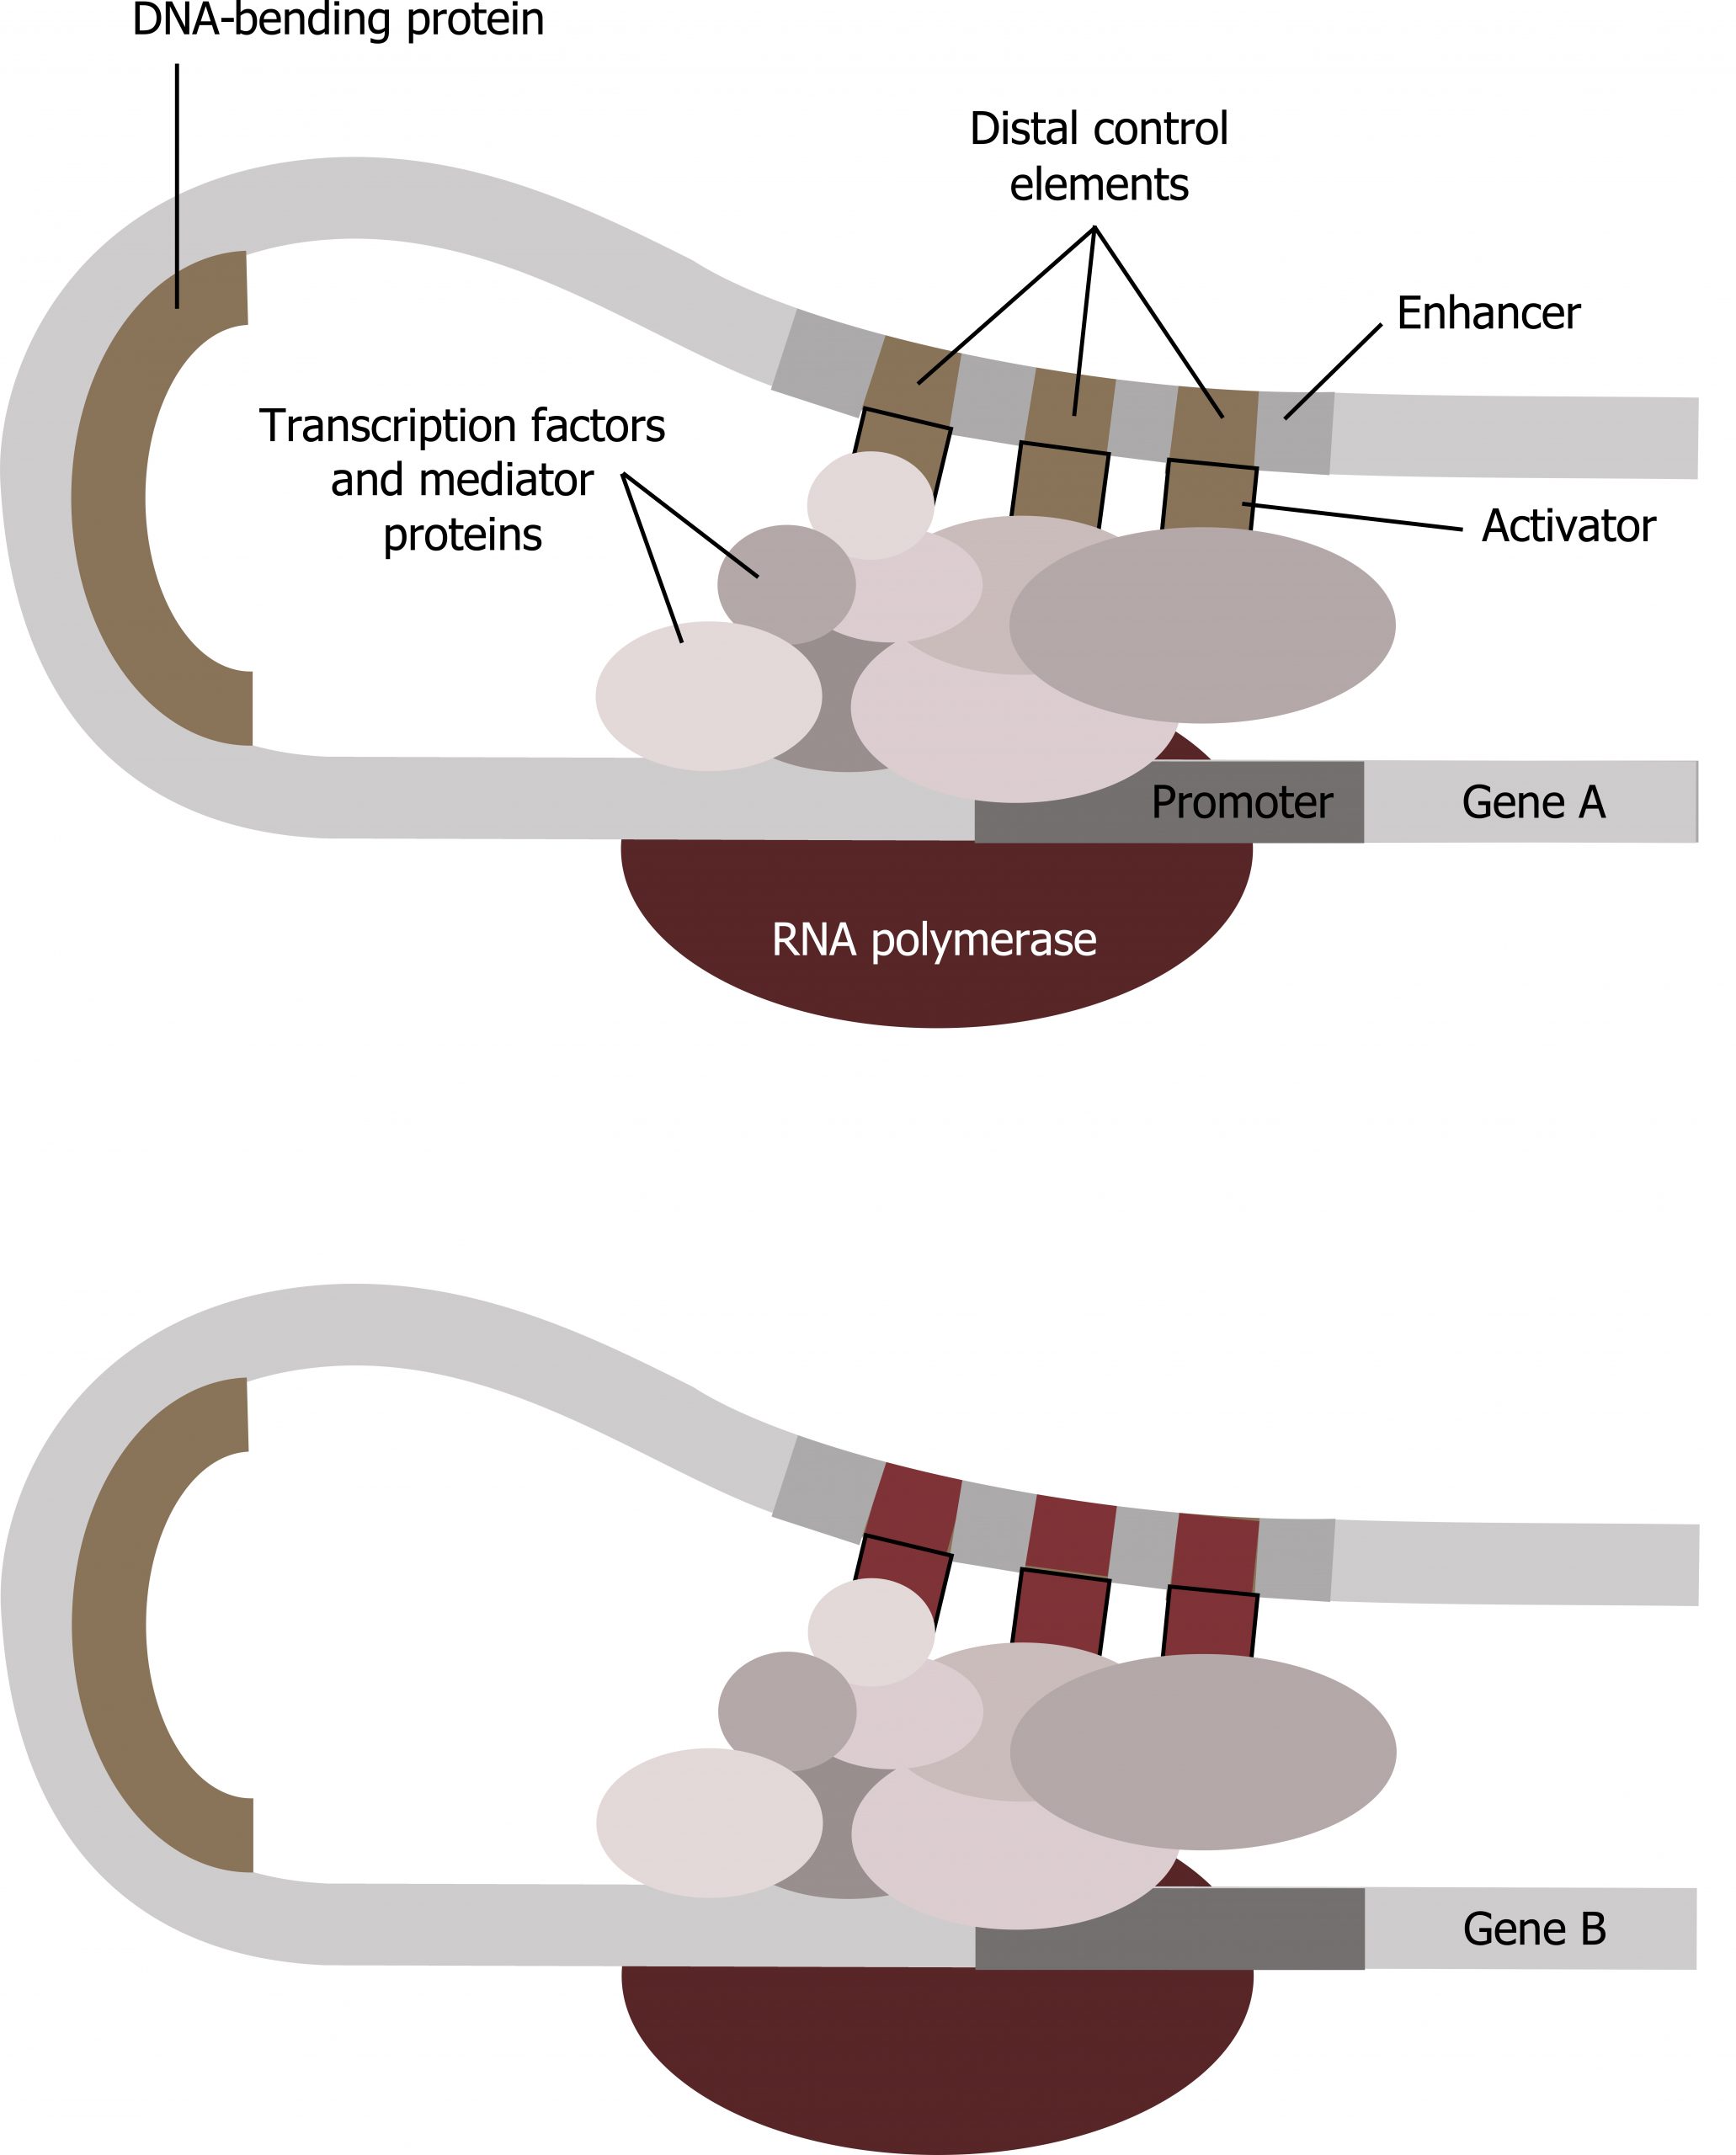
Along with general transcription factors, there are additional regions that help increase or enhance transcription. These regions, called enhancers, are not necessarily close to the genes they enhance. They can be located upstream of a gene, within the coding region of the gene, downstream of a gene, or thousands of nucleotides away.
Enhancer regions are binding sequences, or sites, for specific transcription factors. When a protein transcription factor binds to its enhancer sequence, the shape of the protein changes, allowing it to interact with proteins at the promotor site. However, since the enhancer region may be distant from the promoter, the DNA must bend to allow the proteins at the two sites to come into contact. DNA-bending proteins help bend the DNA and bring the enhancer and promoter regions together (figure 12.1). This shape change allows for the interaction of the specific activator proteins bound to the enhancers with the general transcription factors bound to the promoter region and the RNA polymerase. Two different genes may have the same promoter but different distal control elements, enabling differential gene expression.
Transcription factors: Repressors
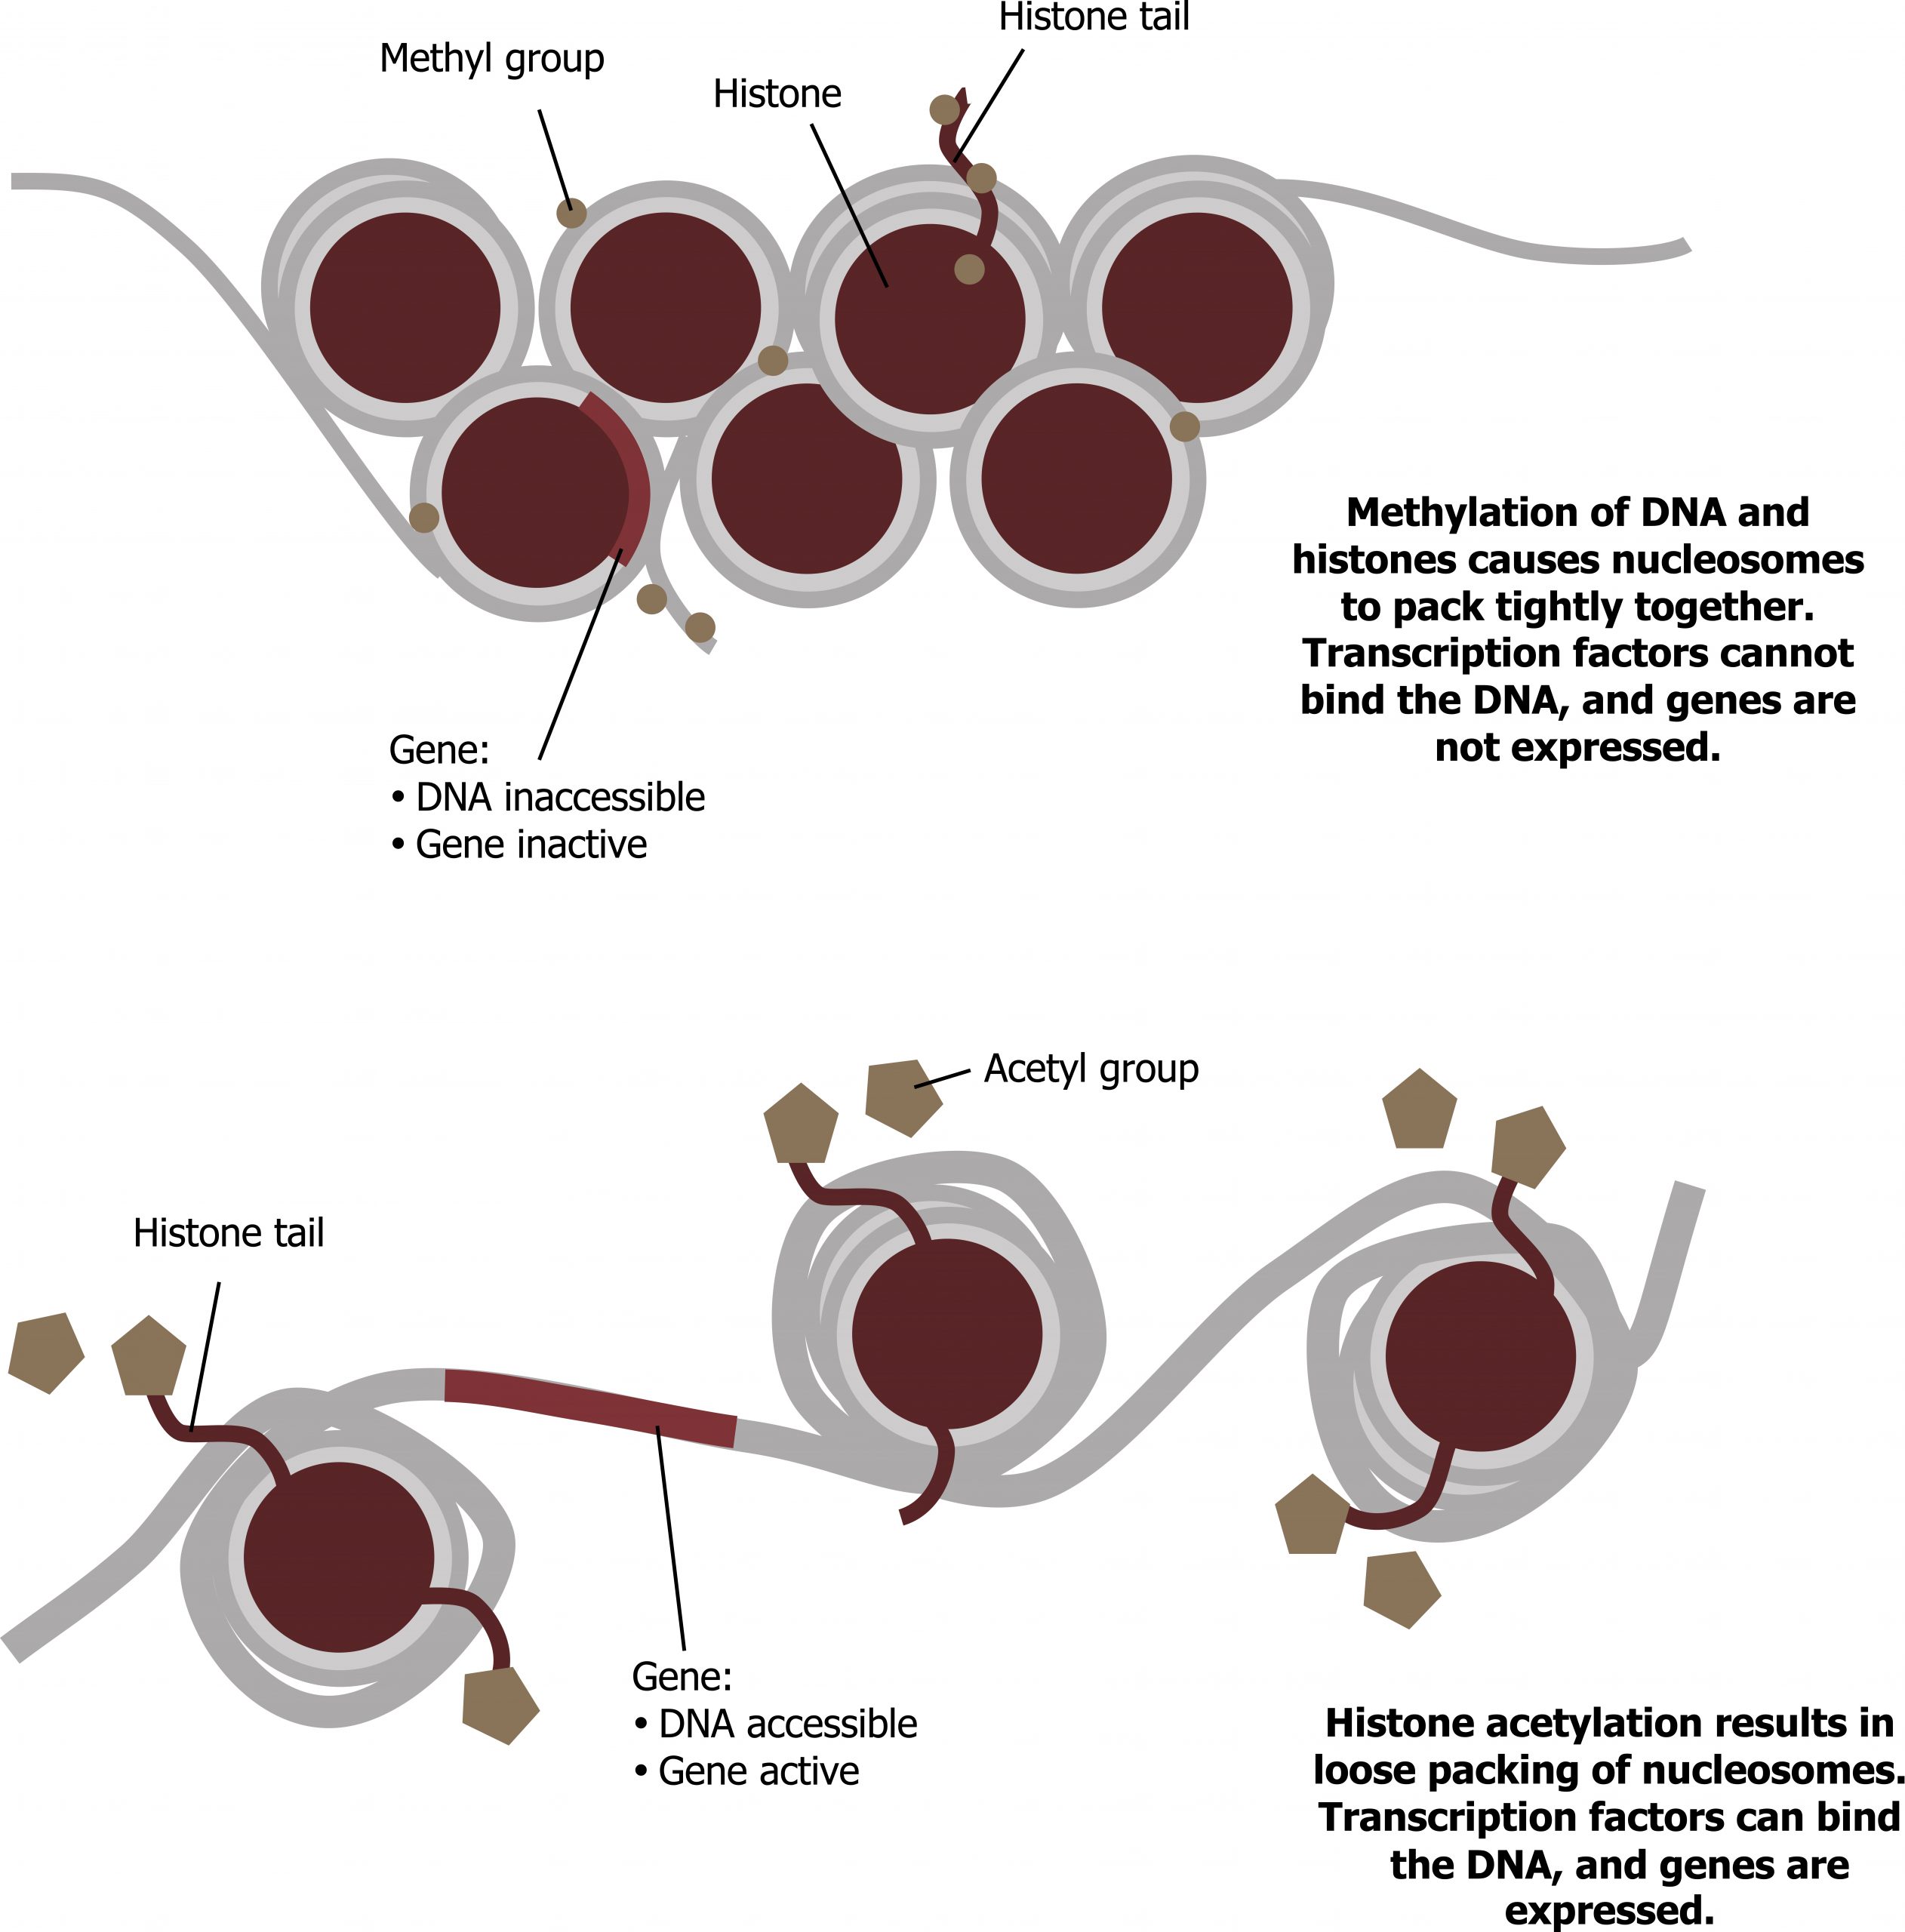
Like prokaryotic cells, eukaryotic cells also have mechanisms to prevent transcription. Transcriptional repressors can bind to promoter or enhancer regions and block transcription. Like the transcriptional activators, repressors respond to external stimuli preventing the binding of activating transcription factors. This is often done by histone deacetylation, which increases the interaction of DNA and histones (figure 12.2).
Transcription factors: Structure and function
Structurally, transcription factors share similar characteristics but can take on very different secondary structures. Common examples of transcription factors include: Zn fingers, helix-loop-helixs, and leucine zippers. Regardless of structure, common characteristics include:
- A positively charged DNA-binding domain,
- Activation domain, and
- Dimerization domain.
As noted above, one of the major roles of transcription factors is to bend or remodel the DNA in a way to allow for interactions of transcription factors and their binding sites. Chromatin remodeling by modifications of the histones (through acetylation or shifting) is common (figure 12.2).
Processing or post/cotranscription
Alternative RNA splicing
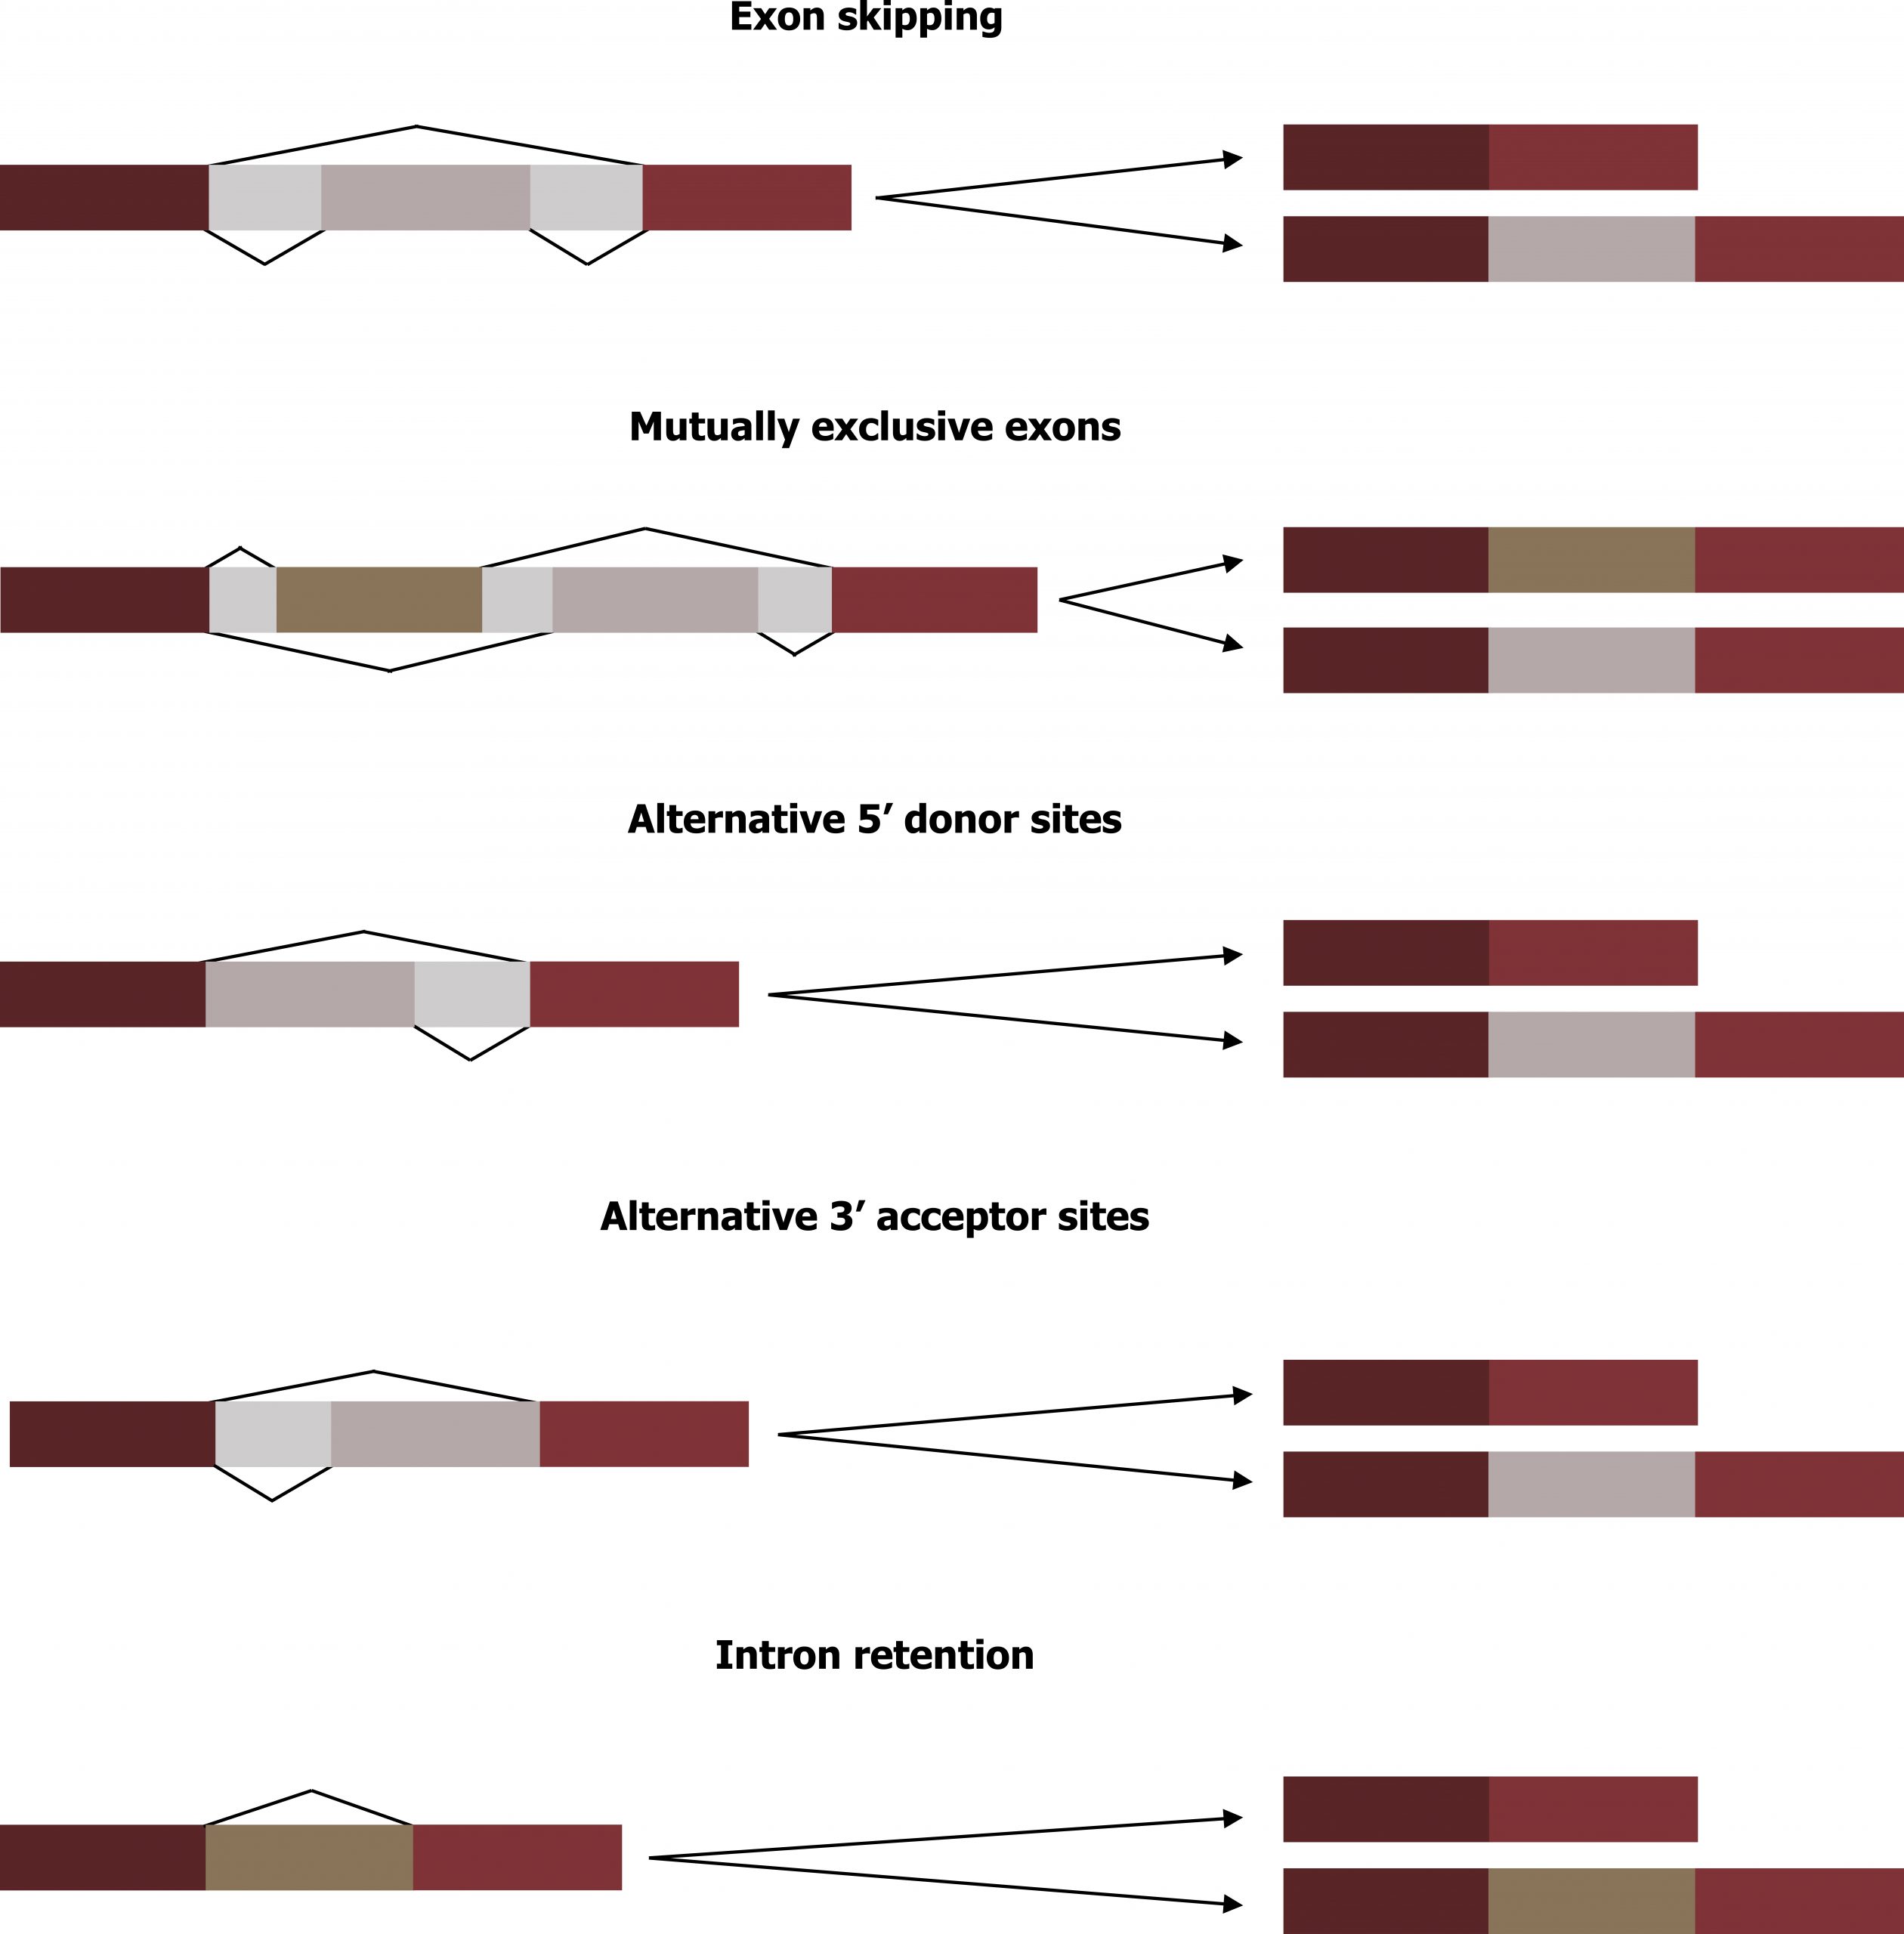
Alternative RNA splicing is a mechanism that allows different protein products to be produced from one gene when different combinations of exons are combined to form the mRNA. This alternative splicing can be haphazard, but more often it is controlled and acts as a mechanism of gene regulation, with the frequency of different splicing alternatives controlled by the cell as a way to control the production of different protein products in different cells or at different stages of development. Alternative splicing is a common mechanism of gene regulation in eukaryotes; according to one estimate, 70 percent of genes in humans are expressed as multiple proteins through alternative splicing. Although there are multiple ways to alternatively splice RNA transcripts, the original 5′-3′ order of the exons is always conserved. That is, a transcript with exons 1 2 3 4 5 6 7 might be spliced 1 2 4 5 6 7 or 1 2 3 6 7, but never 1 2 5 4 3 6 7 (figure 12.3).
Translational control
Like transcription, translation is controlled by proteins that bind and initiate the process, restrict access to the mRNA, or control the localization of the transcript itself.
Localization
One fundamental way in which translation is controlled is physically by where the mRNA is located within the cell or organism. This is extremely important in development where restriction of a transcript to one side of a cell can influence the phenotype of a localized cellular region. This is largely mediated by interactions with the 5ʼ untranslated region (UTR).
Translational initiation
In translation, the complex that assembles to start the process is referred to as the translation initiation complex, and similar to transcription, this complex can be activated or inhibited. In eukaryotes, translation is initiated by binding the initiating met-tRNAi to the 40S ribosome.
Initially the met-tRNAi is brought to the 40S ribosome by a protein initiation factor, eukaryotic initiation factor-2 (eIF-2). The eIF-2 protein binds to the high-energy molecule guanosine triphosphate (GTP), and the tRNA-eIF2-GTP complex then binds to the 40S ribosome.
The cap-binding protein eIF4F brings the mRNA complex together with the 40S ribosome complex. The ribosome then scans along the mRNA until it finds a start codon AUG. When the anticodon of the initiator tRNA and the start codon are aligned, the GTP is hydrolyzed, the initiation factors are released, and the large 60S ribosomal subunit binds to form the translation complex. Insulin increases the efficiency of formation of the cap-binding complex, therefore increasing the rate of protein synthesis.
The binding of eIF-2 to the RNA is controlled by phosphorylation. If eIF-2 is phosphorylated, it undergoes a conformational change and cannot bind to GTP. Therefore, the initiation complex cannot form properly, and translation is impeded (figure 12.4).
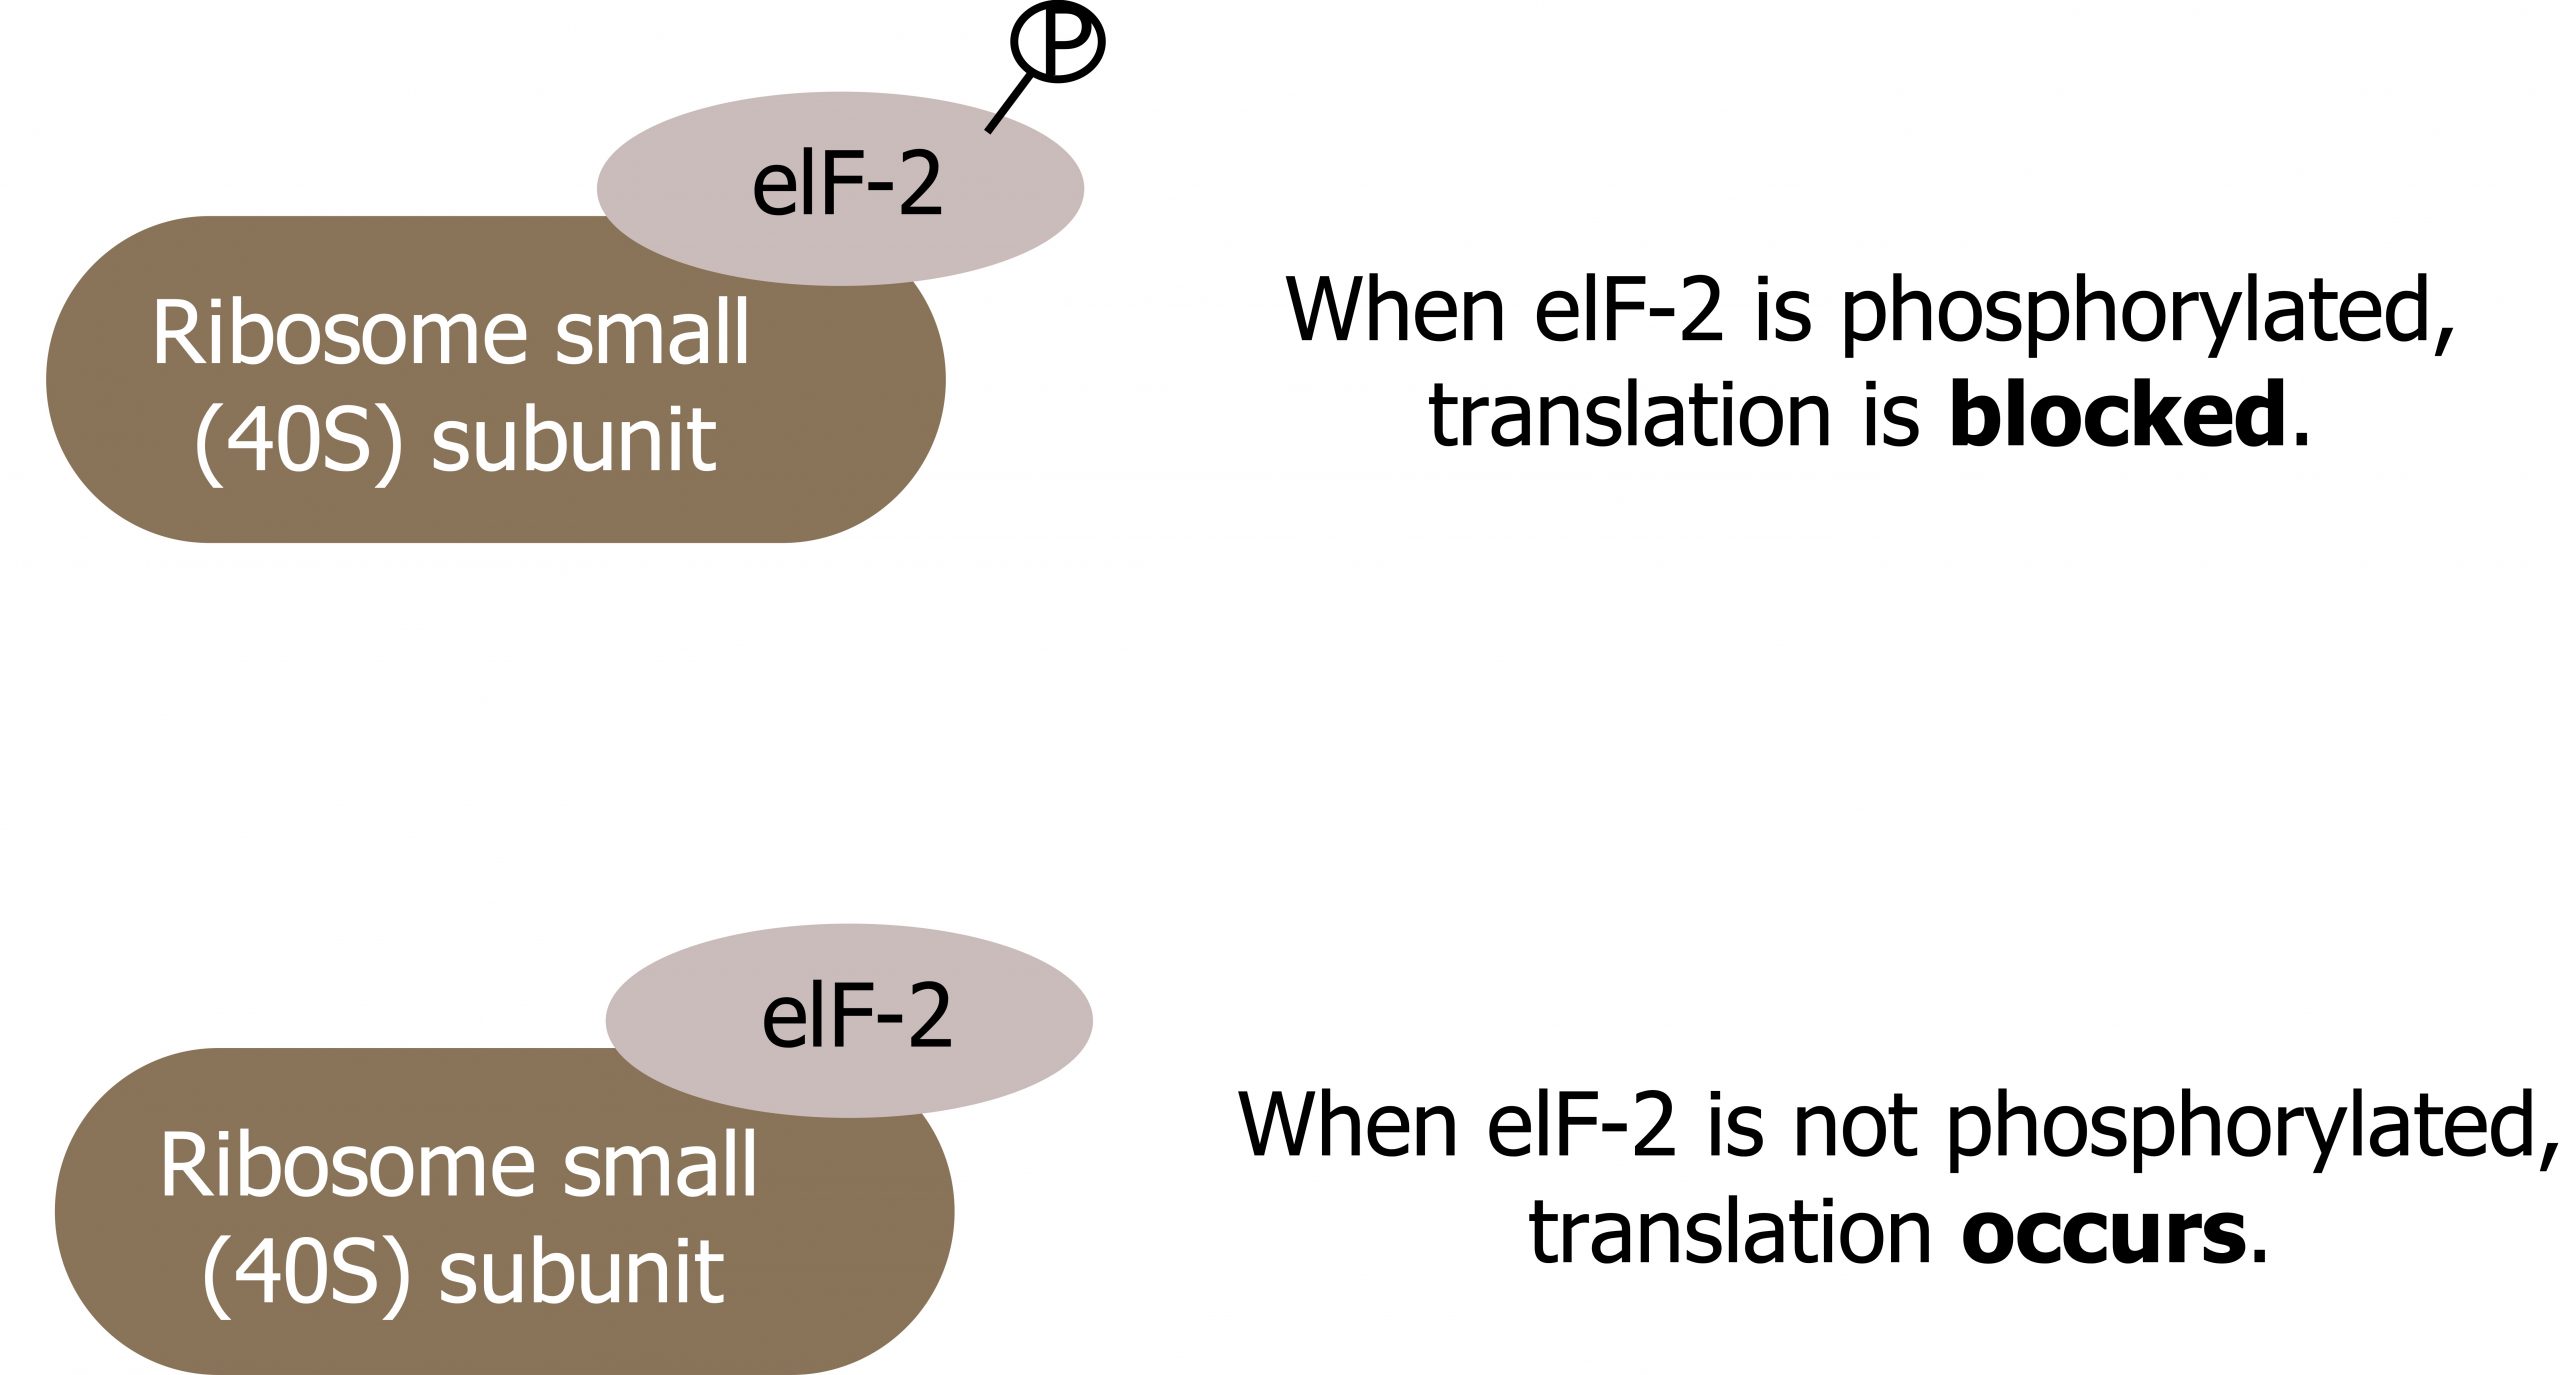
When eIF-2 remains unphosphorylated, the initiation complex can form normally, and translation can continue.
Control of RNA stability
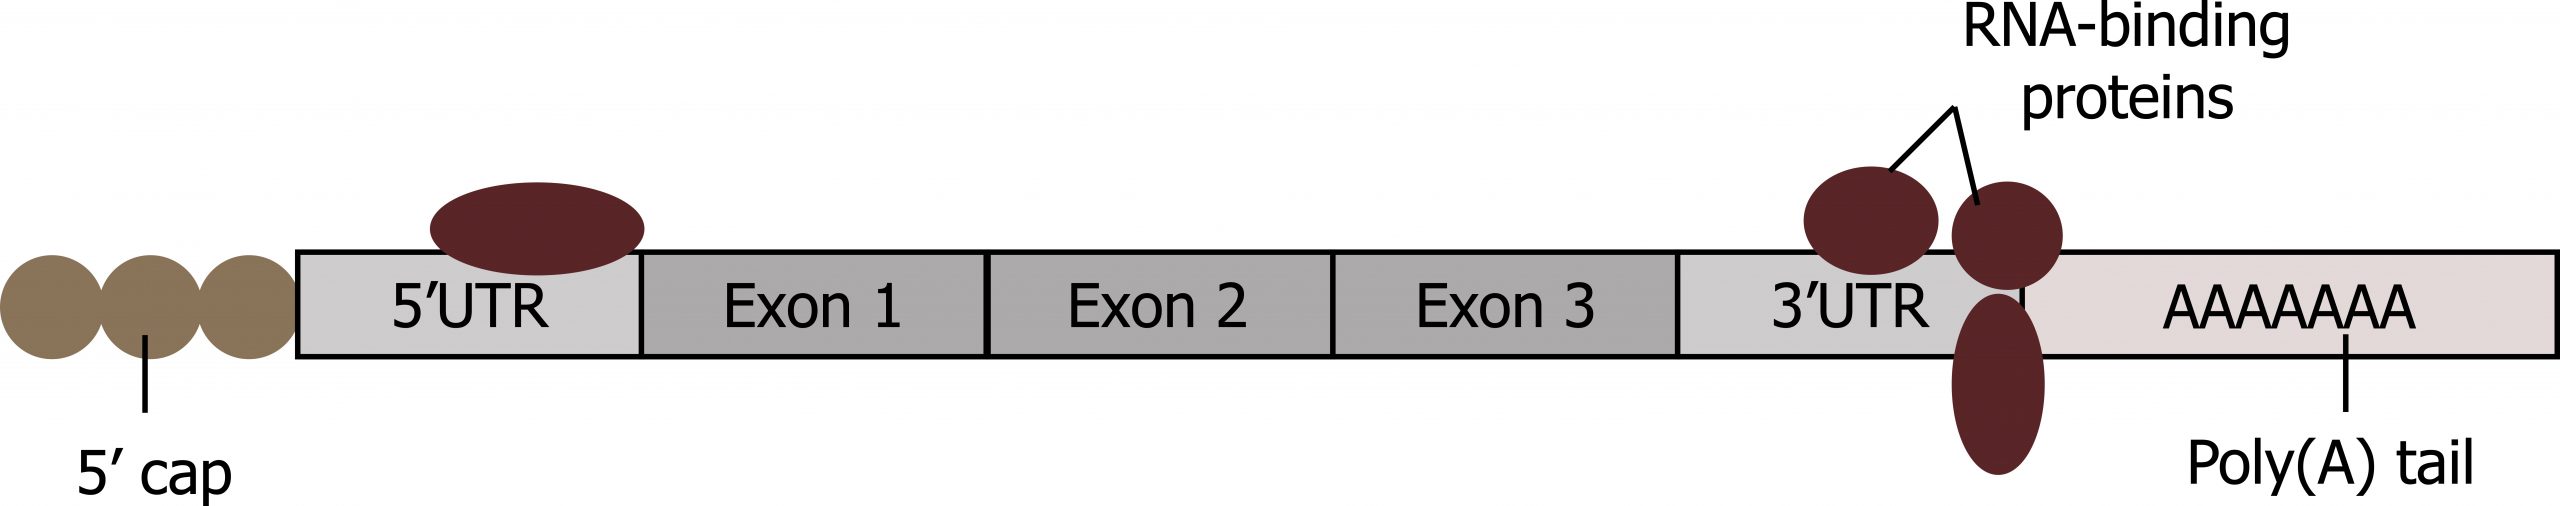
Before the mRNA leaves the nucleus, it is given two protective “caps” that prevent the ends of the strand from degrading during its journey. These changes protect the two ends of the RNA from exonuclease attack.
- The 5′ cap, which is placed on the 5′ end of the mRNA, is usually composed of a methylated guanosine triphosphate molecule (GTP). The GTP is placed “backward” on the 5′ end of the mRNA, so that the 5′ carbons of the GTP and the terminal nucleotide are linked through three phosphates.
- The poly(A) tail, which is attached to the 3′ end, is usually composed of a long chain of adenine nucleotides.
Once the RNA is transported to the cytoplasm, the length of time that the RNA resides there can be controlled. Each RNA molecule has a defined lifespan and decays at a specific rate. This rate of decay can influence how much protein is in the cell.
- If the decay rate is increased, the RNA will not exist in the cytoplasm as long, shortening the time available for translation of the mRNA to occur.
- Conversely, if the rate of decay is decreased, the mRNA molecule will reside in the cytoplasm longer and more protein can be translated.
RNA-binding proteins
Binding of proteins to the RNA can also influence its stability. Proteins called RNA-binding proteins, or RBPs, can bind to the regions of the mRNA just upstream or downstream of the protein-coding region. These regions in the RNA that are not translated into protein are called the untranslated regions, or UTRs (figure 12.5). They are not introns (those have been removed in the nucleus). Rather, these are regions that regulate mRNA localization, stability, and protein translation. The region just before the protein-coding region is called the 5′ UTR, whereas the region after the coding region is called the 3′ UTR. The binding of RBPs to these regions can increase or decrease the stability of an RNA molecule, depending on the specific RBP that binds.
One classic example of this is the regulation of transferrin receptor (TR) and ferritin levels in response to iron.
- Iron is transported in the blood bound to the iron transport protein, transferrin. Transferrin receptors (TRs) are required to bring extracellular iron from the bloodstream into cells (i.e., iron uptake).
- Ferritin, a protein involved in iron storage, is also regulated post-transcriptionally. The half-life of these mRNAs is regulated by iron concentrations.
- The translation of ferritin mRNAs is regulated by the concentration of iron.
- The 5ʼ UTR of transferrin receptor mRNA contains a single irons response element (IRE) that mediates the effect.
- When iron is low, the iron-responsive protein (IRP) binds the IRE to block ferritin mRNA translation.
- When iron is high, IRP cannot bind IRE, and ferritin mRNA is translated.
microRNAs
In addition to RBPs that bind to and control (increase or decrease) RNA stability, other elements called microRNAs can bind to the RNA molecule. These microRNAs, or miRNAs, are short RNA molecules that are only twenty-one to twenty-four nucleotides in length. The miRNAs are made in the nucleus as longer pre-miRNAs.
These pre-miRNAs are chopped into mature miRNAs by a protein called dicer. Like transcription factors and RBPs, mature miRNAs recognize a specific sequence and bind to the RNA; however, miRNAs also associate with a ribonucleoprotein complex called the RNA-induced silencing complex (RISC). The RNA component of the RISC base-pairs with complementary sequences on an mRNA and either impede translation of the message or lead to the degradation of the mRNA.
Post-translation regulation
Chemical modifications
Proteins can be chemically modified with the addition of groups including methyl, phosphate, acetyl, and ubiquitin groups.
The addition or removal of these groups from proteins can have many effects and can be in response to many cellular changes. For example:
- Covalent modifications can regulate protein activity.
- Sometimes these modifications can regulate where a protein is found in the cell — for example, in the nucleus, in the cytoplasm, or attached to the plasma membrane.
- Chemical modifications occur in response to external stimuli such as stress, the lack of nutrients, heat, or ultraviolet light exposure.
- These changes can alter epigenetic accessibility, transcription, mRNA stability, or translation — all resulting in changes in expression of various genes.
This is an efficient way for the cell to rapidly change the levels of specific proteins in response to the environment. Because proteins are involved in every stage of gene regulation, the phosphorylation of a protein (depending on the protein that is modified) can alter accessibility to the chromosome, can alter translation (by altering transcription factor binding or function), can change nuclear shuttling (by influencing modifications to the nuclear pore complex), can alter RNA stability (by binding or not binding to the RNA to regulate its stability), can modify translation (increase or decrease), or can change post-translational modifications (add or remove phosphates or other chemical modifications).
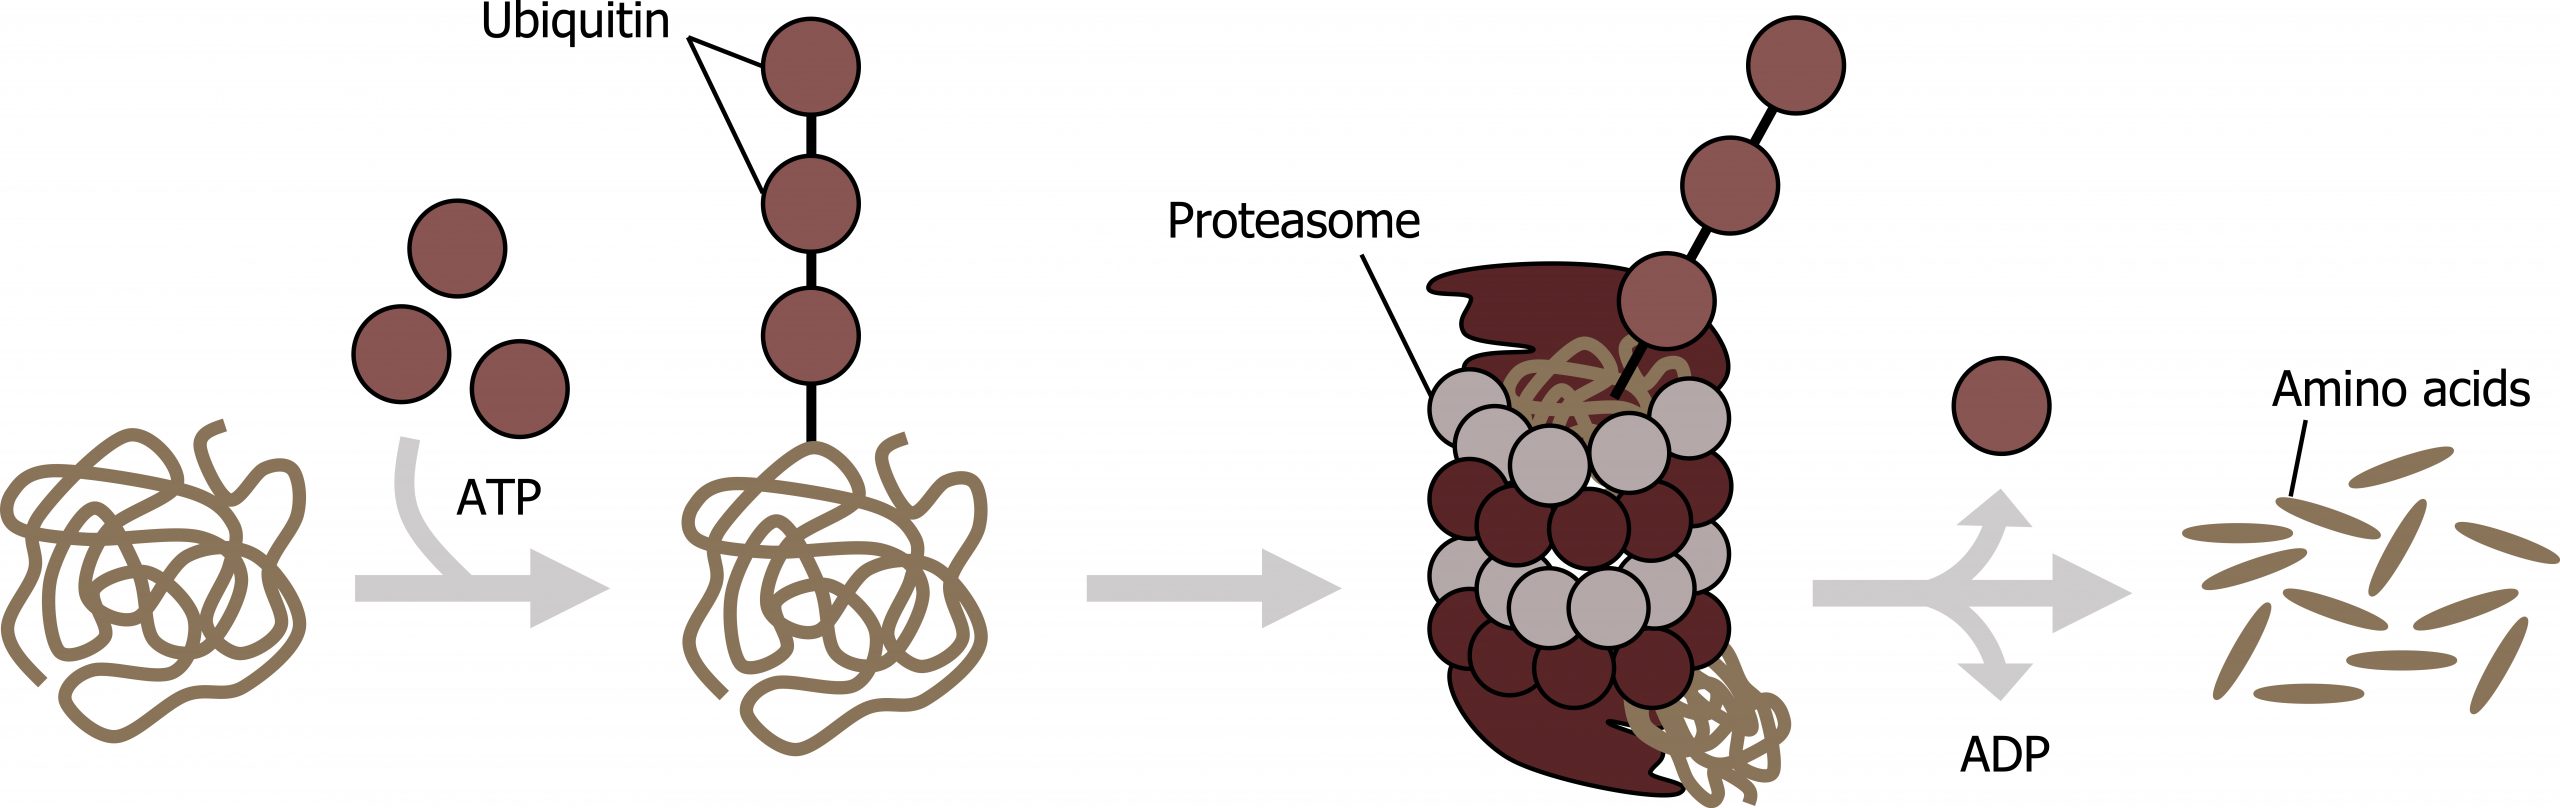
Protein degradation
The addition of an ubiquitin group to a protein marks that protein for degradation. Ubiquitin acts like a flag indicating that the protein lifespan is complete. These proteins are moved to the proteasome, an organelle that functions to remove proteins, to be degraded. One way to control gene expression, therefore, is to alter the longevity of the protein (figure 12.6).
12.1 References and resources
Text
Clark, M. A. Biology, 2nd ed. Houston, TX: OpenStax College, Rice University, 2018, Chapter 10: Cell Reproduction, Chapter 11: Meiosis and Sexual Reproduction, Chapter 16: Gene Expression.
Karp, G., and J. G. Patton. Cell and Molecular Biology: Concepts and Experiments, 7th ed. Hoboken, NJ: John Wiley, 2013, Chapter 11: Gene Expression: From Transcription to Translation, Chapter 12: The Cell Nucleus and the Control of Gene Expression, Chapter 13: DNA Replication and Repair, Chapter 14: Cellular Reproduction.
Le, T., and V. Bhushan. First Aid for the USMLE Step 1, 29th ed. New York: McGraw Hill Education, 2018, 41–43, 46.
Nussbaum, R. L., R. R. McInnes, H. F. Willard, A. Hamosh, and M. W. Thompson. Thompson & Thompson Genetics in Medicine, 8th ed. Philadelphia: Saunders/Elsevier, 2016, Chapter 3: The Human Genome: Gene Structure and Function.
Figures
Grey, Kindred, Figure 12.1 Example of transcriptional complex involving two separate genes. 2021. CC BY 4.0. Adapted from Biology 2e Figure 16.10 Interaction between proteins at the promoter and enhancer sites. CC BY 4.0. From OpenStax.
Grey, Kindred, Figure 12.2 Modification of DNA and histones can alter DNA accessibility and therefore transcription. 2021. CC BY 4.0. Adapted from Biology 2e. Figure 16.8 Nucleosomes can slide along DNA. CC BY 4.0. From OpenStax.
Grey, Kindred, Figure 12.3 Five common modes of alternative splicing. 2021. https://archive.org/details/12.3_20210926. CC BY 4.0.
Grey, Kindred, Figure 12.4 Regulation of translational initiation. 2021. https://archive.org/details/12.4_20210926. CC BY 4.0.
Lieberman M, Peet A. Figure 12.5 RNA Binding proteins can increase stability of the transcript. Adapted under Fair Use from Marks’ Basic Medical Biochemistry. 5th Ed. pp 312. Figure 16.21 Translational regulation of ferritin synthesis. 2017.
Lieberman M, Peet A. Figure 12.6 Proteasome mediated degradation. Adapted under Fair Use from Marks’ Basic Medical Biochemistry. 5th Ed. pp 312. Figure 35.6 The proteasome and regulatory proteins. 2017.
12.2 Cell Cycle
Note
Checkpoints are the most critical, and the full summary of mitosis is for background.
Cells on the path to cell division proceed through a series of precisely timed and carefully regulated stages of growth, DNA replication, and division that produce two genetically identical cells. The cell cycle has two major phases: interphase and the mitotic phase. During interphase, the cell grows, and DNA is replicated. During the mitotic phase, the replicated DNA and cytoplasmic contents are separated, and the cell divides.
The cycle is divided into four distinct phases, G1, S, G2, and M (mitosis), and for most mammalian cells in culture this process takes about twenty-four hours to complete. The majority of differentiated cells in the body are not dividing, retained in a resting state or Go (figure 12.7).
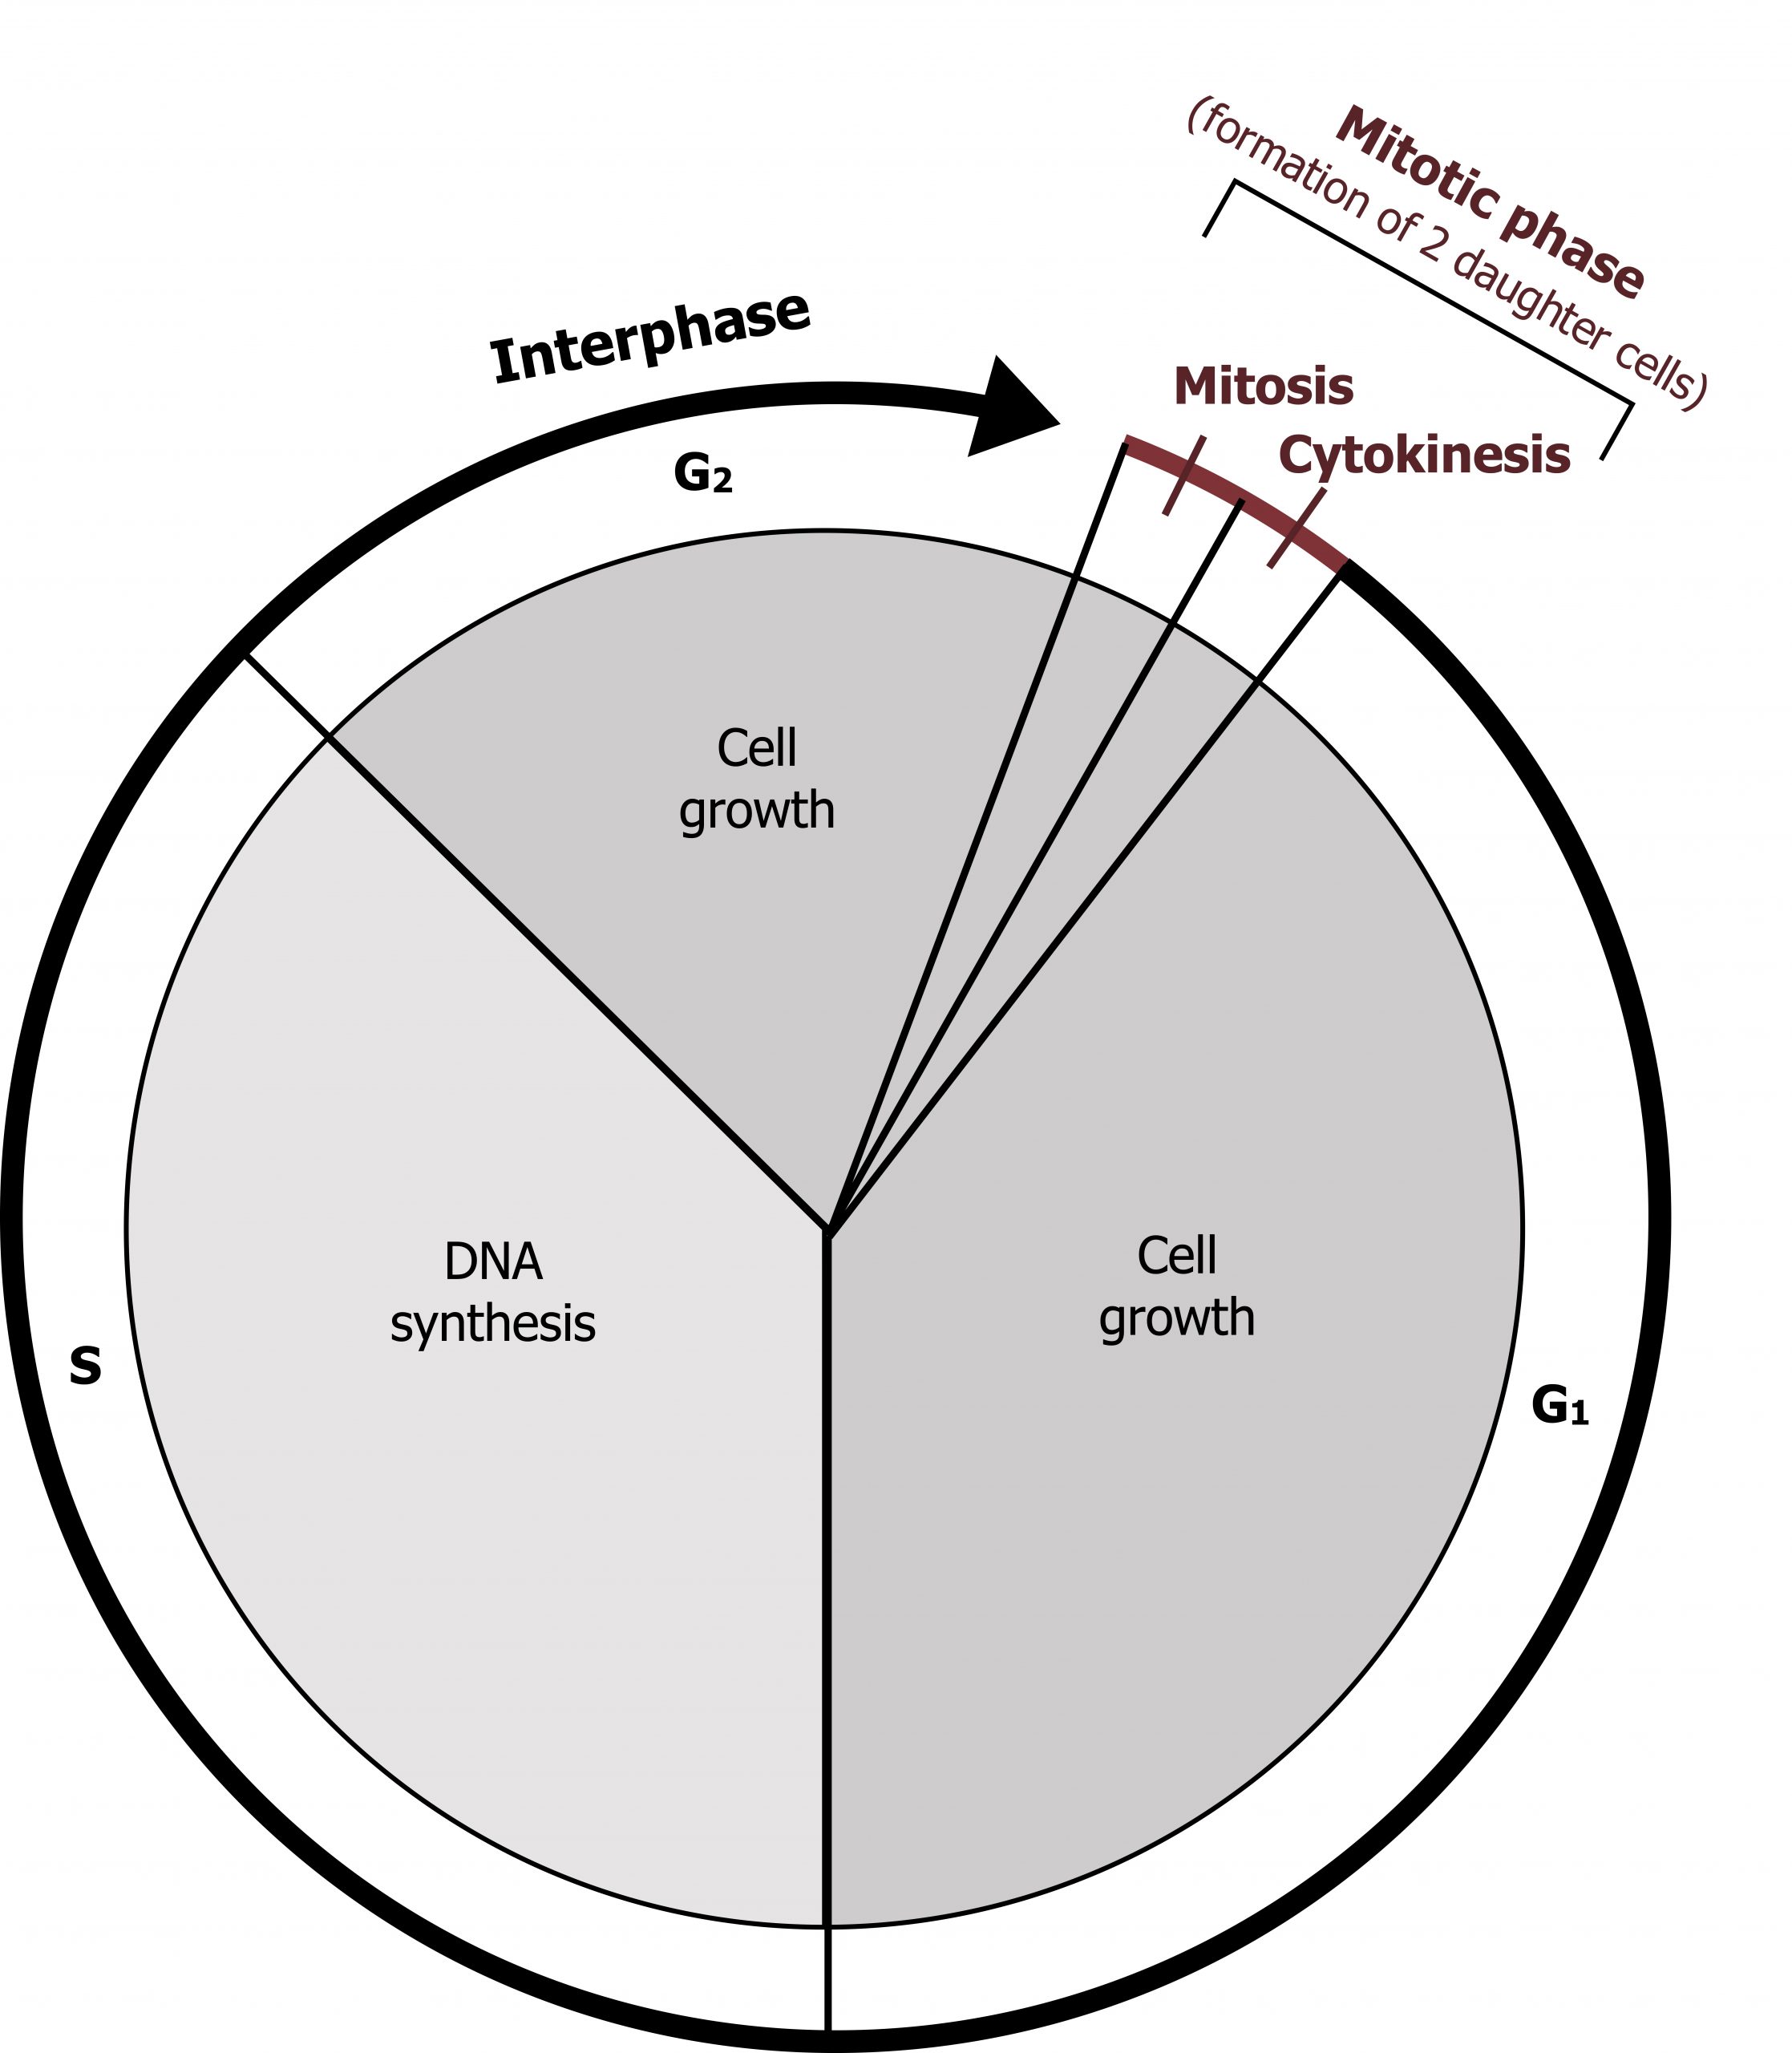
Interphase
During interphase, the cell undergoes normal processes while also preparing for cell division. For a cell to move from interphase to the mitotic phase, many internal and external conditions must be met. The three stages of interphase are called G1, S, and G2.
G1 phase
The first stage of interphase is called the G1 phase, or first gap, because little change is visible. However, during the G1 stage, the cell is quite active at the biochemical level. The cell is accumulating the building blocks of chromosomal DNA and the associated proteins, as well as accumulating enough energy reserves to complete the task of replicating each chromosome in the nucleus.
S phase
Throughout interphase, nuclear DNA remains in a semicondensed chromatin configuration. In the S phase (synthesis phase), DNA replication results in the formation of two identical copies of each chromosome (sister chromatids) that are firmly attached at the centromere region. At this stage, each chromosome is made of two sister chromatids and is a duplicated chromosome. The centrosome is duplicated during the S phase. The two centrosomes will give rise to the mitotic spindle, the apparatus that orchestrates the movement of chromosomes during mitosis. The centrosome consists of a pair of rod-like centrioles at right angles to each other. Centrioles help organize cell division.
G2 phase
In the G2 phase, or second gap, the cell replenishes its energy stores and synthesizes the proteins necessary for chromosome manipulation. Some cell organelles are duplicated, and the cytoskeleton is dismantled to provide resources for the mitotic spindle. The final preparations for the mitotic phase must be completed before the cell is able to enter the first stage of mitosis.
The mitotic phase
To make two daughter cells, the contents of the nucleus and the cytoplasm must be divided. The mitotic phase is a multistep process during which the duplicated chromosomes are aligned, separated, and moved to opposite poles of the cell, and then the cell is divided into two new identical daughter cells. The first portion of the mitotic phase, mitosis, is composed of five stages, which accomplish nuclear division. The second portion of the mitotic phase, called cytokinesis, is the physical separation of the cytoplasmic components into two daughter cells (figure 12.8).
Mitosis
Mitosis is divided into a series of phases — prophase, prometaphase, metaphase, anaphase, and telophase — that result in the division of the cell nucleus (figure 12.8).
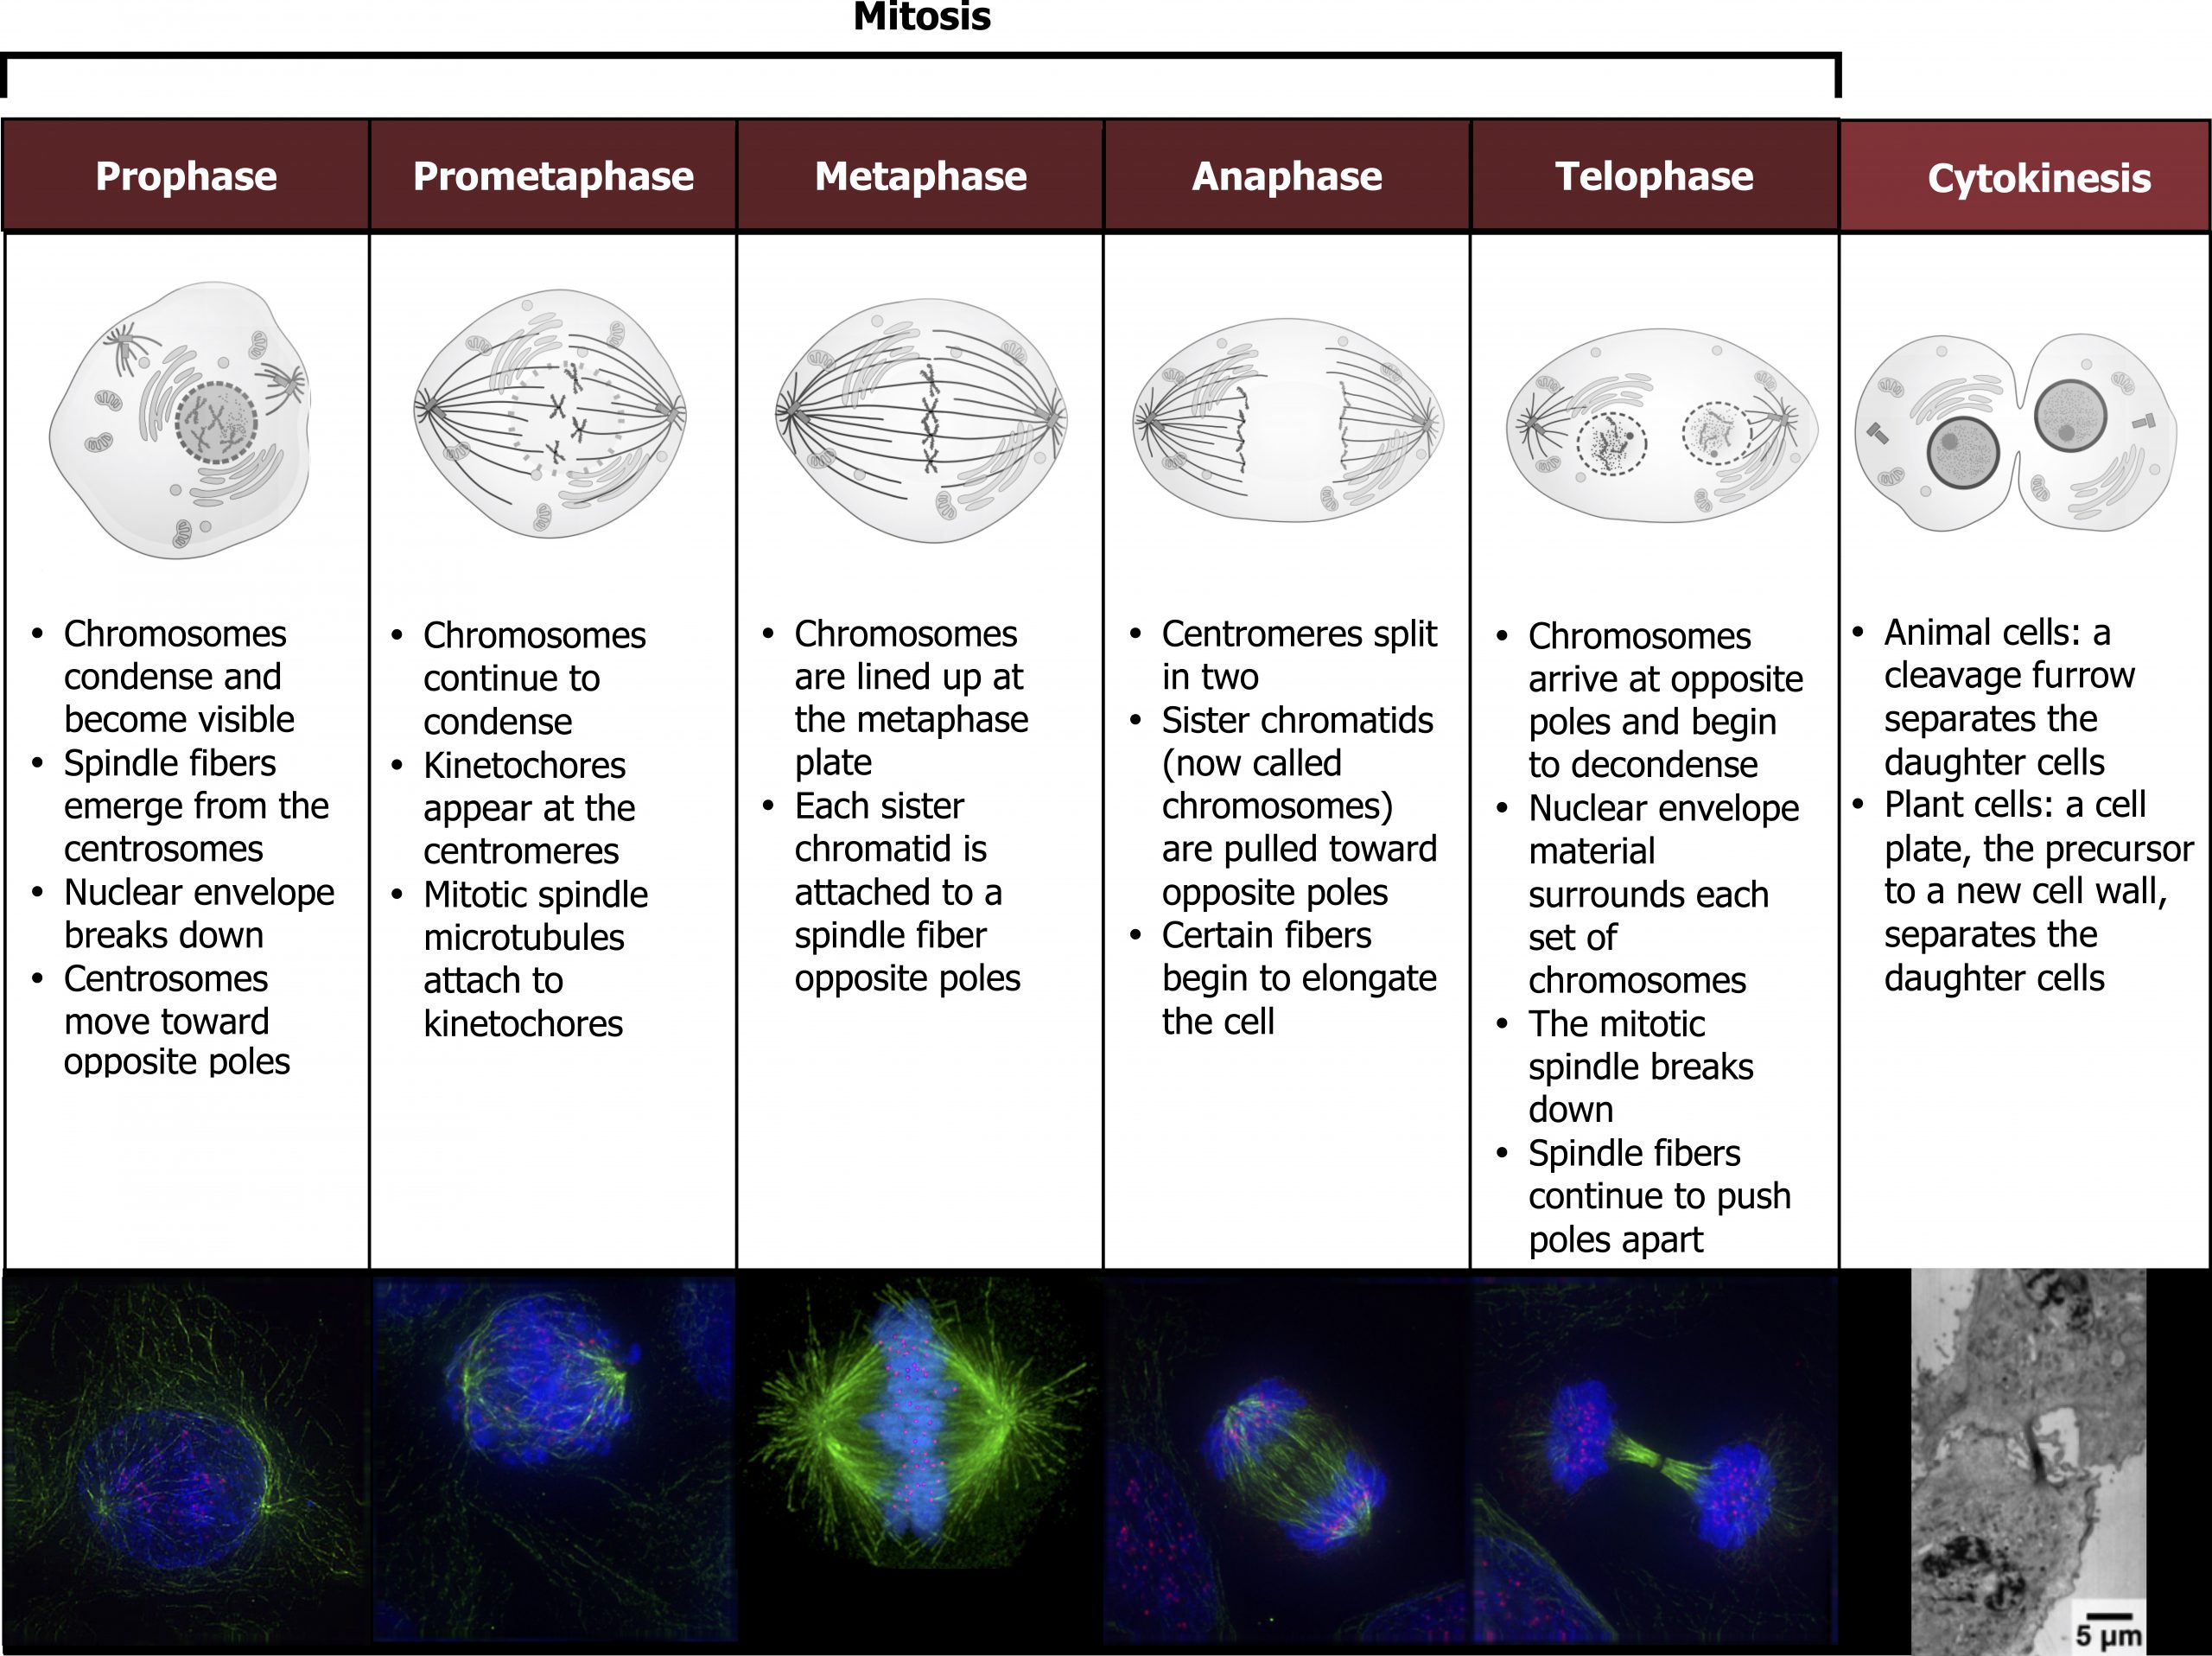
During prophase, the “first phase,” several events must occur to provide access to the chromosomes in the nucleus. The nuclear envelope starts to break into small vesicles, and the Golgi apparatus and endoplasmic reticulum fragment and disperse to the periphery of the cell. The nucleolus disappears. The centrosomes begin to move to opposite poles of the cell. The microtubules that form the basis of the mitotic spindle extend between the centrosomes, pushing them farther apart as the microtubule fibers lengthen. The sister chromatids begin to coil more tightly and become visible under a light microscope.
During prometaphase, many processes that were begun in prophase continue to advance and culminate in the formation of a connection between the chromosomes and cytoskeleton. The remnants of the nuclear envelope disappear. The mitotic spindle continues to develop as more microtubules assemble and stretch across the length of the former nuclear area. Chromosomes become more condensed and visually discrete. Each sister chromatid attaches to spindle microtubules at the centromere via a protein complex called the kinetochore.
During metaphase, all the chromosomes are aligned in a plane called the metaphase plate, or the equatorial plane, midway between the two poles of the cell. The sister chromatids are still tightly attached to each other. At this time, the chromosomes are maximally condensed.
During anaphase, the sister chromatids at the equatorial plane are split apart at the centromere. Each chromatid, now called a chromosome, is pulled rapidly toward the centrosome to which its microtubule was attached. The cell becomes visibly elongated as the nonkinetochore microtubules slide against each other at the metaphase plate where they overlap.
During telophase, all the events that set up the duplicated chromosomes for mitosis during the first three phases are reversed. The chromosomes reach the opposite poles and begin to decondense (unravel). The mitotic spindles are broken down into monomers that will be used to assemble cytoskeleton components for each daughter cell. Nuclear envelopes form around chromosomes.
Control of the cell cycle
There are three key checkpoints in the cell cycle that provide regulation oversight:
- G1 checkpoint,
- G2/M checkpoint, and
- Metaphase checkpoint.
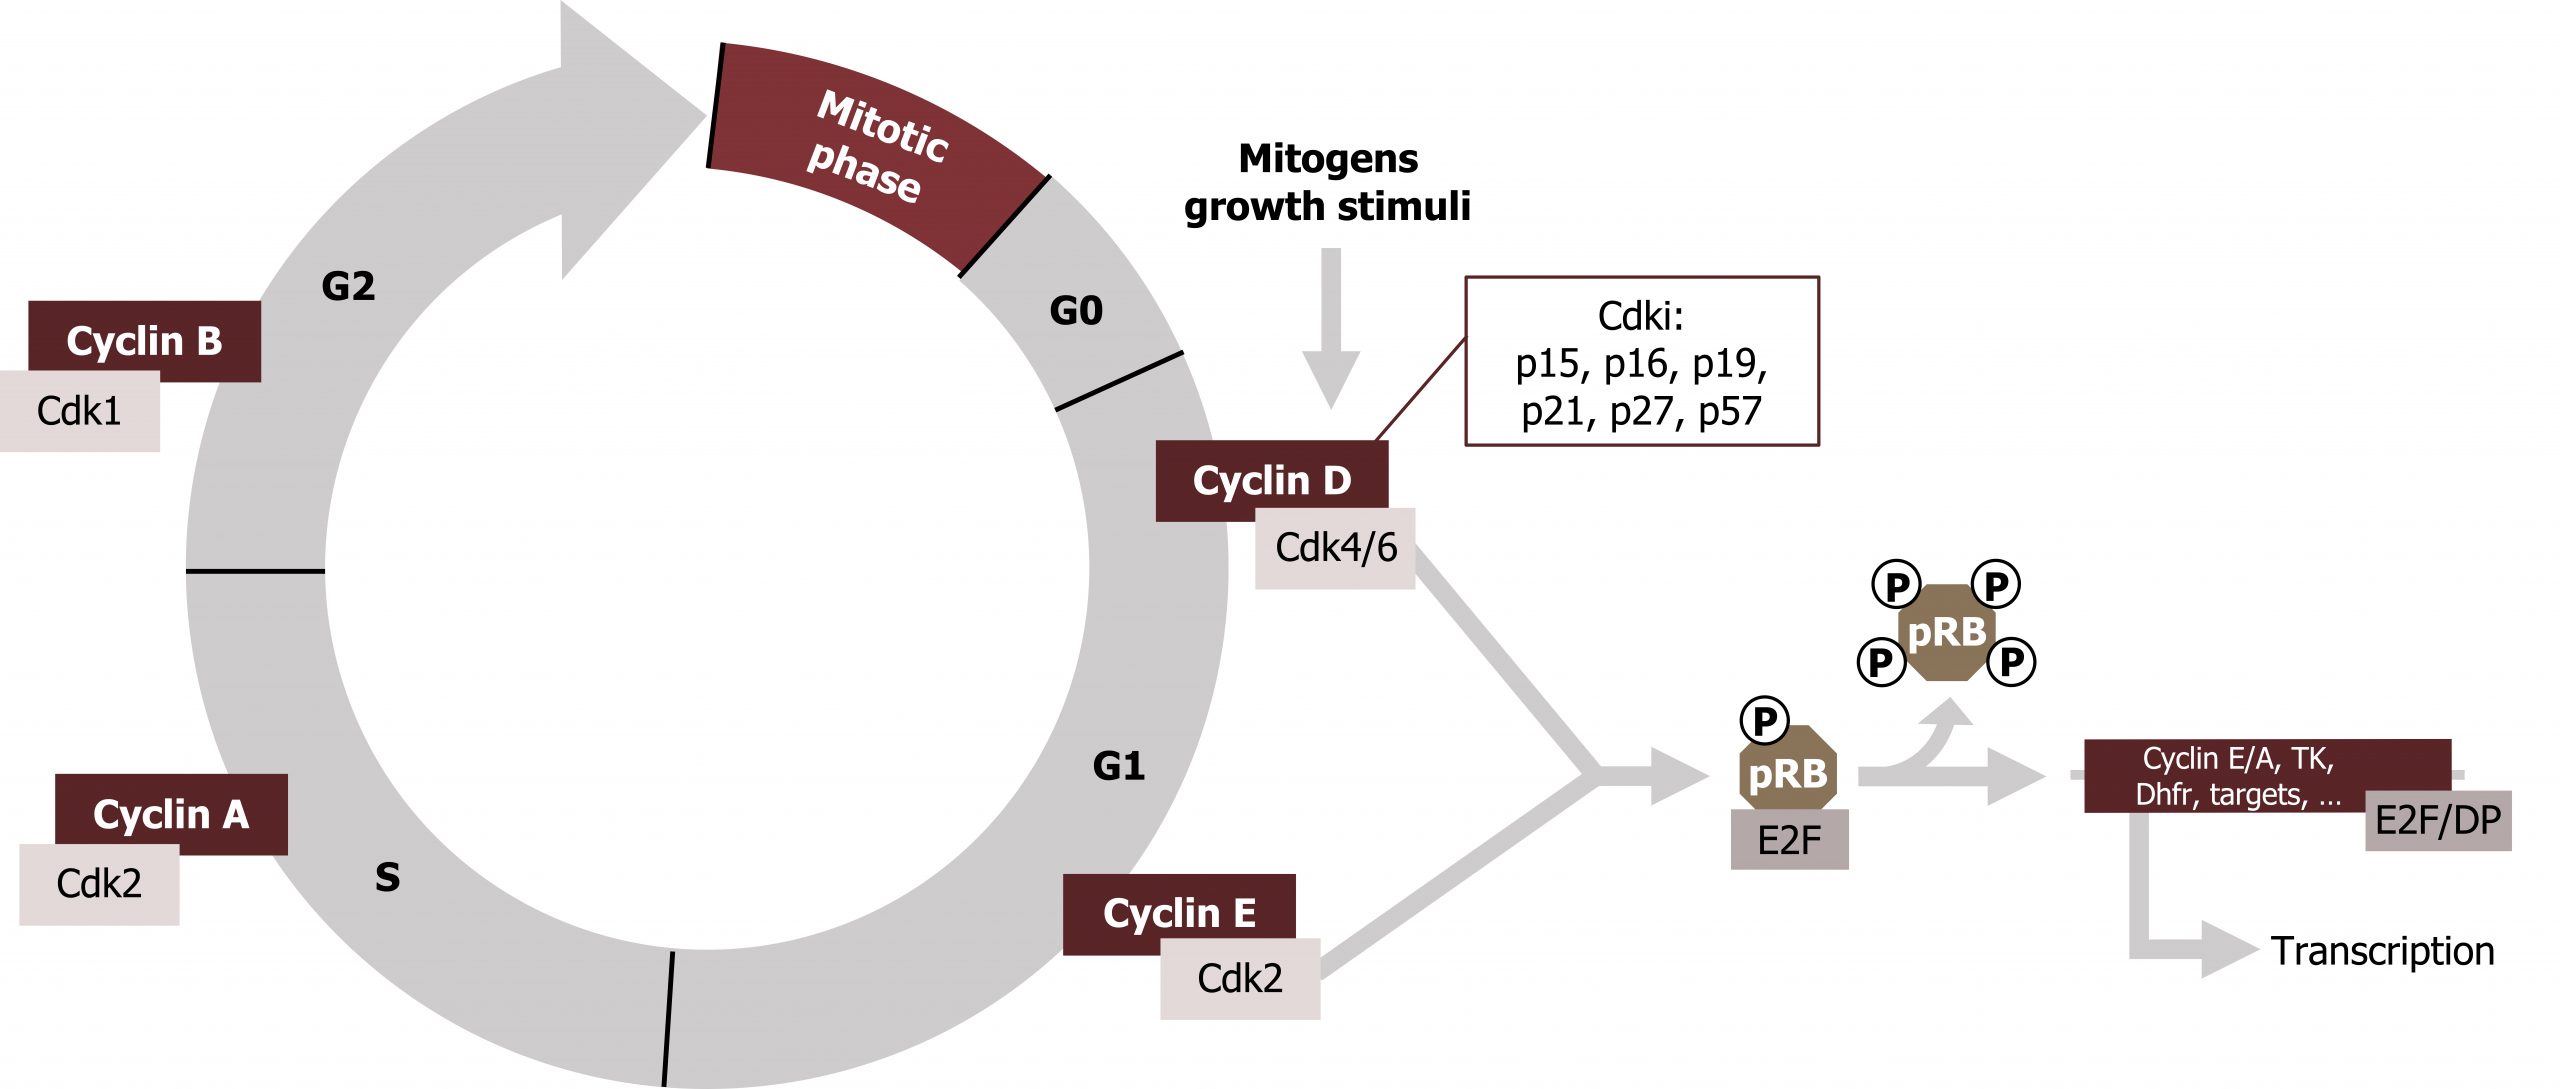
Progress through these checkpoints is regulated by a family of cyclin dependent kinases (CDKs). These proteins are constitutive (always present) and inactive. CDKs bind specific cyclin activators, which are required for activity of the kinase. CDKs are present throughout the cell cycle, but expression of the cyclins is restricted to certain times in the cycle, and they are rapidly degraded as the cells progress through the checkpoints. Through binding of cyclins and negative regulation by phosphorylation by CDK inhibitors (CKIs), the cycle is tightly regulated in a restricted manner.
The cyclin and CDK complex can be produced from a combination of different cyclins (A‒D) and different CDKs (1‒6).
Rb-protein
Rb-protein (pRb, retinoblastoma protein) is an important substrate of the G1/S‒CDK complexes. During the G0 and G1 phases, Rb is present in an unphosphorylated (hypophosphorylationed) form, which binds to the transcription factor E2F and thereby blocks it from initiating transcription. When the cycle moves into the S1 phase, pRb becomes phosphorylated (by the CyclinD/CDK4/6 active complex), which allows for the release of E2F.
DNA damage
During the process of DNA replication, DNA damage will halt the process until it can be repaired. Likewise, extrinsic damaging factors can trigger a DNA repair process. Protein p53 is commonly known for its role in DNA repair mechanisms. Under nonstressful conditions it is bound to mdm2 within the cytosol. In response to stress and DNA damage, it is activated, through ATM- or ATR-mediated phosphorylation. Once active, it functions as a transcription factor and induces the synthesis of protein p21.
p21 will then act as a CDK inhibitor (Cip/Kip family) and blocks the action of the G1‒CDK complex. This will halt the cell cycle at the transition to the S1 phase, and the DNA can be repaired at leisure (figure 12.9). When this has been successfully completed, p53 is dephosphorylated, ubiquitinylated, and passed on to the proteasome. Thus, p53 does not accumulate in normal cells.
If the DNA repair systems do not succeed in eliminating the DNA damage, a steady increase in the concentration of phosphorylated p53 finally drives the cell into apoptosis. Proteins pRb and p53 are products of tumor suppressor genes. Complete absence of them, due to mutations, leads to accelerated cell division, a typical feature of tumors. In fact, somatic mutations in pRb and p53 have been found in more than half of all human tumors (figure 12.9).
12.2 References and resources
Text
Clark, M. A. Biology, 2nd ed. Houston, TX: OpenStax College, Rice University, 2018, Chapter 10: Cell Reproduction, Chapter 11: Meiosis and Sexual Reproduction, Chapter 16: Gene Expression.
Karp, G., and J. G. Patton. Cell and Molecular Biology: Concepts and Experiments, 7th ed. Hoboken, NJ: John Wiley, 2013, Chapter 11: Gene Expression: From Transcription to Translation, Chapter 12: The Cell Nucleus and the Control of Gene Expression, Chapter 13: DNA Replication and Repair, Chapter 14: Cellular Reproduction.
Le, T., and V. Bhushan. First Aid for the USMLE Step 1, 29th ed. New York: McGraw Hill Education, 2018, 41–43, 46.
Nussbaum, R. L., R. R. McInnes, H. F. Willard, A. Hamosh, and M. W. Thompson. Thompson & Thompson Genetics in Medicine, 8th ed. Philadelphia: Saunders/Elsevier, 2016, Chapter 3: The Human Genome: Gene Structure and Function.
Figures
Grey, Kindred, Figure 12.7 Overview of the cell cycle. 2021. https://archive.org/details/12.7_20210926. CC BY 4.0.
Grey, Kindred, Figure 12.8 Summary of the mitotic phase. 2021. https://archive.org/details/12.8_20210926. CC BY 4.0. Added Mitosis cells sequence by LadyofHats. Public domain. From Wikimedia Commons. And Figure 2. CC BY 4.0. From Lumen.
Grey, Kindred, Figure 12.9 Summary of cell cycle checkpoints and role of CDK inhibitors in halting cell cycle progress. 2021. https://archive.org/details/12.9_20210926. CC BY 4.0.
12.3 Meiosis
The twenty-three chromosome pairs in humans accounts for all the genetic information needed to survive. For most of the components within the cell, only an approximation of division is needed during cell replication, however, with respect to division of DNA, this duplication and segregation must be exact. The integrity of the genetic information within the cell is critical for the well-being of the organisms and its offspring, so these processes are clearly controlled.
Within the cell cycle, the process of mitosis is largely responsible for this intricate chromosomal division of the somatic (body) cells by which two identical diploid daughter cells are produced through deoxyribonucleic acid (DNA) replication and cytoplasmic division.
In contrast, meiosis is a specialized process of the germline (sperm and eggs) that involves one round of DNA replication followed by two cell divisions to produce four haploid germ cells. Unlike mitosis, the resulting germ cells differ in males and females.
Male meiosis results in the production of four equally sized, functional spermatozoa, while female meiosis results in a single large functional ovum and three small nonfunctional polar bodies. Abnormalities in these processes include chromosomal nondisjunction, which results in the loss or gain of one or more chromosomes, and chromosomal breakage due to unrepaired DNA damage, which results in the formation of abnormal chromosomes and an increased risk for neoplasia.
Meiosis
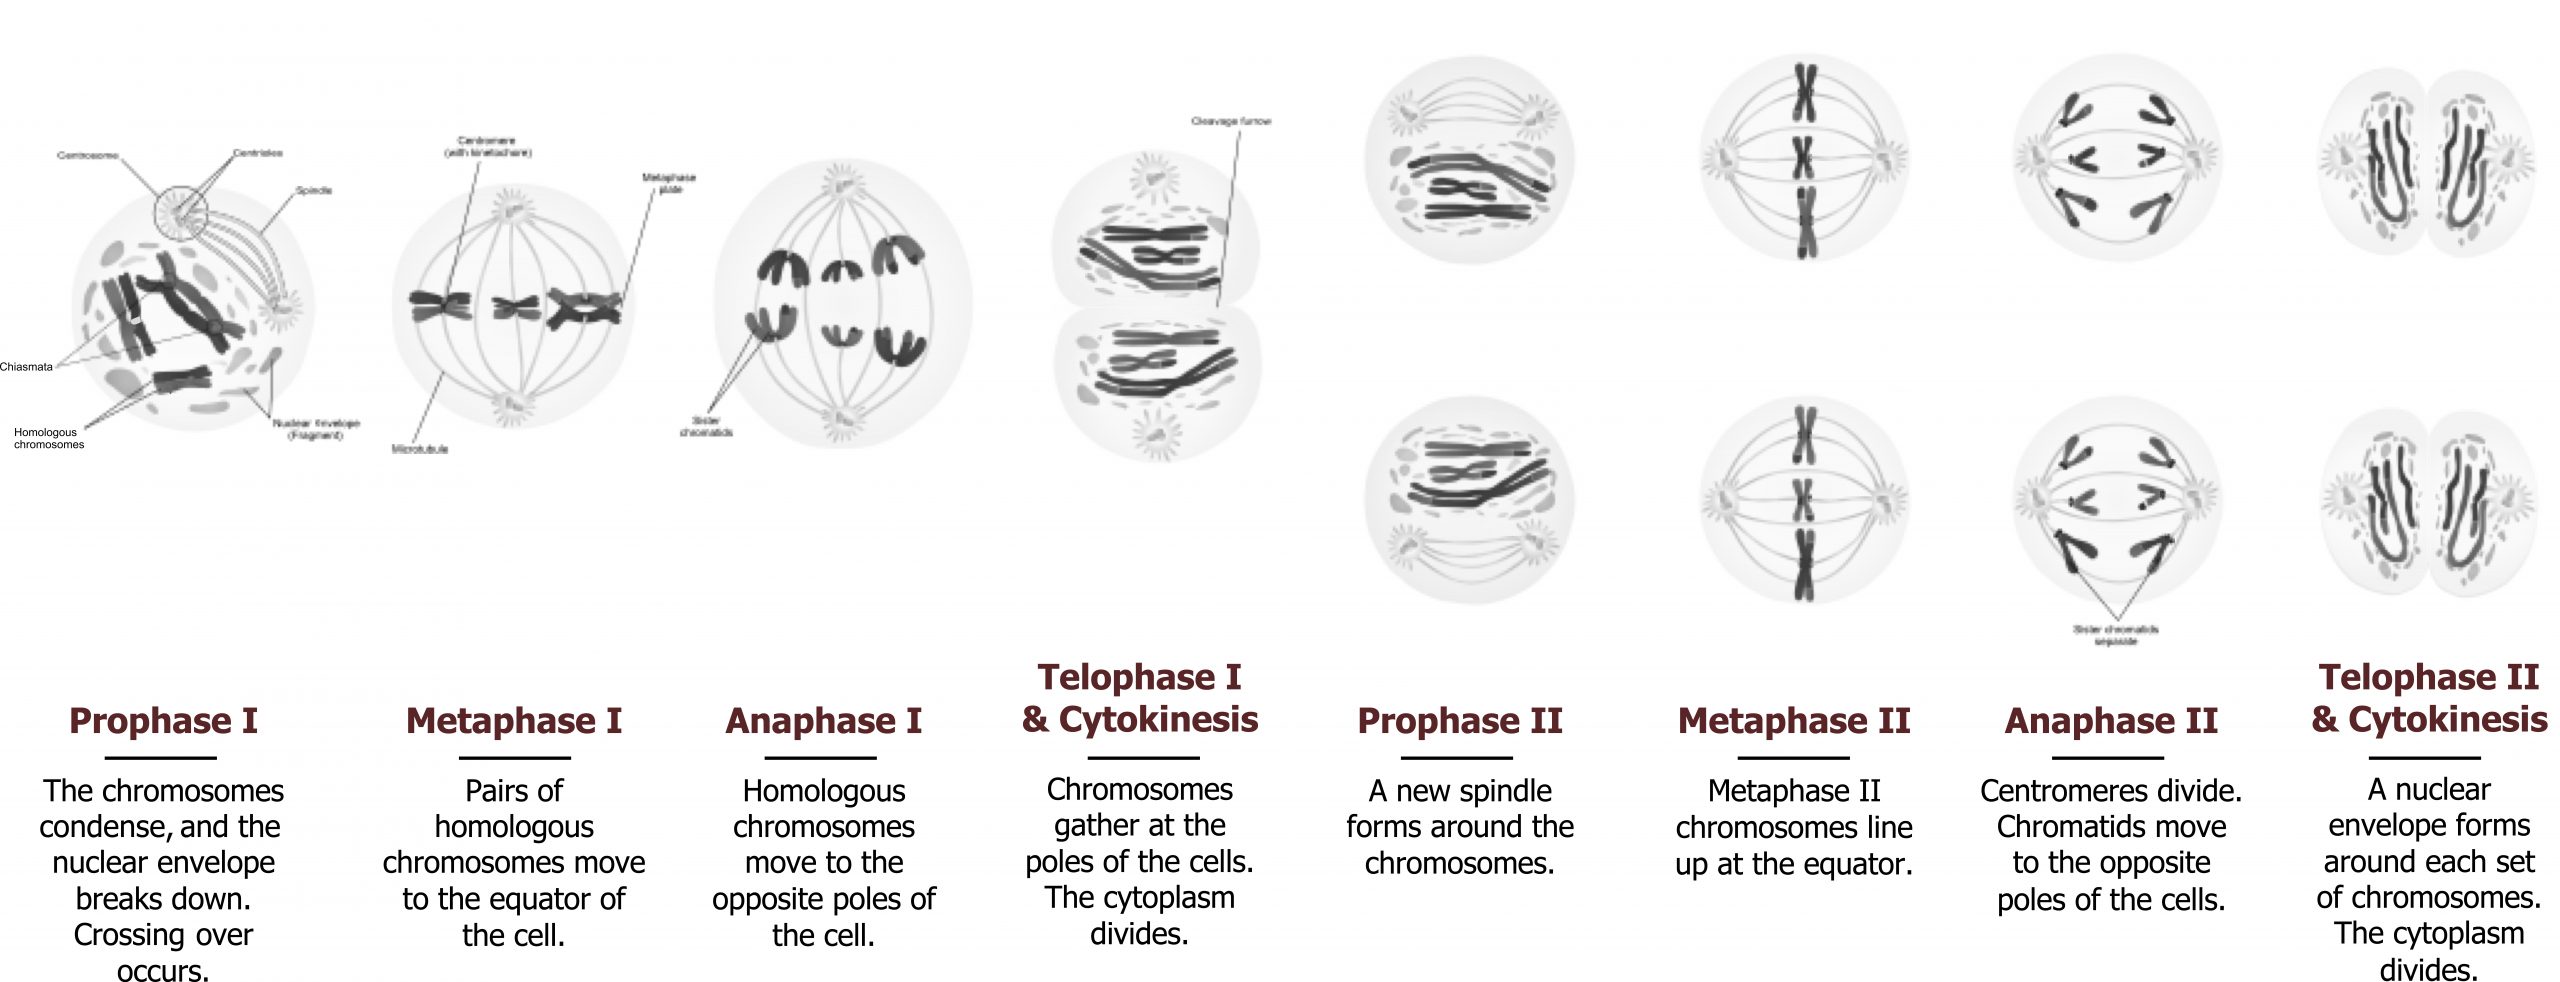
Meiosis is composed of two distinctive cell divisions, meiosis I and meiosis II, which are found only in the germline. Through these two divisions, haploid gametes are formed from diploid somatic cells. There is only one replication of the DNA, but there are two divisions of the chromosomes. The first division differs from the second in that there is pairing and recombination between homologous chromosomes resulting in variation in the genetic makeup of the gametes. Segregation of the homologues occurs during the first meiotic (reductional) division, reducing the forty-six chromosomes to twenty-three, one from each homologous pair. The second (equational) division is similar to mitosis with segregation of sister chromatids into daughter cells (figure 12.10).
Meiosis I: Reductional division
Before meiosis, gametic stem cells replicate through mitosis. At the very beginning of meiosis, the last G1 phase of the diploid stem cells is followed by chromosome replication during S phase and G2, ending the last somatic interphase. Thus, each cell enters meiosis with two copies of the diploid genome (2n, 2c). At this point, the spermatogonium (male somatic cell) enlarges to become a primary spermatocyte, and the oogonium (female somatic cell) enlarges to become a primary oocyte.
These cells then enter prophase I, which is subdivided into five stages: leptotene, zygotene, pachytene, diplotene, and diakinesis. In female meiosis, there is an additional stage following diplotene called dictyotene in which the oocyte remains from early fetal gestation until ovulation when diakinesis occurs.
Prophase I
During prophase I, homologous chromosomes pair and undergo recombination through crossing over. This is visualized by the presence of X-shaped connections between homologues, called chiasmata, as the homologues begin to repel each other. These chiasmata will aid in the proper segregation of the chromosomes and become more prominent during diplotene. This is where the synaptoneal complex dissolves, allowing for chromosomal condensation to continue and for the repulsion of homologous chromosomes. The separation of the homologous chromosomes causes the chiasmata to appear. Individual chromatids can be visualized during this stage. (The dictyotene stage is unique to female meiosis in which there is a decondensation of chromosomal bivalents. The oocyte remains in this state for many years until follicle maturation and ovulation.)
At diakinesis, chromosomal condensation is completed. The chiasmata on each arm of the chromosomes move distally toward the telomeres. Each bivalent contains four chromatids, and pairs of sister chromatids are linked at the centromeres.
Metaphase I
The spindle forms, and the nuclear membrane disappears. Bivalents align on the metaphase plate still held together by the chiasmata. The centromeres of the two homologous chromosomes are separate, aligning on either side of the equatorial plate.
Anaphase I
Homologous chromosomes separate from each other by final terminalization of the chiasmata. They move to opposite poles, pulled by the centromere, which is attached to spindle fibers.
Telophase I
The chromosomes reach the poles, a nuclear membrane is formed, and cell division occurs. In male meiosis, the cytoplasm is divided equally, and the two resulting cells become secondary spermatocytes. In female meiosis, the division is unequal; most of the cytoplasm is retained in the secondary oocyte, while very little is retained by the first polar body. This period is very brief, and chromosomes move immediately to the second meiotic division. Each cell at this stage is haploid (1n) but with each chromosome formed of sister chromatids (2c). The sister chromatids may be unique due to recombination during the two homologues in prophase I.
Meiosis II: Equational division
This division is similar to mitosis in that individual chromosomes align on the metaphase plate, and sister chromatids separate and move to opposite poles at anaphase. The single copy (1c) of each chromosome is represented by one sister chromatid in the spermatids or mature ova.
Male meiosis
In humans, the male is the heterogametic sex, producing two kinds of normal sperm: 23,X and 23,Y. Spermatogenesis is a constant event beginning at puberty and continuing throughout life to produce four functional spermatids from each primary gametocyte. At puberty, the number of spermatogonia (diploid stem cells) increases. These develop into primary spermatocytes after several mitotic divisions. Each primary spermatocyte undergoes the first meiotic division to become two secondary spermatocytes. These cells then undergo the second meiotic division to become four spermatids of equal size with a haploid set of chromosomes. Spermiogenesis then transforms the spermatids into mature spermatozoa by elimination of the cytoplasm, elongation of the head of the sperm, and formation of a tail. The entire process from the enlargement of the spermatogonium to formation of the mature spermatozoa takes approximately sixty-four days.
Female meiosis
This is in contrast to meiosis in females, which begins before birth and produces only a single type of normal ovum: 23,X. The precursors to the germ cells are oogonia; these increase in number through mitosis, reaching a maximum number of approximately 7 million. Each individual oogonium enlarges to form a primary oocyte, which becomes surrounded by ovarian stromal cells to form a primary follicle. The vast majority of primary oocytes are formed during the third and fourth months of fetal life.
The primary oocyte begins the first meiotic division to become a secondary oocyte with the extrusion of a small polar body as the follicle matures and completes metaphase I with expulsion from the mature follicle at ovulation. The secondary oocyte does not complete the second meiotic division until fertilization, when a second polar body is extruded to form a mature ovum with a haploid set of chromosomes. Thus, each primary oocyte produces one functional gamete, the mature ovum, and three polar bodies. A nuclear membrane forms a pronucleus around the haploid set of maternal chromosomes, while a second pronucleus forms from the haploid set of chromosomes from the sperm head. These two pronuclei then fuse to begin the first mitotic division.
Meiotic pairing
Homologous pairing is unique to meiosis and plays two important roles: genetic recombination and chromosomal stabilization. While it has long been believed that the former is the most important, the latter is now accepted as the primary significance of meiotic recombination. During meiosis I, the pairing of homologues facilitates recombination, which is initiated by programed double-stranded breaks occurring at synaptic initiation sites (SISs). A subset of these breaks will resolve into the formation of the synaptonemal complex. When pairing is completed, synapsis occurs between the homologues, which completes the crossing over event. Each crossover event forms chasmata, which play an analogous role to the centromere and stabilize the maternal and paternal chromosomes. The stabilization of the metaphase chromosomes using this mechanism is key to normal chromosomal alignment and maintenance of an intact genome. Without recombination, the total number of unique gametic combinations of genes for each parent would be just over 8 million. However, crossing over greatly increases the total number of possible gene combinations such that the likelihood of either parent producing identical gametes is vanishingly small.
12.3 References and resources
Text
Clark, M. A. Biology, 2nd ed. Houston, TX: OpenStax College, Rice University, 2018, Chapter 10: Cell Reproduction, Chapter 11: Meiosis and Sexual Reproduction, Chapter 16: Gene Expression.
Karp, G., and J. G. Patton. Cell and Molecular Biology: Concepts and Experiments, 7th ed. Hoboken, NJ: John Wiley, 2013, Chapter 11: Gene Expression: From Transcription to Translation, Chapter 12: The Cell Nucleus and the Control of Gene Expression, Chapter 13: DNA Replication and Repair, Chapter 14: Cellular Reproduction.
Le, T., and V. Bhushan. First Aid for the USMLE Step 1, 29th ed. New York: McGraw Hill Education, 2018, 41–43, 46.
Nussbaum, R. L., R. R. McInnes, H. F. Willard, A. Hamosh, and M. W. Thompson. Thompson & Thompson Genetics in Medicine, 8th ed. Philadelphia: Saunders/Elsevier, 2016, Chapter 3: The Human Genome: Gene Structure and Function.
Figures
Grey, Kindred, Figure 12.10 Overview of Meiosis. 2021. https://archive.org/details/12.10_202109. CC BY 4.0. Added Meiosis Stages by Ali Zifan. CC BY 4.0. From Wikimedia Commons.
