4 Sustainable Building Maintenance and Repair Practices
Chapter Contents
4.1 Introduction
4.3 Water Efficiency
4.4 Indoor Environmental Quality
4.5 Waste Management
4.7 Conclusion
Learning Objectives
- Describe pathways to increase energy efficiency
- Describe pathways to increase water efficiency
- Describe pathways to increase indoor environmental quality
- Describe pathways to waste management
- Describe pathways to increase site sustainability
4.1 Introduction
Maintenance and repairs are continual functions throughout the operations phase of the building lifecycle. Proper maintenance and prompt repairs extend the life of building equipment and keep the property running efficiently. Making these functions more sustainable can further the efficiency and effectiveness of the building systems while also lowering operational costs, decreasing ecological disturbances, and increasing building occupant comfort. This holistically increases sustainability at the property. Sustainable concepts including energy efficiency, water efficiency, indoor environmental quality, waste management, and site sustainability considerations are covered in this chapter as well as some best practices.
4.2 Energy Efficiency
Energy efficiency is a fundamental concept for increasing the sustainability of a property. Higher amounts of greenhouse gases are emitted from buildings that use nonrenewable energy inefficiently. This not only harms the ecological environment to a greater degree, but also creates higher bills for the landlord and building user.
In 2020, residential and commercial buildings in the United States consumed 40 percent of total U.S. energy consumption (U.S. Energy Information Administration, 2022). Figure 4.1 and figure 4.2 illustrate the major end uses in commercial and residential buildings. Lighting, refrigeration, ventilation, and cooling consumed the most electricity in commercial buildings while air conditioning, space heating, water heating, and lighting consumed the most electricity in residential buildings. Strategies to make buildings more energy efficient involve reduction of greenhouse gas emissions by lowering energy use from traditional sources such as fossil fuels or by transferring over to renewable energy. These efforts can bring the building closer to net zero energy, where a building generates as much energy as the building consumes, or net positive energy, where the property generates more energy than the building consumes. However, it is more difficult to achieve net zero energy and net positive energy solely from building operations without first considering this goal during the building design and construction process.
A holistic energy audit is the first step to understanding the property’s energy consumption. The energy audit, an assessment of energy use and efficiency within the property, is holistic in the sense that all energy end uses are assessed and the impacts of these energy uses on environmental, social, and economic spheres are taken into consideration. A best practice is to create a checklist that will assist in identifying and prioritizing energy consumption reduction opportunities. Also, it is helpful to conduct energy audits every few years to continually evaluate the property’s energy consumption and identify potential strategies to reduce energy consumption as well as consider the energy needs of the stakeholders.
Energy audits vary in scope and can be performed through either a self-assessment or energy professional, or some combination of the two. During a self-assessment energy audit, the following can be inspected:
- Any air leak locations
- Ventilation
- Insulation levels
- Heating and cooling equipment
- Lighting
- Appliances and Electronics
Source: https://www.energy.gov/energysaver/do-it-yourself-home-energy-assessments
Professional energy audits tend to be more comprehensive. Specialists trained in this line of work tend to identify more issues than a self-assessment will. Specialists provide the services listed above in the self-assessment and can also include services such as:
- Prior utility bill examination
- Blower door test (illustrated in figure 4.3, and a video on how this test works is at the end of this section)
- Thermographic scan (illustrated in figure 4.4, and a video on how this test works is at the end of this section)
- Air infiltration measurements
Source: https://www.energy.gov/energysaver/professional-home-energy-assessments

When considering an energy audit at the property, some property managers may begin with a professional energy audit, whereas other property managers may first do a self-assessment and then set up a professional energy audit. A combination of both can be most effective because the property manager can share the self-assessment with the professional energy auditor, which can provide additional solutions above and beyond their standard energy audit. This combination also helps property managers become more familiar with the building components that can be helpful in catching issues early.
For further information, the United States Department of Energy offers a “Do-It-Yourself Home Energy Assessments” webpage that goes into more detail: https://www.energy.gov/energysaver/do-it-yourself-home-energy-assessments
Energy benchmarking is a significant component of an energy audit because it measures energy consumption and compares it to similar buildings as well as to other buildings in the company’s portfolio. Benchmarking also provides a baseline for energy measurement and can be used to set future energy consumption goals. ENERGY STAR Portfolio Manager® is a widely used benchmarking tool for commercial buildings with approximately 25 percent of U.S. commercial building space utilizing this measurement and tracking tool (ENERGY STAR, n.d.). Utility bill data and basic building information are inputted and a score is generated comparing the subject building to similar buildings in the United States while accounting for weather and operating condition variations. The building score can be between 1–100 with 50 being the median score. The higher the score, the more energy efficient the subject building is compared to its peer buildings.
Energy efficiency recommendations are then put forward based on the building energy audit and benchmarking findings, and these include energy efficiency goals with associated target dates. An energy management policy is helpful in laying out the pathways to reach these goals within the respective timeframes and can include implementation of energy management best practice policies and energy efficient products. For example, an energy efficiency best practice policy can be to regularly schedule a walkthrough of all equipment to identify any items that are not functioning properly and flag them for repair and put a target date for the repair. Also, energy efficient product recommendations vary in the levels of upfront cost and subsequent savings during operations. For example, changing out traditional incandescent light bulbs to light emitting diode (LED) lightbulbs is a much lower cost recommendation than installing a photovoltaic (PV) array on the site, but also does not produce the same subsequent savings during operations. The next few paragraphs discuss some ideas to increase the energy efficiency of major end uses at the building level.
Lighting
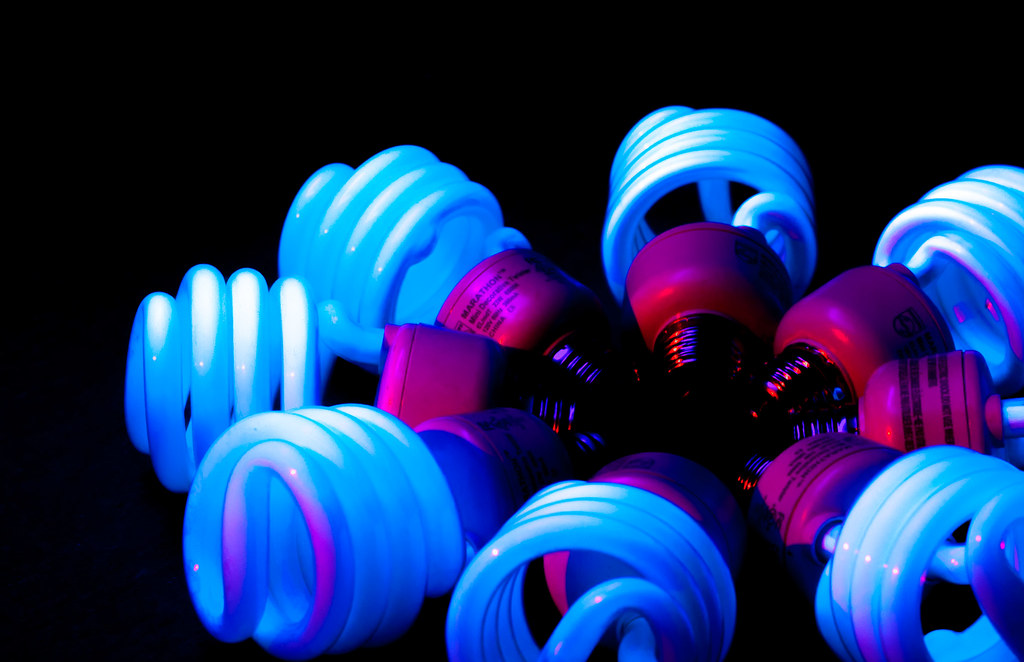
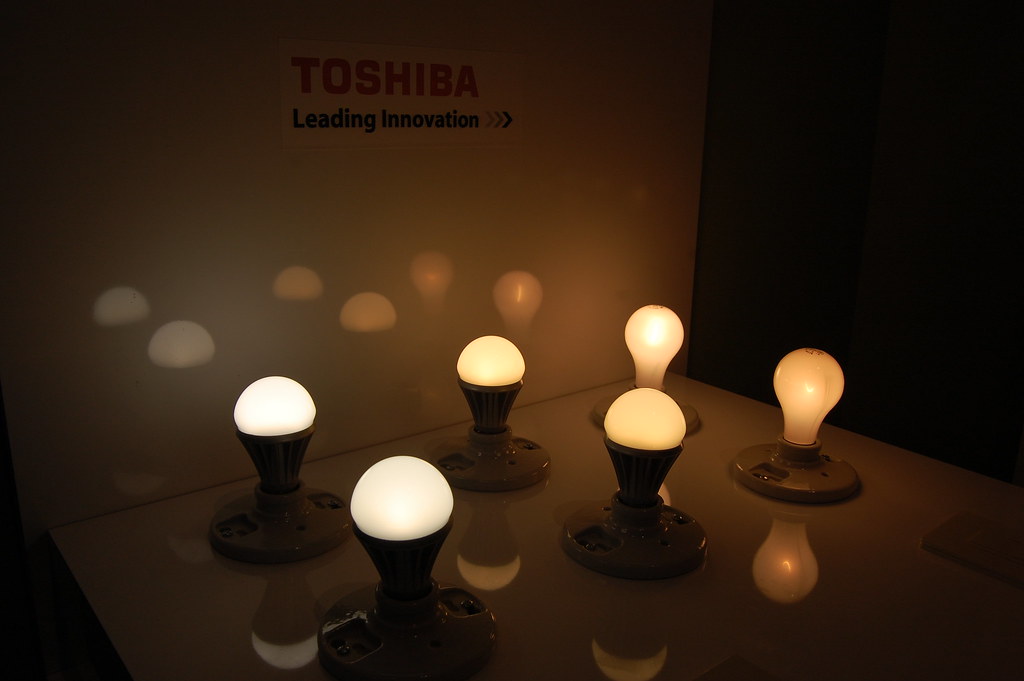
Motion sensors are one method to increase the energy efficiency of lighting at a property. Motion sensors are installed to automatically turn the lights off when the sensor detects no more movement within the respective building space. Switching to more energy efficient light bulbs is another way to increase energy efficiency. There are three main types of light bulbs, as illustrated in figures 4.5–4.7. The incandescent light bulb is the traditional light bulb with the shortest lifespan and lowest energy efficiency. The compact fluorescent lamps (CFL) have a longer lifespan and higher energy efficiency than the incandescent lightbulb, but the LED is the most efficient light bulb with the longest lifespan. When we consider sustainability’s environmental, social, and economic spheres, we find the LED is the most energy efficient, the maintenance staff onsite does not have to change the bulbs as often, and—although LED light bulbs cost more upfront—they are the most cost-effective long term due to their longer lifespan and energy efficiency. Also, material costs are reduced because LED light bulbs need to be replaced less often. Smart light bulbs are an LED light bulb option that allows the building user to set timers or manually turn off the lights in the building space using their smartphone, tablet, or smart home automation system.
HVAC
Annual service of HVAC equipment by a professional is important for peak performance. Also, quarterly HVAC air filter replacement is recommended to maintain optimum energy efficiency, as dirty air filters decrease the efficiency of HVAC equipment. If the unit is reaching the end of its expected lifetime or when replacement is needed due to a malfunction, a more energy efficient unit can be considered. ENERGY STAR certification is available for HVAC units and a list of ENERGY STAR options can be reviewed at energystar.gov.
Air leaks and low insulation levels within the building space can make HVAC equipment work harder. Therefore, in addition to evaluating the HVAC equipment itself, it is important to identify any air leaks and evaluate the costs and benefits of sealing the air leaks. Air leaks can commonly occur in ductwork, windows, doors, plumbing fixtures, lighting fixtures, flooring edges, and electrical outlets. Caulking and weather stripping are cost effective methods to reduce air leaks. A more expensive method would be to replace windows with more energy efficient ones to reduce air leakage. However, this option may be more economically sensible as windows approach or are past their expected lifetime. Properly insulating areas of the building space with minimum recommended insulation levels can also increase the energy efficiency of the building. Considering the social sphere of sustainability, reduced air leakage and higher insulation levels typically increase occupant comfort.
Appliances and Electronics
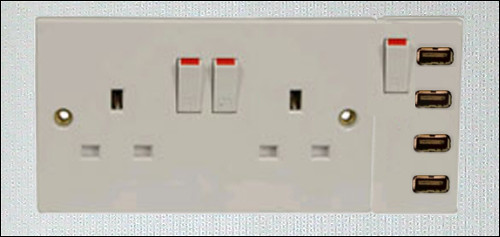
Consider the time spent using various appliances and electronics throughout your day. These can include a refrigerator, oven, stove, microwave, dishwasher, washer, dryer, coffee maker, phone, computer, and television, to name some examples. Also consider energy consumed by IT equipment within data centers. This energy consumption can be decreased by adjusting the settings of the devices or purchasing more energy-efficient devices. Furthermore, these devices consume energy even when they are turned off or on standby mode. This is known as vampire load or phantom power. Therefore, a best practice is to unplug a device when not using it. Another option, with upfront costs, is to install European-style outlets with shut off switches, as illustrated in figure 4.8. This prevents the building user from having to unplug appliances and electronics when not in use, but instead they just flip the switch on the outlet.
Water Heating
In the residential context, water heating is important for showering, cleaning dishes, and cleaning clothes. A cost-free way to decrease energy consumption of a water heater is to turn down the thermostat. This lowers cost and energy emissions without significantly affecting the comfort of taking a shower. Another cost-free method to reduce water heating is to use cold water for clothes washing. A low-cost method to decrease the energy emission from a water heater is to insulate the storage tank and the pipes. This reduces heat loss and the unit does not turn on as frequently. When considering new water heater choices, ENERGY STAR certified options are available and can be found at energystar.gov.
Energy Reduction Alternatives
Sometimes, energy reduction may not be possible. Therefore, bringing renewable energy to the operation of the building may be an opportunity to decrease fossil fuel use and associated greenhouse gas emissions. There are a variety of opportunities to include renewable energy into the building operations. First, electricity generated from renewable energy sources can be purchased directly from the utility company in many cases. Considering the economic sphere, there is typically a slight increase in cost for this option compared to nonrenewable power sources. In regions where utility companies do not offer this option, renewable energy certificates (RECs) can be purchased to illustrate the building’s commitment to operate on renewable energy.
Alternatively, renewable energy systems can be installed on the building site. While not an inexpensive upfront investment, the subsequent savings during operations can make up for this initial cost outlay. For example, a PV array can be installed to generate solar power for the building’s energy needs. Any solar power not used by the building is fed back to the power grid for use by other customers and the building would receive an REC that can be sold to others or be used as a credit against the building’s energy usage (referred to as net metering). It should be noted that net metering benefits are subject to jurisdiction and system capacity limits for jurisdictions that currently offer the net metering benefit. Also, disadvantages of solar power include the expense of the panels that are often impossible to recycle, which puts the embedded toxic chemicals (that facilitate the energy capture) directly into landfills where they leach.
Section Videos
ENERGY STAR: A Simple Choice (Appliances)
[00:01:56] ENERGY STAR. https://youtu.be/NtER86Cf_d4
Blower Door Test: How It Works
[00:03:20] GreenfabTV. https://youtu.be/0Vk-qk-vLb4
How an Infrared Camera works during a Home Inspection
[00:02:14] The Home Inspector. https://youtu.be/h0J3A_Uep_k
Section References
ENERGY STAR. (n.d.). Benchmark your building using ENERGY STAR portfolio manager. https://www.energystar.gov/buildings/benchmark.
U.S. Energy Information Administration. (2022, December 23). Frequently asked questions. https://www.eia.gov/tools/faqs/faq.php?id=86&t=1
4.3 Water Efficiency
While this section discusses water efficiency, it is important to note the connection between water efficiency and energy efficiency as a substantial amount of energy is needed to provide drinking water (also referred to as potable water) and for treating wastewater (also referred to as non-potable water). Water efficiency is also important on its own as there is a limited supply of freshwater and the cost of household water utility bills is rising—up 43 percent from 2012 to 2021 (Bluefield Research, 2021). Reducing water use will help maintain the supply of freshwater while also decreasing water utility bills.
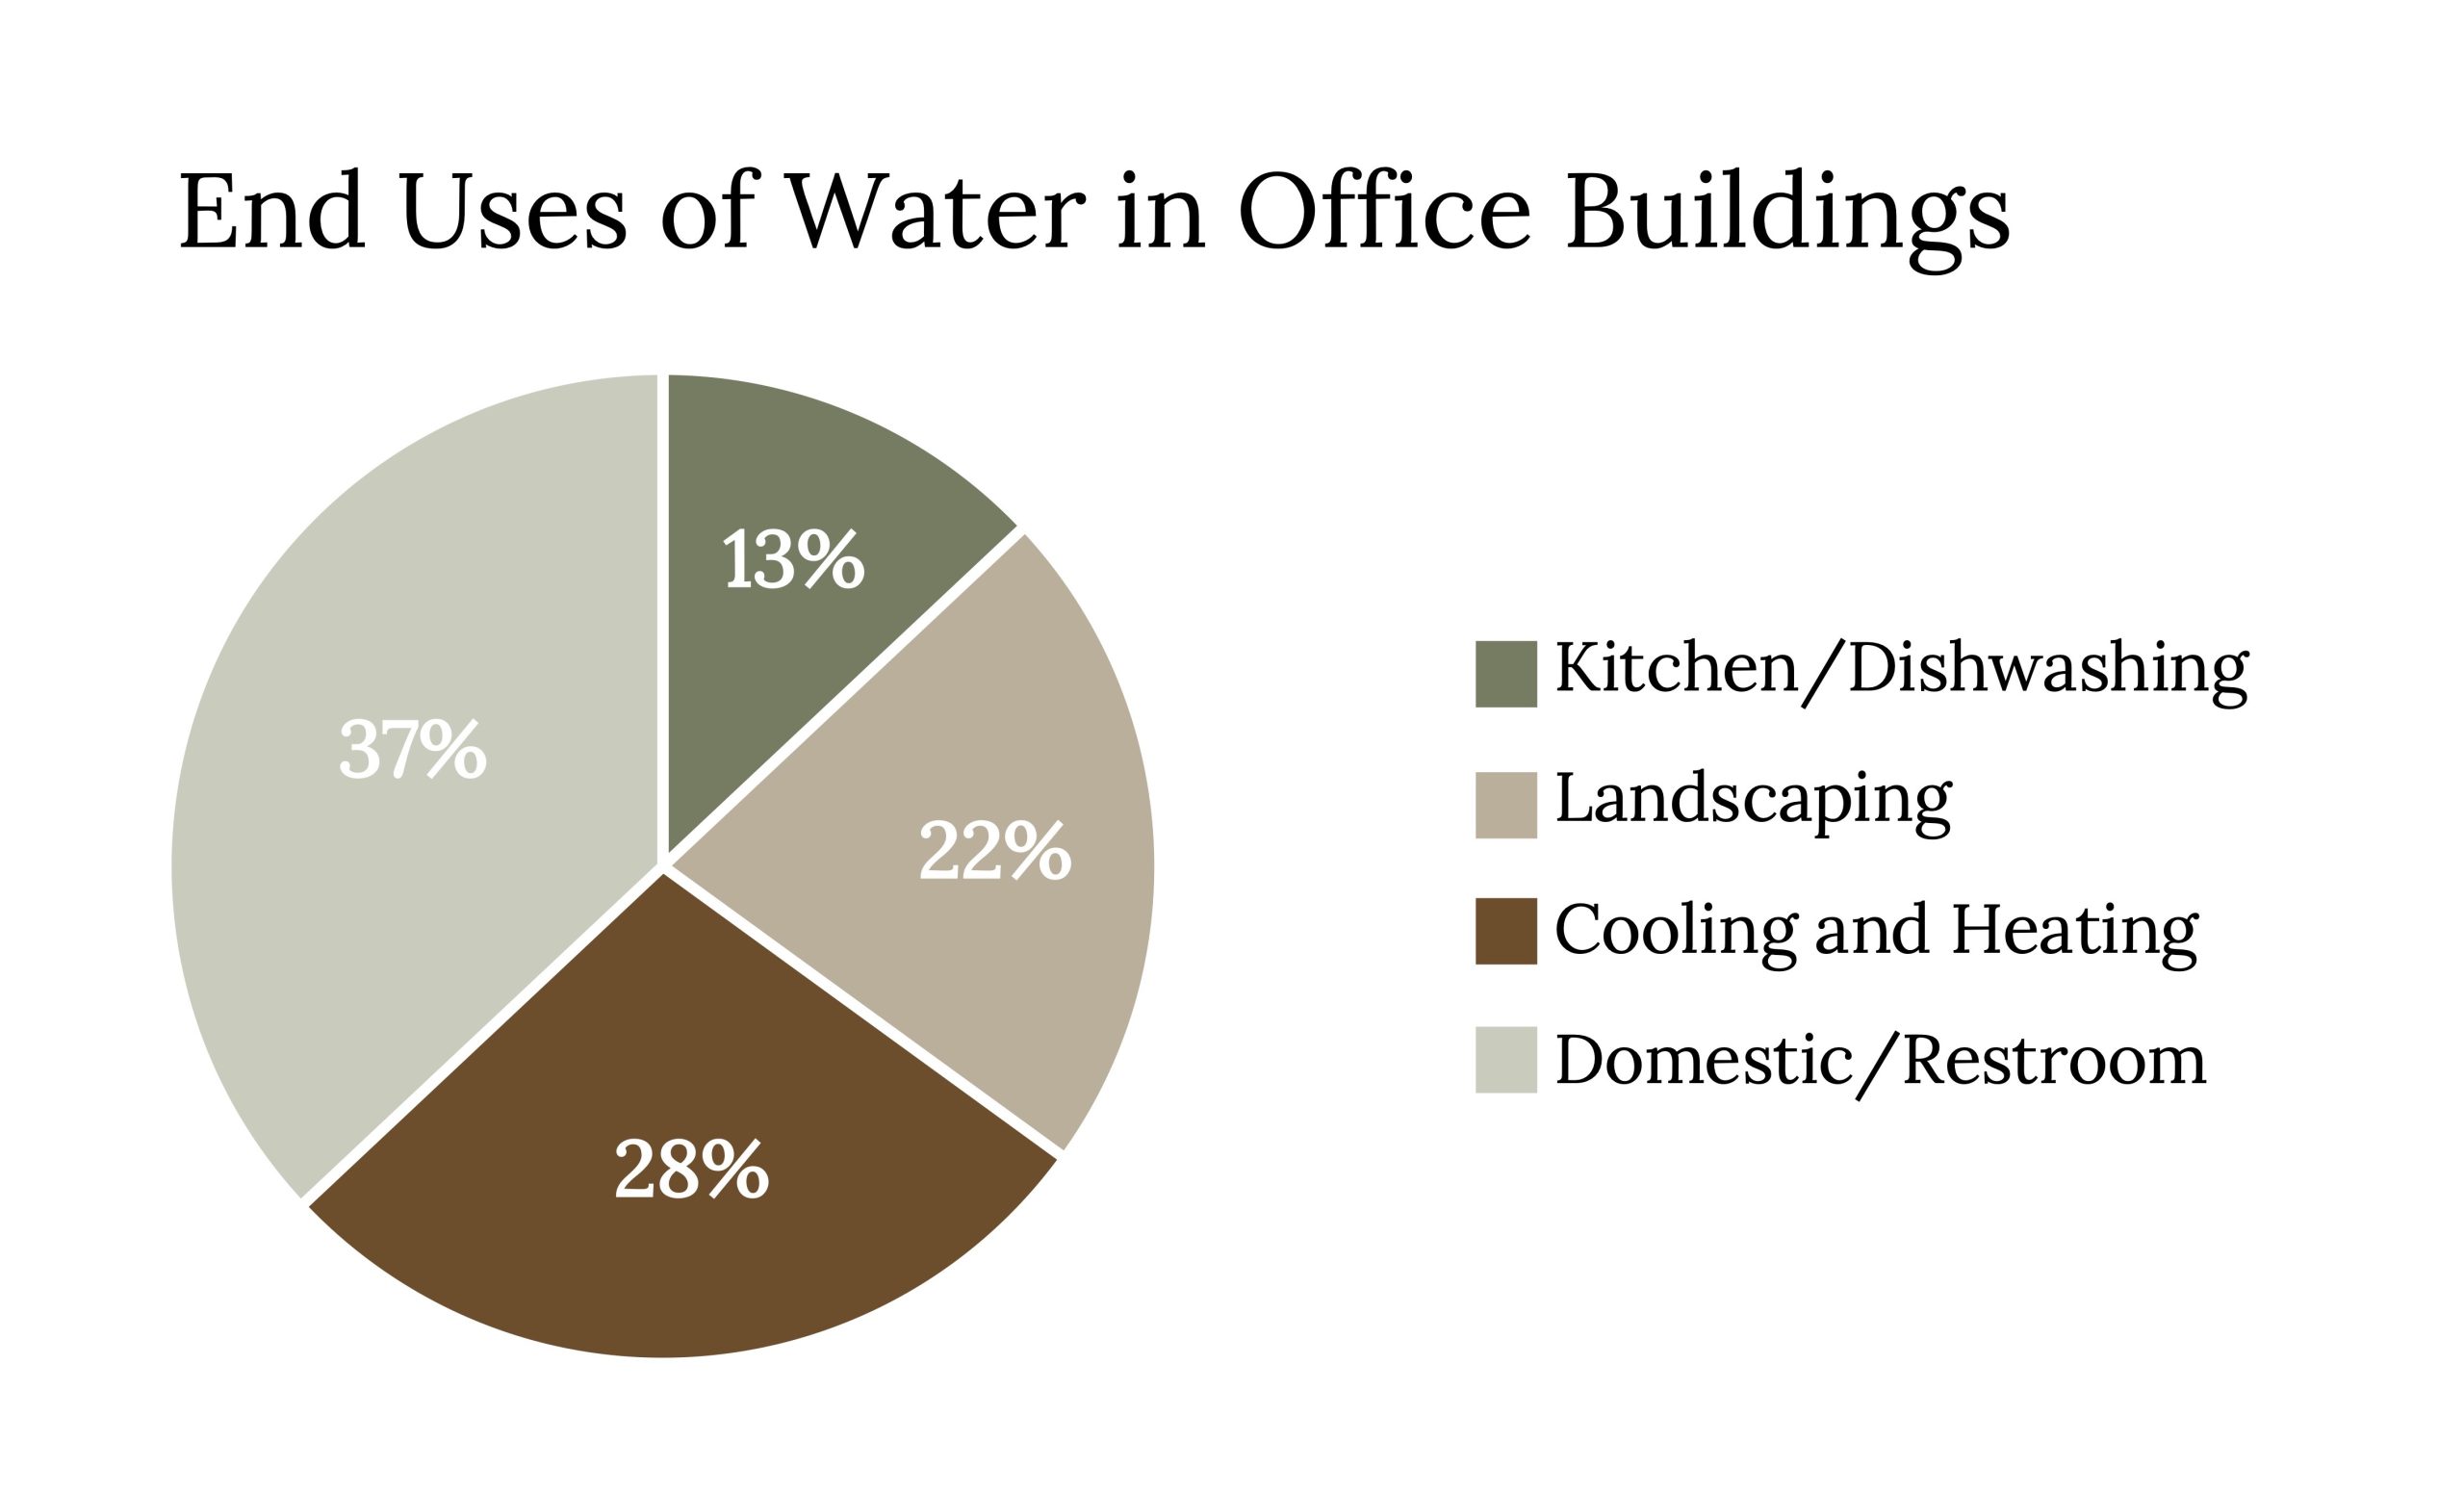
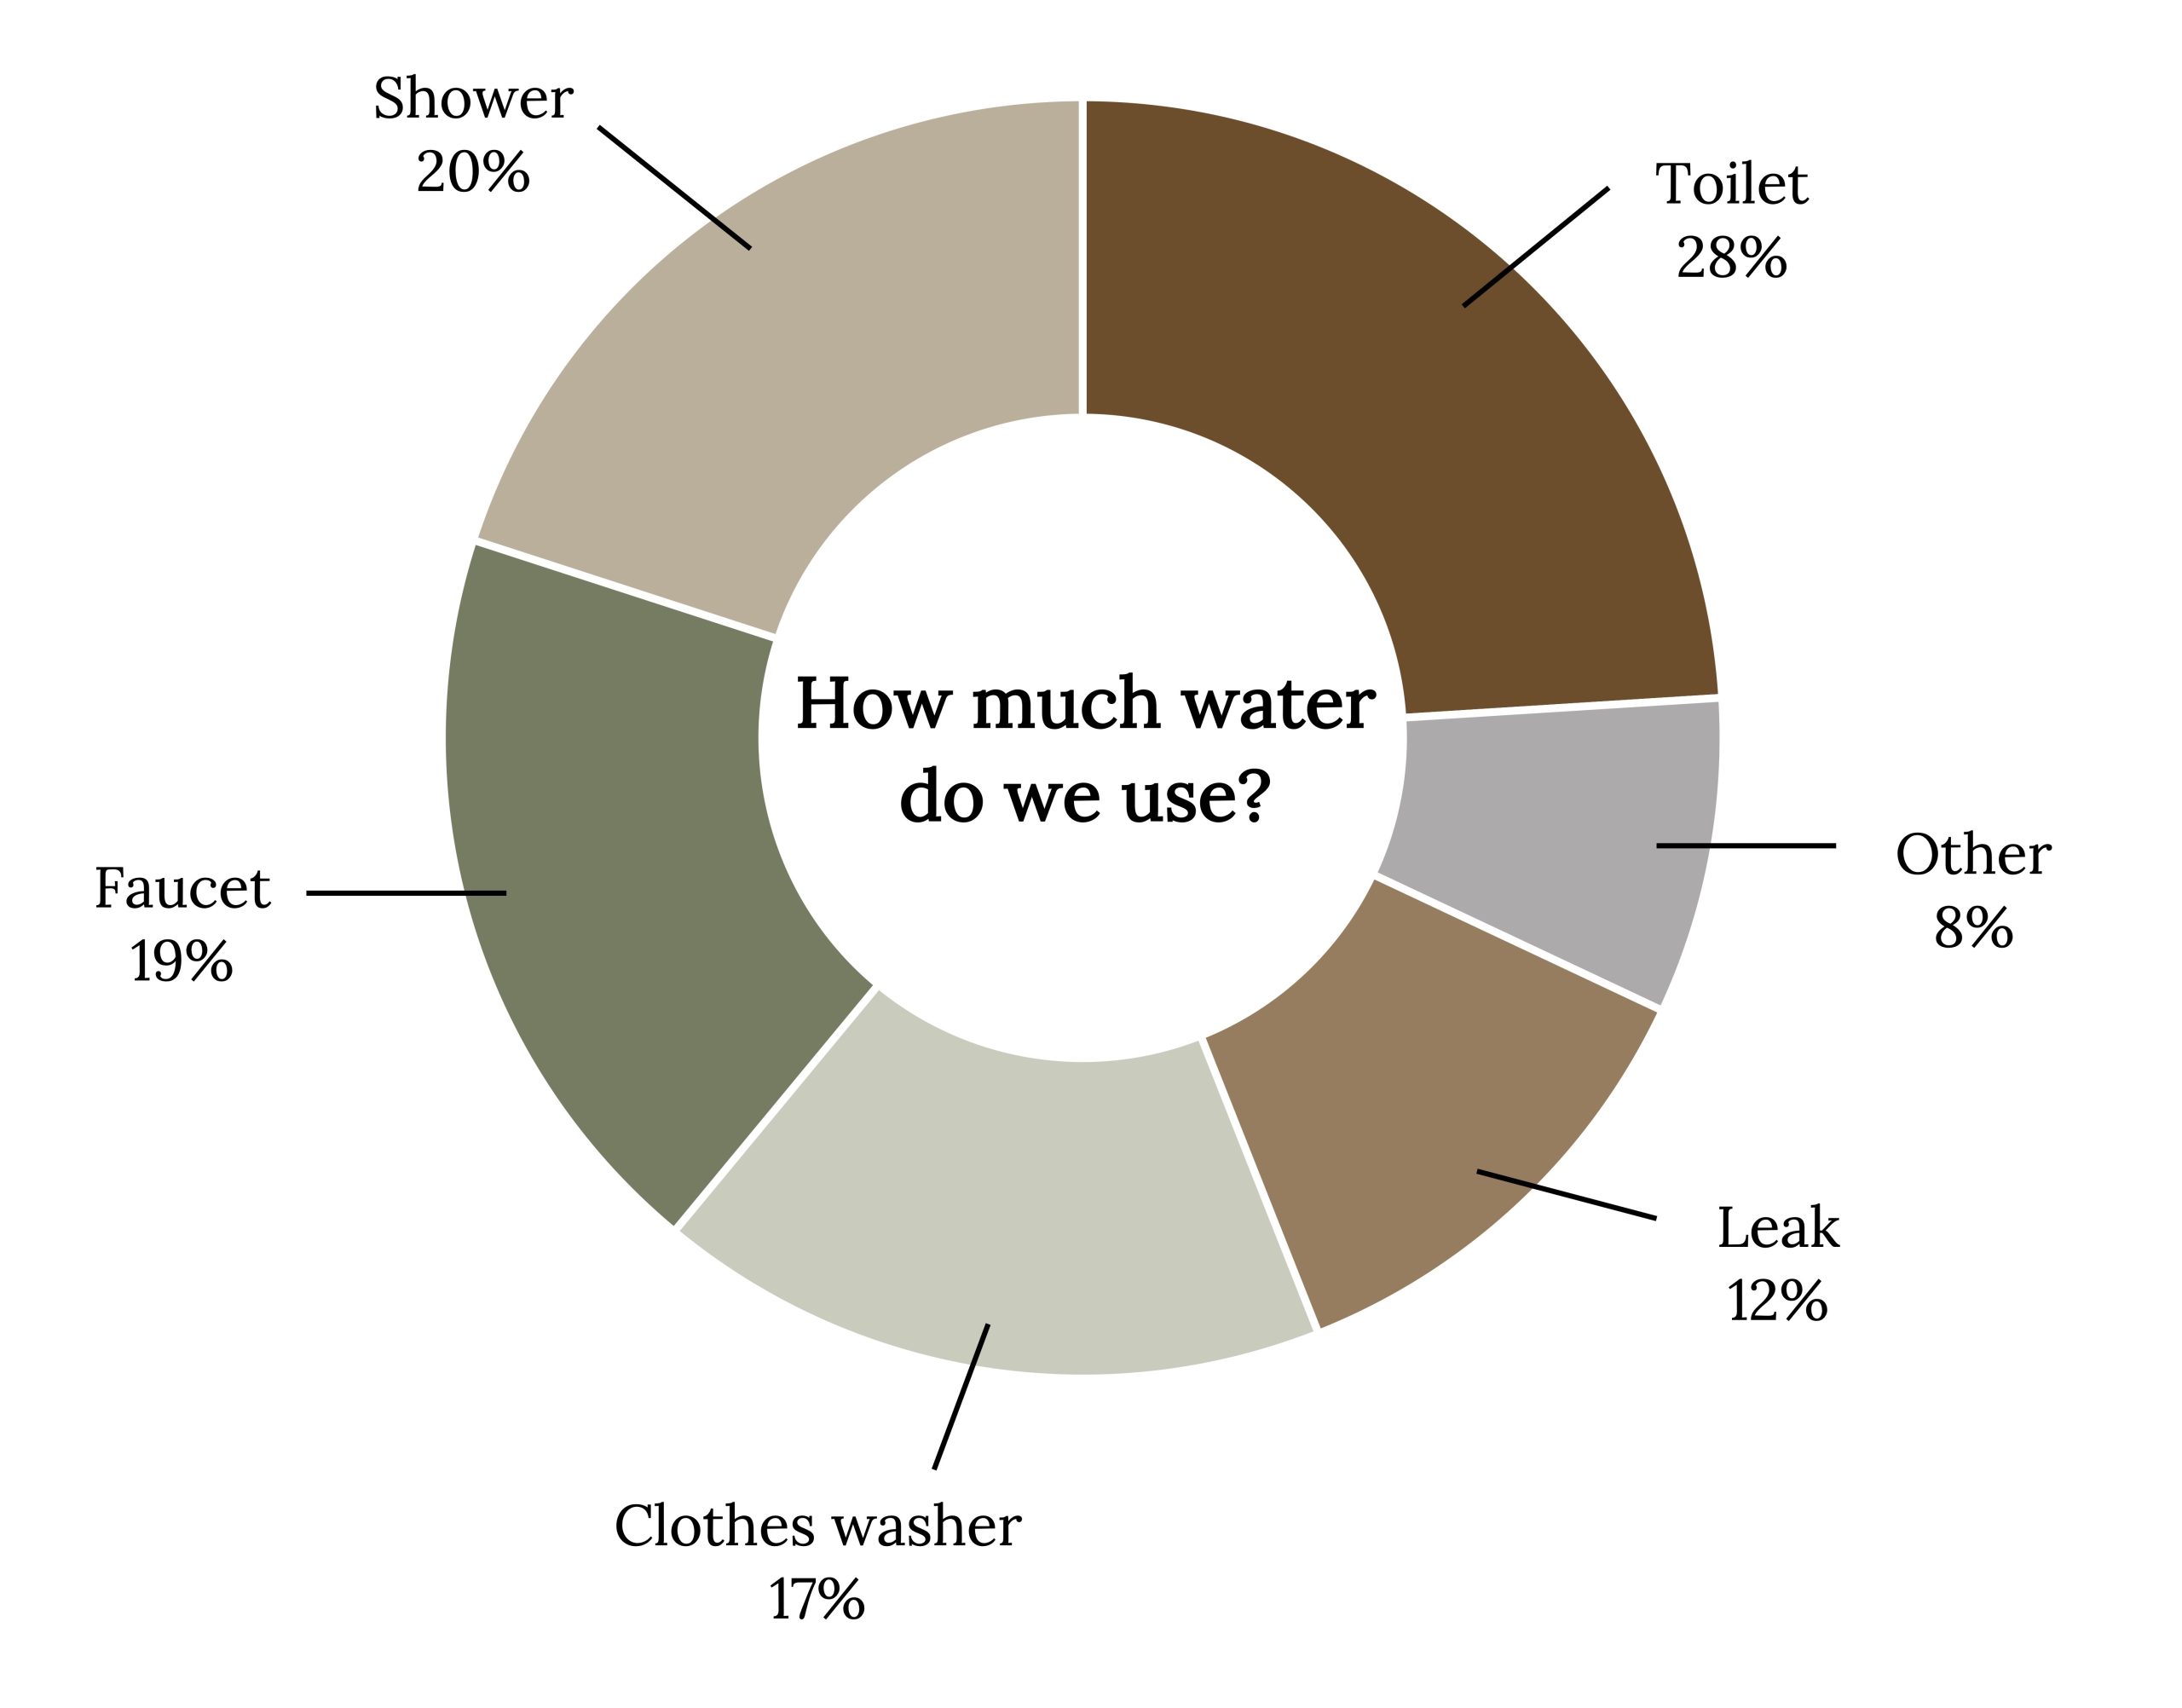
In 2015, approximately 12 percent of total water in the United States was withdrawn for public supply to domestic, industrial, commercial, and other users, and about 1 percent for self-supplied residences, for instance in well use (USGS, 2018). Figures 4.9 and 4.10 illustrate the end uses of water in office and residential buildings. Domestic/restroom use consumes the greatest percentage of water in office buildings, followed by cooling and heating, landscaping, and kitchen/dishwashing respectively. Toilets consume the greatest percentage of water in the residential setting, followed by showers, faucets, clothes washers, leaks, and other.
Just like energy efficiency, a water assessment is the first step to understanding a building’s water consumption. The items to evaluate during a water assessment include locating any water leaks, checking plumbing fixtures, and evaluating the working order of appliances, cooling and heating systems, and any irrigation systems. A best practice is to create a checklist that will assist in identifying and prioritizing water consumption reduction opportunities during the water assessment. The United States Environmental Protection Agency (EPA) offers a water assessment checklist template that can be found at: https://www.epa.gov/sites/default/files/2017-01/documents/ws-commercial-water-assessment-checklist.pdf. Also it is helpful to perform a water assessment on a regular basis to continually evaluate the property’s water consumption and identify potential strategies to reduce water consumption.
Water benchmarking is an important factor in a water assessment because it measures water consumption across the building and compares water use over time and across any properties in the company’s building portfolio. Benchmarking provides a baseline for water measurement and can be used to set future water consumption goals. ENERGY STAR Portfolio Manager can also be used to benchmark water use.
Recommendations are then put forward based on the water assessment. The establishment of a water management policy that includes water efficiency best management practices and water efficiency goals with associated target dates aids in the implementation of the recommendations. For example, a water efficiency best management practice can be to regularly schedule a walkthrough of all plumbing fixtures to identify any items that are not functioning properly and flag them for repair and put a target date for the repair.
These recommendations vary in the levels of upfront cost and subsequent savings during operations. For example, raising the blade on a lawn mower to allow the grass to grow longer and more drought-resistant is a no-cost recommendation with hard to quantify subsequent savings during operations. On the other hand, replacing all older toilets with low-flow flushing models will indeed have upfront costs but also have quantifiable utility cost savings once in operation. The next few paragraphs discuss some ideas to increase the water efficiency of major end uses at the building level.
Leaks
Leaks account for 12 percent of water use in the residential building sector. Therefore, regularly checking for leaks and repairing them promptly is important to the building’s overall water efficiency strategy. While some leaks are obvious, some are not so obvious. A visual inspection can detect drips from a faucet or water stains on a ceiling from a pipe leak. However, a leaking toilet may not be visible to the eye. An easy and almost no-cost method to check for leaks in a toilet is to put a couple of drops of food coloring in the toilet tank overnight, do not flush the toilet during this time, and see if the food coloring has seeped into the toilet bowl in the morning. If the food coloring has seeped into the toilet bowl, this confirms a leaky toilet that needs to be fixed.
Plumbing Fixtures and Valves

It is beneficial to regularly check plumbing fixtures and valves to ensure that they are still working properly and are clean. This includes faucets in the kitchen and bathrooms, and fixtures in the shower, bathtub, and toilet. A low-cost way to decrease water consumption is to install aerators on sinks if there is no aerator currently on the fixture. An aerator, illustrated in figure 4.11, screws into the faucet and adds air to the water which reduces the amount of water consumed while also controlling the stream of water. If it is an older plumbing fixture, replacement of the old aerator with a model that lowers the water flow rate will reduce water consumption. Another way to consume less water is to have the water pressure checked to make sure it is at the proper level for the fixture, that it is not too high. This also helps lengthen the life of the fixture. A more expensive way to decrease water consumption is to replace toilets and/or fixtures with WaterSense labeled models. WaterSense is a labeling program for water-efficient products sponsored by the EPA and includes products such as toilets, showerheads, bathroom faucets, and urinals.
Appliances
It is beneficial to regularly assess appliances such as clothes washers and dishwashers to ensure proper working order. Regular cleaning is important so that buildup does not occur that could make the appliance less efficient. Also, running them only when full reduces water consumption. As they reach the end of their lifecycle, new models that are more water efficient can be considered. ENERGY STAR certified clothes washers use approximately 1/3 less water than conventional clothes washers and certified dishwashers save on average 3,870 gallons of water over the lifetime of the appliance (ENERGY STAR, n.d.a; ENERGY STAR, n.d.b). A list of certified clothes washers and certified dishwashers can be found on the ENERGY STAR website.
Cooling and Heating
The amount of water used for the cooling and heating equipment in a commercial building is tied to the amount of energy used for the operation. Therefore, the implementation of energy efficient measures will also reduce the amount of water needed to operate these systems. Also, captured rainwater and air handler condensation can be used as an alternative to increase efficiency. Regular evaluation of the working order of these systems is important to ensure optimal efficiency.
Landscaping
There are various methods that can be employed to increase water efficiency for landscaping at a building site. The first method to consider is xeriscaping, which is using native drought-resistant plants at the property.
Example: Landscaping That Increases Water Efficiency
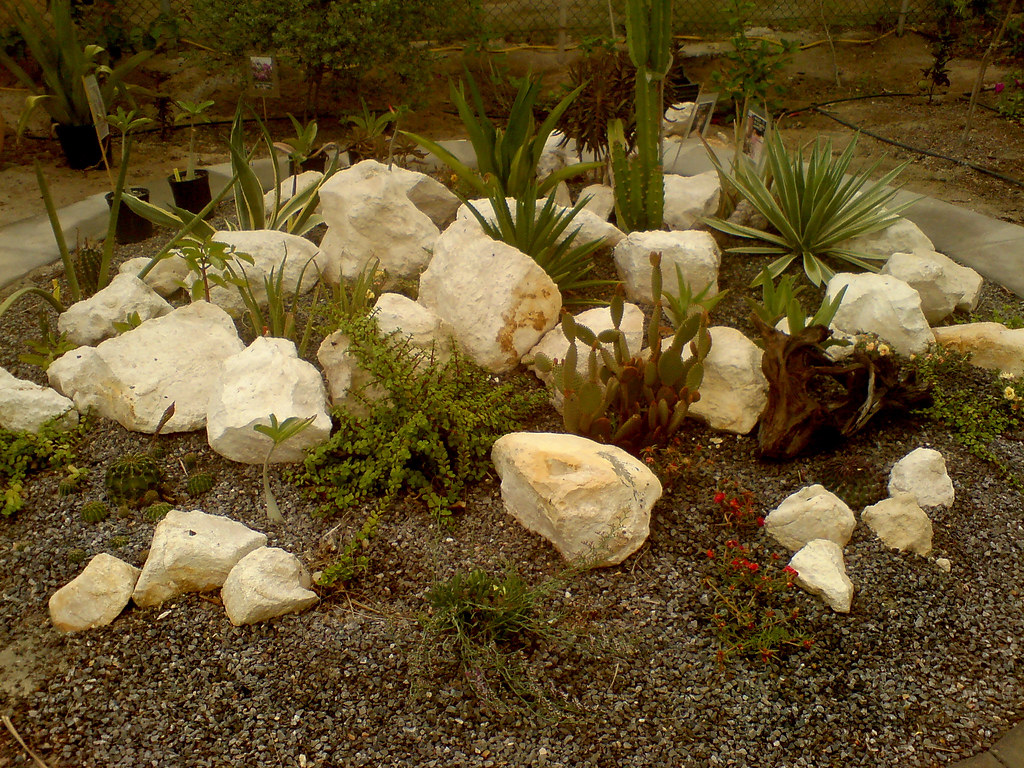
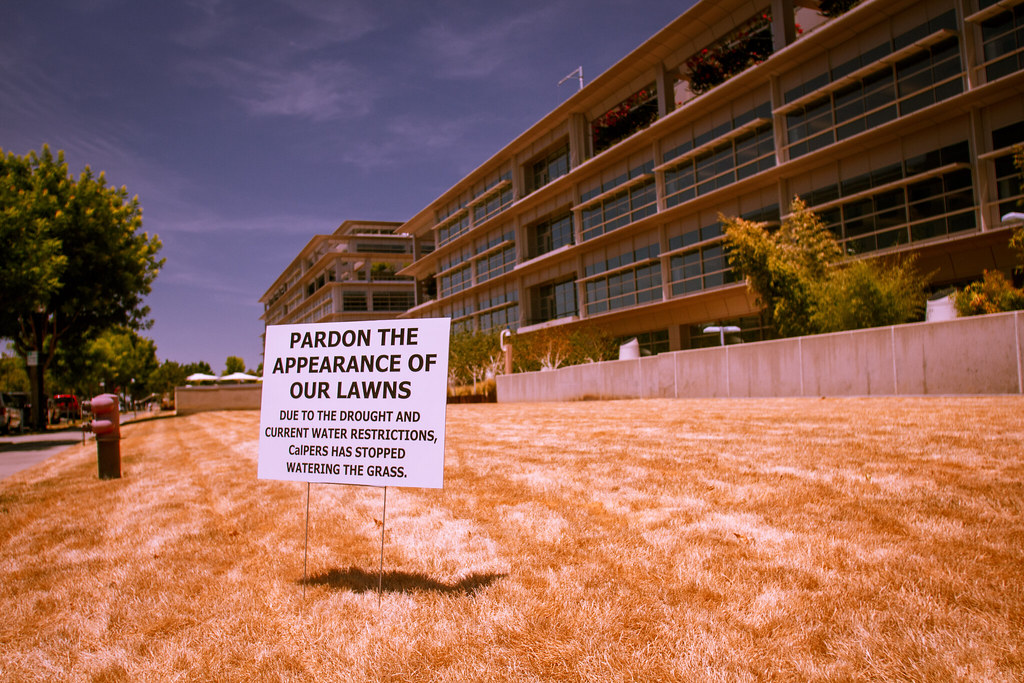
Figure 4.12 illustrates an example of a xeriscape garden which requires less watering than a traditional lawn. Alternatively, figure 4.13 depicts a brown lawn in California, a state that has grappled with droughts and associated water restrictions throughout the recent years. Although green grass paint for lawns is available for sale to make this brown lawn green, a long-term solution would be to transition to xeriscaping the grounds versus maintaining a lawn in places like California and the arid U.S. Southwest.
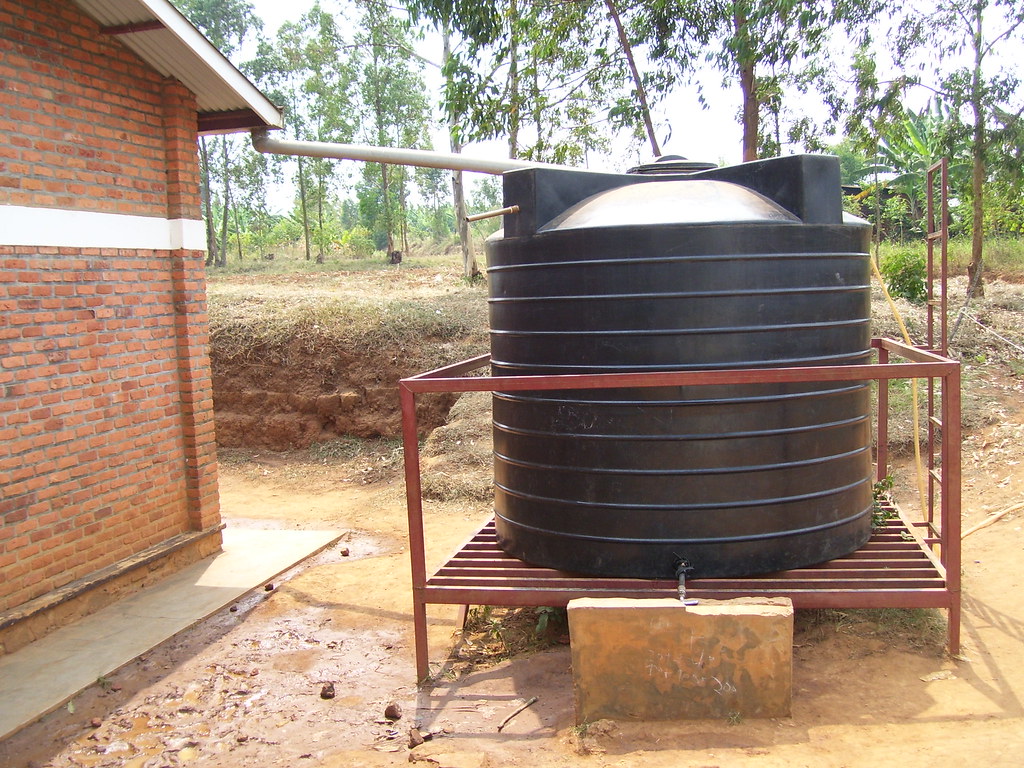
Irrigation systems are another area to examine when considering water efficiency. Drip irrigation systems are more water efficient than traditional sprinkler irrigation systems because they deliver water directly to the root zone of plants over a longer period of time. This method also helps prevent overwatering and reduces evaporation. Drip irrigation systems may work well in some landscape settings while also saving resources. Smart irrigation technology is another option that can be added to various types of irrigation systems; instead of a user-determined fixed schedule, a complete controller or a sensor added to an existing irrigation timer can use soil moisture data or weather data to determine when the landscape needs watering. Sensors that detect rain and moisture can also be an option added to different types of irrigation systems, versus running on a timer, which makes the irrigation system more efficient. Rainwater harvesting is another option to reduce water for irrigation. Rainwater harvesting involves the collection of rainwater runoff to a storage system, such as a tank that can be used later as illustrated in figure 4.14. Other non-potable uses for rainwater include activities such as watering gardens and flushing toilets. Regular inspection is important for any of these options to ensure proper and efficient functioning. Some states have legal restrictions on rainwater catchment, so property managers need to check with their local jurisdictions before implementing a rainwater harvesting program.
Section References
Bluefield Research. (2021, August 23). Up 43% over last decade, water rates rising faster than other household utility bills. https://www.bluefieldresearch.com/ns/up-43-over-last-decade-water-rates-rising-faster-than-other-household-utility-bills/
ENERGY STAR. (n.d.a). Clothes washers. https://www.energystar.gov/products/clothes_washers
ENERGY STAR. (n.d.b) Dishwashers. https://www.energystar.gov/products/dishwashers
USGS. (2018, June). Summary of estimated water use in the United States in 2015. https://pubs.usgs.gov/fs/2018/3035/fs20183035.pdf
De Olivia, A. (2021, June 30). Making water in a desert, from sunlight and air. CNN. https://amp.cnn.com/cnn/2021/06/30/middleeast/source-global-dubai-spc-intl/index.html
4.4 Indoor Environmental Quality (IEQ)
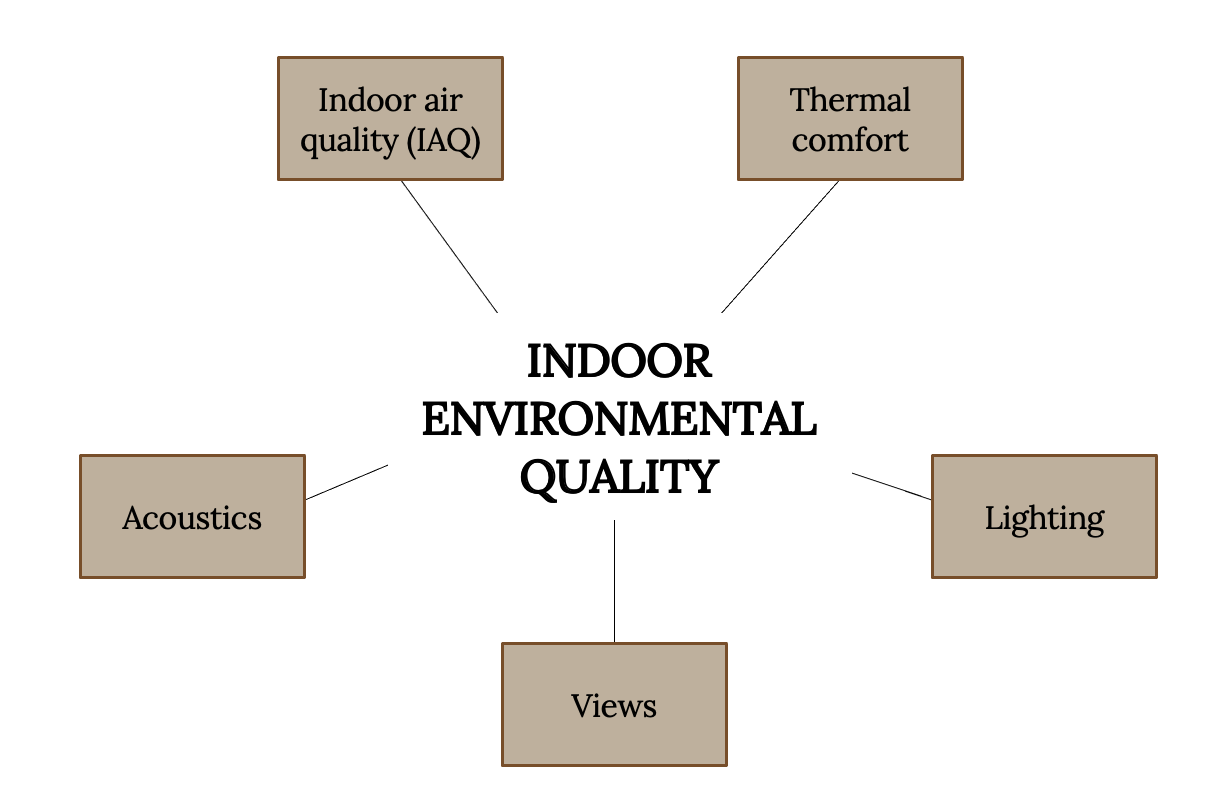
Indoor environmental quality encompasses indoor air quality (IAQ), acoustics, thermal comfort, lighting, and views from a building, as illustrated in figure 4.15. This section will cover these main components of IEQ and put forward ideas to increase IEQ throughout the building space.
IAQ
IAQ refers to the quality of the air within a building space. IAQ is an important consideration because some pollutant concentrations are higher indoors than outdoors. Furthermore, Americans on average spend approximately 90 percent of their time indoors (EPA, 2021). Pollutant source examples include tobacco smoke, volatile organic compounds (VOCs), cleaning supplies, building materials, mold, radon, and carbon monoxide. Sick building syndrome (SBS) occurs when contaminants and pollutants reach a certain level within the building and cause building occupants severe discomfort, including headaches, dizziness, fatigue, and/or irritation to the eyes, nose, or throat.
There are a variety of ways to reduce contaminants and pollutants throughout the building space. First and foremost, it is important to ensure there is proper ventilation within the building with adequate air exchange between indoor and outdoor air. Changing air filters as part of preventative maintenance can also help with IAQ. Regularly cleaned building entryways and floors help rid the building space from contaminants. A smoking policy that prohibits smoking inside the building and within a certain distance outside of the building can also be part of a building’s IAQ plan. Some office campuses and multifamily rental communities have prohibited smoking anywhere on site whether it be indoors or outdoors.
Volatile organic compounds (VOCs) are airborne chemicals that are emitted from many products such as paint, carpeting, furniture, office equipment, and cleaning supplies. VOCs can decrease the IAQ in a building and cause adverse health effects to building occupants. There are third-party certifications that help consumers limit their exposure to VOCs. GREENGUARD Certification, offered through global safety science company UL Solutions, is available for building materials, furniture, furnishings, electronic equipment, cleaning, and maintenance products. Prior to receiving GREENGUARD Certification, the product is tested for a plethora of chemicals and must meet the low emission level standard to receive the certification. Green Seal labels can be found on cleaning products that are safer and more ecologically friendly. One way to formalize using products with lower VOCs is to implement an environmentally preferable purchasing (EPP) program to secure products with reduced negative environmental impacts. Staples, a retail company specializing in the sale of office products, offers Staples® Sustainable Earth™ products that can be used for creating a sustainable purchasing guide for on-site staff that only lets them choose items from this line of products. For example, the only option would be to choose recycled copy paper versus virgin copy paper.
A pest control program is important at the building because it manages and mitigates adverse impacts on humans and buildings, reducing site damage from pests such as cockroaches, ants, bed bugs, spiders, and termites. Conventional pest management focuses on regular applications of pesticides to control pests in and around the building. Integrated pest management (IPM) is a more sustainable option that encompasses a more holistic strategy to lower the risks to people and the environment, and focuses on the building and the surrounding landscape areas as well. Rather than relying mainly on pesticide application to control pests, there are other steps that are first taken before pesticides are applied in a thoughtful manner. The first step is to create a threshold for pest populations that will be used to determine if pest control needs to be taken. Pests are then identified and monitored to see if they meet this threshold and if pest control is needed. Prevention is also a critical step in IPM to reduce the need for pesticides. For example, cleaning out food and drink containers before putting them in a recycle bin and sealing building cracks can help prevent pests. Once these steps are in place and pest control is deemed necessary, targeted chemicals are used first before general pesticides are sprayed widely. It is important to regularly evaluate the IPM program that is put into place and modify where necessary to improve the effectiveness of the program.
Acoustics
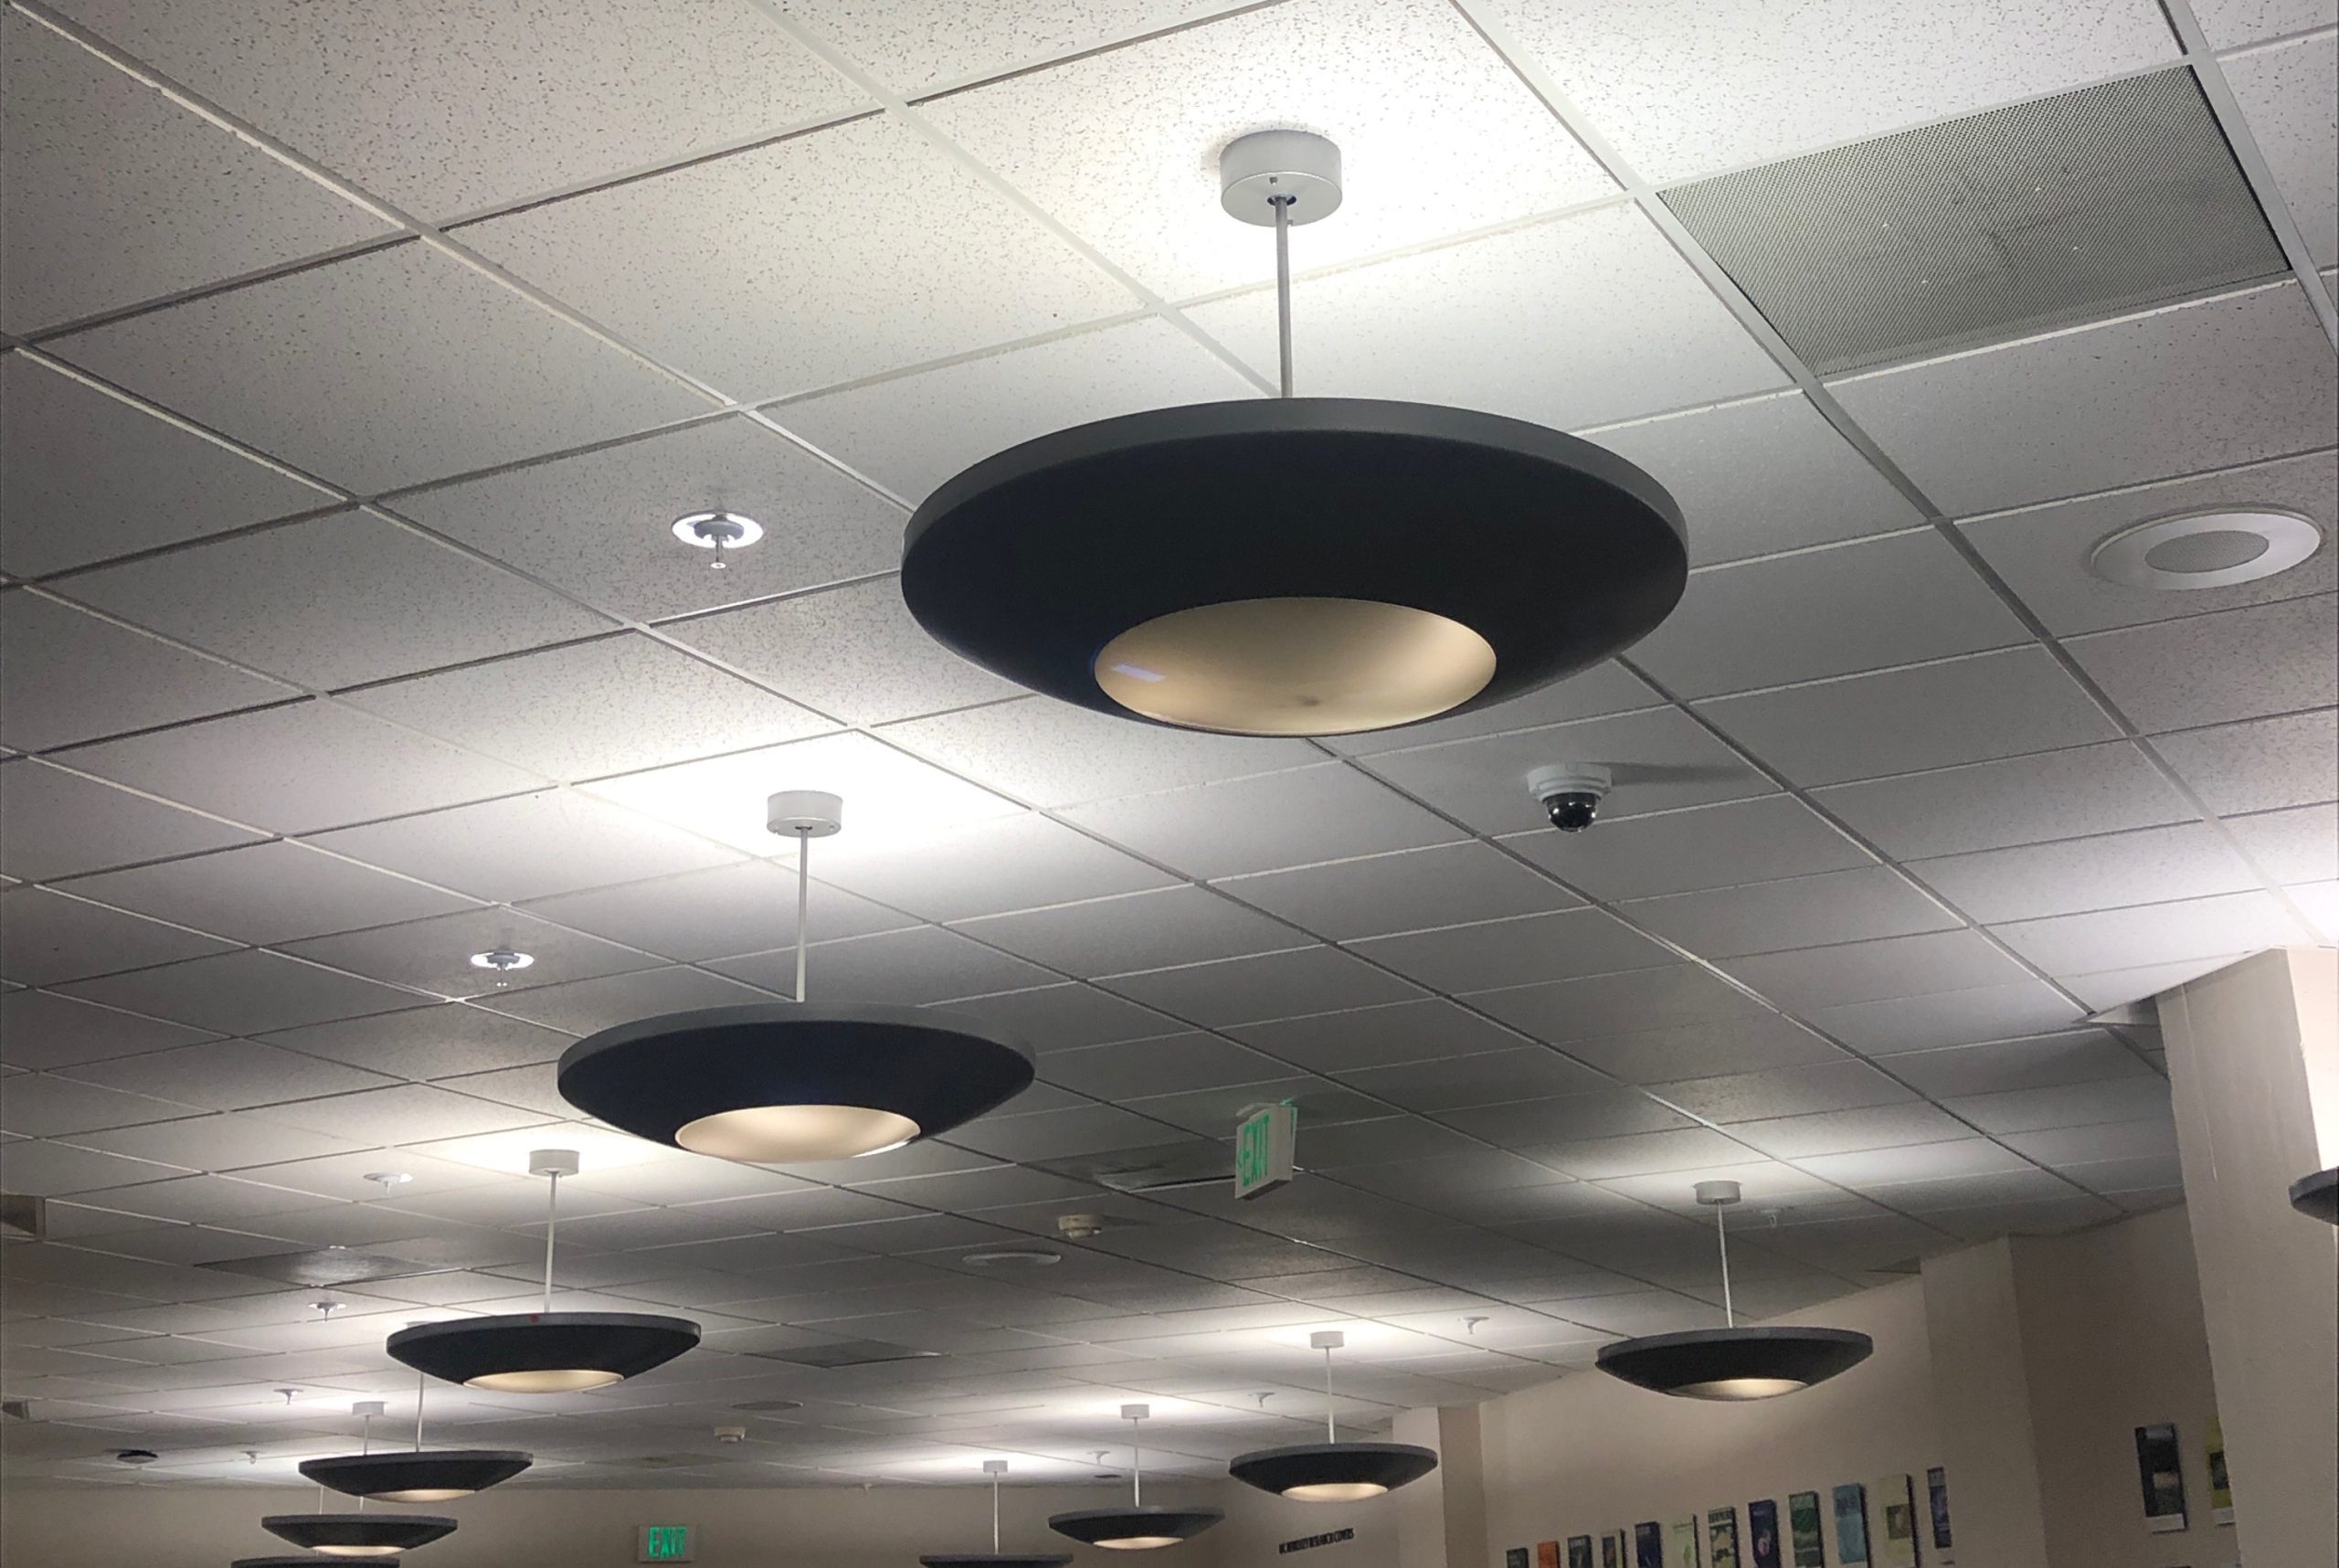
Building acoustics impact the performance of the building and the associated health and well-being of the building occupants. Effective building acoustics minimize the noise transmission from one building space to another while also controlling the sound within a specific building space. While building acoustic considerations are important to consider during the building design and construction phase of the lifecycle, there are some actions to consider during the operations phase of the building should building acoustics be an issue. The installation of acoustical ceiling tiles as pictured in figure 4.16, furniture, or spray-on acoustical treatments can improve building acoustics. Sound masking systems are another option that can help tune out background noise in office settings.
Thermal Comfort
Thermal comfort, the sense of whether a person feels too hot or too cold, is another consideration in the overall IEQ of a building. As with acoustics, thermal comfort considerations are important during building design and construction. Once the building is in operation, regular occupant surveys can provide information regarding the level of thermal comfort satisfaction. If there is a high level of thermal comfort dissatisfaction, examination and adjustment of the HVAC system’s air speed, moisture level, and air temperature can help address this dissatisfaction. Additionally, in an office setting, fans can be placed near individual workstations so that building occupants have more control over their immediate environment. It should be noted that there is often difficulty in balancing the social and ecological sustainability spheres within the thermal comfort context, because people can be legitimately uncomfortable as a result of many greening initiatives that attempt to regulate temperature without a heavy reliance on air-conditioning.
Lighting
Building space is illuminated by natural and artificial light sources. These sources affect the building occupants’ circadian rhythms with bright light fostering a feeling of alertness while soft light cultivates a feeling of relaxation. Lighting can also affect energy efficiency. It is important that the goal of each building space be considered when deciding on lighting choices. When possible, access to natural light is best for the health and well-being of the building occupants. Daylighting is a technique that allows natural light into the building space and reduces the energy load requirements for lighting, resulting in reduced lighting costs and ecological impacts. Building light shelves, which are placed above eye-level, maximize daylighting by directing light onto the building ceiling and deep into the building while also reducing heat and glare. The tradeoff is that the addition of internal glass leads to a more expensive tenant build-out and has a significant impact on upfront costs. These considerations highlight the difficulty that sometimes arises in balancing the three spheres of sustainability. In an office context, daylighting techniques combined with artificial task lighting at workspaces can be an efficient mix of both natural and artificial light sources.
Views
Access to views of the outdoors from building spaces cultivates health and well-being for building occupants. Biophilia, the human condition of seeking connection with nature and other living beings, can be maximized in building views to increase cognitive performance and reduce stress levels. Premiums are regularly charged for a city view, mountain view, or water view. While the building orientation is decided upon during design and construction, during the operations and maintenance building lifecycle phase, indoor configurations of furnishings and fixtures can be considered to maximize views of the outdoors.
Section Video
Particles in your indoor air and strategies to improve indoor air quality
[00:01:15] U.S. EPA. https://youtu.be/JZx_mRTpSts
Section Reference
EPA. (2021). Report on the environment: Indoor air quality. https://www.epa.gov/report-environment/indoor-air-quality#:~:text=Americans%2C%20on%20average%2C%20spend%20approximately,higher%20than%20typical%20outdoor%20concentrations.
4.5 Waste Management
Waste management is an important consideration in the building operation and maintenance plan. The first step in establishing a waste management program is a waste stream audit. While not the most glamorous job, it assists in identifying the type and amount of waste in the building’s waste stream. The ENERGY STAR® Portfolio Manager® tool can be used for tracking and measuring this waste. The results of this audit provide a baseline that can be used to set future waste diversion goals.
The waste diversion rate is the amount of waste that is diverted from landfills through recycling and source reduction activities. The less waste produced within a building, the less amount of times the waste management provider needs to provide trash haul away service. This saves on the number of trash container pulls and associated costs for these services. Furthermore, this puts less strain on the ecological environment. Total Resource Use and Efficiency (TRUE) project certification, a rating system that complements LEED project certification, can also assist with waste management goals. To receive TRUE certification, a building must have a zero-waste policy in place and divert a minimum of 90 percent of waste from landfills, incinerators or the environment for twelve months. An individual can obtain a TRUE Advisor certification and advocate for the TRUE building certification by adopting a holistic waste strategy that focuses on the product lifecycle in its entirety and on the reduction, reuse, and recycling of products.

Figure 4.17 illustrates a symbol that is commonly used in recycling campaigns. The words associated with these arrows are reduce, reuse, and recycle. The first word in this signage is reduce, but the main focus is commonly on recycling. The word reduce is first in the motto and is the most resource efficient. Reusing is the second most resource efficient option, followed by recycling. Therefore, it is not just about the waste diversion rate, but also the waste generation rate. However, this concept can be difficult to implement in hyperconsumerism societies such as the United States.
Section Videos
How Much Plastic is in the Ocean?
[00:04:59] Be Smart. https://youtu.be/YFZS3Vh4lfI
Adidas x Parley—A Mission for our Oceans
[00:01:06] https://youtu.be/ogNWB0XlOo8
Case Study: “Swap Room”—Recycling Unwanted Goods in an Apartment Complex
[00:01:45] Green Strata. https://youtu.be/gCqX3wTNJ9M
How Garbage is Recycled at the US’ Largest Recycling Facility
[00:03:30] Insider. https://youtu.be/L2Rc8oTOtd8
4.6 Site Sustainability
Many site sustainability options should be considered during the building design and construction process. For example, an undeveloped site, or greenfield, may be the target for a new building with sustainable features. Let’s also assume it is far from amenities and public transportation, so a car is necessary for all trips. While the building may contain many sustainable features, the building site as a whole causes a relatively high amount of site ecology destruction and greenhouse gas emissions through car dependence. Conversely, a previously developed site, or brownfield, may be the target for a conventional building. Let’s also assume it is in an urban area close to amenities that are walkable, such as shopping, work, and entertainment. While the building may not contain many sustainable features, the location of the site makes it a sustainable site. There are cost implications to both infill/redevelopment sites and greenfield sites that also affect site selection decisions and must be balanced with a green/environmental agenda in the context of the project budget and lending realities.
Of course, when acquiring an existing building, this choice has already been made. But there are still site sustainability options during the operations and maintenance building lifecycle phase. Site sustainability considerations such as landscaping and rainwater management considerations were discussed above, but there are more options to consider.
Transportation options are an important site sustainability consideration. Thinking through modes of available transportation can increase site sustainability. Options include walking, biking, public transportation, carpooling, or driving alone to the site. While there are limitations based on the building’s location relative to the existing landscape, there are still possibilities to increase sustainability through transportation to the site. For example, if an office site is in a rural location that is car dependent, tenant incentives can be put into place to incentivize carpooling. Virginia Tech offers this type of incentive by offering a parking pass for carpoolers that is less expensive than a parking pass for a single driver. This can reduce emissions and fuel consumption as well as costs for building occupants.
Paving options and roof considerations are also important to site sustainability. Pavement and rooftops contribute to the heat island effect and stormwater runoff. The heat island effect occurs in urban areas where structures like buildings and parking lots absorb and re-emit more heat from the sun than natural surfaces and create higher temperatures than in more rural areas. Stormwater runoff increases when impermeable surfaces increase, like parking lots, driveways, sidewalks, and roofs. Highly reflective, light colored, porous materials can be used for sidewalks to reduce the heat island effect and stormwater runoff. A lighter roof can help reduce the heat island effect and adding some type of vegetated roof can decrease stormwater runoff. These are options to consider when paving needs to be done and the roof needs to be replaced during the operations phase of the building lifecycle.
Light pollution is also a site sustainability consideration. Light pollution occurs when artificial light is used excessively or inappropriately at night. Figure 4.18 illustrates an example of light pollution with glare, skyglow, light trespass, and clutter (See https://www.darksky.org/light-pollution/ for more information on light pollution and these components). Furthermore, light pollution increases GHG in the atmosphere and disrupts human and wildlife patterns. While artificial light is necessary at night for illumination and safety, appropriate use of it is an important consideration. Figure 4.19 illustrates a photograph taken with and without a light pollution filter that reduces the transmission of light to illustrate the appropriate use of artificial light at night. Therefore, light pollution reduction is an important consideration when replacing lighting at a property during the operations phase of the building lifecycle.

Section Video
The Kandi Machine—China’s Sweet Pollution Solution
[00:08:34] Aaron Rockett. https://youtu.be/fiEJPbxL2hI
4.7 Conclusion
There are a variety of opportunities to implement sustainable practices into the maintenance and repair functions during the operations phase of the building lifecycle. While this chapter focuses on making the property more efficient, the human stakeholders are the decision makers of these sustainable initiatives and as such the building maintenance and repair functions remain a human-centered process. Regular property performance evaluation and sustainable implementation solutions holistically improve sustainability by saving both building owners and building tenants money, mitigating negative ecological externalities, and providing a nice place for building occupants. While some sustainable initiatives discussed in this chapter are relatively low-cost, some are expensive and cost is a significant barrier. Financial concepts related to sustainable property management will be further discussed in chapter 7.
Discussion Questions
- Make a list of buildings you regularly spend your time in (i.e., residence, workspace, classroom, gym, etc.).
- Are any of these building spaces without access to natural light? How does it make you feel?
- Think about how artificial light compares to natural light throughout day and night. How does it make you feel?
- Do any of these building spaces have views? If so, what is the view of and what feelings do these building views cultivate?
- Think about buildings you have been in or buildings you have seen in pictures. What is one of your favorite building views and why? How does the view make you feel?
- What is your key takeaway from this chapter? In which section did you find it?
Activities
- Read the article titled, “Proposal Seeks to Dim NYC Skyline at Night to Save Energy” at the link below: https://apnews.com/general-news-614df51847d34a0bb8fd3e15e4604f70
Read the webpage: https://www.darksky.org/light-pollution/. Based on these readings, what are the pros and cons of the proposal to dim the New York City skyline at night? - Find two examples of biophilic design within a building space.
- Share pictures of each biophilic design and source of the picture.
- List the specific features that incorporate biophilic design principles.
- Share what feelings are invoked within you when looking at these biophilic design examples.
Figure References
Figure 4.1: Electricity use in U.S. commercial buildings by major end use (2018). Kindred Grey. (2023). Data from Forms EIA-871A and E of the 2018 Commercial Buildings Energy Consumption Survey. (2022, December). U.S. Energy Information Administration. (http://www.eia.gov/
Figure 4.2: Residential site electricity consumption by end use (2015). Kindred Grey. (2023). Data from Use of energy explained: Energy use in homes. (2019, May 9). U.S. Energy Information Administration. (https://www.eia.gov/energyexplained/use-of-energy/electricity-use-in-homes.php). CC BY 4.0
Figure 4.3: Blower door test illustration. Jim Duncan. (2012). Getting ready for the blower door test. https://flic.kr/p/bu6yBq. CC BY-NC-SA 2.0
Figure 4.4: Thermographic inspection illustration. Thomas Quesnel. (2019). Infrared thermographic home inspections. Public domain. https://flic.kr/p/2gfwQGN
Figure 4.5: Incandescent light bulb illustration. Anton Fomkin. (2008). The incandescent light bulb. https://flic.kr/p/5D9eEk. CC BY 2.0
Figure 4.6: CFL light bulb illustration. MattysFlicks. (2013). Accidental lighting. https://flic.kr/p/fTvigP. CC BY 2.0
Figure 4.7: LED light bulb illustration. Theron Trowbridge. (2010). Toshiba LED light bulbs. https://flic.kr/p/7uePo4. CC BY-NC 2.0
Figure 4.8: Outlet with shut-off switch illustration. ben_osteen. (2010). USB wall socket. https://flic.kr/p/7sGzLT. CC BY 2.0
Figure 4.9: Water use in U.S. office buildings by major end use. Kindred Grey. (2023). Data from Saving water in office buildings. (2012, November). U.S. Environmental Protection Agency. (https://www.epa.gov/sites/default/files/2017-01/documents/ws-commercial-factsheet-offices.pdf). CC BY 4.0
Figure 4.10: Water use in U.S. residential buildings by major end use. Kindred Grey. (2023). Data from Data and information used by WaterSense. (2022, August 29). U.S. Environmental Protection Agency. (https://www.epa.gov/watersense/data-and-information-used-watersense). CC BY 4.0
Figure 4.11: Faucet aerator illustration. HomeSpot HQ. (2011). Faucet aerator. https://flic.kr/p/e3oDtt. CC BY 2.0
Figure 4.12: Xeriscape garden example. Mahmood Al-Yousif. (2008). Xeriscape garden. https://flic.kr/p/4G38Hp. CC BY-NC-ND 2.0
Figure 4.13: California brown lawn example. Kevin Cortopassi. (2014). CaIPERS and the drought. https://flic.kr/p/o4QuhC. CC BY-ND 2.0
Figure 4.14: Rainwater harvesting storage tank example. SuSanA Secretariat. (2011). Rainwater harvesting tank. https://flic.kr/p/a7AMjt. CC BY 2.0
Figure 4.15: Main IEQ components. Kindred Grey. (2023). CC BY 4.0
Figure 4.16: Acoustic ceiling tiles example. Melinda Young Stewart. (2019). Hanging lamps. https://flic.kr/p/2dXPSn3. CC BY-NC-ND 2.0
Figure 4.17: Example of a reduce, reuse, recycle symbol. Steve Snodgrass. (2011). Reduce, reuse, recycle. https://flic.kr/p/9sgWLi. CC BY 2.0
Figure 4.18: Light pollution example. makelessnoise. (2006). Make light pollution illegal. https://flic.kr/p/aSYGq. CC BY 2.0
Figure 4.19: Light pollution reduction example. Fernando Vega. (2019). IMG_3856 Light pollution filter. https://flic.kr/p/2gfFgth. CC BY-NC-SA 2.0
Image Descriptions
Figure 4.1: Vertical bar chart showing electricity use in commercial buildings by major end uses (2018). Y-axis shows Kilowatt Hours in billions, x-axis shows major end uses. Ventilation: 18%, lighting: 17%, cooling: 14%, refrigeration: 9%, computing: 7%, space heating: 6%, cooking: 2%, water heating: 2%, office equipment: 1%, all other (includes motor, pumps, air compressors, process equipment, backup electricity generation, and miscellaneous appliances, and plug-loads): 24%. Return to figure 4.1.
Figure 4.2: Horizontal bar chart showing residential site electricity consumption by end use (2015). X-axis shows percent of total end use, y-axis shows end uses. Air conditioning: 17%, space heating: 15%, water heating: 13.8%, lighting: 10%, refrigerators: 7%, TVs and related: 7%, clothes dryers: 4%, ceiling fans: 2%, air handlers for heating: 2%, separate freezers: 2%, cooking: 2%, dehumidifiers: 1%, microwaves: 1%, pool pumps: 1%, air handlers for cooling: 1%, humidifiers: 0.5%, dishwashers: 0.5%, clothes washers: 0.5%, hot tub heaters: 0.5%, evaporative coolers: 0.5%, hot tub pumps: 0.5%, all other miscellaneous: 13%. Return to figure 4.2.
Figure 4.3: Red fabric door with a fan in the middle replaces a standard front door. The door is attached to a computer system that measures air tightness of buildings. Return to figure 4.3.
Figure 4.9: Pie chart showing end uses of water in office buildings. Kitchen/dishwashing: 13%, landscaping: 22%, cooling and heating: 28%, domestic/restroom: 37%. Return to figure 4.9.
Figure 4.13: A field of dead grass outside of an office building. A sign in the grass reads “Pardon the appearance of our lawns. Due to the drought and current water restrictions, CalPERS has stopped watering the grass.” Return to figure 4.13.
Figure 4.19: Big picture: city skyline with a few buildings lit up at night. Sky is pitch black and clear. Small picture: Same skyline with many buildings lit up at night. Sky is light and cloudy. Return to figure 4.19.
An energy source that will eventually run out, such as fossil fuels
Buildings that consume as much energy as they produce
Buildings that consume less energy than they produce
An assessment of energy use and efficiency within the property
Renewable energy metering that provides a renewable energy certificate (REC) from a public-utility provider for power generated but not used by the building, power which can then be sold to others or used as a credit against the building’s energy usage
Water that is of drinking quality
Water that is not of drinking quality
A product that screws into a faucet and adds air to the water; this reduces the amount of water consumed while also controlling the stream of water
A labeling program for water-efficient products sponsored by the EPA
Using native drought-resistant plants
Systems that supply water to land through artificial methods
An irrigation method that can save water and fertilizer by applying water directly to the root zone either on or below the soil surface through artificial methods
Technology that uses soil moisture sensors or weather data to determine irrigation needs
The collection of rainwater runoff to a storage system, such as a tank, that can be used later
Indoor environmental quality that encompasses indoor air quality, acoustics, thermal comfort, lighting, and views from a building
The quality of the air within a building space
When contaminants and pollutants reach a certain level within the building and cause building occupants severe discomfort including headaches, dizziness, fatigue, and/or irritation to the eyes, nose, or throat
Airborne chemicals that are emitted from many products such as paint, carpeting, furniture, office equipment, and cleaning supplies
A pest control program that encompasses a more holistic strategy to lower the risks to people and the environment and focuses on the building and the surrounding landscape areas
The control of sound in a building
The sense of whether a person feels too hot or too cold
A technique that allows natural light into the building space and reduces the energy load requirements for lighting
The human condition of seeking connection with nature and other living beings
A strategy implemented at the property for waste disposal, reduction, reuse, and prevention
A third-party zero waste certification
When structures like buildings and parking lots absorb and re-emit more heat from the sun than natural surfaces and create higher temperatures
Rain and snowmelt that does not soak into the ground
When artificial light is used excessively or inappropriately at night
