7 Financial Evaluation of Sustainable Building Initiatives
Chapter Contents
7.1 Introduction
7.2 Statement of Cash Flow and Sustainable Property Management
7.3 Cash-on-Cash Return Analysis
7.6 Conclusion
Learning Objectives
- Explain how sustainable property management initiatives affect the property statement of cash flow
- Calculate the cash-on-cash return for sustainable initiatives
- Calculate the simple payback period for sustainable initiatives
- Calculate the discounted payback period for sustainable initiatives
- Calculate a cost-benefit analysis for sustainable initiatives
7.1 Introduction
Previous chapters discussed the social, environmental, and economic spheres of sustainable property management. This chapter takes a closer look at the economic sphere of sustainability. It introduces calculations to determine if a sustainable building initiative makes financial sense. There are multiple metrics within the accounting and finance function to account for sustainable initiatives. These include the calculation of net operating income (NOI), before-tax cash flow, cash-on-cash return, payback period, and cost-benefit analysis. Some impacts of sustainable building initiatives are difficult to monetize, such as the cost of carbon, an employee wellness initiative, or the enjoyment of building users from using power generated from renewable energy sources. However, sustainable property management initiatives will impact the economic condition at the property. As the overarching goal of a property manager is to increase property NOI, it is important to consider the associated economic impacts of sustainable initiatives at the property.
7.2 Statement of Cash Flow and Sustainable Property Management
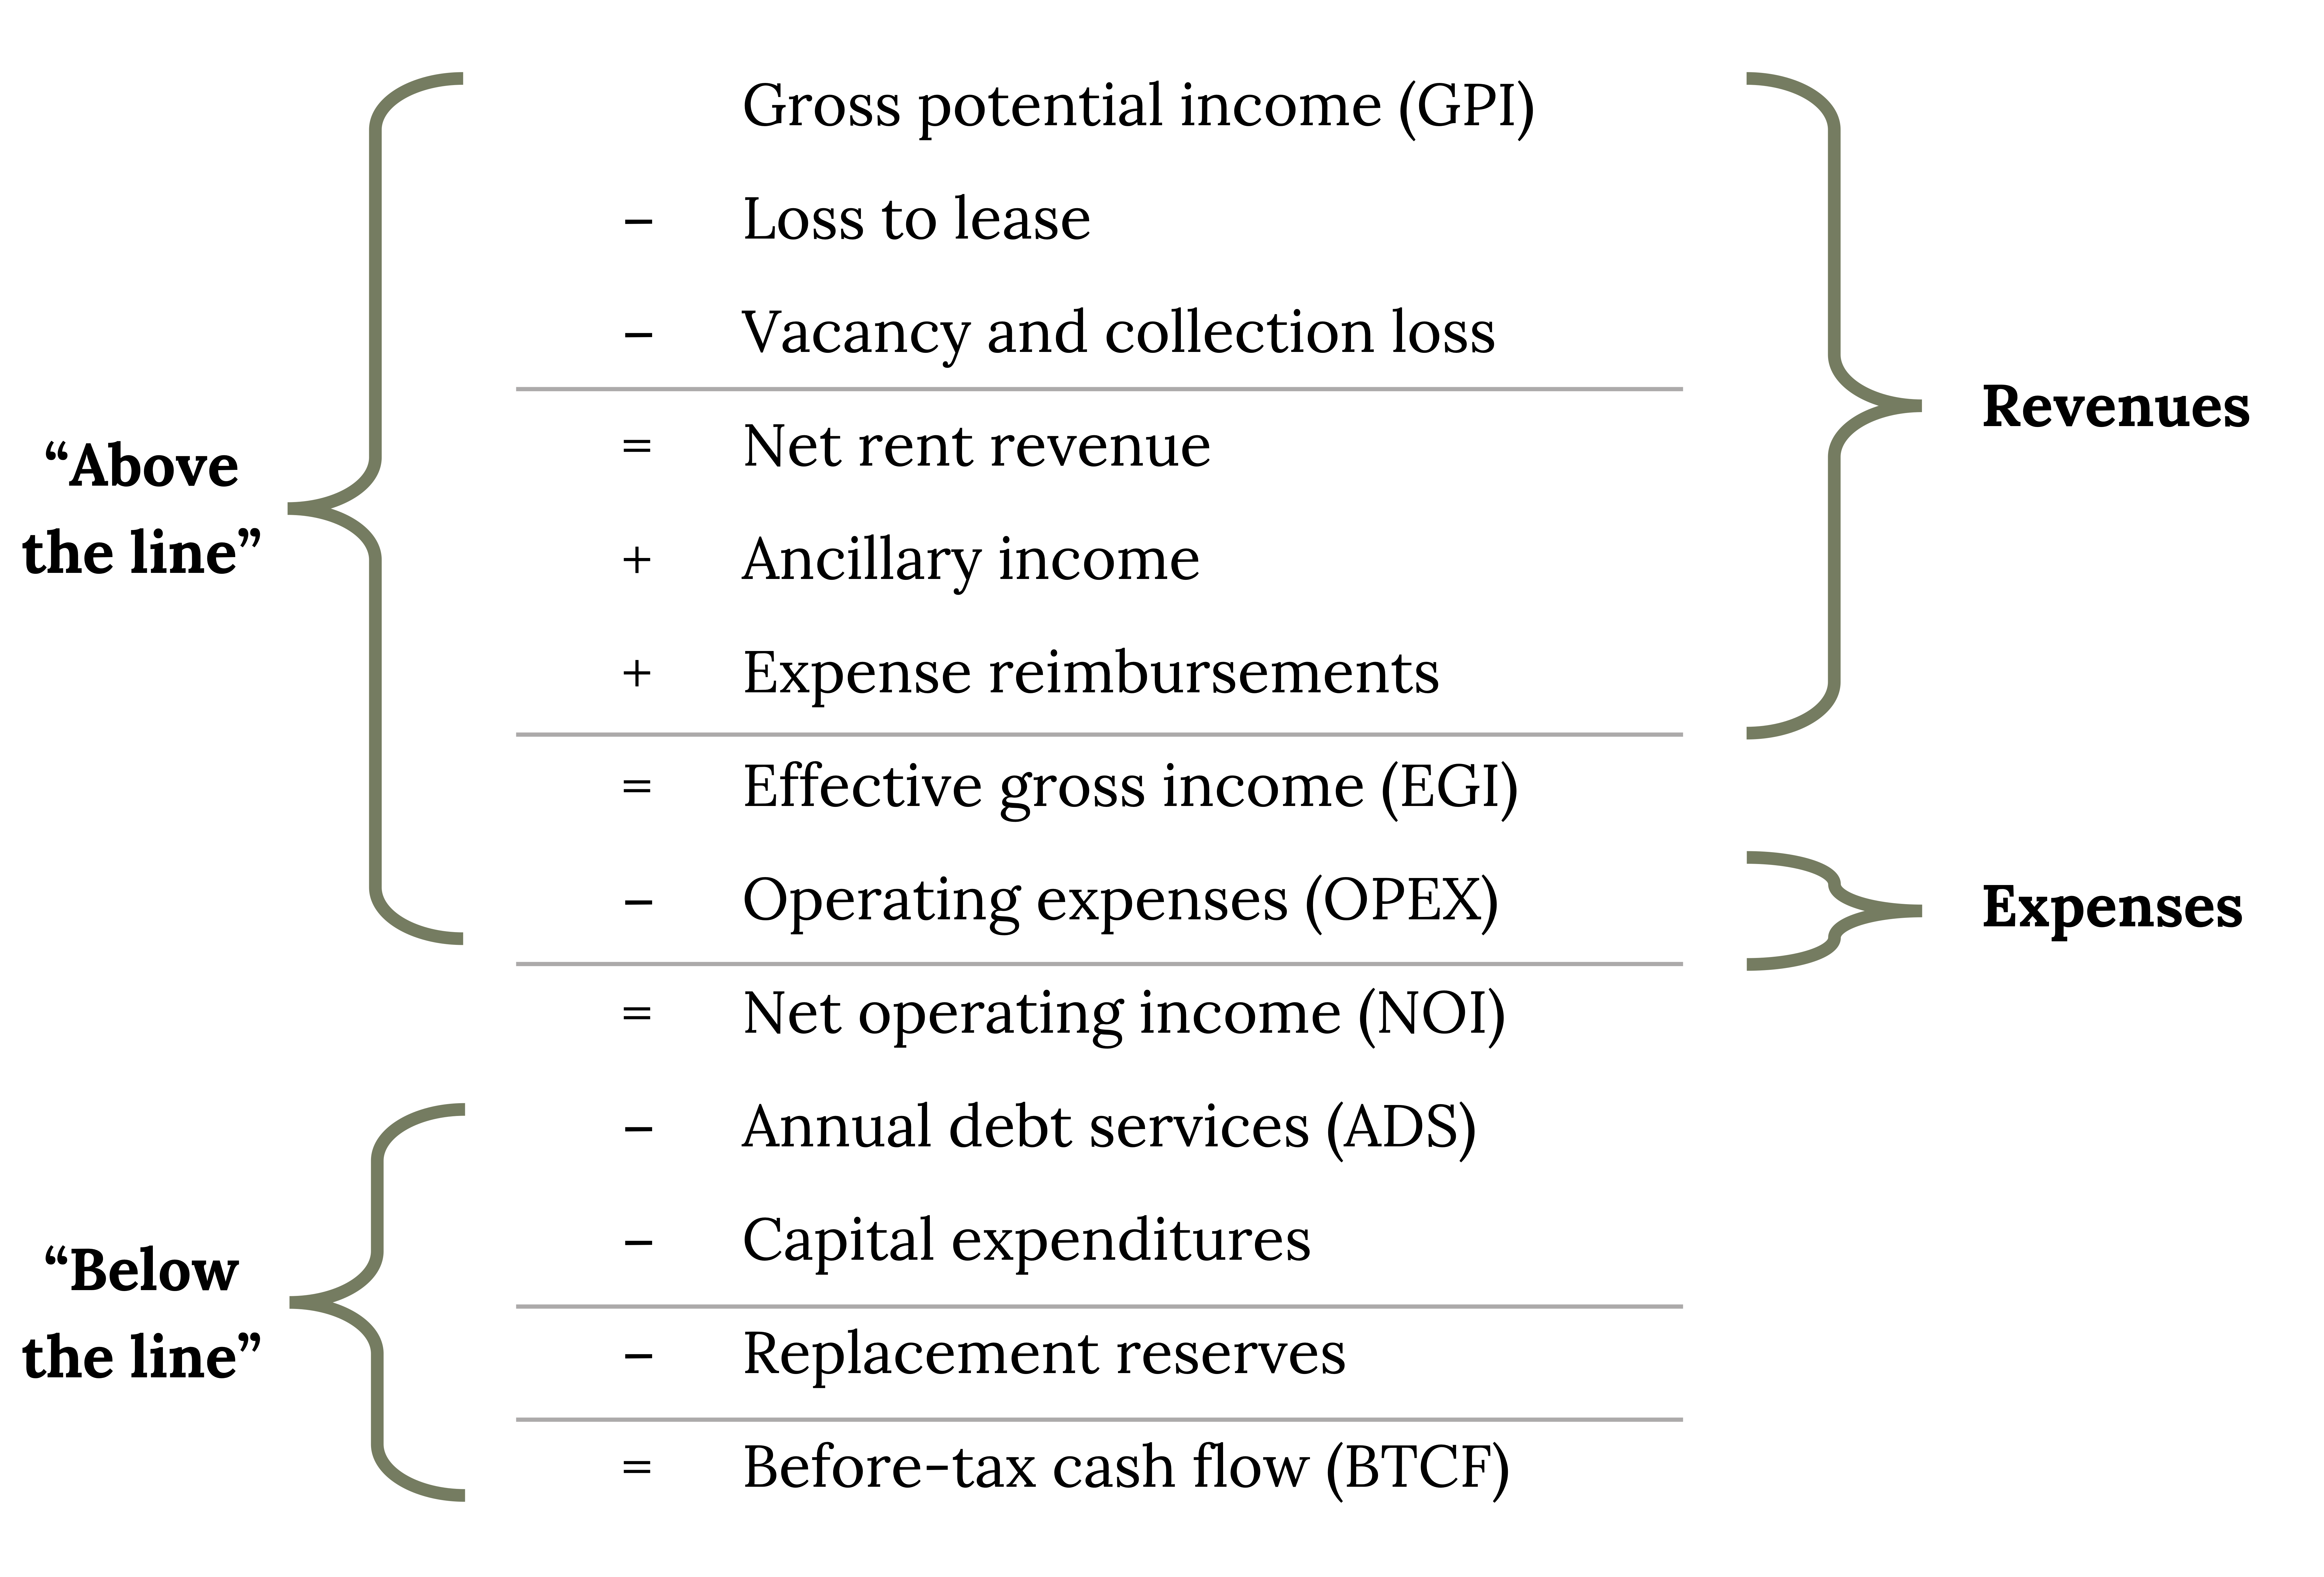
It is crucial for the property manager to understand how to evaluate each line item of a cash flow statement. This financial literacy aids in understanding the financial impacts of various sustainable property management initiatives. The property cash flow statement is broken into “above the line” categories and “below the line” categories. “Above the line” categories refer to categories above the NOI line item and “below the line” refers to categories below the NOI line item. Figure 7.1 illustrates an example of a property statement of cash flows. The revenue category includes all line items down to effective gross income (EGI). The operating expenses (OPEX) category is below the revenue category, and the list below figure 7.1 illustrates common operating expense line items.
Common operating expense line items:
- Legal
- Maintenance and Repairs
- Management Fee
- Marketing
- Payroll
- Property Insurance
- Real Estate Taxes
- Supplies
- Telephone & Internet
- Services
- Landscaping
- Pest Control
- Trash Removal
- Utilities
- Electricity
- Heating Fuel
- Water & Sewer
As per figure 7.1, NOI is calculated by subtracting operating expenses (OPEX) from effective gross income (EGI). NOI is a significant calculation because it is a common measure the real estate industry uses to determine the financial health of a property. NOI is also important because it is a major element in the calculation of market value of an asset. Annual debt service (ADS), capital expenditures (CAPEX), and replacement reserves line items are typically accounted for below NOI. ADS is the total amount of principal and interest payments made over a twelve month period, CAPEX are expenses that are not regularly occurring operating expenses such as parking lot paving, and replacement reserves is like a savings account where funds are put annually to “save” for planned building component replacements as well as serve as an emergency fund. For example, the replacement reserves line item may be used to annually contribute funds for a planned roof replacement in five years. ADS, CAPEX, and replacement reserves are subtracted from NOI to arrive at before-tax cash flow (BTCF). (Note that before-tax cash flow refers to before income-tax considerations, not real estate taxes which are part of operating expenses.)
Example: Sustainable Property Management Initiatives and Associated Before-Tax Cash Flow Statement Impacts
Sustainable property management initiatives can impact each of the before-tax cash flow statement categories. Within the revenue category, marketing the sustainable initiatives at the property can attract more tenants and therefore increase occupancy; this could increase rent revenue. This quantification is relatively difficult because there is no exact calculation, but tenant satisfaction surveys (as discussed in chapter 6) can help inform property management on the importance of sustainable initiatives in attracting and retaining tenants at the property. Within the operating expense category, changing from conventional light bulbs to LED light bulbs can reduce electricity expenses. Also, maintenance and repairs could decrease because LED light bulbs last longer so they do not need to be changed out as often. Upfront, the cost of the LED light bulbs would be accounted for either in CAPEX or maintenance and repairs, depending on the size and cost of the project. Debt service is typically not a line item that property managers influence, but there are financing options for sustainable buildings such as Fannie Mae’s Multifamily program that offers preferential pricing for sustainable buildings.
The CAPEX item for sustainable initiative implementation may increase in the current year statement of cash flow, but there tend to be positive financial impacts in future years from these expenditures. These future year impacts can be accounted for in a forecasted statement of cash flow, commonly called a proforma statement of cash flow. A proforma statement of cash flow is helpful in planning for the potential impacts of sustainable initiatives. For example, it can account for an initial capital outlay to change from conventional landscaping to a xeriscape landscape design, but also account for lower water bills, maintenance, and fertilizer costs in future years as this type of landscape requires less watering, less maintenance, and less fertilizer. Therefore, property cash flow will experience more upfront cost impacts and property NOI will experience more operational cost saving impacts.
7.3 Cash-on-Cash Return Analysis
A helpful and easy calculation to quickly analyze a return of a sustainable building initiative is a cash-on-cash return. The cash-on-cash return calculates the rate of return on the cash invested in a property based on the annual cash income earned. The equation is as follows:
Cash-on-Cash Return = Annual Cash Income / Total Cash Invested
Let’s use an example to apply this equation.
Example: Cash-on-Cash Calculation
It cost the property $9,100 to replace traditional light bulbs with more energy-efficient LED light bulbs. The annual electricity savings from installing LED light bulbs is projected to be $2,350.
Calculate the cash-on-cash return.
Step 1: Apply the cash-on-cash return formula.
Cash-on-Cash Return = Annual Cash Income / Total Cash Invested
Cash-on-Cash Return = $2,350 / $9,100
Cash-on-Cash Return = 25.82 percent
The results of the cash-on-cash return can be used to compare the property owner’s required rate of return against the cash-on-cash return. The investor will move forward if the cash-on-cash return is greater to or equal to the required rate of return. For example, suppose the property owner’s required rate of return in the example above is 8 percent. Since the cash-on-cash return of 25.82 percent is greater than the required rate of return of 8 percent, the investor will move forward on the sustainable initiative.
The cash-on-cash return is different from return on investment (ROI) because the cash-on-cash return is a snapshot of an annual cash income based on cash invested, whereas ROI takes into account the gain or loss over the life of ownership and divides that gain or loss by the the cost of the investment. However, both the cash-on-cash return and ROI can be misleading as they do not account for the time value of money or the holding period of an investment. A cost-benefit analysis is introduced in a later section in this chapter that takes these variables into account.
7.4 Payback Period Analysis
There are no-cost, low-cost, and high-cost sustainable property management initiatives. No-cost examples include turning off lights and equipment when not in use. Low-cost examples include providing recycling bins to tenants and changing from conventional light bulbs to LED light bulbs. High-cost examples include adding solar panels to the property and installing a green roof on the building. The simple payback period, a calculation that determines the amount of time it takes to recover the upfront costs of an investment, can be calculated for sustainable initiatives that have upfront costs. The formula can be seen below and an example of this formula applied is found in the box below.
Simple Payback Period = Initial Investment Costs / Annual Savings
Example: Simple Payback Period Calculation
It cost the property $9,100 to replace traditional light bulbs with more energy-efficient LED light bulbs. The annual electricity savings from installing LED light bulbs is projected to be $2,350.
Calculate the simple payback period.
Step 1: Apply the simple payback period formula.
Simple Payback Period = Initial Investment Costs / Annual Savings
Simple Payback Period = $9,100 / $2,350
Simple Payback Period = 3.87 years
A discounted payback period analysis takes into account time value of money by applying a discount rate to discount the future cash flows. The discount rate is either the cost of capital or a required “hurdle” rate-of-return metric, which an investment must minimally achieve; otherwise the money will be invested elsewhere. For example, a property company may be paying 5 percent on its debt, so 5 percent is used as the discount rate to represent this cost of capital. Alternatively, shareholders may require a 9 percent return, so 9 percent is used as the discount rate to represent this required rate of return to invest in a project. The formula can be seen below and an example of this formula applied is found in the box below. These calculations can also be done on a financial calculator or financial analysis spreadsheet.
Discounted Payback Period = Preceding Year that Discounted Payback Return Occurs + (Absolute Value of Cumulative Discounted Cash Flow in this Preceding Year / Discounted Cash Flow for the Year After Discounted Payback Return Occurs)
Example: Discounted Payback Period Calculation
It cost the property $9,100 to replace traditional light bulbs with more energy-efficient LED light bulbs. The annual electricity savings from installing LED light bulbs is projected to be $2,350. The discount rate = 8 percent.
Calculate the discounted payback period.
Step 1: Create the chart described below that determines the first year that cumulative discounted cash flows become positive.
- Calculate the simple payback period.
- Based on the number of years for the simple payback period, list out the years in the chart.
- Add the net cash flow by year.
- Use the discounting cash flow formula to arrive at the discounted net cash flow: Discounting Cash Flow = Net Cash Flow / (1 + Discount Rate)Time Period.
- Find the cumulative discounted cash flow by subtracting the previous year cumulative discounted cash flow from the current year discounted net cash flow.
- If the cumulative discounted cash flow remains negative after completing these steps, keep adding an additional year column with the above components until the cumulative discounted cash flow is positive.
| Time Zero | Year 1 | Year 2 | Year 3 | Year 4 | Year 5 | |
|---|---|---|---|---|---|---|
| Net Cash Flow | (9,100.00) | 2,350 .00 | 2,350.00 | 2,350.00 | 2,350.00 | 2,350.00 |
| Discounting Cash Flow Formula | (9,100.00) / (1 + 8 percent)^0 | 2,350 / (1 + 8 percent)^1 | 2,350 / (1 + 8 percent) ^2 | 2,350 / (1 + 8 percent)^3 | 2,350 / (1 + 8 percent)^4 | 2,350 / (1 + 8 percent)^5 |
| Discounted Net Cash Flow | (9,100.00) | 2,175 .93 | 2,014.75 | 1,865.51 | 1,727.32 | 1,599.37 |
| Cumulative Discounted Cash Flows | (9,100.00) | (6,924.07) | (4,909.33) | (3,043.82) | (1,316.50) | 282.87 |
Table 7.1: The first year that cumulative discounted cash flows become positive. Negative numbers are bolded.
Step 2: Apply the discounted payback period formula.
Discounted Payback Period = Preceding Year that Discounted Payback Return Occurs + (Absolute Value of Cumulative Discounted Cash Flow in this Preceding Year / Discounted Cash Flow for the Year After Discounted Payback Return Occurs)
Discounted Payback Period = 4 + 1,316.50 / 1,599.37
Discounted Payback Period = 1,316.50 / 1,599.37 = .82
Discounted Payback Period = 4 + .82
Discounted Payback Period = 4.82
Discounted Payback Period = 4.82 years
As you can see from the above example, the discounted payback period is greater than the simple payback period because the time value of money is factored in. The time value of money concept is that a dollar is worth more today than a dollar tomorrow because of the opportunity cost of investing the dollar somewhere else. This is why future cash flows are discounted.
7.5 Cost-Benefit Analysis
Both the simple payback period and discounted payback period discussed in the previous section do not take into account the savings once the initial capital outlay is paid back. Therefore, a cost-benefit analysis is useful when taking into account the initial capital outlay and the savings once this initial capital outlay is paid back. A cost-benefit analysis is a decision-making tool to determine if the benefits outweigh the costs of a potential investment throughout the product lifecycle. The net present value (NPV) is a helpful calculation when carrying out a cost-benefit analysis. The investor will move forward if NPV is equal to or greater than zero. If the NPV is equal to zero, the investor achieves their required rate of return. If the NPV is greater than zero, the investor achieves a return higher than their required rate of return. In order to determine NPV, the discount rate, product lifecycle, initial costs, and operating savings are needed. A simple formula for NPV is below:
NPV = Today’s Value of Expected Cash Flows — Today’s Value of Cash Invested
Let’s again use the example used throughout the chapter, but this time performing an NPV calculation as illustrated in the box below.
Example: Net Present Value Calculation
It cost the property $9,100 to replace traditional light bulbs with more energy-efficient LED light bulbs. The annual electricity savings from installing LED light bulbs is projected to be $2,350. The discount rate = 8 percent. The LED lighting useful life is between 30,000 and 50,000 hours (LED Basics, n.d.). Assume 2,080 hours annually for LED lighting use and 40,000 hours of useful life for LED lighting. Therefore, the LED lighting useful life is 40,000 / 2,080 = 19.23 years. Conservatively, 19 years will be used as the LED lighting product lifecycle.
Calculate the NPV.
Step 1: Create chart below.
- List out the number of years of the product useful life in the first column.
- List out the annual cash flow during the product’s useful life.
- Calculate the discount factor for each year: 1/(1 + Discount Rate)Year.
- Calculate the present value by multiplying the cash flow by the discount rate.
- Sum all present value rows to come up with the net present value.
| Year | Cash flow | Discount factor | Present value |
|---|---|---|---|
| 0 | (9,100) | 1.0000 | (9,100.00) |
| 1 | 2,350 | 0.9259 | 2,175.93 |
| 2 | 2,350 | 0.8573 | 2,014.75 |
| 3 | 2,350 | 0.7938 | 1,865.51 |
| 4 | 2,350 | 0.7350 | 1,727.32 |
| 5 | 2,350 | 0.6806 | 1,599.37 |
| 6 | 2,350 | 0.6302 | 1,480.90 |
| 7 | 2,350 | 0.5835 | 1,371.20 |
| 8 | 2,350 | 0.5403 | 1,269.63 |
| 9 | 2,350 | 0.5002 | 1,175.59 |
| 10 | 2,350 | 0.4632 | 1,088.50 |
| 11 | 2,350 | 0.4289 | 1,007.87 |
| 12 | 2,350 | 0.3971 | 933.22 |
| 13 | 2,350 | 0.3677 | 864.09 |
| 14 | 2,350 | 0.3405 | 800.08 |
| 15 | 2,350 | 0.3152 | 740.82 |
| 16 | 2,350 | 0.2919 | 685.94 |
| 17 | 2,350 | 0.2703 | 635.13 |
| 18 | 2,350 | 0.2502 | 588.09 |
| 19 | 2,350 | 0.2317 | 544.52 |
| Total | 35,550 | 10.6036 | 13,468.46 |
Table 7.2: Year, cash flow, discount factor, and present value. Negative numbers are bolded.
Step 2: Calculate NPV.
NPV = Today’s Value of Expected Cash Flows — Today’s Value of Cash Invested
Net Present Value = 13,468.46
If NPV is equal to zero, the investor achieves their required rate of return. If NPV is greater than zero, the investor achieves a return higher than their required rate of return. In the above example, since NPV is greater than 0, the project is projected to achieve a return higher than their required rate of return. NPV is also helpful to use when comparing alternative projects because it provides a tangible number for comparison purposes. There is an NPV function in Excel, but Excel does not take into account Year 0 in the calculation, so the result in Excel will differ from the manual calculation if there is cash flowing in Year 0. This can be corrected in Excel by excluding the cash outflow in year 0 when calculating NPV and then subtracting out the initial cash outflow from the NPV calculation in Excel.
Benefit-cost ratio (BCR) is another popular calculation when carrying out a cost-benefit analysis. The BCR equation is as follows:
BCR = Discounted Value of Incremental Benefits / Absolute Value of Discounted Value of Incremental Costs
Let’s again use the example used throughout the chapter, but this time performing a BCR calculation as illustrated in the box below.
Example: Benefit-Cost Ratio Calculation
It cost the property $9,100 to replace traditional light bulbs with more energy-efficient LED light bulbs. The annual electricity savings from installing LED light bulbs is projected to be $2,350. The discount rate = 8 percent. The LED lighting useful life is between 30,000 and 50,000 hours (LED Basics, n.d.). Assume 2,080 hours annually for LED lighting use and 40,000 hours of useful life for LED lighting. Therefore, the LED lighting annual useful life is 40,000 / 2,080 = 19.23 years. Conservatively, 19 years will be used as the LED lighting product lifecycle.
Calculate the NPV.
Step 1: Create chart below.
- List out the number of years of the product useful life in the first column.
- List out the annual cash flow during the product’s useful life.
- Calculate the discount factor for each year: 1/(1 + Discount Rate)Year.
- Calculate the present value by multiplying the cash flow by the discount rate.
| Year | Cash flow | Discount factor | Present value |
|---|---|---|---|
| 0 | (9,100) | 1.0000 | (9,100.00) |
| 1 | 2,350 | 0.9259 | 2,175.93 |
| 2 | 2,350 | 0.8573 | 2,014.75 |
| 3 | 2,350 | 0.7938 | 1,865.51 |
| 4 | 2,350 | 0.7350 | 1,727.32 |
| 5 | 2,350 | 0.6806 | 1,599.37 |
| 6 | 2,350 | 0.6302 | 1,480.90 |
| 7 | 2,350 | 0.5835 | 1,371.20 |
| 8 | 2,350 | 0.5403 | 1,269.63 |
| 9 | 2,350 | 0.5002 | 1,175.59 |
| 10 | 2,350 | 0.4632 | 1,088.50 |
| 11 | 2,350 | 0.4289 | 1,007.87 |
| 12 | 2,350 | 0.3971 | 933.22 |
| 13 | 2,350 | 0.3677 | 864.09 |
| 14 | 2,350 | 0.3405 | 800.08 |
| 15 | 2,350 | 0.3152 | 740.82 |
| 16 | 2,350 | 0.2919 | 685.94 |
| 17 | 2,350 | 0.2703 | 635.13 |
| 18 | 2,350 | 0.2502 | 588.09 |
| 19 | 2,350 | 0.2317 | 544.52 |
| Total | 35,550 | 10.6036 | 13,468.46 |
Table 7.3: Year, cash flow, discount factor, and present value. Negative numbers are bolded.
Step 2: Sum up the present value of savings (22,568.46).
Step 3: Sum up the present value of costs (9,100.00).
Step 4: Apply the BCR formula from up above.
BCR = Discounted Value of Incremental Benefits / Absolute Value of Discounted Value of Incremental Costs
BCR = 22,568.46 / 9,100.00
BCR = 2.48
If BCR is equal to one, the investor achieves their required rate of return. If the BCR is greater than one, the investor achieves a return higher than their required rate of return. In the above example, because the BCR is greater than one, this indicator also shows this sustainable initiative makes sense from a financial standpoint. The BCR ratio can also be used to compare various sustainable building projects.
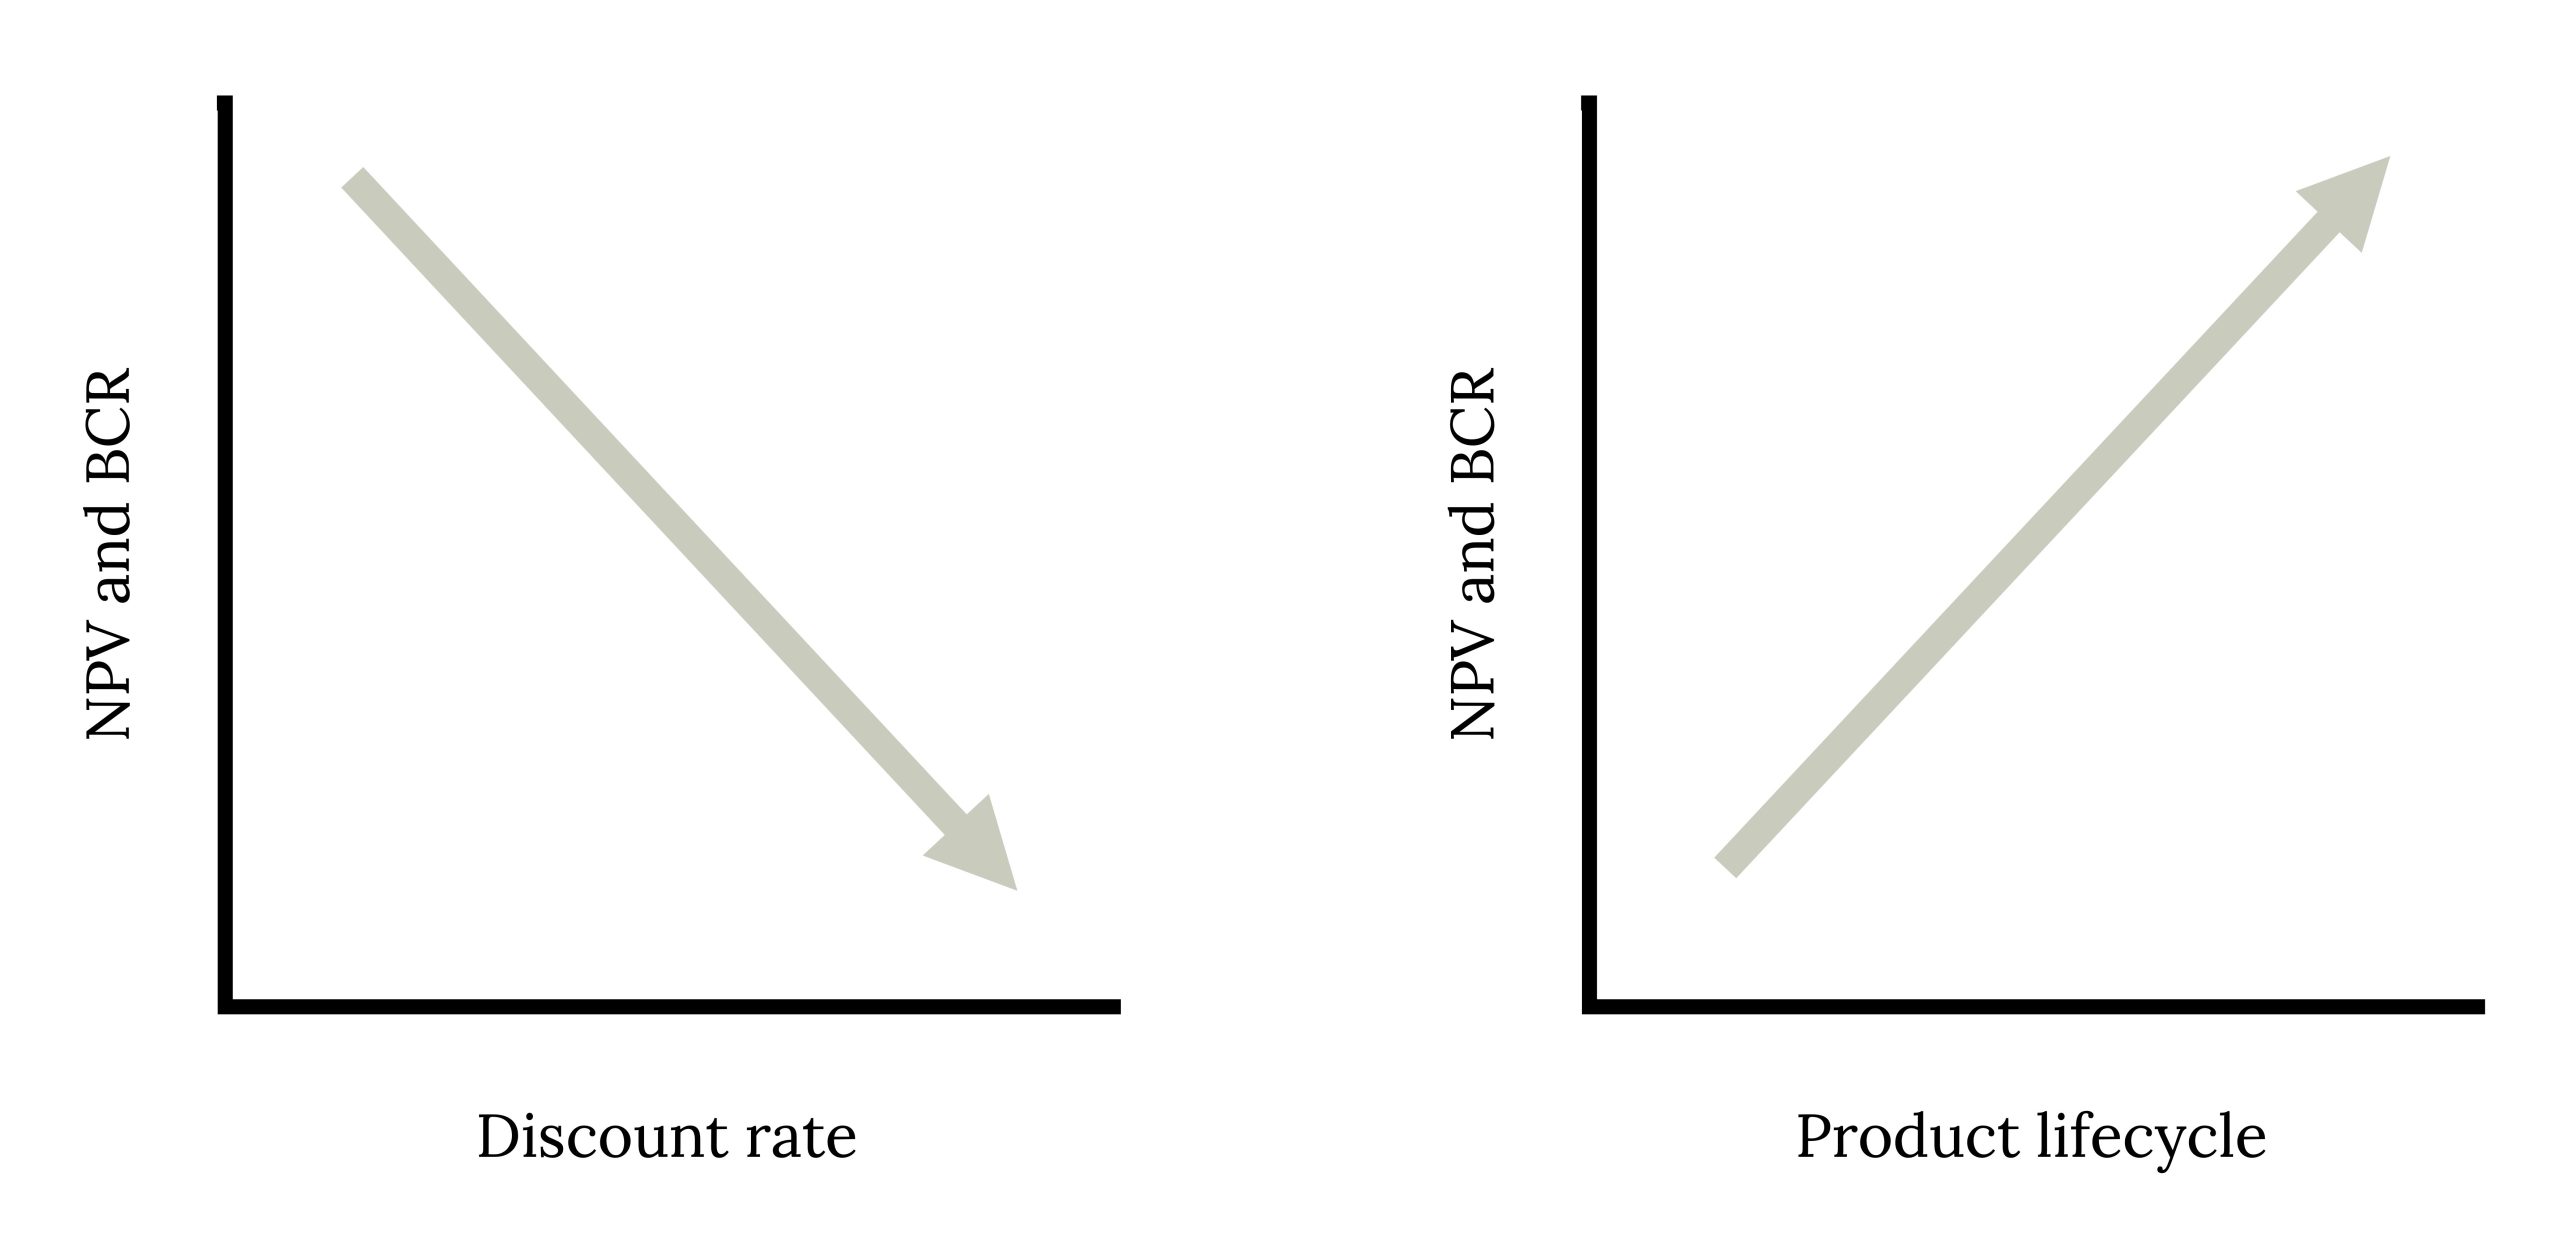
As the discount rate rises, the NPV and BCR decrease. As the product lifecycle increases, the NPV increases along with the BCR.
Section Reference
Office of Energy Efficiency and Renewable Energy. (n.d.). LED basics: Solid-state lighting. https://www.energy.gov/eere/ssl/led-basics
7.6 Conclusion
In review, depending on the calculation used, the sustainable initiative should be pursued if the cash-on-cash return is greater than or equal to the required rate of return, the simple or discounted payback period is less than the allowable payback period, NPV is greater than or equal to 0, or if the BCR is greater than 1. Also, as the discount rate rises, the NPV and BCR decrease, and as the product lifecycle increases, the NPV increases along with the BCR.
A property manager who can perform financial evaluations is essential in the sustainable building initiative decision-making process. By understanding the statement of cash flow and various financial calculations introduced in this chapter, the property manager can determine the financial viability of sustainable building initiatives. These financial results can be shared with property ownership to illustrate which sustainability building initiatives make sense financially. However, it is important that the property manager be cognizant of the property owner’s goals and objectives as these can affect which analysis is relevant. For example, if a property owner does not plan to hold the real estate asset for a long time period, the NPV calculation may not be relevant, but the payback period may be appropriate to determine if the real estate asset will recover the initial investment prior to the sale of the real estate asset. For long-term property holders, the NPV may be more relevant as it takes into account the product lifecycle. No calculation can capture all costs and benefits due to intangible components, but it is important to also consider these intangible elements during the sustainable building decision-making process.
Discussion Questions
- What is the difference between the payback period and discounted payback period? Why does this difference matter?
- How can the actions of the property management firm affect the outcome of these calculations?
- What is your key takeaway from this chapter? In which section did you find it?
Activities
- Consider the following scenario and then answer the questions below:A property owner is evaluating a landscape transition from a traditional lawn to xeriscaping. Year 0 cost to change from lawn to a xeriscape landscape is $9.25/sf. There is 1,100 sf of lawn to be changed out. As this landscape design change is not considered a typical operating expense, the costs would not be part of NOI. The water savings from this landscape design change are $75/month and maintenance savings are $55/month. The life expectancy of this xeriscape landscape design is 10 years. The discount rate is 8.5 percent.
- What statement of cash flow line items are affected from this scenario in both the current year and future years?
- What is the cash-on-cash return?
- What is the simple payback period?
- What is the discounted payback period?
- What is the NPV?
- What is the BCR?
- What should be considered when advising the property owner on the financial viability of this project?
Figure References
Figure 7.1: Statement of cash flow example. Kindred Grey. (2023). CC BY 4.0
Figure 7.2: Discount rate and product lifecycle in relation to NPV and BCR. Kindred Grey. (2023). CC BY 4.0
Image Descriptions
Figure 7.1: Stacked linear algebraic equation. Everything above NOI is “above the line,” everything below NOI is “below the line.” Above the line is broken into revenues (first 6 lines) and expenses (OPEX). From top to bottom: Gross potential income (GPI). (-) Loss to lease. (-) Vacancy and collection loss. (=) net rent revenue. (+) ancillary income. (+) expense reimbursements. (=) effective gross income (EGI). (-) operating expenses (OPEX). (=) net operating income (NOI). (-) annual debt services (ADS). (-) capital expenditures. (-) replacement reserves. (=) before-tax cash flow (BTCF). Return to figure 7.1.
Figure 7.2: As discount rate increases, NPV and BCR decrease (negatively correlated). As product lifecycle increases, NPV and BCR increase (positively correlated). Return to figure 7.2.
A financial statement that illustrates the financial health of the property
The net revenue of the property
Regularly occurring costs for operating and maintaining the day-to-day activities at a property
The annual principal and interest on outstanding debt
Expenditures to increase the useful life of the property that last for more than one year
Where funds are put annually to save for planned building component replacements as well as serve as an emergency fund
The cash flow after debt service and capital expenditures are subtracted from net operating income, but before income-tax considerations
A forecasted statement of cash flow
The initial capital outlay for a product or service
Calculates the rate of return on the cash invested in a property based on the annual cash income earned
Calculation that takes into account the gain or loss over the life of ownership divided by the invested debt and equity
The idea that an amount of money is worth more now than the same amount of money in the future
The length of time a property is owned
A calculation that determines the amount of time it takes to recover the upfront costs of an investment
An analysis that takes into account the time value of money by applying a discount rate to discount the future cash flows
The cost of capital or a required "hurdle" rate of return metric that an investment must minimally achieve
A decision-making tool to determine if the benefits outweigh the costs of a potential investment throughout the product lifecycle
A helpful calculation when carrying out a cost-benefit analysis to determine if an investor will move forward with a project
A helpful calculation when carrying out a cost-benefit analysis to determine if a project makes sense from a financial standpoint
