Chapter 4 Extra Practice
4.1 Introduction to Probability and Random Variables
1. You have a fair, well-shuffled deck of 52 cards. It consists of four suits. The suits are clubs, diamonds, hearts, and spades. There are 13 cards in each suit consisting of 1, 2, 3, 4, 5, 6, 7, 8, 9, 10, J (jack), Q (queen), and K (king) of that suit. Three cards are picked at random.
- Suppose you know that the picked cards are Q of spades, K of hearts, and Q of spades. Can you decide if the sampling was with or without replacement?
- Suppose you know that the picked cards are Q of spades, K of hearts, and J of spades. Can you decide if the sampling was with or without replacement?
2. You have a fair, well-shuffled deck of 52 cards. It consists of four suits. The suits are clubs, diamonds, hearts, and spades. There are 13 cards in each suit consisting of 1, 2, 3, 4, 5, 6, 7, 8, 9, 10, J (jack), Q (queen), and K (king) of that suit. Let S = spades, H = hearts, D = diamonds, and C = clubs.
- Suppose you pick four cards but do not put any cards back into the deck. Your cards are QS, 1D, 1C, and QD.
- Suppose you pick four cards and put each card back before you pick the next card. Your cards are KH, 7D, 6D, and KH.
Of (a) and (b), which did you sample with replacement, and which did you sample without replacement?
3. You have a fair, well-shuffled deck of 52 cards. It consists of four suits. The suits are clubs, diamonds, hearts, and spades. There are 13 cards in each suit consisting of 1, 2, 3, 4, 5, 6, 7, 8, 9, 10, J (jack), Q (queen), and K (king) of that suit. Let S = spades, H = hearts, D = diamonds, and C = clubs. Suppose that you sample four cards without replacement. Which of the following outcomes are possible? Answer the same question for sampling with replacement.
QS, 1D, 1C, QD
KH, 7D, 6D, KH
QS, 7D, 6D, KS
4. Flip two fair coins. The sample space is {HH, HT, TH, TT}, where T = tails and H = heads. The outcomes are HH, HT, TH, and TT. The outcomes HT and TH are different. The HT means that the first coin showed heads and the second coin showed tails. The TH means that the first coin showed tails and the second coin showed heads.
- Let A = the event of getting at most one tail (meaning zero or one tail). Then A can be written as {HH, HT, TH}. The outcome HH shows zero tails. HT and TH each show one tail.
- Let B = the event of getting all tails. B can be written as {TT}. B is the complement of A, so B = A′. In addition, P(A) + P(B) = P(A) + P(A′) = 1.
- The probabilities for A and for B are P(A) =
 and P(B) =
  .
. - Let C = the event of getting all heads. C = {HH}. Since B = {TT}, P(B AND C) = 0. B and C are mutually exclusive, with no members in common because you cannot have all tails and all heads at the same time.
- Let D = event of getting more than one tail. D = {TT}. P(D) = .
- Let E = event of getting a head on the first roll. (This implies you can get either a head or tail on the second roll.) E = {HT, HH}. P(E) =
 .
. - Find the probability of getting at least one (one or two) tail in two flips. Let F = event of getting at least one tail in two flips. F = {HT, TH, TT}. P(F) = .
5. Draw two cards from a standard 52-card deck with replacement. Find the probability of getting at least one black card.
6. Roll one fair, six-sided die. The sample space is {1, 2, 3, 4, 5, 6}. Let event A = a face is odd, so A = {1, 3, 5}. Let event B = a face is even, so B = {2, 4, 6}.
- Find the complement of A, A′. The complement of A, A′ is B because A and B together make up the sample space. P(A) + P(B) = P(A) + P(A′) = 1. Additionally, P(A) =
 and P(B) = .
 - Let event C = odd faces larger than two, so C = {3, 5}. Let event D = all even faces smaller than five, so D = {2, 4}. P(C AND D) = 0 because you cannot have an odd and even face at the same time. Therefore, C and D are mutually exclusive events.
- Let event E = all faces less than five, so E = {1, 2, 3, 4}.
- Find P(C|A). This is a conditional probability. Recall that the event C is {3, 5} and event A is {1, 3, 5}. To find P(C|A), find the probability of C using the sample space, A. You have reduced the sample space from the original sample space {1, 2, 3, 4, 5, 6} to {1, 3, 5}. So, P(C|A) =
 .
.
Are C and E mutually exclusive events? Why or why not?
7. Let event A = learning Spanish. Let event B = learning German. Then, A AND B = learning Spanish and German. Suppose P(A) = 0.4 and P(B) = 0.2. P(A AND B) = 0.08. Are events A and B independent? Hint: You must show ONE of the following:
- P(A|B) = P(A)
- P(B|A) = P(B)
- P(A AND B) = P(A)P(B)
8. Let event G = taking a math class. Let event H = taking a science class. Then, G AND H = taking a math class and a science class. Suppose P(G) = 0.6, P(H) = 0.5, and P(G AND H) = 0.3. Are G and H independent?
If G and H are independent, then you must show ONE of the following:
- P(G|H) = P(G)
- P(H|G) = P(H)
- P(G AND H) = P(G)P(H)
NOTE: The choice you make depends on the information you have. You could choose any of the methods here because you have the necessary information.
9. In a bag, there are six red marbles and four green marbles. The red marbles are marked with the numbers 1, 2, 3, 4, 5, and 6. The green marbles are marked with the numbers 1, 2, 3, and 4.
- R = a red marble
- G = a green marble
- O = an odd-numbered marble
- The sample space is S = {R1, R2, R3, R4, R5, R6, G1, G2, G3, G4}.
S has ten outcomes. What is P(G AND O)?
10. A student goes to the library. Let events B = the student checks out a book and D = the student checks out a DVD. Suppose that P(B) = 0.40, P(D) = 0.30, and P(B AND D) = 0.20.
- Find P(B|D).
- Find P(D|B).
- Are B and D independent?
- Are B and D mutually exclusive?
11. In a box, there are three red cards and five blue cards. The red cards are marked with the numbers 1, 2, and 3, and the blue cards are marked with the numbers 1, 2, 3, 4, and 5. The cards are well shuffled. You reach into the box (you cannot see into it) and draw one card.
Let R = red card is drawn, B = blue card is drawn, and E = even-numbered card is drawn.
The sample space S = R1, R2, R3, B1, B2, B3, B4, B5. S has eight outcomes.
- P(R) =
 . P(B) =
  . P(R AND B) = 0 (since you cannot draw one card that is both red and blue).
 - P(E) = . (There are three even-numbered cards: R2, B2, and B4.)
- P(E|B) =
 . (There are five blue cards: B1, B2, B3, B4, and B5. Out of the blue cards, there are two even cards: B2 and B4.)
 - P(B|E) = . (There are three even-numbered cards: R2, B2, and B4. Out of the even-numbered cards, two are blue: B2 and B4.)
- The events R and B are mutually exclusive because P(R AND B) = 0.
- Let G = card with a number greater than 3. G = {B4, B5}. P(G) =
 . Let H = blue card numbered between one and four, inclusive. H = {B1, B2, B3, B4}. P(G|H) = . (The only card in H that has a number greater than three is B4.) Since = , P(G) = P(G|H), which means that G and H are independent.
12. In a basketball arena:
- 70% of the fans are rooting for the home team.
- 25% of the fans are wearing blue.
- 20% of the fans are wearing blue and are rooting for the away team.
- Of the fans rooting for the away team, 67% are wearing blue.
Let A be the event that a fan is rooting for the away team.
Let B be the event that a fan is wearing blue.
Are the events of rooting for the away team and wearing blue independent? Are they mutually exclusive?
13. In a particular college class, 60% of the students are female. Fifty percent of all students in the class have long hair. Forty-five percent of the students are female and have long hair. Of the female students, 75% have long hair. Let F = the event that a student is female. Let L = the event that a student has long hair. One student is picked randomly. Are the events of being female and having long hair independent?
The following probabilities are given in this example:
- P(F) = 0.60; P(L) = 0.50
- P(F AND L) = 0.45
- P(L|F) = 0.75
NOTE: The choice you make depends on the information you have. You could use the first or last condition on the list for this example. You do not know P(F|L) yet, so you cannot use the second condition.
14. Mark is deciding which route to take to work. His choices are the interstate (I) and Fifth Street (F).
- P(I) = 0.44 and P(F) = 0.56
- P(I AND F) = 0 because Mark will take only one route to work.
What is the probability of P(I OR F)?
15. Fill in the blanks to the following questions.
- Toss one fair coin with two sides, H and T. The outcomes are . How many outcomes are there?
- Toss one fair, six-sided die (with 1, 2, 3, 4, 5, or 6 dots on a side). The outcomes are . How many outcomes are there?
- Multiply the two numbers of outcomes. The answer is .
- If you flip one fair coin and follow it with the toss of one fair, six-sided die, the answer from (c) is the number of outcomes (i.e., the size of the sample space). What are the outcomes? (Hint: Two of the outcomes are H1 and T6.)
- Event A = heads (H) on the coin followed by an even number (2, 4, 6) on the die.
A = { }. Find P(A). - Event B = heads on the coin followed by a three on the die. B = { }. Find P(B).
- Are A and B mutually exclusive? (Hint: What is P(A AND B)? If P(A AND B) = 0, then A and B are mutually exclusive.)
- Are A and B independent? (Hint: Does P(A AND B) = P(A)P(B)? If P(A AND B) = P(A)P(B), then A and B are independent. If not, then they are dependent.)
16. A box has two balls, one white and one red. We select one ball, put it back in the box, and select a second ball (sampling with replacement). Let T be the event of getting the white ball twice, F the event of picking the white ball first, and S the event of picking the white ball in the second drawing.
- Compute P(T).
- Compute P(T|F).
- Are T and F independent?
- Are F and S mutually exclusive?
- Are F and S independent?
17. E and F are mutually exclusive events. P(E) = 0.4; P(F) = 0.5. Find P(E|F).
18. J and K are independent events. P(J|K) = 0.3. Find P(J).
19. U and V are mutually exclusive events. P(U) = 0.26; P(V) = 0.37. Find:
- P(U AND V)
- P(U|V)
- P(U OR V)
20. Q and R are independent events. P(Q) = 0.4 and P(Q AND R) = 0.1. Find P(R).
21. The graph shown is based on more than 170,000 interviews done by Gallup that took place from January through December 2012. The sample consists of employed Americans 18 years of age or older. The Emotional Health Index Scores are the sample space. We randomly sample one Emotional Health Index Score.
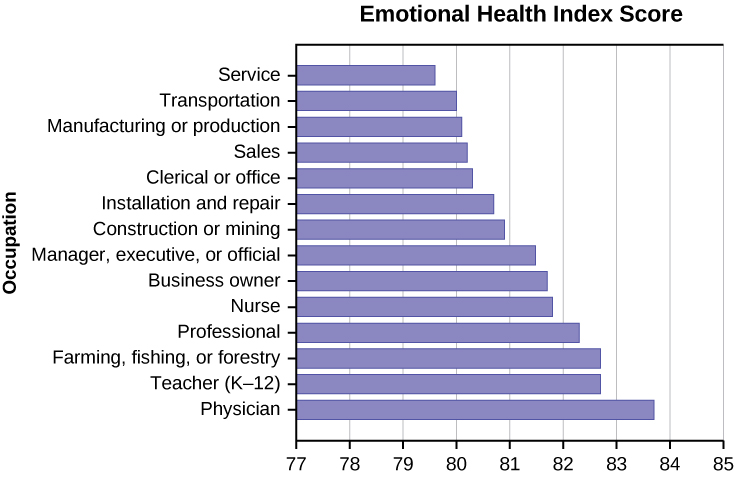
- Find the probability that an Emotional Health Index Score is 82.7.
- Find the probability that an Emotional Health Index Score is 81.0.
- Find the probability that an Emotional Health Index Score is more than 81.
- Find the probability that an Emotional Health Index Score is between 80.5 and 82.
- If we know an Emotional Health Index Score is 81.5 or more, what is the probability that it is 82.7?
- What is the probability that an Emotional Health Index Score is 80.7 or 82.7?
- What is the probability that an Emotional Health Index Score is less than 80.2, given that it is already less than 81
- What occupation has the highest Emotional Health Index Score?
- What occupation has the lowest Emotional Health Index Score?
- What is the range of the data?
- Compute the average Emotional Health Index Score.
- If all occupations are equally likely for a certain individual, what is the probability that he or she will have an occupation with lower than average EHIS?
22. A previous year, the weights of the members of the San Francisco 49ers and the Dallas Cowboys were published in the San Jose Mercury News. The factual data are compiled into the figure below.[1]
| Shirt number | ≤ 210 | 211–250 | 251–290 | 290≤ |
|---|---|---|---|---|
| 1-33 | 21 | 5 | 0 | 0 |
| 34-66 | 6 | 18 | 7 | 4 |
| 66-99 | 6 | 12 | 22 | 5 |
Figure 4.26
For the following, suppose that you randomly select one player from the 49ers or Cowboys.
If having a shirt number from one to 33 and weighing at most 210 pounds were independent events, then what should be true about P(Shirt number 1–33|≤ 210 pounds)?
23. The probability that a male develops some form of cancer in his lifetime is 0.4567. The probability that a male has at least one false positive test result (meaning the test comes back for cancer when the man does not have it) is 0.51. Some of the following questions do not have enough information for you to answer them. Write “not enough information” for those answers. Let C = a man develops cancer in his lifetime and P = man has at least one false positive.
- Find P(C).
- Find P(P|C).
- Find P(P|C’).
- If a test comes up positive, based upon numerical values, can you assume that man has cancer? Justify numerically, and explain why or why not.
24. Given events G and H: P(G) = 0.43; P(H) = 0.26; P(H AND G) = 0.14
- Find P(H OR G).
- Find the probability of the complement of event (H AND G).
- Find the probability of the complement of event (H OR G).
25. Given events J and K: P(J) = 0.18; P(K) = 0.37; P(J OR K) = 0.45
- Find P(J AND K).
- Find the probability of the complement of event (J AND K).
- Find the probability of the complement of event (J OR K).
26. The sample space S is the whole numbers starting at one and less than 20.
- Find S.
- Let event A = the even numbers and event B = numbers greater than 13. Find A and B.
- Find P(A) and P(B).
- Find A AND B. Find A OR B.
- Find P(A AND B). Find P(A OR B).
- Find A′. Find P(A′).
- What is P(A) + P(A′)?
- Find P(A|B) and P(B|A). Are the probabilities equal?
27. The sample space S is all the ordered pairs of two whole numbers, the first from one to three and the second from one to four—for example, (1, 4).
- Find S.
- Let event A = the sum is even and event B = the first number is prime. Find A and B.
- Find P(A) and P(B).
- Find A AND B. Find A OR B.
- Find P(A AND B). Find P(A OR B).
- Find B′. Find P(B′).
- What is P(A) + P(A′)?
- Find P(A|B) and P(B|A). Are the probabilities equal?
28. A fair, six-sided die is rolled. Describe the sample space S, identify each of the following events with a subset of S, and compute its probability. NOTE: an outcome is the number of dots that show up.
- Event T = the outcome is two
- Event A = the outcome is an even number
- Event B = the outcome is less than four
- The complement of A
- A GIVEN B
- B GIVEN A
- A AND B
- A OR B
- A OR B′
- Event N = the outcome is a prime number
- Event I = the outcome is seven
29. The figure below describes the distribution of a random sample, S, of 100 individuals, organized by gender and whether they are right- or left-handed.
| Right-handed | Left-handed | |
|---|---|---|
| Male | 43 | 9 |
| Female | 44 | 4 |
Figure 4.27
Let the events M = the subject is male, F = the subject is female, R = the subject is right-handed, and L = the subject is left-handed. Compute the following probabilities:
- P(M)
- P(F)
- P(R)
- P(L)
- P(M AND R)
- P(F AND L)
- P(M OR F)
- P(M OR R)
- P(F OR L)
- P(M’)
- P(R|M)
- P(F|L)
- P(L|F)
30. In a particular college class, there are male and female students. Some students have long hair, and some students have short hair. Write the symbols for the probabilities of the events (a) through (j). (Note that you cannot find numerical answers here; you were not given enough information to find any probability values yet. Concentrate on understanding the symbols.)
- Let F = the event that a student is female.
- Let M = the event that a student is male.
- Let S = the event that a student has short hair.
- Let L = the event that a student has long hair.
- The probability that a student does not have long hair.
- The probability that a student is male or has short hair.
- The probability that a student is a female and has long hair.
- The probability that a student is male, given that the student has long hair.
- The probability that a student has long hair, given that the student is male.
- Of all the female students, the probability that a student has short hair.
- Of all students with long hair, the probability that a student is female.
- The probability that a student is female or has long hair.
- The probability that a randomly selected student is a male student with short hair.
- The probability that a student is female.
31. A box is filled with several party favors. It contains 12 hats, 15 noisemakers, ten finger traps, and five bags of confetti.
- Let H = the event of getting a hat.
- Let N = the event of getting a noisemaker.
- Let F = the event of getting a finger trap.
- Let C = the event of getting a bag of confetti.
- Find P(H).
- Find P(N).
- Find P(F).
- Find P(C).
32. A jar of 150 jelly beans contains 22 red jelly beans, 38 yellow, 20 green, 28 purple, 26 blue, and the rest are orange.
- Let B = the event of getting a blue jelly bean
- Let G = the event of getting a green jelly bean.
- Let O = the event of getting an orange jelly bean.
- Let P = the event of getting a purple jelly bean.
- Let R = the event of getting a red jelly bean.
- Let Y = the event of getting a yellow jelly bean.
- Find P(B).
- Find P(G).
- Find P(P).
- Find P(R).
- Find P(Y).
- Find P(O).
33. There are 23 countries in North America, 12 countries in South America, 47 countries in Europe, 44 countries in Asia, 54 countries in Africa, and 14 in Oceania (Pacific Ocean region).
- Let A = the event that a country is in Asia.
- Let E = the event that a country is in Europe.
- Let F = the event that a country is in Africa.
- Let N = the event that a country is in North America.
- Let O = the event that a country is in Oceania.
- Let S = the event that a country is in South America.
- Find P(A).
- Find P(E).
- Find P(F).
- Find P(N).
- Find P(O).
- Find P(S).
34. You see a game at a local fair. You have to throw a dart at a color wheel. Each section on the color wheel is equal in area.
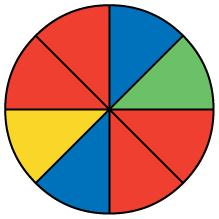
- Let B = the event of landing on blue.
- Let R = the event of landing on red.
- Let G = the event of landing on green.
- Let Y = the event of landing on yellow.
- If you land on Y, you get the biggest prize. Find P(Y).
- If you land on red, you don’t get a prize. What is P(R)?
35. On a baseball team, there are infielders and outfielders. Some players are great hitters, and some players are not great hitters.
- Let I = the event that a player in an infielder.
- Let O = the event that a player is an outfielder.
- Let H = the event that a player is a great hitter.
- Let N = the event that a player is not a great hitter.
- Write the symbols for the probability that a player is not an outfielder.
- Write the symbols for the probability that a player is an outfielder or is a great hitter.
- Write the symbols for the probability that a player is an infielder and is not a great hitter.
- Write the symbols for the probability that a player is a great hitter, given that the player is an infielder.
- Write the symbols for the probability that a player is an infielder, given that the player is a great hitter.
- Write the symbols for the probability that, of all the outfielders, a player is not a great hitter.
- Write the symbols for the probability that, of all the great hitters, a player is an outfielder.
- Write the symbols for the probability that a player is an infielder or is not a great hitter.
- Write the symbols for the probability that a player is an outfielder and is a great hitter.
- Write the symbols for the probability that a player is an infielder.
- What is the word for the set of all possible outcomes?
- What is conditional probability?
- The likelihood that an event will occur, given that another event has already occurred.
36. A shelf holds 12 books. Eight are fiction, and the rest are nonfiction. Each is a different book with a unique title. The fiction books are numbered one to eight. The nonfiction books are numbered one to four. Randomly select one book.
- Let F = event that book is fiction
- Let N = event that book is nonfiction
- What is the sample space?
- What is the sum of the probabilities of an event and its complement?
37. You are rolling a fair, six-sided die. Let E = the event that it lands on an even number. Let M = the event that it lands on a multiple of three.
- What does P(E|M) mean in words?
- What does P(E OR M) mean in words?
38. The graph below displays the sample sizes and percentages of people in different age and gender groups who were polled concerning their approval of Mayor Ford’s actions in office. The total number in the sample of all the age groups is 1,045.
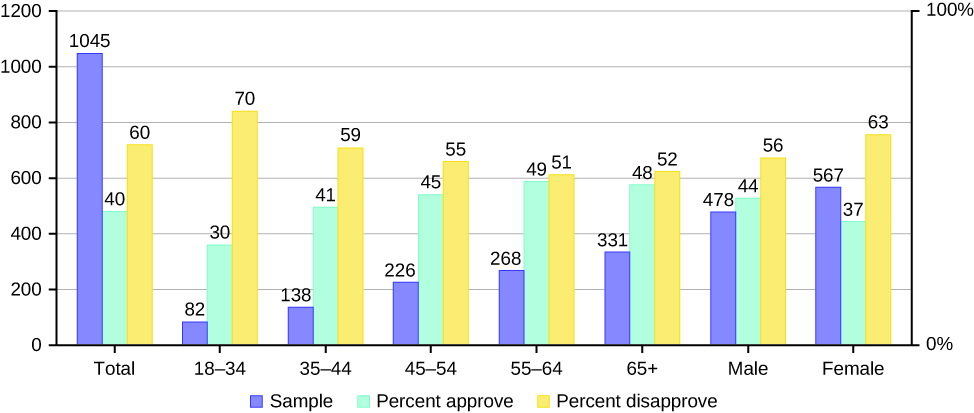
- Define three events in the graph.
- Describe in words what the bar marked “40” means in this graph.
- Describe in words the complement of the entry in (b).
- Describe in words what the bar marked “30” means in this graph.
- Out of the males and females, what percent are males?
- Out of the females, what percent disapprove of Mayor Ford?
- Out of all the age groups, what percent approve of Mayor Ford?
- Find P(approve|male).
- Out of the age groups, what percent are more than 44 years old?
- Find P(approve|age < 35).
39. Explain what is wrong with the following statements. Use complete sentences.
- If there is a 60% chance of rain on Saturday and a 70% chance of rain on Sunday, then there is a 130% chance of rain over the weekend.
- The probability that a baseball player hits a home run is greater than the probability that he gets a successful hit.
4.2 Discrete Random Variables
1. Helen plays basketball. For free throws, she makes the shot 75% of the time. Helen must now attempt two free throws. C = the event that Helen makes the first shot. P(C) = 0.75. D = the event Helen makes the second shot. P(D) = 0.75. The probability that Helen makes the second free throw, given that she made the first, is 0.85. What is the probability that Helen makes both free throws?
2. A community swim team has 150 members. Seventy-five of the members are advanced swimmers. Forty-seven of the members are intermediate swimmers. The remainder are novice swimmers. Forty of the advanced swimmers practice four times a week. Thirty of the intermediate swimmers practice four times a week. Ten of the novice swimmers practice four times a week. Suppose one member of the swim team is chosen randomly.
- What is the probability that the member is a novice swimmer?
- What is the probability that the member practices four times a week?
- What is the probability that the member is an advanced swimmer and practices four times a week?
- What is the probability that a member is an advanced swimmer and an intermediate swimmer? Are being an advanced swimmer and an intermediate swimmer mutually exclusive? Why or why not?
- Are being a novice swimmer and practicing four times a week independent events? Why or why not?
3. A school has 200 seniors, of whom 140 will be going to college next year. Forty will be going directly to work. The remainder are taking a gap year. Fifty of the seniors who are going to college play sports. Thirty of the seniors who are going directly to work play sports. Five of the seniors who are taking a gap year play sports. What is the probability that a senior is taking a gap year?
4. A student goes to the library. Let events B = the student checks out a book and D = the student check out a DVD. Suppose that P(B) = 0.40, P(D) = 0.30 and P(D|B) = 0.5.
- Find P(B AND D).
- Find P(B OR D).
5. Studies show that about one woman in seven (approximately 14.3%) who live to be 90 will develop breast cancer. Suppose that, of those women who develop breast cancer, a test is negative 2% of the time. Also suppose that, in the general population of women, the test for breast cancer is negative about 85% of the time. Let B = woman develops breast cancer, and let N = tests negative. Suppose one woman is selected at random.
- What is the probability that the woman develops breast cancer? What is the probability that the woman tests negative?
- Given that the woman has breast cancer, what is the probability that she tests negative?
- What is the probability that the woman has breast cancer AND tests negative?
- What is the probability that the woman has breast cancer or tests negative?
- Are having breast cancer and testing negative independent events?
- Are having breast cancer and testing negative mutually exclusive?
6. A school has 200 seniors, of whom 140 will be going to college next year. Forty will be going directly to work. The remainder are taking a gap year. Fifty of the seniors who are going to college play sports. Thirty of the seniors who are going directly to work play sports. Five of the seniors who are taking a gap year play sports. What is the probability that a senior is going to college and plays sports?
7. Refer to the information in Question 5. Let P = tests positive.
- Given that a woman develops breast cancer, what is the probability that she tests positive. Find P(P|B) = 1 – P(N|B).
- What is the probability that a woman develops breast cancer and tests positive. Find P(B AND P) = P(P|B)P(B)?
- What is the probability that a woman does not develop breast cancer. Find P(B′) = 1 – P(B)?
- What is the probability that a woman tests positive for breast cancer. Find P(P) = 1 – P(N)?
8. A student goes to the library. Let events B = the student checks out a book and D = the student checks out a DVD. Suppose that P(B) = 0.40, P(D) = 0.30, and P(D|B) = 0.5.
- Find P(B′).
- Find P(D AND B).
- Find P(B|D).
- Find P(D AND B′).
- Find P(D|B′).
9. Forty-eight percent of all Californian registered voters prefer life in prison without parole over the death penalty for a person convicted of first-degree murder. Among Latino Californian registered voters, 55% prefer life in prison without parole over the death penalty for a person convicted of first-degree murder. Of all Californians, 37.6% are Latino.
In this problem, let:
- C = Californians (registered voters) preferring life in prison without parole over the death penalty for a person convicted of first-degree murder
- L = Latino Californians
Suppose that one Californian is randomly selected.
- Find P(C).
- Find P(L).
- Find P(C|L).
- In words, what is C|L?
- Find P(L AND C).
- In words, what is L AND C?
- Are L and C independent events? Show why or why not.
- Find P(L OR C).
- In words, what is L OR C?
- Are L and C mutually exclusive events? Show why or why not.
10. On February 28, 2013, a Field Poll Survey reported that 61% of Californian registered voters approved of allowing two people of the same gender to marry and have regular marriage laws apply to them. Among 18-to-39-year-old Californian registered voters, the approval rating was 78%. Six in ten Californian registered voters said that the upcoming Supreme Court’s ruling about the constitutionality of California’s Proposition 8 was either very or somewhat important to them. Out of those CA registered voters who support same-sex marriage, 75% say the ruling is important to them.[2]
In this problem, let:
- C = California registered voters who support same-sex marriage
- B = California registered voters who say the Supreme Court’s ruling about the constitutionality of California’s Proposition 8 is very or somewhat important to them
- A = California registered voters who are 18-to-39 years old
- Find P(C).
- Find P(B).
- Find P(C|A).
- Find P(B|C).
- In words, what is C|A?
- In words, what is B|C?
- Find P(C AND B).
- In words, what is C AND B?
- Find P(C OR B).
- Are C and B mutually exclusive events? Show why or why not.
11. After Rob Ford, the mayor of Toronto, announced his plans to cut budget costs in late 2011, Forum Research polled 1,046 people to measure the mayor’s popularity. Everyone polled expressed either approval or disapproval. [3]
These are the results their poll produced:
- In early 2011, 60% of the population approved of Mayor Ford’s actions in office.
- In mid-2011, 57% of the population approved of his actions.
- In late 2011, the percentage of popular approval was measured at 42%.
- What is the sample size for this study?
- What proportion in the poll disapproved of Mayor Ford according to the results from late 2011?
- How many people polled responded that they approved of Mayor Ford in late 2011?
- What is the probability that a person supported Mayor Ford based on the data collected in mid-2011?
- What is the probability that a person supported Mayor Ford based on the data collected in early 2011?
12. The casino game roulette allows the gambler to bet on the probability of a ball, which spins in the roulette wheel, landing on a particular color, number, or range of numbers. The table used to place bets contains 38 numbers, and each number is assigned to a color and a range.[4]
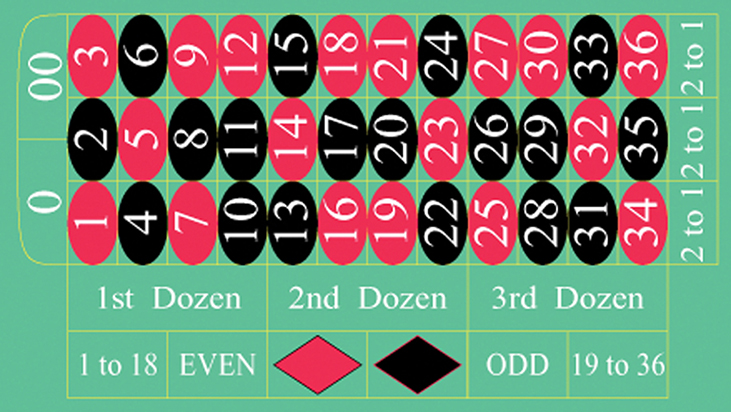
Compute the probability of winning the following types of bets:
- Betting on two lines that touch each other on the table, as in 1-2-3-4-5-6
- Betting on three numbers in a line, as in 1-2-3
- Betting on one number
- Betting on four numbers that touch each other to form a square, as in 10-11-13-14
- Betting on two numbers that touch each other on the table, as in 10-11 or 10-13
- Betting on 0-00-1-2-3
- Betting on 0-1-2; or 0-00-2; or 00-2-3
13. Suppose that you have eight cards. Five are green, and three are yellow. The five green cards are numbered 1, 2, 3, 4, and 5. The three yellow cards are numbered 1, 2, and 3. The cards are well shuffled. You randomly draw one card.
- G = card drawn is green
- E = card drawn is even-numbered
- List the sample space.
- Find P(G.
- Find P(G|E).
- Find P(G AND E).
- Find P(G OR E).
- Are G and E mutually exclusive? Justify your answer numerically.
14. Roll two fair dice separately. Each die has six faces.
- List the sample space.
- Let A be the event that either a three or four is rolled first followed by an even number. Find P(A).
- Let B be the event that the sum of the two rolls is at most seven. Find P(B).
- In words, explain what “P(A|B)” represents. Find P(A|B).
- Are A and B mutually exclusive events? Explain your answer in one-to-three complete sentences including numerical justification.
- Are A and B independent events? Explain your answer in one-to-three complete sentences including numerical justification.
15. A special deck of cards has ten cards. Four are green, three are blue, and three are red. When a card is picked, its color of it is recorded. An experiment consists of first picking a card and then tossing a coin.
- List the sample space.
- Let A be the event that a blue card is picked first, followed by landing a head on the coin toss. Find P(A).
- Let B be the event that a red or green is picked, followed by landing a head on the coin toss. Are the events A and B mutually exclusive? Explain your answer in one-to-three complete sentences, including numerical justification.
- Let C be the event that a red or blue is picked, followed by landing a head on the coin toss. Are the events A and C mutually exclusive? Explain your answer in one-to-three complete sentences, including numerical justification.
NOTE: The coin toss is independent of the card picked first.
16. An experiment consists of first rolling a die and then tossing a coin.
- List the sample space.
- Let A be the event that either a three or a four is rolled first followed by landing a head on the coin toss. Find P(A).
- Let B be the event that the first and second tosses land on heads. Are the events A and B mutually exclusive? Explain your answer in one-to-three complete sentences including numerical justification.
17. An experiment consists of tossing a nickel, a dime, and a quarter. Of interest is the side on which the coin lands.
- List the sample space.
- Let A be the event that there are at least two tails. Find P(A).
- Let B be the event that the first and second tosses land on heads. Are the events A and B mutually exclusive? Explain your answer in one-to-three complete sentences, including justification.
18. Consider the following scenario:
- Let P(C) = 0.4.
- Let P(D) = 0.5.
- Let P(C|D) = 0.6.
- Find P(C AND D).
- Are C and D mutually exclusive? Why or why not?
- Are C and D independent events? Why or why not?
- Find P(C OR D).
- Find P(D|C).
19. Y and Z are independent events.
- Rewrite the basic addition rule, P(Y OR Z) = P(Y) + P(Z) – P(Y AND Z), using the information that Y and Z are independent events.
- Use the rewritten rule to find P(Z) if P(Y OR Z) = 0.71 and P(Y) = 0.42.
20. G and H are mutually exclusive events. P(G) = 0.5 P(H) = 0.3.
- Explain why the following statement MUST be false: P(H|G) = 0.4.
- Find P(H OR G).
- Are G and H independent or dependent events? Explain in a complete sentence.
21. Approximately 281,000,000 people over the age of five live in the United States. Of these people, 55,000,000 speak a language other than English at home. Of those who speak another language at home, 62.3% speak Spanish.[5]
- Let E = speaks English at home.
- Let E′ = speaks another language at home.
- Let S = speaks Spanish.
Finish each probability statement in the table below by matching the correct answer.
| Probability statements | Answers |
|---|---|
a.  = = |
i. 0.8043 |
b.  = = |
ii. 0.623 |
c.  = = |
iii. 0.1957 |
d.  = = |
iv. 0.1219 |
Figure 4.31
22. In 1994, the US government held a lottery to issue 55,000 Green Cards (permits for non-citizens to work legally in the US). Renate Deutsch from Germany was one of approximately 6.5 million people who entered this lottery. Let G = won green card.
- What was Renate’s chance of winning a Green Card? Write your answer as a probability statement.
- In the summer of 1994, Renate received a letter stating she was one of 110,000 finalists chosen. Once the finalists were chosen, assuming that each finalist had an equal chance to win, what was Renate’s chance of winning a Green Card? Write your answer as a conditional probability statement. Let F = was a finalist.
- Are G and F independent or dependent events? Justify your answer numerically, and explain why.
- Are G and F mutually exclusive events? Justify your answer numerically, and explain why.
23. Three professors at George Washington University did an experiment to determine if economists are more selfish than other people. They dropped 64 stamped, addressed envelopes with $10 cash in different classrooms on the George Washington campus. Overall, 44% were returned. From the economics classes, 56% of the envelopes were returned. From the business, psychology, and history classes, 31% were returned.
- Let R = money returned.
- Let E = economics classes.
- Let O = other classes.
- Write a probability statement for the overall percent of money returned.
- Write a probability statement for the percent of money returned out of the economics classes.
- Write a probability statement for the percent of money returned out of the other classes.
- Is money being returned independent of the class? Justify your answer numerically, and explain it.
- Based upon this study, do you think that economists are more selfish than other people? Explain why or why not. Include numbers to justify your answer.
24. The following table of data obtained from the website Baseball Almanac shows hit information for four players. Suppose that one hit from the table is randomly selected.[6]
| Name | Single | Double | Triple | Home run | Total hits |
|---|---|---|---|---|---|
| Babe Ruth | 1,517 | 506 | 136 | 714 | 2,873 |
| Jackie Robinson | 1,054 | 273 | 54 | 137 | 1,518 |
| Ty Cobb | 3,603 | 174 | 295 | 114 | 4,189 |
| Hank Aaron | 2,294 | 624 | 98 | 755 | 3,771 |
| Total | 8,471 | 1,577 | 583 | 1,720 | 12,351 |
Figure 4.32
Are “the hit being made by Hank Aaron” and “the hit being a double” independent events?
- Yes, because P(hit by Hank Aaron|hit is a double) = P(hit by Hank Aaron).
- No, because P(hit by Hank Aaron|hit is a double) ≠ P(hit is a double).
- No, because P(hit is by Hank Aaron|hit is a double) ≠ P(hit by Hank Aaron).
- Yes, because P(hit is by Hank Aaron|hit is a double) = P(hit is a double).
25. United Blood Services[7] is a blood bank that serves more than 500 hospitals in 18 states. According to their website, a person with type O blood and a negative Rh factor (Rh-) can donate blood to any person with any blood type. Their data show that 43% of people have type O blood, 15% of people have Rh- factor, and 52% of people have type O or Rh- factor.
- Find the probability that a person has both type O blood and the Rh- factor.
- Find the probability that a person does NOT have both type O blood and the Rh- factor.
26. At a college, 72% of courses have final exams and 46% of courses require research papers. Suppose that 32% of courses have a research paper and a final exam. Let F be the event that a course has a final exam. Let R be the event that a course requires a research paper.
- Find the probability that a course has a final exam or a research project.
- Find the probability that a course has NEITHER of these two requirements.
27. In a box of assorted cookies, 36% contain chocolate and 12% contain nuts. Of those, 8% contain both chocolate and nuts. Sean is allergic to both chocolate and nuts.
- Find the probability that a cookie contains chocolate or nuts (i.e., he can’t eat it).
- Find the probability that a cookie does not contain chocolate or nuts (i.e., he can eat it).
28. A college finds that 10% of students have taken a distance learning class and that 40% of students are part-time students. Of the part time students, 20% have taken a distance learning class. Let D = the event that a student takes a distance learning class and E = the event that a student is a part-time student.
- Find P(D AND E).
- Find P(E|D).
- Find P(D OR E).
- Using an appropriate test, show whether D and E are independent.
- Using an appropriate test, show whether D and E are mutually exclusive.
29. A company wants to evaluate its attrition rate—in other words, how long new hires stay with the company. Over the years, they have established the following probability distribution. Let X = the number of years a new hire will stay with the company. Let P(x) = the probability that a new hire will stay with the company x years. Complete the figure below using the data provided.
| x | P(x) |
|---|---|
| 0 | 0.12 |
| 1 | 0.18 |
| 2 | 0.30 |
| 3 | 0.15 |
| 4 | 0.10 |
| 5 | 0.10 |
| 6 | 0.05 |
Figure 4.33
- Find P(x = 4).
- Find P(x ≥ 5).
- On average, how long would you expect a new hire to stay with the company?
- What does the column “P(x)” sum to?
30. A baker is deciding how many batches of muffins to make to sell in his bakery. He wants to make enough to sell every one and no fewer. Through observation, the baker has established a probability distribution.
| x | P(x) |
|---|---|
| 1 | 0.15 |
| 2 | 0.35 |
| 3 | 0.40 |
| 4 | 0.10 |
Figure 4.34
- Define the random variable X.
- What is the probability the baker will sell more than one batch? P(x > 1)
- What is the probability the baker will sell exactly one batch? P(x = 1)
- On average, how many batches should the baker make?
31. Ellen has music practice three days a week. She practices for all of the three days 85% of the time, two days 8% of the time, one day 4% of the time, and no days 3% of the time. One week is selected at random.
- Define the random variable X.
- Construct a probability distribution table for the data.
- We know that for a probability distribution function must have two characteristics to be discrete. One is that the sum of the probabilities is one. What is the other characteristic?
32. Javier volunteers in community events each month. He does not do more than five events in a month. He attends exactly five events 35% of the time, four events 25% of the time, three events 20% of the time, two events 10% of the time, one event 5% of the time, and no events 5% of the time.
- Define the random variable X.
- What values does x take on?
- Construct a PDF table.
- Find the probability that Javier volunteers for less than three events each month. P(x < 3)
- Find the probability that Javier volunteers for at least one event each month. P(x > 0)
33. Suppose that the PDF for the number of years it takes to earn a Bachelor of Science (BS) degree is given in below.
| x | P(x) |
|---|---|
| 3 | 0.05 |
| 4 | 0.40 |
| 5 | 0.30 |
| 6 | 0.15 |
| 7 | 0.10 |
Figure 4.35
- In words, define the random variable X.
- What does it mean that the values 0, 1, and 2 are not included for x in the PDF?
34. Suppose you play a game of chance in which a computer randomly chooses five numbers from 0, 1, 2, 3, 4, 5, 6, 7, 8, and 9 with replacement. You pay $2 to play and could profit $100,000 if you match all five numbers in order (getting your $2 back plus $100,000). Over the long term, what is your expected profit of playing the game?
- To do this problem, set up an expected value table for the amount of money you can profit. Let X = the amount of money you profit. The values of x are not 0, 1, 2, 3, 4, 5, 6, 7, 8, and 9. Since you are interested in your profit (or loss), the values of x are 100,000 dollars and −2 dollars.
- To win, you must get all five numbers correct, in order. The probability of choosing one correct number is
 because there are ten numbers. You may choose a number more than once. The probability of choosing all five numbers correctly and in order is
 =
=  = 0.00001
 - Therefore, the probability of winning is 0.00001 and the probability of losing is 1 – 0.00001 = 0.99999.
- The expected value table is as follows: (Αdd the last column. –1.99998 + 1 = –0.99998.)
| x | P(x) | x*P(x) | |
|---|---|---|---|
| Loss | -2 | 0.99999 | (–2)(0.99999) = –1.99998 |
| Profit | 100,000 | 0.00001 | (100000)(0.00001) = 1 |
Figure 4.36
Since –0.99998 is about –1, you would, on average, expect to lose approximately $1 for each game you play. However, each time you play, you either lose $2 or profit $100,000. The $1 is the average or expected loss per game after playing this game over and over.
35. You are playing a game of chance in which four cards are drawn from a standard deck of 52 cards. You guess the suit of each card before it is drawn. The cards are replaced in the deck on each draw. You pay $1 to play. If you guess the right suit every time, you get your money back and $256. What is your expected profit from playing the game over the long term?
36. Suppose you play a game in which you toss a biased coin once, with the probabilities P(heads) = and P(tails) =  . If you toss a head, you pay $6. If you toss a tail, you win $10. If you play this game many times, will you come out ahead?
- Define a random variable X.
- Complete the following expected value table:
x Win 10 Lose 
Figure 4.37
- What is the expected value, μ? Do you come out ahead?
37. Suppose you play a game in which you spin a spinner once, with the probabilities P(red) = , P(blue) = , and P(green) =  . If you land on red, you pay $10. If you land on blue, you don’t pay or win anything. If you land on green, you win $10. Complete the following expected value table:
| x | P(x) | ||
|---|---|---|---|
| Red |  |
||
| Blue | |
||
| Green | 10 |
Figure 4.38
38. Toss a fair, six-sided die twice. Let X = the number of faces that show an even number. Construct a table like the one in Question 4, and calculate the mean (μ) and standard deviation (σ) of X.
Tossing one fair, six-sided die twice has the same sample space as tossing two fair, six-sided dice. The sample space has 36 outcomes:
| Sample space outcomes | |||||
|---|---|---|---|---|---|
| (1, 1) | (1, 2) | (1, 3) | (1, 4) | (1, 5) | (1, 6) |
| (2, 1) | (2, 2) | (2, 3) | (2, 4) | (2, 5) | (2, 6) |
| (3, 1) | (3, 2) | (3, 3) | (3, 4) | (3, 5) | (3, 6) |
| (4, 1) | (4, 2) | (4, 3) | (4, 4) | (4, 5) | (4, 6) |
| (5, 1) | (5, 2) | (5, 3) | (5, 4) | (5, 5) | (5, 6) |
| (6, 1) | (6, 2) | (6, 3) | (6, 4) | (6, 5) | (6, 6) |
Figure 4.39
- Use the sample space to complete the following table:
x P(x) x*P(x) (x-μ)2*P(x) 0 1 2 Figure 4.40
- Add the values in the third column to find the expected value. Use this value to complete the fourth column.
- Add the values in the fourth column and take the square root of the sum.
39. On May 11, 2013, at 9:30 PM, the probability that moderate seismic activity (one moderate earthquake) would occur in the next 48 hours in Iran was about 21.42%. Suppose you make a bet that a moderate earthquake will occur in Iran during this period. If you win the bet, you win $50. If you lose the bet, you pay $20. Let X = the amount of profit from a bet.[8]
- P(win) = P(one moderate earthquake will occur) = 21.42%
- P(loss) = P(one moderate earthquake will not occur) = 100% – 21.42%
If you bet many times, will you come out ahead? Explain your answer in a complete sentence using numbers. What is the standard deviation of X? Construct a table similar to those in Questions 4 and 5 to help you answer these questions.
40. Complete the expected value table.
| x | P(x) | x*P(x) |
|---|---|---|
| 0 | 0.2 | |
| 1 | 0.2 | |
| 2 | 0.4 | |
| 3 | 0.2 |
Figure 4.41
41. Find the expected value from the expected value table. Find the standard deviation.
| x | P(x) | x*P(x) |
|---|---|---|
| 2 | 0.1 | 2(0.1) = 0.2 |
| 4 | 0.3 | 4(0.3) = 1.2 |
| 6 | 0.4 | 6(0.4) = 2.4 |
| 8 | 0.2 | 8(0.2) = 1.6 |
Figure 4.42
42. Identify the mistake in the probability distribution table.
| x | P(x) | x*P(x) |
|---|---|---|
| 1 | 0.15 | 0.15 |
| 2 | 0.25 | 0.50 |
| 3 | 0.30 | 0.90 |
| 4 | 0.20 | 0.80 |
| 5 | 0.15 | 0.75 |
Figure 4.43
43. Identify the mistake in the probability distribution table.
| x | P(x) | x*P(x) |
|---|---|---|
| 1 | 0.15 | 0.15 |
| 2 | 0.25 | 0.40 |
| 3 | 0.25 | 0.65 |
| 4 | 0.20 | 0.85 |
| 5 | 0.15 | 1 |
Figure 4.44
44. A physics professor wants to know what percent of physics majors will spend the next several years doing post-graduate research. He has the following probability distribution:
| x | P(x) | x*P(x) |
|---|---|---|
| 1 | 0.35 | |
| 2 | 0.20 | |
| 3 | 0.15 | |
| 4 | ||
| 5 | 0.10 | |
| 6 | 0.50 |
Figure 4.45
- Define the random variable X.
- Define P(x), or the probability of x.
- Find the probability that a physics major will do post-graduate research for four years. P(x = 4)
- Find the probability that a physics major will do post-graduate research for at most three years. P(x ≤ 3)
- On average, how many years would you expect a physics major to spend doing post-graduate research?
45. A ballet instructor is interested in knowing what percent of each year’s class will continue on to the next so that she can plan what classes to offer. Over the years, she has established a probability distribution.
- Let X = the number of years a student will study ballet with the teacher.
- Let P(x) = the probability that a student will study ballet x years.
Complete the figure below using the data provided.
| x | P(x) | x*P(x) |
|---|---|---|
| 1 | 0.10 | |
| 2 | 0.05 | |
| 3 | 0.10 | |
| 4 | ||
| 5 | 0.30 | |
| 6 | 0.20 | |
| 7 | 0.10 |
Figure 4.46
- In words, define the random variable X.
- Find P(x = 4).
- Find P(x < 4).
- On average, how many years would you expect a child to study ballet with this teacher?
- What does the column “P(x)” sum to and why?
- What does the column “x*P(x)” sum to and why?
46. You are playing a game by drawing a card from a standard deck and replacing it. If the card is a face card, you win $30. If it is not a face card, you pay $2. There are 12 face cards in a deck of 52 cards.
- What is the expected value of playing the game?
- Should you play the game?
47. A theater group holds a fundraiser. It sells 100 raffle tickets for $5 apiece. The prize is two passes to a Broadway show, worth a total of $150. Suppose you purchase four tickets.
- What are you interested in here?
- In words, define the random variable X.
- List the values that X may take on.
- Construct a PDF.
- If this fundraiser is repeated often and you always purchase four tickets, what would be your expected average winnings per raffle?
48. A game involves selecting a card from a regular 52-card deck and tossing a coin. The coin is a fair coin and is equally likely to land on heads or tails.
- If the card is a face card, and the coin lands on heads, you win $6.
- If the card is a face card, and the coin lands on tails, you win $2.
- If the card is not a face card, you lose $2, no matter what the coin shows.
- Find the expected value for this game (expected net gain or loss).
- Explain what your calculations indicate about your long-term average profits and losses on this game.
- Should you play this game to win money?
49. You buy a lottery ticket to a lottery that costs $10 per ticket. There are only 100 tickets available to be sold in this lottery. In this lottery, there are one $500 prize, two $100 prizes, and four $25 prizes. Find your expected gain or loss.
- Start by writing the probability distribution. X is net gain or loss = prize (if any) less $10 cost of ticket.
- Expected value = (490)(1,100) + (90)(2,100) + (15)(4,100) + (−10)(93,100) = −$2. There is an expected loss of $2 per ticket, on average.
Complete the PDF and answer the questions.
| x | P(x) | xP(x) |
|---|---|---|
| 0 | 0.3 | |
| 1 | 0.2 | |
| 2 | ||
| 3 | 0.4 |
Figure 4.47
- Find the probability that x = 2.
- Find the expected value.
50. Suppose that you are given a die to roll. If you roll a six, you win $10. If you roll a four or five, you win $5. If you roll a one, two, or three, you pay $6.
- What are you ultimately interested in here (the value of the roll or the money you win)?
- In words, define the random variable, X.
- List the values that X may take on.
- Construct a PDF.
- Over the long run of playing this game, what are your expected average winnings per game?
- Based on numerical values, should you take the deal? Explain your decision in complete sentences.
51. A venture capitalist willing to invest $1,000,000 has three investments from which to choose. The first investment, a software company, has a 10% chance of returning $5,000,000 profit, a 30% chance of returning $1,000,000 profit, and a 60% chance of losing the million dollars. The second company, a hardware company, has a 20% chance of returning $3,000,000 profit, a 40% chance of returning $1,000,000 profit, and a 40% chance of losing the million dollars. The third company, a biotech firm, has a 10% chance of returning $6,000,000 profit, a 70% of no profit or loss, and a 20% chance of losing the million dollars.
- Construct a PDF for each investment.
- Find the expected value for each investment.
- Which is the safest investment? Why do you think so?
- Which is the riskiest investment? Why do you think so?
- Which investment has the highest expected return, on average?
52. Suppose that 20,000 married adults in the United States were randomly surveyed as to the number of children they have. The results are compiled and are used as theoretical probabilities. Let X = the number of children married people have.
| x | P(x) | x*P(x) |
|---|---|---|
| 0 | 0.10 | |
| 1 | 0.20 | |
| 2 | 0.30 | |
| 3 | ||
| 4 | 0.10 | |
| 5 | 0.05 | |
| 6 (or more) | 0.05 |
Figure 4.48
- Find the probability that a married adult has three children.
- In words, what does the expected value in this example represent?
- Find the expected value.
- Is it more likely that a married adult will have two-to-three children or four-to-six children? How do you know?
53. Suppose that the PDF for the number of years it takes to earn a Bachelor of Science (BS) degree is given below.
| x | P(x) |
|---|---|
| 3 | 0.05 |
| 4 | 0.40 |
| 5 | 0.30 |
| 6 | 0.15 |
| 7 | 0.10 |
Figure 4.49
On average, how many years do you expect it to take for an individual to earn a BS?
54. People visiting video rental stores often rent more than one DVD at a time. The probability distribution for DVD rentals per customer at Video To Go is given in the following table. There is a five-video limit per customer at this store, so nobody ever rents more than five DVDs.
| x | P(x) |
|---|---|
| 0 | 0.30 |
| 1 | 0.50 |
| 2 | 0.24 |
| 3 | |
| 4 | 0.07 |
| 5 | 0.04 |
Figure 4.50
- Describe the random variable X in words.
- Find the probability that a customer rents three DVDs.
- Find the probability that a customer rents at least four DVDs.
- Find the probability that a customer rents at most two DVDs.
- Another shop, Entertainment Headquarters, rents DVDs and video games. The probability distribution for DVD rentals per customer at this shop is given as follows. They also have a five-DVD limit per customer.
x P(x) 0 0.35 1 0.25 2 0.20 3 0.10 4 0.05 5 0.05 Figure 4.51
At which store is the expected number of DVDs rented per customer higher?
- If Video to Go estimates that they will have 300 customers next week, how many DVDs do they expect to rent next week? Answer in sentence form.
- If Video to Go expects 300 customers next week, and Entertainment HQ projects that they will have 420 customers, for which store is the expected number of DVD rentals for next week higher? Explain.
- Which of the two video stores experiences more variation in the number of DVD rentals per customer? How do you know that?
55. A friend offers you the following deal.” For a $10 fee, you may pick an envelope from a box containing 100 seemingly identical envelopes. However, each envelope contains a coupon for a free gift.
- Ten of the coupons are for a free gift worth $6.
- Eighty of the coupons are for a free gift worth $8.
- Six of the coupons are for a free gift worth $12.
- Four of the coupons are for a free gift worth $40.
Based upon the financial gain or loss over the long run, should you play the game?
- Yes, I expect to come out ahead in money.
- No, I expect to come out behind in money.
- It doesn’t matter. I expect to break even.
56. Florida State University has 14 statistics classes scheduled for its Summer 2013 term. One class has space available for 30 students, eight classes have space for 60 students, one class has space for 70 students, and four classes have space for 100 students.[9]
- What is the average class size assuming each class is filled to capacity?
- Space is available for 980 students. Suppose that each class is filled to capacity, and select a statistics student at random. Let the random variable X equal the size of the student’s class. Define the PDF for X.
- Find the mean of X.
- Find the standard deviation of X.
57. In a lottery, there are 250 prizes of $5, 50 prizes of $25, and ten prizes of $100. Assuming that 10,000 tickets are to be issued and sold, what is a fair price to charge to break even?
Let X = the amount of money to be won on a ticket. The following table shows the PDF for X.
| x | P(x) |
|---|---|
| 0 | 0.969 |
| 5 |  |
| 25 |  |
| 100 |  |
Figure 4.52
Calculate the expected value of X.
4.3 The Binomial Distribution
1. The state health board is concerned about the amount of fruit available in school lunches. Forty-eight percent of schools in the state offer fruit in their lunches every day. This implies that 52% do not. What would a “success” be in this case?
2. A trainer is teaching a dolphin to do tricks. The probability that the dolphin successfully performs the trick is 35%, and the probability that the dolphin does not successfully perform the trick is 65%. Out of 20 attempts, you want to find the probability that the dolphin succeeds 12 times. State the probability question mathematically.
3. A fair, six-sided die is rolled ten times. Each roll is independent. You want to find the probability of rolling a one more than three times. State the probability question mathematically.
4. The lifetime risk of developing pancreatic cancer is about one in 78 (1.28%).[10] Suppose we randomly sample 200 people. Let X = the number of people who will develop pancreatic cancer.
- What is the probability distribution for X?
- Using the formulas, calculate the (i) mean and (ii) standard deviation of X.
- Find the probability that at most eight people develop pancreatic cancer.
- Is it more likely that five or six people will develop pancreatic cancer? Justify your answer numerically.
5. During the 2013 regular NBA season, DeAndre Jordan of the Los Angeles Clippers had the highest field goal completion rate in the league, scoring with 61.3% of his shots.[11] Suppose you choose a random sample of 80 shots made by DeAndre during the 2013 season. Let X = the number of shots that scored points.
- What is the probability distribution for X?
- Using the formulas, calculate the (i) mean and (ii) standard deviation of X.
- Find the probability that DeAndre scored with 60 of these shots.
- Find the probability that DeAndre scored with more than 50 of these shots.
6. A lacrosse team is selecting a captain. The names of all the seniors are put into a hat, and the first three that are drawn will be the captains. The names are not replaced once they are drawn (one person cannot be captain twice). You want to see if the captains all play the same position. State whether this is binomial or not, and state why.
7. The Higher Education Research Institute at UCLA collected data from 203,967 incoming first-time, full-time freshmen from 270 four-year colleges and universities in the US. Of those students, 71.3% replied that, yes, they believe that same-sex couples should have the right to legal marital status.[12] Suppose that you randomly pick eight first-time, full-time freshmen from the survey. You are interested in the number that believes that same sex-couples should have the right to legal marital status.
- In words, define the random variable X.
- X ~ ( , )
- What values does the random variable X take on?
- Construct the probability distribution function (PDF).
- On average (μ), how many would you expect to answer yes?
- What is the standard deviation (σ)?
- What is the probability that at most five of the freshmen reply “yes”?
- What is the probability that at least two of the freshmen reply “yes”?
8. According to a recent article, the average number of babies born with significant hearing loss (deafness) is approximately two per 1,000 babies in a healthy baby nursery. The number climbs to an average of 30 per 1,000 babies in an intensive care nursery. Suppose that 1,000 babies from healthy baby nurseries were randomly surveyed. Find the probability that exactly two babies were born deaf.
9. Recently, a nurse commented that, when a patient calls the medical advice line claiming to have the flu, the chance that he or she truly has the flu (and not just a nasty cold) is only about 4%. Of the next 25 patients calling in claiming to have the flu, we are interested in how many actually have the flu.
- Define the random variable, and list its possible values.
- State the distribution of X.
- Find the probability that at least four of the 25 patients actually have the flu.
- On average, for every 25 patients calling in, how many do you expect to have the flu?
10. A school newspaper reporter decides to randomly survey 12 students to see if they will attend Tet (Vietnamese New Year) festivities this year. Based on past years, she knows that 18% of students attend Tet festivities. We are interested in the number of students who will attend the festivities.
- In words, define the random variable X.
- List the values that X may take on.
- Give the distribution of X. X ~ ( , )
- How many of the 12 students do we expect to attend the festivities?
- Find the probability that at most four students will attend.
- Find the probability that more than two students will attend.
11. The probability that the San Jose Sharks will win any given game is 0.3694 based on a 13-year win history of 382 wins out of 1,034 games played (as of a certain date).[13] An upcoming monthly schedule contains 12 games.
a. The expected number of wins for that upcoming month is:
- 1.67
- 12

- 4.43
b. Let X = the number of games won in that upcoming month. What is the probability that the San Jose Sharks win six games in that upcoming month?
- 0.1476
- 0.2336
- 0.7664
- 0.8903
c. What is the probability that the San Jose Sharks win at least five games in that upcoming month?
- 0.3694
- 0.5266
- 0.4734
- 0.2305
12. A student takes a ten-question true-false quiz but did not study and randomly guesses each answer. Find the probability that the student passes the quiz with a grade of at least 70%.
13. A student takes a 32-question multiple-choice exam but did not study and randomly guesses each answer. Each question has three possible choices for the answer. Find the probability that the student guesses more than 75% of the questions correctly.
14. Six different colored dice are rolled. Of interest is the number of dice that show a one.
- In words, define the random variable X.
- List the values that X may take on.
- Give the distribution of X. X ~ ( , )
- On average, how many dice would you expect to show a one?
- Find the probability that all six dice show a one.
- Is it more likely that three or that four dice will show a one? Use numbers to justify your answer numerically.
15. More than 96% of the very largest colleges and universities (more than 15,000 total enrollments) have some online offerings. Suppose you randomly pick 13 such institutions. We are interested in the number that offer distance learning courses.
- In words, define the random variable X.
- List the values that X may take on.
- Give the distribution of X. X ~ ( , )
- On average, how many schools would you expect to offer such courses?
- Find the probability that at most ten offer such courses.
- Is it more likely that 12 or that 13 will offer such courses? Use numbers to justify your answer numerically and answer in a complete sentence.
16. Suppose that about 85% of graduating students attend their graduation. A group of 22 graduating students is randomly chosen.
- In words, define the random variable X.
- List the values that X may take on.
- Give the distribution of X. X ~ ( , )
- How many are expected to attend their graduation?
- Find the probability that 17 or 18 attend.
- Based on numerical values, would you be surprised if all 22 attended graduation? Justify your answer numerically.
17. At The Fencing Center, 60% of the fencers use the foil as their main weapon. We randomly survey 25 fencers at The Fencing Center. We are interested in the number of fencers who do not use the foil as their main weapon.
- In words, define the random variable X.
- List the values that X may take on.
- Give the distribution of X. X ~ ( , )
- How many are expected to not to use the foil as their main weapon?
- Find the probability that six do not use the foil as their main weapon.
- Based on numerical values, would you be surprised if all 25 did not use foil as their main weapon? Justify your answer numerically.
18. Approximately 8% of students at a local high school participate in after-school sports all four years of high school. A group of 60 seniors is randomly chosen. Of interest is the number who participated in after-school sports all four years of high school.
- In words, define the random variable X.
- List the values that X may take on.
- Give the distribution of X. X ~ ( , )
- How many seniors are expected to have participated in after-school sports all four years of high school?
- Based on numerical values, would you be surprised if none of the seniors participated in after-school sports all four years of high school? Justify your answer numerically.
- Based on numerical values, is it more likely that four or that five of the seniors participated in after-school sports all four years of high school? Justify your answer numerically.
19. The chance of an IRS audit for a tax return with over $25,000 in income is about 2% per year. We are interested in the expected number of audits a person with that income has in a 20-year period. Assume each year is independent.
- In words, define the random variable X.
- List the values that X may take on.
- Give the distribution of X. X ~ ( , )
- How many audits are expected in a 20-year period?
- Find the probability that a person is not audited at all.
- Find the probability that a person is audited more than twice.
20. It has been estimated that only about 30% of California residents have adequate earthquake supplies.[14] Suppose you randomly survey 11 California residents. We are interested in the number who have adequate earthquake supplies.
- In words, define the random variable X.
- List the values that X may take on.
- Give the distribution of X. X ~ ( , )
- What is the probability that at least eight have adequate earthquake supplies?
- Is it more likely that none or that all of the residents surveyed will have adequate earthquake supplies? Why?
- How many residents do you expect will have adequate earthquake supplies?
21. There are two similar games played for Chinese New Year and Vietnamese New Year. In the Chinese version, fair dice with numbers 1, 2, 3, 4, 5, and 6 are used, along with a board with those numbers. In the Vietnamese version, fair dice with pictures of a gourd, fish, rooster, crab, crayfish, and deer are used, along with a board with those six objects on it. We will play with bets being $1. The player places a bet on a number or object. The “house” rolls three dice. If none of the dice show the number or object that was bet, the house keeps the $1 bet. If one of the dice shows the number or object bet (and the other two do not show it), the player gets back their $1 bet, plus $1 profit. If two of the dice show the number or object bet (and the third die does not show it), the player gets back their $1 bet, plus $2 profit. If all three dice show the number or object bet, the player gets back their $1 bet, plus $3 profit. Let X = number of matches and Y = profit per game.
- In words, define the random variable X.
- List the values that X may take on.
- Give the distribution of X. X ~ ( , )
- List the values that Y may take on. Then, construct one PDF table that includes both X and Y and their probabilities.
- Calculate the average expected matches over the long run of playing this game for the player.
- Calculate the average expected earnings over the long run of playing this game for the player.
- Determine who has the advantage, the player or the house.
22. According to the World Bank, only 9% of the population of Uganda had access to electricity as of 2009. Suppose we randomly sample 150 people in Uganda. Let X = the number of people who have access to electricity.
- What is the probability distribution for X?
- Using the formulas, calculate the mean and standard deviation of X.
- Find the probability that 15 people in the sample have access to electricity.
- Find the probability that at most ten people in the sample have access to electricity.
- Find the probability that more than 25 people in the sample have access to electricity.
23. The literacy rate for a nation measures the proportion of people age 15 and over that can read and write. The literacy rate in Afghanistan is 28.1%. Suppose you choose 15 people in Afghanistan at random. Let X = the number of people who are literate.[15]
- Sketch a graph of the probability distribution of X.
- Using the formulas, calculate the (i) mean and (ii) standard deviation of X.
- Find the probability that more than five people in the sample are literate. Is it is more likely that three people or four people are literate?
24. Suppose you play a game that you can only either win or lose. The probability that you win any game is 55%, and the probability that you lose is 45%. Each game you play is independent. If you play the game 20 times, write the function that describes the probability that you win 15 of the 20 times. Here, if you define X as the number of wins, then X takes on the values 0, 1, 2, 3, …, 20. The probability of a success is p = 0.55. The probability of a failure is q = 0.45. The number of trials is n = 20. The probability question can be stated mathematically as P(x = 15).
25. A fair coin is flipped 15 times. Each flip is independent. What is the probability of getting more than ten heads? Let X = the number of heads in 15 flips of the fair coin. X takes on the values 0, 1, 2, 3, …, 15. Since the coin is fair, p = 0.5 and q = 0.5. The number of trials is n = 15. State the probability question mathematically.
4.4 Continuous Random Variables
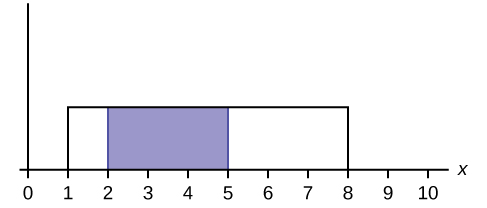
1. What does the shaded area represent? P(< x <)
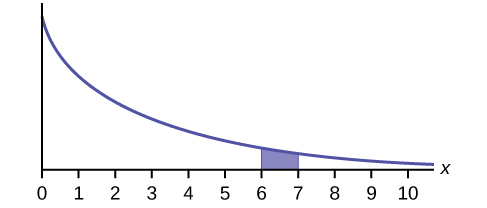
2. What does the shaded area represent? P(< x <)
3. For a continuous probability distribution, 0 ≤ x ≤ 15. What is P(x > 15)?
4. What is the area under f(x) if the function is a continuous probability density function?
5. For a continuous probability distribution, 0 ≤ x ≤ 10. What is P(x = 7)?
6. A continuous probability function is restricted to the portion between x = 0 and 7. What is P(x = 10)?
7. f(x) for a continuous probability function is , and the function is restricted to 0 ≤ x ≤ 5. What is P(x < 0)?
8. f(x) for a continuous probability function is equal to  , and the function is restricted to 0 ≤ x ≤ 12. What is P (0 < x < 12)?
9. You are one of 100 people enlisted to take part in a study to determine the percent of nurses in America with an RN (registered nurse) degree. You ask nurses if they have an RN degree. The nurses answer “yes” or “no.” You then calculate the percentage of nurses with an RN degree. You give that percentage to your supervisor.
- What part of the experiment will yield discrete data?
- What part of the experiment will yield continuous data?
- When age is rounded to the nearest year, do the data stay continuous, or do they become discrete? Why?
4.5 The Normal Distribution
1. The mean height of 15- to 18-year-old males from Chile from 2009 to 2010 was 170 cm with a standard deviation of 6.28 cm.[16] Male heights are known to follow a normal distribution. Let X = the height of a 15- to 18-year-old male from Chile in 2009 to 2010. Then, X ~ N(170, 6.28).
- Suppose a 15- to 18-year-old male from Chile was 168 cm tall from 2009 to 2010. The z-score when x = 168 cm is z = . This z-score tells you that x = 168 is standard deviations to the (right or left) of the mean, which is .
- Suppose that the height of a 15- to 18-year-old male from Chile from 2009 to 2010 has a z-score of z = 1.27. What is the male’s height? The z-score (z = 1.27) tells you that the male’s height is standard deviations to the (right or left) of the mean.
2. Use the information in Question 1 to answer the following questions.
- Suppose a 15- to 18-year-old male from Chile was 176 cm tall from 2009 to 2010. The z-score when x = 176 cm is z = . This z-score tells you that x = 176 cm is standard deviations to the (right or left) of the mean, which is .
- Suppose that the height of a 15- to 18-year-old male from Chile from 2009 to 2010 has a z-score of z = –2. What is the male’s height? The z-score (z = –2) tells you that the male’s height is standard deviations to the (right or left) of the mean.
3. In 2012, 1,664,479 students took the SAT exam. The distribution of scores in the verbal section of the SAT had a mean µ = 496 and a standard deviation σ = 114.[17] Let X = a SAT exam verbal section score in 2012. Then, X ~ N(496, 114). Find the z-scores for x1 = 325 and x2 = 366.21. Interpret each z-score. What can you say about x1 = 325 and x2 = 366.21 in comparison to their respective means and standard deviations?
4. What is the z-score of x when x = 1 and X ~ N(12, 3)?
5. Some doctors believe that a person can lose five pounds, on the average, in a month by reducing their fat intake and by exercising consistently.[18] Suppose weight loss has a normal distribution. Let X = the amount of weight lost (in pounds) by a person in a month. Use a standard deviation of two pounds. X ~ N(5, 2). Fill in the blanks.
- Suppose a person lost ten pounds in a month. The z-score when x = 10 pounds is z = 2.5 (verify). This z-score tells you that x = 10 is [?] standard deviations to the [right/left] of the mean, which is [?].
- Suppose a person gained three pounds (a negative weight loss). Then z = [?]. This z-score tells you that x = –3 is [?] standard deviations to the [right/left] of the mean.
- Suppose the random variables X and Y have the following normal distributions: X ~ N(5, 6) and Y ~ N(2, 1). If x = 17, then z = 2; if y = 4, what is z?
6. Jerome averages 16 points a game with a standard deviation of four points. X ~ N(16, 4). Suppose Jerome scores ten points in a game. The z–score when x = 10 is –1.5. This score tells you that x = 10 is [?] standard deviations to the [right/left] of the mean, which is [?].
7. From 1984 to 1985, the mean height of 15- to 18-year-old males from Chile was 172.36 cm, and the standard deviation was 6.34 cm.[19] Let Y = the height of 15- to 18-year-old males from 1984 to 1985. Then, Y ~ N(172.36, 6.34).
The mean height of 15- to 18-year-old males from Chile from 2009 to 2010 was 170 cm with a standard deviation of 6.28 cm. Male heights are known to follow a normal distribution. Let X = the height of a 15- to 18-year-old male from Chile in 2009 to 2010. Then, X ~ N(170, 6.28).
Find the z-scores for x = 160.58 cm and y = 162.85 cm. Interpret each z-score. What can you say about x = 160.58 cm and y = 162.85 cm in comparison to their respective means and standard deviations?
8. In 2012, 1,664,479 students took the SAT exam.[20] The distribution of scores in the verbal section of the SAT had a mean µ = 496 and a standard deviation σ = 114. Let X = a SAT exam verbal section score in 2012. Then, X ~ N(496, 114). Find the z-scores for x1 = 325 and x2 = 366.21. Interpret each z-score. What can you say about x1 = 325 and x2 = 366.21 in comparison to their respective means and standard deviations?
9. Suppose X has a normal distribution with mean 25 and standard deviation five. Between what values of x do 68% of the values lie?
10. The scores on a college entrance exam have an approximate normal distribution with mean µ = 52 points and a standard deviation σ = 11 points.
- About 68% of the y values lie between what two values? What are the respective z-scores?
- About 95% of the y values lie between what two values? What are the respective z-scores?
- About 99.7% of the y values lie between what two values? What are the respective z-scores?
11. A bottle of water contains 12.05 fluid ounces with a standard deviation of 0.01 ounces. Define the random variable X in words.
12. A normal distribution has a mean of 61 and a standard deviation of 15. What is the median?
13. X ~ N(1, 2). σ =
14. A company manufactures rubber balls. The mean diameter of a ball is 12 cm with a standard deviation of 0.2 cm. Define the random variable X in words.
15. X ~ N(–4, 1). What is the median?
16. X ~ N(3, 5). σ =
17. X ~ N(–2, 1). μ =
18. What does a z-score measure?
19. What does standardizing a normal distribution do to the mean?
20. Is X ~ N(0, 1) a standardized normal distribution? Why or why not?
21. What is the z-score of x = 12 if it is two standard deviations to the right of the mean?
22. What is the z-score of x = 9 if it is 1.5 standard deviations to the left of the mean?
23. What is the z-score of x = –2 if it is 2.78 standard deviations to the right of the mean?
24. What is the z-score of x = 7 if it is 0.133 standard deviations to the left of the mean?
25. Suppose X ~ N(2, 6). What value of x has a z-score of three?
26. Suppose X ~ N(8, 1). What value of x has a z-score of –2.25?
27. Suppose X ~ N(9, 5). What value of x has a z-score of –0.5?
28. Suppose X ~ N(2, 3). What value of x has a z-score of –0.67?
29. Suppose X ~ N(4, 2). What value of x is 1.5 standard deviations to the left of the mean?
30. Suppose X ~ N(4, 2). What value of x is two standard deviations to the right of the mean?
31. Suppose X ~ N(8, 9). What value of x is 0.67 standard deviations to the left of the mean?
32. Suppose X ~ N(–1, 2). What is the z-score of x = 2?
33. Suppose X ~ N(12, 6). What is the z-score of x = 2?
34. Suppose X ~ N(9, 3). What is the z-score of x = 9?
35. Suppose a normal distribution has a mean of six and a standard deviation of 1.5. What is the z-score of x = 5.5?
36. In a normal distribution, x = 5 and z = –1.25. This tells you that x = 5 is standard deviations to the (right or left) of the mean.
37. In a normal distribution, x = 3 and z = 0.67. This tells you that x = 3 is standard deviations to the (right or left) of the mean.
38. In a normal distribution, x = –2 and z = 6. This tells you that x = –2 is standard deviations to the (right or left) of the mean.
39. In a normal distribution, x = –5 and z = –3.14. This tells you that x = –5 is standard deviations to the (right or left) of the mean.
40. In a normal distribution, x = 6 and z = –1.7. This tells you that x = 6 is standard deviations to the (right or left) of the mean.
41. About what percent of x values from a normal distribution lie within one standard deviation (left and right) of the mean of that distribution?
42. About what percent of the x values from a normal distribution lie within two standard deviations (left and right) of the mean of that distribution?
43. About what percent of x values lie between the second and third standard deviations (both sides)?
44. Suppose X ~ N(15, 3). Between what x values does 68.27% of the data lie? The range of x values is centered at the mean of the distribution (i.e., 15).
45. Suppose X ~ N(–3, 1). Between what x values does 95.45% of the data lie? The range of x values is centered at the mean of the distribution (i.e., –3).
46. Suppose X ~ N(–3, 1). Between what x values does 34.14% of the data lie?
47. About what percent of x values lie between the mean and three standard deviations?
48. About what percent of x values lie between the mean and one standard deviation?
49. About what percent of x values lie between the first and second standard deviations from the mean (both sides)?
50. About what percent of x values lie between the first and third standard deviations (both sides)?
51. The life of Sunshine CD players is normally distributed with mean of 4.1 years and a standard deviation of 1.3 years. A CD player is guaranteed for three years. We are interested in the length of time a CD player lasts.
- Define the random variable X in words.
- X ~ ( , )
52. The patient recovery time from a particular surgical procedure is normally distributed with a mean of 5.3 days and a standard deviation of 2.1 days.
- What is the median recovery time?
- What is the z-score for a patient who takes ten days to recover?
53. The length of time to find it takes to find a parking space at 9 AM follows a normal distribution with a mean of five minutes and a standard deviation of two minutes. If the mean is significantly greater than the standard deviation, which of the following statements is true?
- The data cannot follow the uniform distribution.
- The data cannot follow the exponential distribution.
- The data cannot follow the normal distribution.
- I only
- II only
- III only
- I, II, and III
54. The heights of the 430 National Basketball Association players were listed on team rosters at the start of the 2005–2006 season. The heights of basketball players have an approximate normal distribution with mean µ = 79 inches and standard deviation σ = 3.89 inches.[21] For each of the following heights, calculate the z-score and interpret it using complete sentences.
- 77 inches
- 85 inches
- If an NBA player reported his height had a z-score of 3.5, would you believe him? Explain your answer.
55. The systolic blood pressure (given in millimeters) of males has an approximately normal distribution with mean µ = 125 and standard deviation σ = 14. Systolic blood pressure for males follows a normal distribution.[22]
- Calculate the z-scores for the male systolic blood pressures 100 and 150 millimeters.
- If a male friend of yours said he thought his systolic blood pressure was 2.5 standard deviations below the mean, but that he believed his blood pressure was between 100 and 150 millimeters, what would you say to him?
56. Kyle’s doctor told him that the z-score for his systolic blood pressure is 1.75. The systolic blood pressure (given in millimeters) of males has an approximately normal distribution with mean µ = 125 and standard deviation σ = 14. If X = a systolic blood pressure score, then X ~ N (125, 14). Which of the following is the best interpretation of Kyle’s standardized score?
- Which answer(s) is/are correct?
- Kyle’s systolic blood pressure is 175.
- Kyle’s systolic blood pressure is 1.75 times the average blood pressure of men his age.
- Kyle’s systolic blood pressure is 1.75 above the average systolic blood pressure of men his age.
- Kyle’s systolic blood pressure is 1.75 standard deviations above the average systolic blood pressure for men.
- Calculate Kyle’s blood pressure.
57. In 2005, 1,475,623 students heading to college took the SAT. The distribution of scores in the math section of the SAT follows a normal distribution with mean µ = 520 and standard deviation σ = 115.[23]
- Calculate the z-score for an SAT score of 720. Interpret it using a complete sentence.
- What math SAT score is 1.5 standard deviations above the mean? What can you say about this SAT score?
- For 2012, the SAT math test had a mean of 514 and standard deviation of 117. The ACT math test is an alternate to the SAT and is approximately normally distributed with mean 21 and standard deviation 5.3.[24] If one person took the SAT math test and scored 700 and a second person took the ACT math test and scored 30, who did better with respect to the test they took?
4.6 The Normal Approximation to the Binomial
1. Suppose in a local kindergarten through 12th grade (K-12) school district, 53% of the population favor a charter school for Grades K through 5. A simple random sample of 300 is surveyed.
- Find the probability that at least 150 favor a charter school.
- Find the probability that at most 160 favor a charter school.
- Find the probability that more than 155 favor a charter school.
- Find the probability that fewer than 147 favor a charter school.
- Find the probability that exactly 175 favor a charter school.
2. In a city, 46% of the population favor the incumbent, Dawn Morgan, for mayor. A simple random sample of 500 is taken. Using the continuity correction factor, find the probability that at least 250 favor Dawn Morgan for mayor.
Figure Descriptions
Figure 4.25: Horizontal bar chart detailing emotional health score index with occupation on the y axis and values 77-85 on the x axis. In ascending order: service, transportation, manufacturing or production, sales, clerical or office, installation or repair, construction or mining, manager/executive/official, business owner, nurse, professional, farming/fishing/forestry, K-12 teacher, physician
Figure 4.28: Pie chart: four red, two blue, one yellow, one green
Figure 4.29: Total sample: 1045, total percent approve: 40, total percent disapprove: 60. 18-34 sample: 82, 18-34 percent approve: 30, 18-38 percent disapprove: 70. 35-44 sample: 138, 35-44 percent approve: 41, 35-44 percent disapprove: 59. 45-54 sample: 226, 45-54 percent approve: 45, 45-54 percent disapprove: 55. 55-64 sample: 268, 55-64 percent approve: 49, 55-64 percent disapprove: 51. 65+ sample: 331, 65+ percent approve: 48, 65+ percent disapprove: 52. Male sample: 478, Male percent approve: 44, Male percent disapprove: 56. Female sample: 567, Female percent approve: 37, Female percent disapprove: 63.
Figure 4.30: Roulette table with numbers one through 36 in alternating red and black colors (starting with red).
Figure 4.53: This graph shows a uniform distribution. The horizontal axis ranges from zero to 10. The distribution is modeled by a rectangle extending from x = one to x = eight. A region from x = two to x = five is shaded inside the rectangle.
Figure 4.54: This graph shows an exponential distribution. The graph slopes downward. It begins at a point on the y-axis and approaches the x-axis at the right edge of the graph. The region under the graph from x = six to x = seven is shaded.
References
Figures
Figure 4.25: Figure 3.15.18 from LibreTexts Business Statistics (2021) (CC BY 4.0). Retrieved from https://stats.libretexts.org/Bookshelves/Applied_Statistics/Business_Statistics_(OpenStax)/03%3A_Probability_Topics/3.15%3A_Homework
Figure 4.28: Figure 3.10 from OpenStax Introductory Statistics (2013) (CC BY 4.0). Retrieved from https://openstax.org/books/introductory-statistics/pages/3-practice
Figure 4.29: Figure 3.11 from OpenStax Introductory Statistics (2013) (CC BY 4.0). Retrieved from https://openstax.org/books/introductory-statistics/pages/3-homework
Figure 4.30: Figure 3.13 from OpenStax Introductory Statistics (2013) (CC BY 4.0). Retrieved from https://openstax.org/books/introductory-statistics/pages/3-homework
Figure 4.53: Figure 5.26 from OpenStax Introductory Business Statistics (2012) (CC BY 4.0). Retrieved from https://openstax.org/books/introductory-business-statistics/pages/5-practice
Figure 4.54: Figure 5.27 from OpenStax Introductory Business Statistics (2012) (CC BY 4.0). Retrieved from https://openstax.org/books/introductory-business-statistics/pages/5-practice
Text
Class Catalogue at the Florida State University. Available online at https://apps.oti.fsu.edu/RegistrarCourseLookup/SearchFormLegacy (accessed May 15, 2013).
“World Earthquakes: Live Earthquake News and Highlights,” World Earthquakes, 2012. http://www.world-earthquakes.com/index.php?option=ethq_prediction (accessed May 15, 2013).
“Access to electricity (% of population),” The World Bank, 2013. Available online at http://data.worldbank.org/indicator/EG.ELC.ACCS.ZS?order=wbapi_data_value_2009%20wbapi_data_value%20wbapi_data_value-first&sort=asc (accessed May 15, 2015).
“Distance Education,” Wikipedia. Available online at http://en.wikipedia.org/wiki/Distance_education (accessed May 15, 2013).
“NBA Statistics – 2013,” ESPN NBA, 2013. Available online at http://espn.go.com/nba/statistics/_/seasontype/2 (accessed May 15, 2013).
Newport, Frank. “Americans Still Enjoy Saving Rather than Spending: Few demographic differences seen in these views other than by income,” Gallup Economy, 2013. Available online at http://www.gallup.com/poll/162368/americans-enjoy-saving-rather-spending.aspx (accessed May 15, 2013).
Pryor, John H., Linda DeAngelo, Laura Palucki Blake, Sylvia Hurtado, and Serge Tran. “The American Freshman: National Norms Fall 2011.” Los Angeles: Cooperative Institutional Research Program at the Higher Education Research Institute at UCLA, 2011. Also available online at http://heri.ucla.edu/PDFs/pubs/TFS/Norms/Monographs/TheAmericanFreshman2011.pdf (accessed May 15, 2013).
“The World FactBook,” Central Intelligence Agency. Available online at https://www.cia.gov/library/publications/the-world-factbook/geos/af.html (accessed May 15, 2013).
“What are the key statistics about pancreatic cancer?” American Cancer Society, 2013. Available online at http://www.cancer.org/cancer/pancreaticcancer/detailedguide/pancreatic-cancer-key-statistics (accessed May 15, 2013).
“Blood Pressure of Males and Females,” StatCruch, 2013. Available online at http://www.statcrunch.com/5.0/viewreport.php?reportid=11960 (accessed May 14, 2013).
“The Use of Epidemiological Tools in Conflict-affected populations: Open-access educational resources for policy-makers: Calculation of z-scores,” London School of Hygiene and Tropical Medicine, 2009. Available online at http://conflict.lshtm.ac.uk/page_125.htm (accessed May 14, 2013).
“2012 College-Bound Seniors Total Group Profile Report,” CollegeBoard, 2012. Available online at http://media.collegeboard.com/digitalServices/pdf/research/TotalGroup-2012.pdf (accessed May 14, 2013).
“Digest of Education Statistics: ACT score average and standard deviations by sex and race/ethnicity and percentage of ACT test takers, by selected composite score ranges and planned fields of study: Selected years, 1995 through 2009,” National Center for Education Statistics. Available online at http://nces.ed.gov/programs/digest/d09/tables/dt09_147.asp (accessed May 14, 2013).
Data from the San Jose Mercury News.
Data from The World Almanac and Book of Facts.
“List of stadiums by capacity,” Wikipedia. Available online at https://en.wikipedia.org/wiki/List_of_stadiums_by_capacity (accessed May 14, 2013).
Data from the National Basketball Association. Available online at www.nba.com (accessed May 14, 2013).
- Data from San Jose Mercury News. ↵
- DiCamillo, Mark, and Mervin Field. “The File Poll,” Field Research Corporation. Available online at https://web.archive.org/web/20130512064934/http://www.field.com/fieldpollonline/subscribers/Rls2443.pdf (accessed May 12, 2013). ↵
- Rider, David. “Ford support plummeting, poll suggests,” The Star, September 14, 2011. Available online at http://www.thestar.com/news/gta/2011/09/14/ford_support_plummeting_poll_suggests.html (accessed May 2, 2013). ↵
- “Roulette.” Wikipedia. Available online at http://en.wikipedia.org/wiki/Roulette (accessed May 2, 2013). ↵
- Shin, Hyon B., and Robert A. Kominski. “Language Use in the United States: 2007.” United States Census Bureau. Available online at http://www.census.gov/hhes/socdemo/language/data/acs/ACS-12.pdf (accessed May 2, 2013). ↵
- Data from the Baseball-Almanac, 2013. Available online at www.baseball-almanac.com (accessed May 2, 2013). ↵
- “Human Blood Types,” United Blood Services, 2011. Available online at https://web.archive.org/web/20130807103902/http://www.unitedbloodservices.org/learnMore.aspx (accessed August 22, 2013). ↵
- “World Earthquakes: Live Earthquake News and Highlights,” World Earthquakes, 2012. http://www.worldearthquakes.com/index.php?option=ethq_prediction (accessed May 15, 2013). ↵
- Class Catalogue at the Florida State University. Available online at https://apps.oti.fsu.edu/RegistrarCourseLookup/SearchFormLegacy (accessed May 15, 2013). ↵
- “What are the key statistics about pancreatic cancer?” American Cancer Society, 2013. Available online at http://www.cancer.org/cancer/pancreaticcancer/detailedguide/pancreatic-cancer-key-statistics (accessed May 15, 2013). ↵
- “NBA Statistics – 2013,” ESPN NBA, 2013. Available online at http://espn.go.com/nba/statistics/_/seasontype/2 (accessed May 15, 2013). ↵
- Pryor, John H., Linda DeAngelo, Laura Palucki Blake, Sylvia Hurtado, and Serge Tran. "The American Freshman: National Norms Fall 2011." Los Angeles: Cooperative Institutional Research Program at the Higher Education Research Institute at UCLA, 2011. Also available online at http://heri.ucla.edu/PDFs/pubs/TFS/Norms/Monographs/TheAmericanFreshman2011.pdf (accessed May 15, 2013). ↵
- "San Jose Sharks History," Hockey Reference. Available online at https://www.hockey-reference.com/teams/SJS/history.html (accessed January 26, 2021). ↵
- “World Earthquakes: Live Earthquake News and Highlights,” World Earthquakes, 2012. http://www.worldearthquakes.com/index.php?option=ethq_prediction (accessed May 15, 2013). ↵
- UNICEF reports on Female Literacy Centers in Afghanistan established to teach women and girls basic resading [sic] and writing skills,” UNICEF Television. Video available online at http://www.unicefusa.org/assets/video/afghan-femaleliteracy-centers.html (accessed May 15, 2013). ↵
- Data from The World Almanac and Book of Facts. ↵
- “2012 College-Bound Seniors Total Group Profile Report,” CollegeBoard, 2012. Available online at http://media.collegeboard.com/digitalServices/pdf/research/TotalGroup-2012.pdf (accessed May 14, 2013). ↵
- McDougall, John A. The McDougall Program for Maximum Weight Loss. Plume, 1995. ↵
- Data from The World Almanac and Book of Facts. ↵
- “2012 College-Bound Seniors Total Group Profile Report,” CollegeBoard, 2012. Available online at http://media.collegeboard.com/digitalServices/pdf/research/TotalGroup-2012.pdf (accessed May 14, 2013). ↵
- Data from the National Basketball Association. Available online at www.nba.com (accessed May 14, 2013). ↵
- “Blood Pressure of Males and Females,” StatCruch, 2013. Available online at http://www.statcrunch.com/5.0/viewreport.php?reportid=11960 (accessed May 14, 2013). ↵
- “2012 College-Bound Seniors Total Group Profile Report,” CollegeBoard, 2012. Available online at http://media.collegeboard.com/digitalServices/pdf/research/TotalGroup-2012.pdf (accessed May 14, 2013). ↵
- “Digest of Education Statistics: ACT score average and standard deviations by sex and race/ethnicity and percentage of ACT test takers, by selected composite score ranges and planned fields of study: Selected years, 1995 through 2009,” National Center for Education Statistics. Available online at http://nces.ed.gov/programs/digest/d09/tables/dt09_147.asp (accessed May 14, 2013). ↵
