Chapter 16 Hospitality and Tourism
Learning Objectives
- Understand what tourism is: definition, components, and importance.
- Understand the economic, social, and environmental benefits and costs of tourism.
- Define hospitality and the pineapple tradition.
- Identify the types of hotel categories and how they are determined.
- Examine the different categories of food service operations.
- Understand the different types of events, meetings, and conventions.
Tourism

The tourism industry is often cited as the largest industry in the world, contributing 10 percent of the world’s GDP. In 2016 there were over 1.2 billion international tourists: that’s a substantial economic impact and movement of goods and services![1] Tourism is also considered an export and is unique in that the consumers come to the product where it is consumed on-site. Before we dig any deeper, let’s explore what the term “tourism” means.
Definition of Tourism
There are a number of ways tourism can be defined. The United Nations World Tourism Organization (UNWTO) embarked on a project from 2005 to 2007 to create a common glossary of terms for tourism. It defines tourism as follows:
A social, cultural and economic phenomenon which entails the movement of people to countries or places outside their usual environment for personal or business/professional purposes. These people are called visitors (which may be either tourists or excursionists; residents or non-residents) and tourism has to do with their activities, some of which imply tourism expenditure.[2]
In other words, tourism is the movement of people for a number of purposes (whether business or pleasure). It is important to understand the various groups and constituencies involved in this movement. Of course it includes the tourist, but also the vast array of businesses providing goods and services for the tourist, the government and political structure of a destination, and the local residents of the destination community itself. Each of these components are necessary parts of a successful tourism destination and operate within private and public sectors, the built environment, and the natural environment. All these come together to create the processes, activities, and outcomes of tourism.
If it all seems a little overwhelming, it might be helpful to break tourism down into broad industry groups, each of which will be covered in this chapter:
- Accommodation and Lodging
- Food and Beverage Services (F & B)
- Recreation and Entertainment
- Convention & Event Management
- Travel Services
- Private Clubs
Benefits and Costs of Tourism
Tourism impacts can be grouped into three main categories: economic, social, and environmental. These impacts are analyzed using data gathered by businesses, governments, and industry organizations. Some impacts gain more attention than others. It is also important to recognize that different groups and constituencies are impacted differently.
Economic Impacts of Tourism
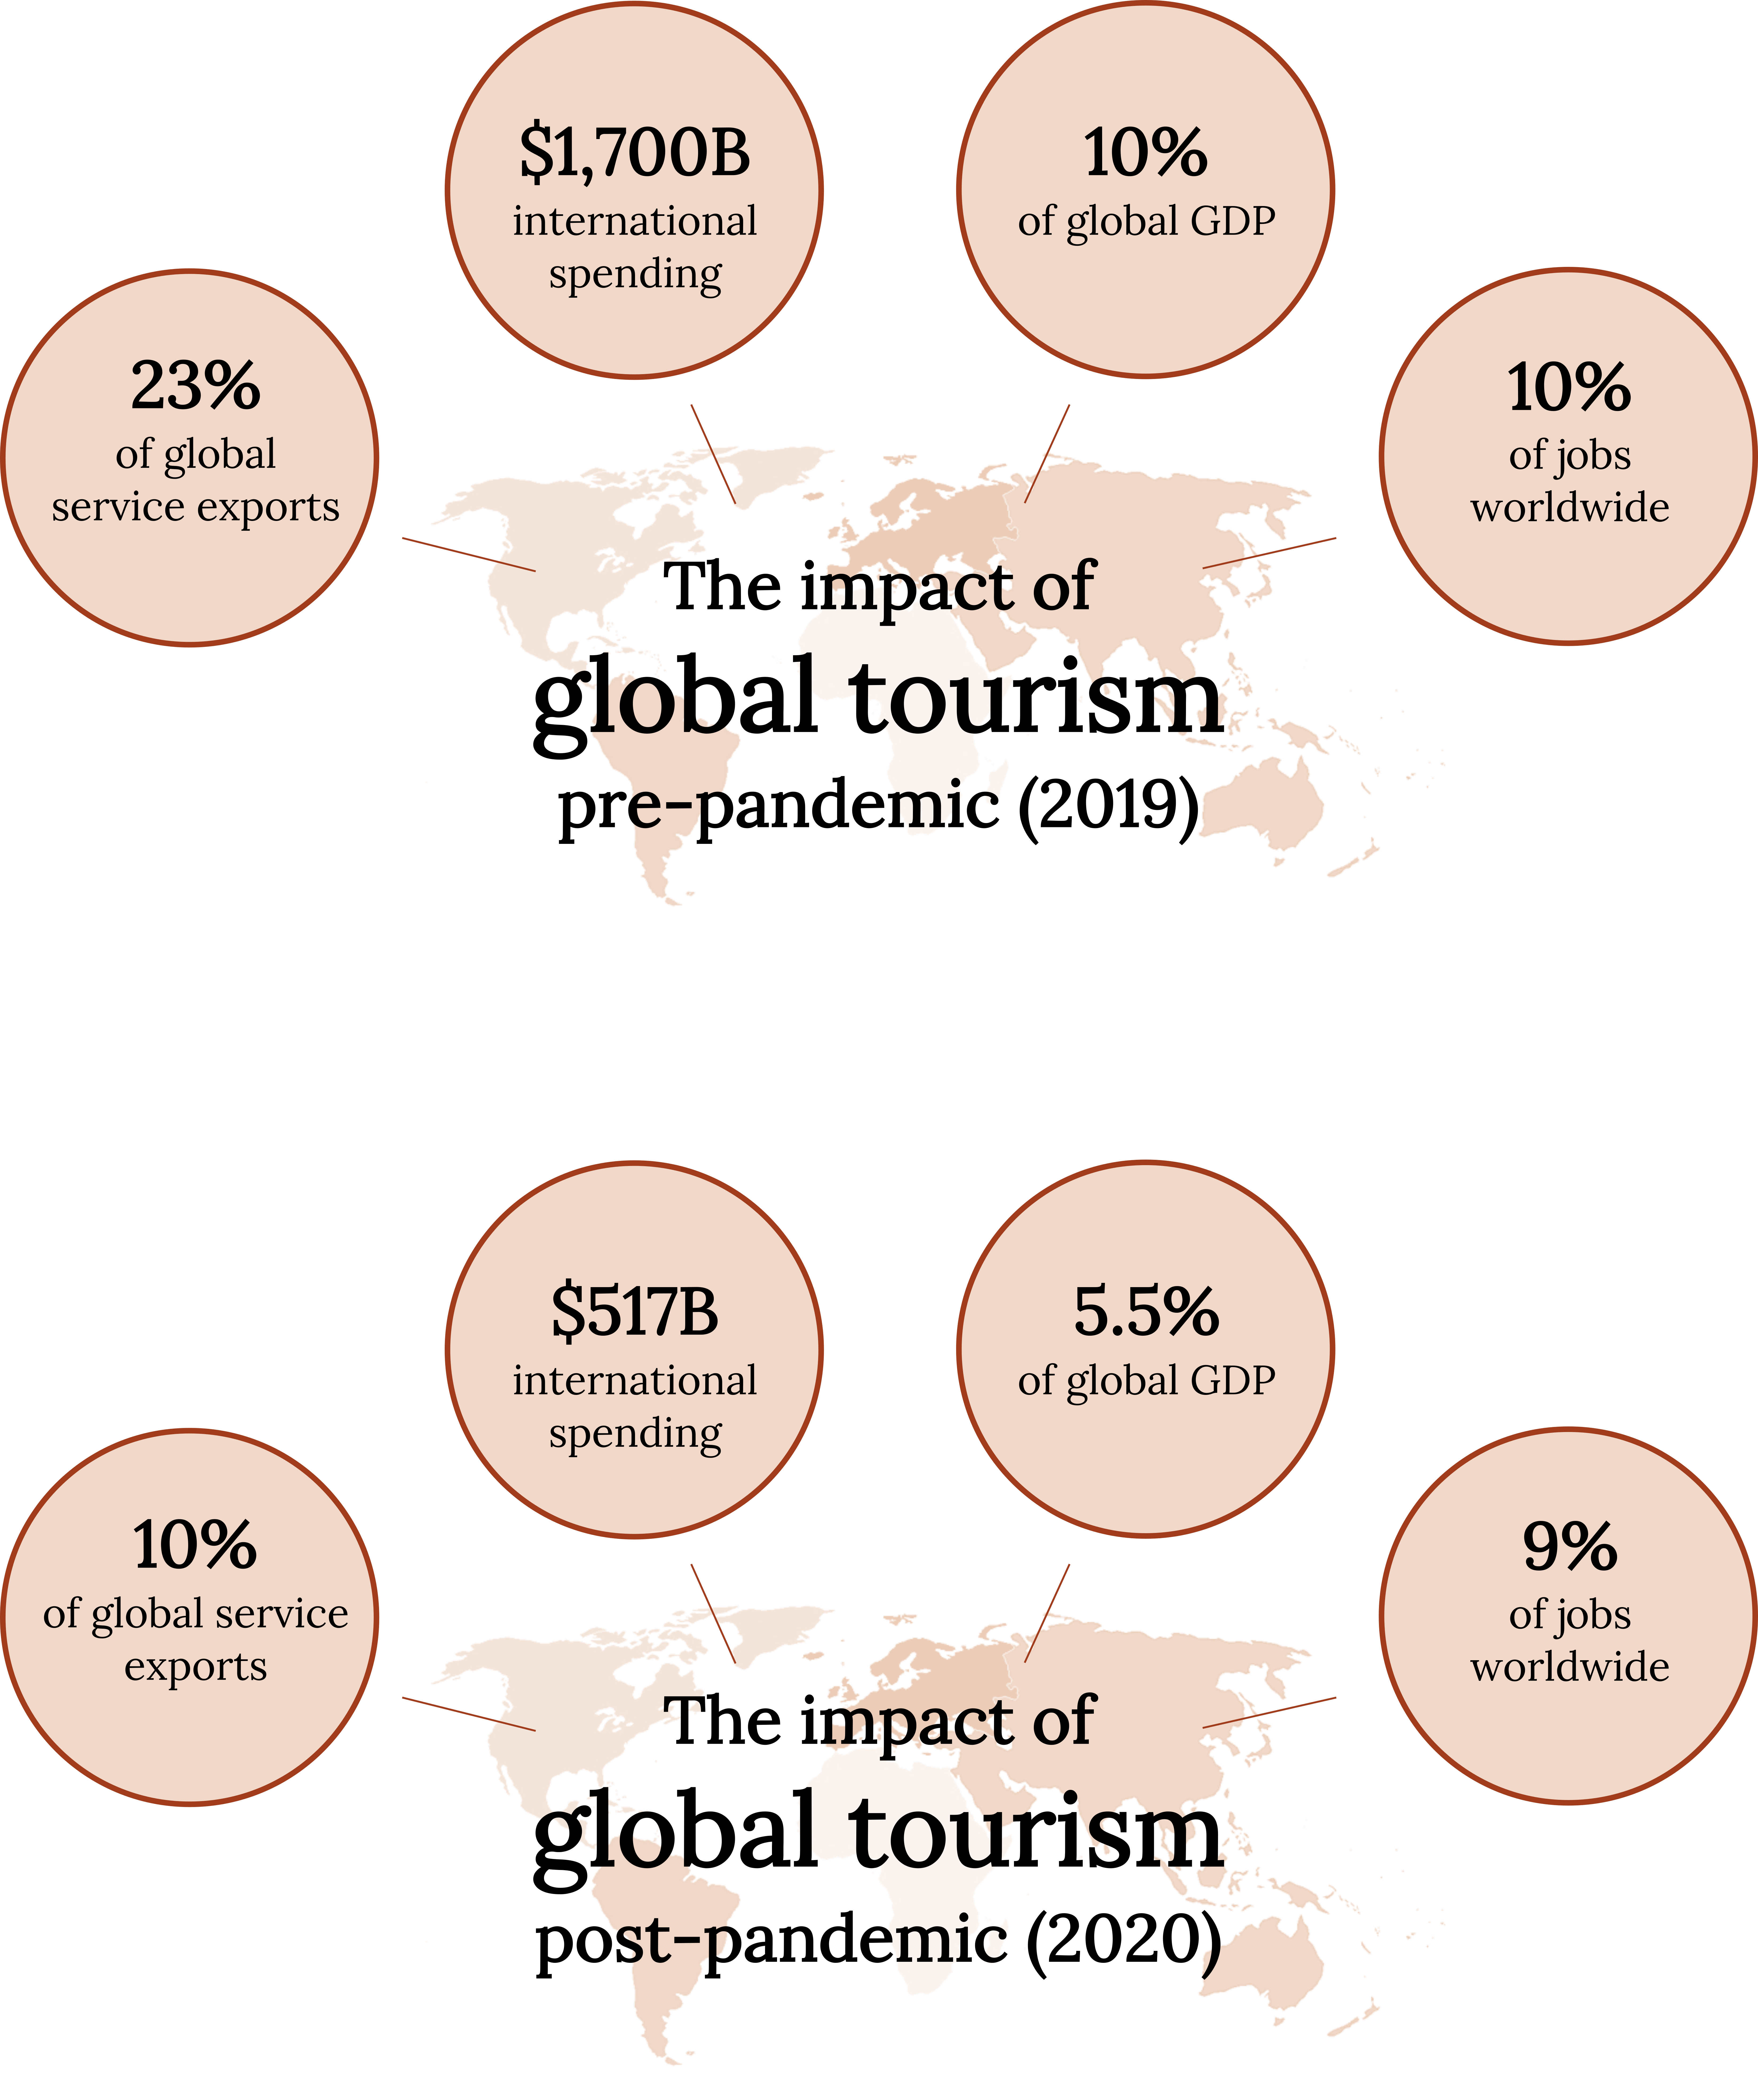
The tourism industry has a huge economic impact that continues to expand to new markets and destinations. According to the UNWTO, in 2016 “The total export value from international tourism amounted to US$ 1.5 trillion.”[3] Regions with the highest growth in terms of tourism dollars earned (2016 vs 2015) are Africa, Asia and the Pacific, the Americas Europe. Only the Middle East posted negative growth at the time of the report. As well, the UNWTO’s Tourism 2030 Vision report predicts that international arrivals will reach nearly 1.8 billion by 2030.[4] Figure 16.2 provides additional information about the impact of tourism worldwide. The global pandemic of 2020 which limited or in some cases ceased any citizen travel has had a direct and significant impact on global tourism, as outlined in Figure 16.2.
Positive impacts from the prior economic boom include robust foreign exchange, increases in income, and GDP growth. Tourism can also offer diverse employment opportunities, can be developed with local products, and is often compatible with other economic activities within a destination. Tourism often injects money into the community that leads to secondary economic development as well. For example, successful resorts may create the need for a commercial laundry facility or a pet boarding business.
However, there are also negative impacts. Property values may increase to the point of unaffordability for local residents, and the seasonality of the tourism industry may create a feast-or-famine economy. As with any economy, if too many resources are focused on just one industry, communities may be vulnerable to any unexpected economic, social, or environmental changes. One example is the New Jersey shore after the devastation of Hurricane Sandy in 2012. The tourism industry was severely impacted, leaving no economic fallback for local residents.
Social Impacts of Tourism
In addition to the economic benefits of tourism development, positive social impacts include an increase in amenities (e.g., parks, recreation facilities), investment in arts, culture, heritage and tradition, celebration of indigenous communities, and community pride. Tourism also has the potential to break down language, socio-cultural, religious, and political barriers. When developed conscientiously, tourism can, and does, contribute to a positive quality of life for residents and promotes a positive image of the destination.
However, as identified by the United Nations Environment Programme, negative social impacts of tourism can include: change or loss of indigenous identity and values; culture clashes; changes in family structure; conflict within the community for the tourism dollar; and ethical issues, including an increase in sex tourism, crime, gambling, and/or the exploitation of child workers.[5]
Environmental Impacts of Tourism
Tourism relies on, and greatly impacts, the natural environment in which it operates. In some destinations, there is a great appreciation of the environmental resources as the source of the tourism industry, and as such there are environmental protection policies and plans in place. Tourism has helped to save many delicate ecosystems and their flora and fauna. Preservation of these important resources benefits not only the tourist but also the local residents as well.
Even though many areas of the world are conserved in the form of parks and protected areas, tourism development can still have severe negative economic impacts. According to The United Nations Environment Programme, these can include the depletion of natural resources (water, forests, etc.), pollution (air pollution, noise, sewage, waste and littering), and physical impacts (construction activities, marina development, trampling, loss of biodiversity, and spread of disease).[6]
The environmental impacts of tourism can reach beyond local areas and have an effect on the global ecosystem. One example is increased air travel, which is often identified as a major contributor to climate change.
Whether positive or negative, tourism is a force for change around the world, and the industry is transforming at a staggering rate.
Accommodation and Lodging
The Hospitality Industry
When looking at tourism it is important to consider the term hospitality. Some define hospitality as “the business of helping people to feel welcome and relaxed and to enjoy themselves.”[7] Simply put, the hospitality industry is the combination of the accommodation and food and beverage groupings, collectively making up the largest segment of the industry.

The pineapple has long been the symbol of hospitality. The Caribs, indigenous people of the Lower Antilles in the Caribbean, first used it as such a symbol. The Spaniards knew they were welcome if a pineapple was placed at the entrance to the village. This symbolism spread across Europe and North America where it became the custom to carve the shape of a pineapple into the columns of residences.[8] It is now common to see the image of the pineapple as a sign of welcome, warmth and hospitality.
The types of employees and resources required to run an accommodation business—whether it be a hotel, motel, or even a campground—are quite similar. All these businesses need staff to check in guests, provide housekeeping, employ maintenance workers, and provide a place for people to sleep. As such, they can be grouped together under the heading of accommodation and lodging. Figure 16.4 summarizes the various groupings within the industry.
| Category | Examples |
|---|---|
| Accommodations and lodging | Hotels and motels Resorts Campgrounds/Cabins AirBnB/Home Away Timeshare |
| Recreation and entertainment | Gaming Theme parks Adventure and outdoor recreation |
| Travel services | Travel agents/OTAs Airlines Cruise ships Rail/Bus Car EcoTourism |
| Food and beverage services | Restaurants Catering Institutional |
| Conventions and event management | Meetings Expositions Social and special events |
| Clubs | City Private country clubs |
Figure 16.4: The scope of the hospitality industry.
Hotel Types
Hotels are typically referred to by hotel type or other classifications. Hotel type is determined primarily by how it will function and what amenities will be included within the property. Size, location, service levels and type of business or targeted market segments are additional classifications. Industry also classifies hotels by chain scale … separating hotels into categories determined by their average daily rates. Various ownership structures and brand affiliations also differentiate hotels.
Classifications
Hotels may be classified on a number of different variables. Type of Hotel: There are numerous classifications by hotel type including all-inclusive hotels, all-suite properties, B&B/Inns, boutique, convention/conference centers, condo hotels, resort, extended stay, full service, casino, limited service and timeshare properties. Size and Complexity: A hotel can be classified by the number of guest rooms it has; hotel sizes can range from a small boutique hotel with fewer than 50 rooms to a large resort hotel with more than 1,000 rooms. The complexity of the hotel is determined by the volume and number of additional revenue generating functions such as the square feet of available conference space, number of F&B operations and additional services and amenities like pools, fitness centers, spas, golf, etc. Location: The location of a hotel can also determine the type of guest served. An airport hotel may be very different from a city-center property in an urban environment, or a remote island resort or a small quaint bed and breakfast located on top of a mountain. Hotels that specialize in conferences, may locate near entertainment destinations like Las Vegas or Disney theme parks to provide pre-post conference activities for attendees. Service Level: The level of service provided is also a key variable, ranging from an inexpensive budget or economy hotel, (Limited or Focused Service Hotels) which may have limited services and amenities, to upscale and luxury hotels (Full Service Hotels) with many services and a wide range of amenities. Market Segmentation: Figure 16.5 outlines the characteristics of specific hotel types that have evolved to match the needs of a particular traveler segment. As illustrated, hotels adapt and diversify depending on the markets they desire and need to drive occupancy levels and generate revenues. Some hotels will specialize in a specific market segment, but in today’s competitive environment, most hotels will target a combination of these segments.
| Market segment | Traveler type | Characteristics |
|---|---|---|
| Commercial | Individual business travel | - High-volume corporate accounts in city or airport properties - Stronger demand Monday through Thursday |
| Leisure | Leisure travelers—family, tourists | - Purpose for travel includes sightseeing, recreation, or visiting friends and relatives - Stronger demand Friday and Saturday nights and all week during holidays and the summer |
| Meetings and groups | Corporate groups, associations, social, military, education, religious, and fraternal groups (aka, SMERF) | - Includes meetings, seminars, trade shows, conventions, and gatherings of over 10 people - Peak convention demand is typically spring and fall in most locations - Proximity to a conference center and meeting and banquet space increase this market |
| Extended stay | Business and leisure | - Often offers kitchen facilities and living room spaces - Bookings are typically more than five nights - Often business related (e.g., extended health care, construction projects, corporate projects) - Leisure demand driven by a variety of circumstances including family visiting relatives, home renovations, snowbirds escaping winter |
Figure 16.5: Types of hotel market segments and their key characteristics.
There are several other industry related organizations, such as Forbes and AAA which provide Consumer Ratings for individual hotels … another form of classifying a property. Forbes has traditionally awarded one to five “Stars” and AAA, one to five “Diamond” ratings. Additionally, many social media applications like Trip Advisor offer hotel property ratings to consumers.
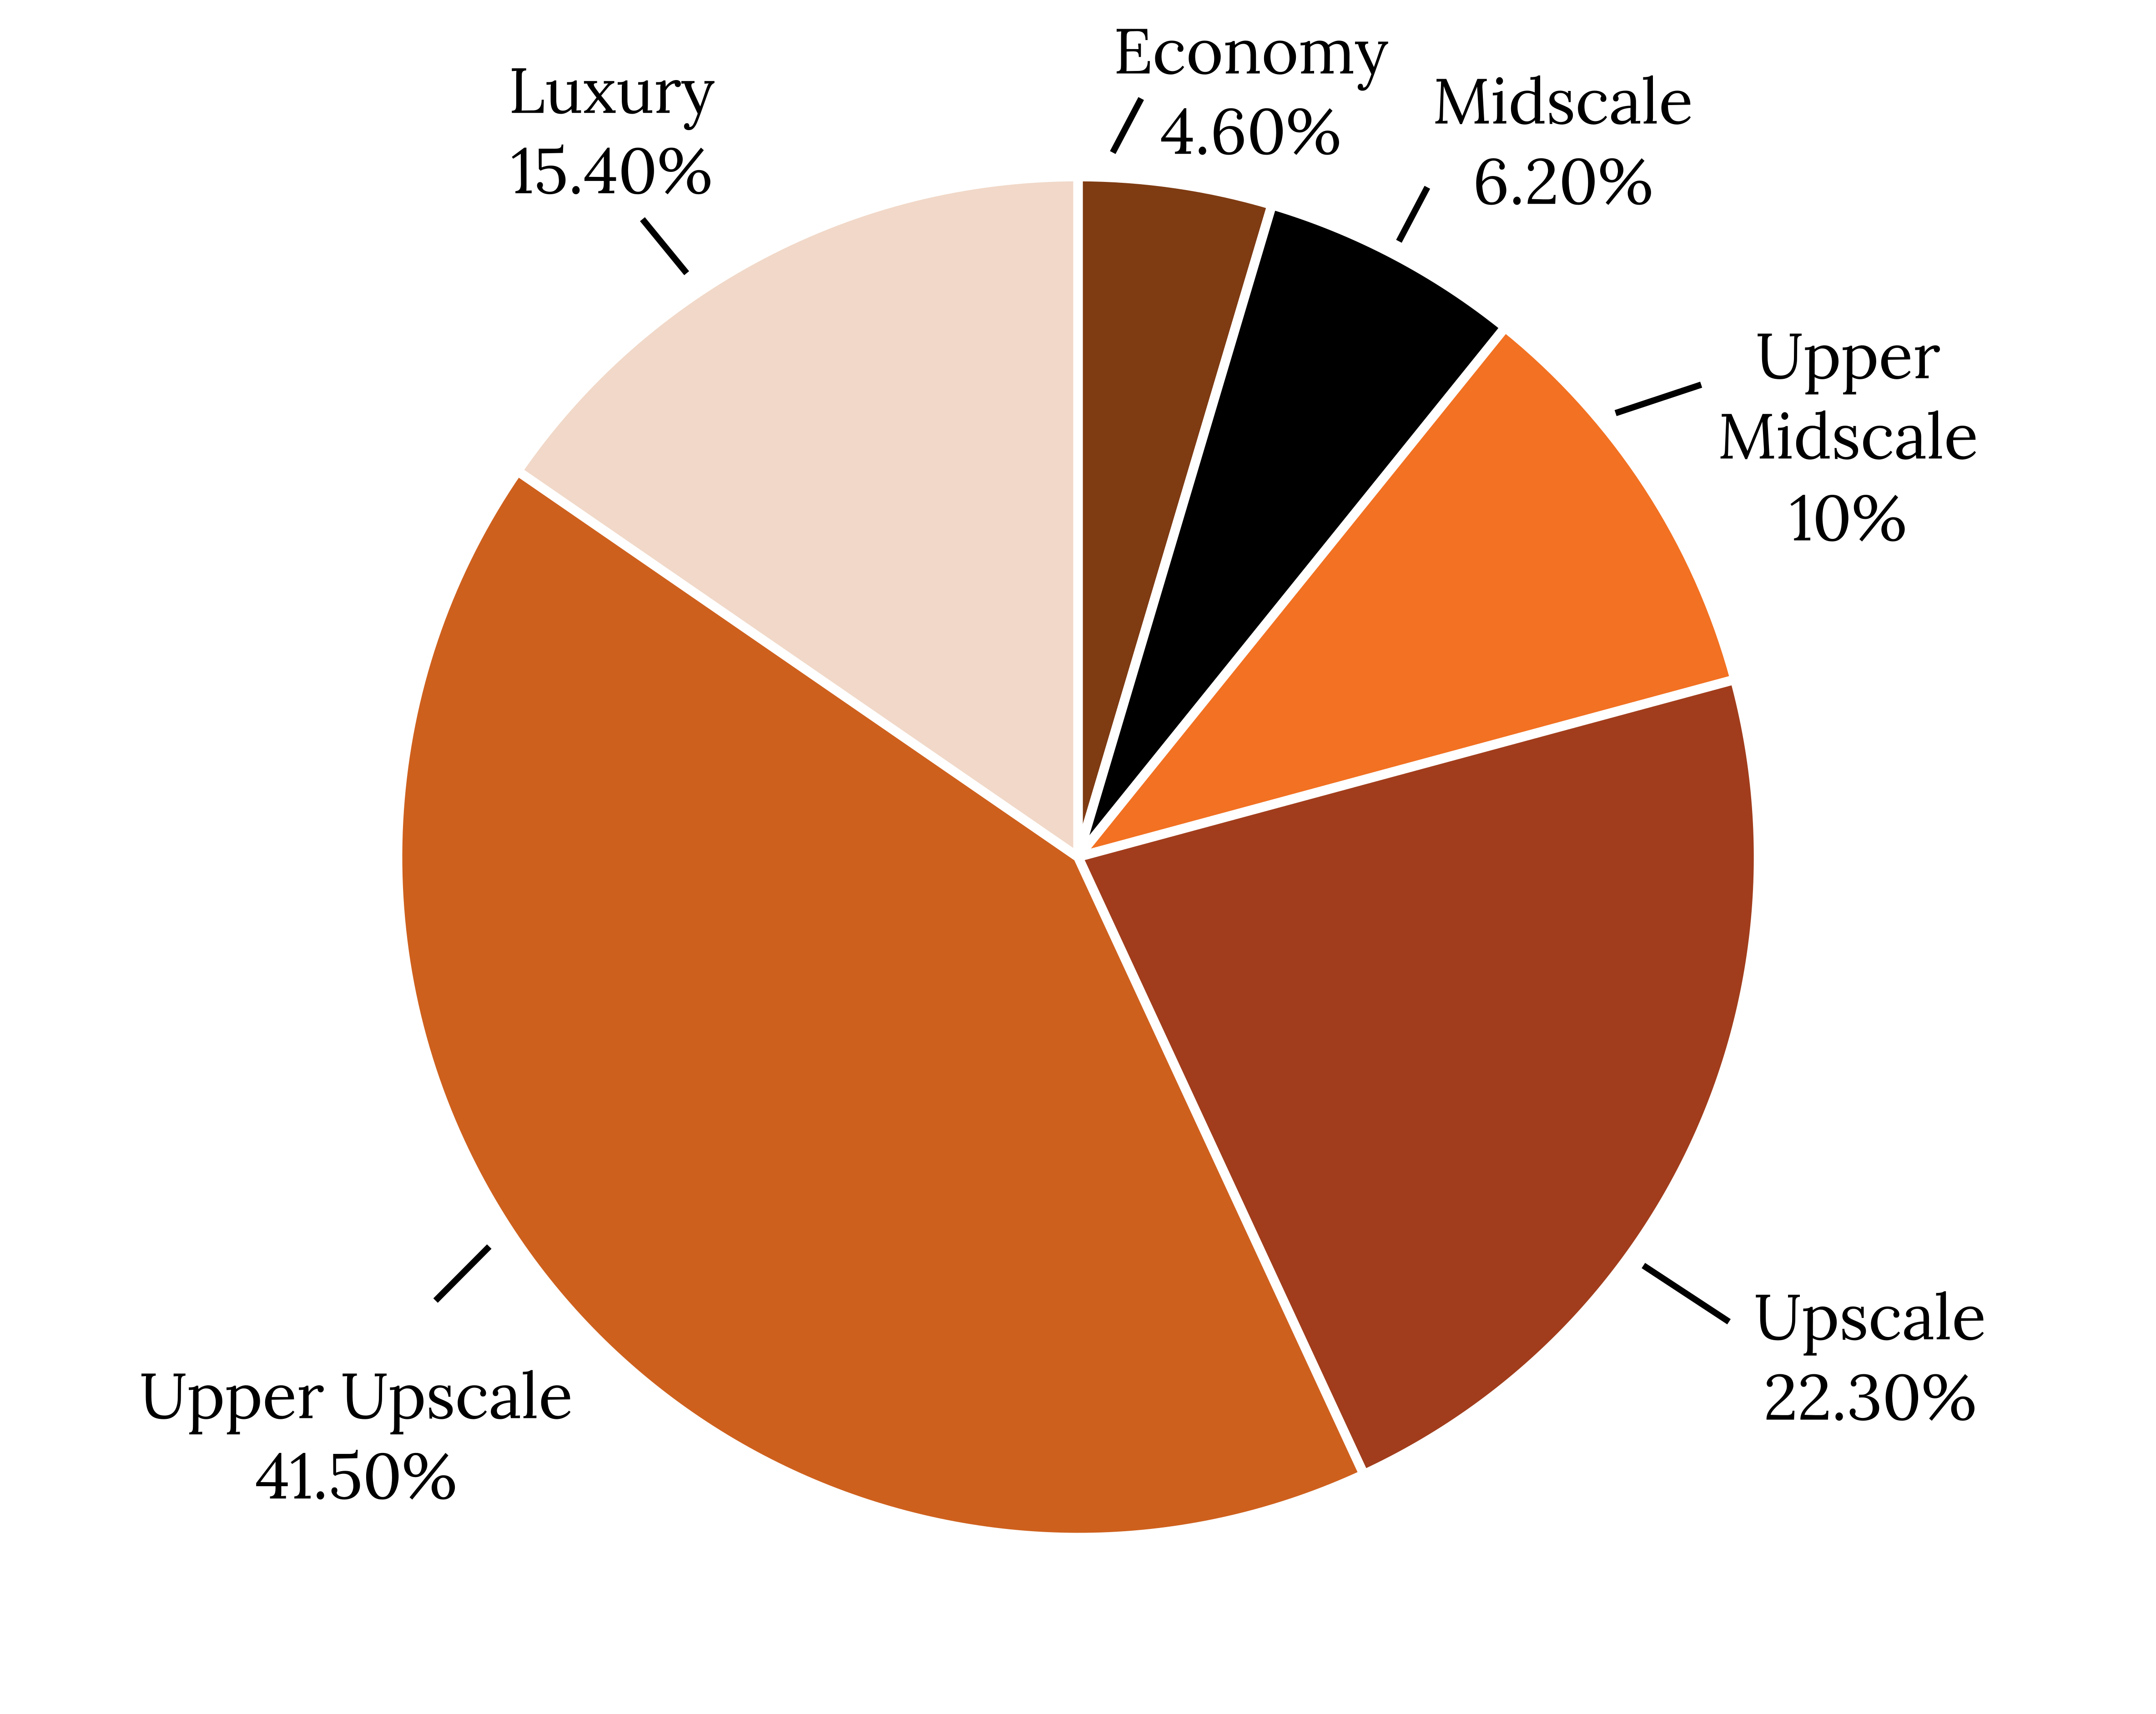
Chain Scale: Smith Travel Research (STR) is an organization that provides the lodging industry with global data benchmarking, analytics and marketplace insights. STR classifies the lodging industry into six chain scale segments according to their respective brand Average Daily Rate (ADR). The six segments are defined as Luxury; Upper Upscale; Upscale; Mid-Scale with F&B (Upper Mid-Scale); Mid-Scale without F&B (Mid-Scale) and Economy. Through STR’s 30—plus years of service to the hospitality industry—they have developed vital benchmarking performance solutions, established market trend transparency and provided data used by the investment community to support hotel development projects. Their core product, the STAR report, provides hotel owners and operators with comparative performance data between their property and a defined set of market competitors and allows you to follow trends in hotel occupancy, average daily rate (ADR) and revenue per available room (RevPar). Developers, investors, industry analysts, hotel brands and management companies all utilize STR data when determine what type of hotel to build and what location would provide maximum opportunity for success.
The type of ownership, brand affiliation and management are also very important variables in the classification of hotels. Owners may manage their own hotels independently but in today’s competitive environment, they would likely sign a Franchise Agreement with a nationally recognized brand as well as a Management Contract with a hotel management company to manage the property. A hotel chain such as Marriott, Hilton, Hyatt or IHG (Intercontinental Hotel Group) is comprised of multiple brands: Marriott, following their recent merger with Starwood currently has 30 different hotel brands, with each name representing a different level of price, service or targeted market segments.
Branding Decision
Selecting a brand affiliation is one of the most significant decisions hotel owners must make.[9] The brand affiliation selected will largely determine the cost of hotel development or conversion of an existing property to meet the standards of the new brand. The affiliation will also determine a number of things about the ongoing operation including the level of services and amenities offered, cost of operation, marketing opportunities or restrictions, and the competitive position in the marketplace. For these reasons, owners typically consider several branding options before choosing to operate independently or to adopt a brand affiliation.
Franchise Agreements
Another managerial and ownership structure is franchising. A hotel franchise enables individuals or investment companies (the franchisee) to build or purchase a hotel and then buy or lease a brand name to become part of a chain of hotels using the franchisor’s hotel brand, image, loyalty program, goodwill, procedures, cost controls, marketing, and reservations systems.[10]

A franchisee becomes part of a network of properties that use a central reservations system with access to electronic distribution channels, regional and national marketing programs, central purchasing, revenue management support, and brand operating standards. A franchisee also receives training, support, and advice from the franchisor and must adhere to regular inspections, audits, and reporting requirements.
Selecting a franchise structure may reduce investment risk by enabling the franchisee to associate with an established hotel company. Franchise fees can be substantial, and a franchisee must be willing to adhere to the contractual obligations with the franchisor.[11] Franchise fees typically include an initial fee paid with the franchise application and continuing fees paid during the term of the agreement. These fees are usually a percentage of revenue but can be set at a fixed fee. The total percentage of sales ranges significantly for hotels from 3.3–14.7 percent with a median of 11.8 percent.[12]
Management Contracts

It is common for ownership to utilize a management contract, which is a service offered by a management company to manage a hotel or resort for its owners. Owners have two main options for the structure of a management contract. One is to enter into a management agreement with an independent third-party hotel management company to manage the hotel. There are hundreds of these companies, but some of the large organizations include Aimbridge, Benchmark Hospitality, Crescent Hotels, Interstate Hotels, and White Lodging. A slightly different option is for owners to select a single company to provide both the brand and the expertise to manage the property. Marriott, Hilton, and Hyatt, are companies that provide this second option to owners.
Food and Beverage Services

The food and beverage sector is commonly known to industry professionals by its initials F&B. The F&B sector grew from simple origins to meet the basic needs for food and beverage services to increasing demand for unique experiences and broader options. As the interests of the public became more diverse, so too did the offerings of the F&B sector. The increasing awareness and demand for organic, sustainable, local or craft options as well as special dietary needs in food and beverage continue to challenge this industry. In addition, in order to better attract and serve a diverse array of diners, the F&B industry now consists of a variety of segments. The following is a discussion of each.
Quick-Service Restaurants

Formerly known as fast-food restaurants, examples of quick-service restaurants, or QSRs, include Chick-fil-A, Subway, and Pizza Hut. This prominent portion of the food sector generally caters to both residents and visitors, and it is represented in areas that are conveniently accessed by both. Brands, chains, and franchises dominate the QSR landscape. While the sector has made steps to move away from the traditional “fast-food” image and style of service, it is still dominated by both fast food and food fast; in other words, food that is purchased and prepared quickly, and generally consumed quickly as well.
Fast-Casual Restaurants
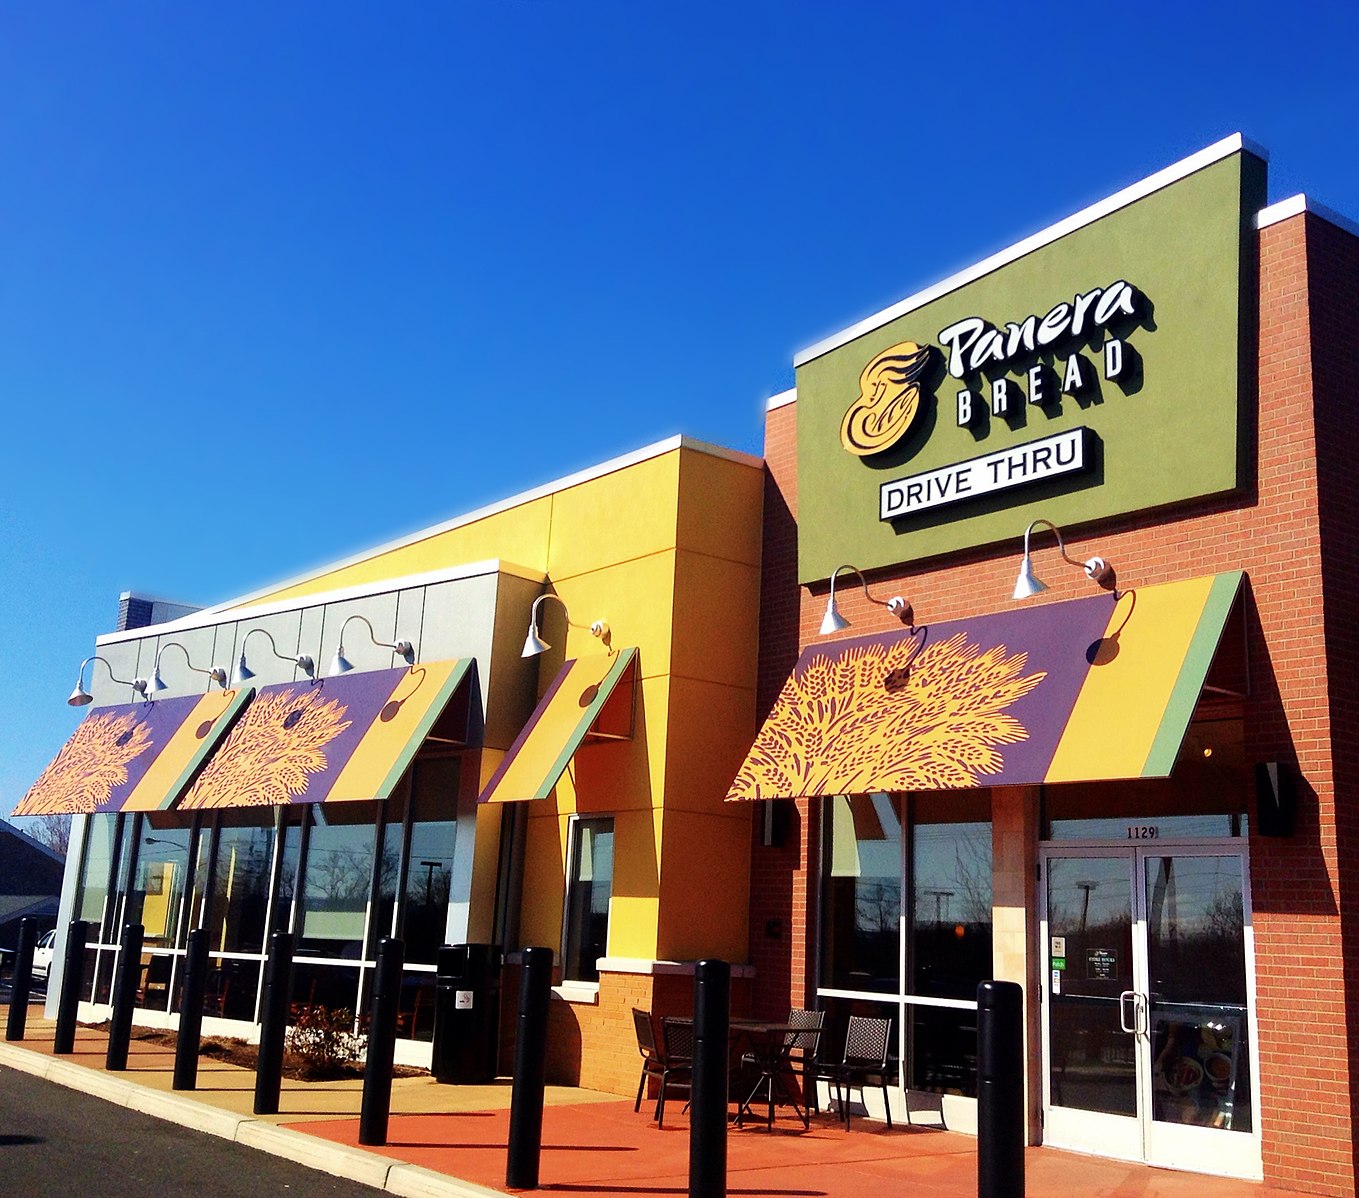
Fast-Casual restaurants focus on higher quality ingredients than QSR’s and provide made-to-order food in an environment that does not include table service. Customers usually queue and order at a counter. The seating area is more upscale and comfortable. Examples would include Chipotle Mexican Grill, Panera and Jason’s Deli.
Full-Service Restaurants
Full-service restaurants are perhaps the most fluid of the F&B operation types, adjusting and changing to the demands of the marketplace. Consumer expectations are higher here than with QSRs.[13] The menus offered are varied, but in general reflect the image of the restaurant or consumer’s desired experience. Major segments include fine dining, family/casual, ethnic, and upscale casual.

Fine dining restaurants are characterized by highly trained chefs preparing complex food items, exquisitely presented. Meals are brought to the table by experienced servers with sound food and beverage knowledge in an upscale atmosphere with table linens, fine china, crystal stemware, and silver-plate cutlery. The table is often embellished with fresh flowers and candles. In these businesses, the average check, which is the total sales divided by number of guests served, is quite high (often reviewed with the cost symbols of three or four dollar signs: $$$ or $$$$.) Examples include the Inn at Little Washington, Ruth’s Chris Steakhouse and Capitol Grille.
Casual restaurants serve moderately-priced to upscale food in a more casual atmosphere. Casual dining comprises a market segment between fast casual establishments and fine dining restaurants. Casual dining restaurants often have a full bar with separate bar staff, a larger beer menu and a limited wine menu. This segment is full of chains such as Chili’s, Outback, Red Robin and Cracker Barrel as well as many independent restaurants in regional or local markets.
Family restaurants offer affordable menu items that span a variety of customer tastes. They also have the operational flexibility in menu and restaurant layout to welcome large groups of diners. An analysis of menus in family/casual restaurants reveals a high degree of operational techniques such as menu item cross-utilization, where a few key ingredients are repurposed in several ways. Both chain and independent restaurant operators flourish in this sector. Examples of chains in this category would be Golden Corral, Cici’s Pizza and Ponderosa Steakhouse.
Ethnic restaurants typically reflect the owner’s cultural identity, Vietnamese, Cuban, Thai, etc. The growth and changing nature of this sector reflects the acceptance of various ethnic foods within our communities. Ethnic restaurants generally evolve along two routes: toward remaining authentic to the cuisine of the country of origin or toward larger market acceptance through modifying menu items.[14] Examples would be P.F. Chang’s, Tara Thai or Pei Wei.
Wineries, Cideries, Local Craft Beer, and Distilleries
The beverage industry continues to evolve as well with a strong focus on local craft beers, wines, cider and distilling. Wineries exist in almost every state, with over 300 in Virginia as of 2022.[15] Wine, bourbon, cider trails and brew pub crawls, etc. are used to generate awareness and create experiences for customers. Wineries often use event space or festivals to take advantage of the beauty of the winery and supplement their revenues.
Alcohol sales, in many ways, have continued to evolve as a unique source of tourism revenue across the United States and around the world. From wine tours in Napa, California to scotch whisky tastings in Edinburgh, Scotland consumers are seeking different tastes as a part of their travels. Alcohol producers range from small first-generation entrepreneurs to wineries that have carried a family name for decades. The size of operation can also vary considerably from small wineries that produce very small batches to huge corporations, like Constellation Brands, that control and sell multiple brands of wine, beer and liquor from producers around the world. Constellation Brands – www.cbrands.com
Wineries

Wine and wineries have attracted consumer dollars and consumer interest for hundreds of years. Consumers not only purchase wine to taste, but many also purchase wine to collect and even use as an investment. With respect to tourism, wineries are uniquely positioned to provide a special consumer experience. Wineries are often on beautiful, well-manicured farms with elaborate tasting rooms and event venues. Growers, as a part of their story or sales pitch, will review the local terroir. The “terroir” is the blend of culture, climate, soil and terrain factors that allow for the unique growing conditions of one or more grape varieties, from which the wine is made. [16]
Because of the dependency on climate, the industry is constantly evolving due to climate change. New varietals are introduced in areas where they could not grow even 50 years ago. An interesting example is the recent popularity of the “British Sparkler”. Across the English Channel, French wine and champagne brands are well-known. However, in recent years, British wine growers have been able to create exceptional sparkling wines from similar chalky soil and the same Chardonnay varietal. [17]
Cideries and Industry Legislation
The Craft Beverage Modernization and Reform Act of 2015 (CBMA) was a huge shot in the arm for entrepreneurs in the beverage industry. Overall, this act loosened the alcohol control laws permitting growers, brewers and distillers to distribute product easier. [18], [19] A portion of this act was referred to as the “Cider Act” as it enabled farmers to open Cider tasting rooms and more easily distribute canned and bottled product.[20] Multiple states like Connecticut followed suit in easing state alcohol tax and control laws. [21] Cider was the fastest growing segment of the beverage industry between 2013-2014, with a growth rate of over 75%, stealing market share from wine and beer.[22] Another version of the CBMA was passed in 2019 further extending consumer access to cider.
Local Craft Beer
In most parts of the world the offering of a cold beer goes hand in hand with hospitality. While a few global corporations do control large portions of world-wide distribution, in the United States there has been a steady growth in American Craft beer, in recent decades. The combination of the growing popularity of home brewing clubs in the 1970’s and 1980’s, combined with the use of the internet to share and promote brews in the 1990’s and then the easing of alcohol distribution laws has created the craft brewing category. Total breweries in the United States including Regional Craft, Microbreweries, Taprooms, Brewpubs and large commercial breweries have grown from 4847 in 2015 to 8884 in 2020, according to the Brewers Association www.brewersassocaition.org. These brewery categories vary mainly based on size of production and the percent of beverage sales vs. onsite food sales. [23]
Craft beer makers typically pick from three very different growth strategies. The first strategy is more personal and closer to the rebel mentality of many craft beer makers. These brewers strive to leverage local resources and develop new local traditions to promote their products. Many of these brewers self-distribute their product, if it is sold outside of the brewery tasting rooms. Nearly every mid-size city in the country has an example this localized strategy. Big Lick Brewing in Roanoke, VA is an ideal example of this approach.
The second strategy is the “grow and sell” plan. A successful local brewer may fall into this plan, with a little luck, or it may be a strategy from the start to help support large scale growth. In this strategy the success of the brewer grows from a local market to a regional market. Their beer is distributed by one or more distributors who is aligned with a large national brewer. The national brewer takes note of the regional brewer growth and rather than compete directly, they purchase the regional brewer; they buy their competitor. For the smaller brewer this deal is often significant and it represents an ideal retirement strategy. The acquisition of Devils Back Bone by Anheuser Busch/Inbev is a good example. [24]
The third strategy is rarer. In this case the local brewer has more access to resources and is able to grow the brand on a large scale, moving from local to regional to a national brand, on their own. To help propel the growth of this brand it must be exceptional. To distribute the beer outside of the local market this brewer will develop multiple relationships with distributors to help support strategic growth, as market share and production grow. Sierra Nevada out of Chico, CA is one of the few such beer brands that has been able to thread this needle.
Distilleries and Mixology
Like wine and beer, distilled spirits often are a reflection of the local culture and geography. In the United States as of August 2021 there were 2290 craft sprit producers with about a third of those focused on whisky production. [25] Consumer brand preferences run strong in many categories and liquor is no exception. Craft distillers strive to create powerful branding, to not just sell the next drink, but to create customers for life. These branding programs share the brands history, geography, chemistry and culture with customers as part of an educational tasting experience. The Makers Mark Ambassador program and its sprawling distillery operation, with multiple tasting rooms, is a perfect example.
In the last few years, tequila has been the spirits category with the best growth. In 2020 it was North America’s fastest growing alcoholic beverage category with 5.7 billion dollars in annual sales. [26] Celebrity endorsements along with changing consumer demographics has helped fuel the growth in this category. According to US Census Reports, Hispanic and Latino demographic growth was 23% between the 2010 and 2020 census.[27] This change in consumer demographics certainly modified the overall market composition and created new opportunities for some distillers.
The evolving industry
The COVID pandemic has let the “genie out of the bottle” in more ways than one. Restaurant owners appealed to lawmakers for some flexibility in providing alcohol to customers, in the name of saving industry jobs, and in 2019 another revision of a Craft Beverage Modernization Act 2019 was passed.[28] Many states took alcohol control laws a step further, in favor of retailer and bar owners, and permitted cocktails to go as a new legal revenue stream for business owners. Multiple states have since made the changes permanent, while some continue to have the laws on the books, as a temporary relief strategy, during the pandemic. [29]
Institutional Food Service
Institutional food service is large scale and often connected to governmental (National Parks) or corporate level organizations. Often run under a predetermined contract, the institutional F&B sector includes:
- Hospitals
- Educational institutions
- Prisons and other detention facilities
- Corporate staff cafeterias
- National Park restaurants and concessions
- Cruise ships
- Airports and other transportation terminals and operations
Examples of companies who focus on Institutional Food Service are Compass, Sodexho, Aramark.
Accommodation Food Service
This sector includes hotel restaurants and bars, room service, and self-serve dining operations (such as a breakfast room). Hotel restaurants are usually open to the public and reliant on this public patronage in addition to business from hotel guests. Collaborations between hotel and restaurant chains have seen reliable pairings such as the combination of Shula’s Steakhouse and Marriott Hotels.
Restaurant Industry Profitability and Cost Control
According to the National Restaurant Association, QSRs have the highest pre-tax profit margin at 6.6 percent, while full-service restaurants have a margin of 6.1 percent. There will be significant variances from these percentages at individual locations, even within the same brand.[30]
| Restaurant operating expenses | % of total revenue (full-service) | % of total revenue (QSR) |
|---|---|---|
| Cost of food and beverage sales | 33% | 33% |
| Salaries and wages (including benefits) | 33% | 28% |
| Fixed costs (rent, taxes, property insurance, etc.) | 6% | 3% |
Figure 16.16: Restaurant operating expenses as a percent of revenue.
A number of costs influence the profitability of an F&B operation. Some of the key operating expenses (as a percentage of revenue) are detailed in figure 16.16[31], above, where food cost and salaries & wages are the two major expenses, each accounting for approximately a third of the total. Other expenses include rental and leasing of venue, utilities, advertising, and depreciation of assets. These percentages represent averages, and will vary greatly by sector and location.
Cost control and containment is essential for all F&B businesses. Demanding particular attention are the labor, food, and beverage costs, also known as the operator’s primary costs. In addition to these big ticket items, there is the cost of reusable operating supplies such as cutlery, glassware, china, and linen in full-service restaurants.
Recreation and Entertainment
Recreation
Recreation can be defined as the pursuit of leisure activities during one’s spare time[32] and can include vastly different activities such as golfing, sport fishing, and rock climbing. Defining recreation as it pertains to tourism, however, is more challenging.

Let’s start by exploring some recreation-based terms that are common in the tourism industry. Outdoor recreation can be defined as “outdoor activities that take place in a natural setting, as opposed to a highly cultivated or managed landscape such as a playing field or golf course.”[33] This term is typically applied to outdoor activities in which individuals engage close to their community. When these activities are further away, and people must travel some distance to participate in them, they are often described as “adventure tourism”. According to the United Nations World Tourism Organization (UNWTO), adventure tourism is “a trip that includes at least two of the following three elements: physical activity, natural environment, and cultural immersion.”[34]
Ultimately, categorization is based on a combination of several factors, including manner of engagement in the activity (risk exposure, experience requirement, group or solo activity), the distance travelled to access the activity, and the type of environment (proximity to nature, level of challenge involved) in which the activity occurs.
According to the 2021 Global Adventure Tourism Market Report, the global adventure travel market is expecting an elevation of $2.02 billion (in U.S. dollars) by 2030 and is witnessing a compound annual growth rate of 10.7 percent from 2020-30.[35]
Entertainment
Entertainment is a very broad category which overlaps with many of the areas discussed elsewhere in this chapter, like hotels and accommodation. Two major types of entertainment that we’ll discuss here are gaming and theme parks.
Gaming
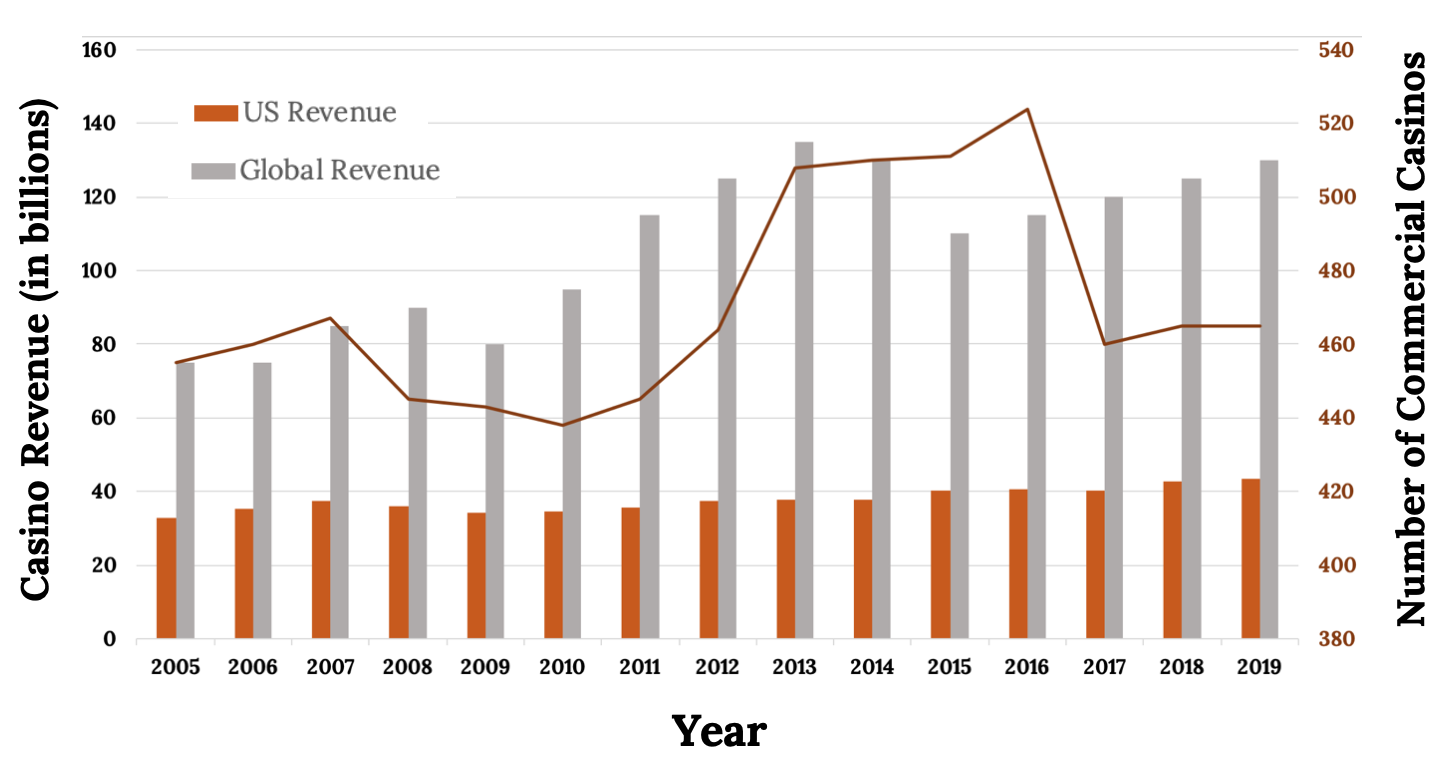
Gaming has grown significantly in the United States and globally. The number of casinos in the United States has been growing since 2010, as shown in figure 16.18. Casinos are found all over the United States in major cities, riverboats, and on Native American lands. However, US casino revenue has been relatively flat, while global gaming revenues have been on the increase, largely due to Asian market growth. Most casinos involve other facets of the Hospitality industry such as lodging, F&B, golf, entertainment, spas, etc., but they also have the added challenges of casino operations.
Theme Parks

Theme parks have a long history dating back to the 1500’s in Europe, and have evolved ever since. Today, it is hard not to compare any amusement park destination to Disneyland and Disney World. Opened in 1955 in sunny California, Disneyland set the standard for theme parks. Theme parks outside of California and Florida are often highly seasonable operations challenged with significant staffing and training requirements each year.
Convention and Event Management
A convention is a large meeting of people with similar interests who meet for a period of at least a few days to discuss their field. An event is a gathering at a given place and time, usually of some importance, often celebrating or commemorating a special occasion.
Both conventions and events can be extremely complex projects, which is why, over time, the role of meeting planners has taken on greater importance. The development of education, training programs, and professional designations such as CMPs (Certified Meeting Planners), CSEP (Certified Special Events Professional), and CMM (Certificate in Meeting Management) has led to increased credibility in this business and demonstrates the importance of the sector to the economy.
Meeting planners may be independent contractors hired to facilitate the planning process, work directly for the company full time to coordinate their meeting, or work for hotels, conference centers and event venues directly.
- The various tasks involved in meeting and event planning include:
- Conceptualizing/theming
- Site inspection & selection
- Logistics and planning
- Human resource management
- Security
- Marketing and public relations
- Budgeting and financial management
- Sponsorship procurement
- Management and evaluation

Event Categories
Mega-Events
A mega-event is a large scale, highly prestigious event such as the Olympic Games, the FIFA World Cup, or a global economic summit. These events typically gain tremendous media coverage and have major economic impacts on the host location, both positive and negative. High levels of tourism (1 million visitors) associated with a mega-event brings revenue, but the revenue may be outweighed by substantial capital and social costs incurred by the host. The events are often awarded to host destinations through a bidding process and gain tremendous media coverage.
Special Events
A special event is a one-time or infrequent specific ritual, presentation, performance, or celebration. Special events are planned and created to mark a special occasion, such as a presidential inauguration or the Queen of England’s 90th birthday. Like mega-events, there may be significant media coverage and economic impact for the host city or destination.
Hallmark Events

A hallmark event is a unique event that is often identified with the location where it is held, like Carnival in Rio de Janeiro or Oktoberfest in Munich. Hallmark events contribute significant economic benefits and even can create a competitive advantage for the host city or destination that attracts tourists.
Festival
A festival is a themed public celebration that conveys, through a kaleidoscope of activities, certain meaning to participants and spectators. Festivals are often celebrations of community or culture and feature music, dance, or dramatic performances. Examples include Lollapalooza, the Cannes Film Festival, and Junkanoo in the Bahamas.
Local Community Events
A local community event is generated by and for locals; although it may attract tourists, its main audience is the local community. The community may experience measurable economic impacts, as might happen at The Steppin’ Out Street Fair in Blacksburg (think hotel stays and eating out). Fundraisers and community picnics are also examples in this category.
Meetings and Conventions
The tourism industry also has a long history of creating, hosting, and promoting meetings and conventions that draw business travelers. In fact, Convention and Visitor Bureau’s (CVB’s) work hard to attract these meetings and conventions to their city to drive economic benefit for hotels, restaurants, entertainment venues, etc.
There are several types of such events
Conventions generally have very large attendance, and are held on a regular schedule but in different locations. They also often require a bidding process. Political conventions are one such example.
Association Meetings or Conferences are held regionally and nationally for hundreds of associations or events focused on specific themes. Examples would be the National Restaurant Association Annual Convention, ComicCon, or the National Auto Show.
Corporate Meetings will vary significantly in size and purpose and include regional or national sales meetings, shareholder meetings, training sessions, or celebrations. The location will vary depending on the nature of the meeting. They may be held at an airport property, a traditional corporate meeting facility or even an upscale resort.
Trade Shows and Trade Fairs can be stand-alone events, or adjoin a convention or conference.
Seminars, Workshops, and Retreats are examples of smaller-scale events.
As meeting planners have become more creative, meeting and convention delegates have been more demanding about meeting sites. No longer are hotel meeting rooms and convention centers the only type of location used; non-traditional venues have adapted and become competitive in offering services for meeting planners. These include architectural spaces such as airplane hangars, warehouses, or rooftops and experiential venues such as aquariums, museums, and galleries.[36]
Travel Services
Transportation and travel services are another large element of the tourism industry. This area includes cruise ships, airlines, rail, car rentals, and even ride sharing such as Uber and Lyft. Each of these segments is impacted significantly by fuel costs, safety issues, load factors and government regulation.
Cruises

If you’ve ever been on a cruise, you are in good company. According to CLIA (Cruise Lines International Association), 23 million passengers were expected to go on a cruise worldwide on 62 member lines in 2015.[37] The industry employs over 900,000 people.[38]
Over 55 percent of the world’s cruise passengers are from North America, and the leading destinations (based on ship deployments), according to CLIA are:[39]
- The Caribbean (36 percent)
- The Mediterranean (20 percent)
- Northern Europe (11 percent)
- Australia/New Zealand (6 percent)
- Alaska (6 percent)
- Asia (5 percent)
- South America (3 percent)
Travel Services
The travel services sector is made up of a complex web of relationships between a variety of suppliers, tourism products, destination marketing organizations, tour operators, and travel agents, among many others. Under the North American Industry Classification System (NAICS), the travel services industry group includes “establishments primarily engaged in travel arrangement and reservation services. Examples … are tourist and travel agencies; travel tour operators and wholesale operators; convention and visitors’ bureaus; airline, bus, railroad and steamship ticket offices; sports and theatrical ticket offices; and airline, hotel and restaurant reservation offices.”[40] Tourism services support industry development and the delivery of guest experiences.
Travel Agencies
A travel agency is a business that operates as the intermediary between the travel industry (supplier) and the traveler (purchaser). Part of the role of the travel agency is to market prepackaged travel tours and holidays to potential travelers. The agency can further function as a broker between the traveler and hotels, car rentals, and tour companies.[41] Travel agencies can be small and privately owned or part of a larger entity.
Online Travel Agencies (OTAs)
Online travel agents (OTAs) are companies that aggregate accommodations and transportation options and allow users to choose one or many components of their trip based on price or other incentives. Examples of OTAs include Booking.com, Expedia.com, Hotwire.com, and Kayak.com. OTAs are gaining popularity with the travelling public. Revenue of leading online travel agencies (OTAs) worldwide rose in 2021 over the previous year, after dropping sharply in 2020 due to the coronavirus (COVID-19) pandemic. Despite the substantial increase, however, the figures did not catch up yet with pre-pandemic levels. Overall, Booking was the OTA recording the highest revenue in 2021, generating nearly 11 billion U.S. dollars. Expedia placed second on the ranking, with roughly 8.6 billion U.S. dollars that year.[42]
Tour Operators
A tour operator packages all or most of the components of an offered trip and then sells them to the traveler. These packages can also be sold through retail outlets or travel agencies.[43] Tour operators work closely with hotels, transportation providers, and attractions in order to purchase large volumes of each component and package these at a better rate than the traveler could by purchasing individually.
Destination Marketing Organizations (DMOs)
Destination marketing organizations (DMOs) include national tourism boards, state/provincial tourism offices, and community convention and visitor bureaus around the world. DMOs promote “the long-term development and marketing of a destination, focusing on convention sales, tourism marketing and service”[44].
Country Clubs

Country clubs are another part of the Hospitality industry with a very different service strategy focusing on serving members who will develop relationships with the staff compared to a more transactional service interaction in lodging, restaurants or airlines.
Country clubs do not focus as strongly on profit as they do on maximizing member satisfaction, retention and growth while maintaining an attractive fee structure. Country (or city) clubs, will typically have restaurant and bar operations, catered events and other amenities such as golf, tennis, pool, fitness facilities, etc. Depending on the type of club, family and youth events are important to maintain and grow membership.
Strong customer service, culinary, event management and general management skills are necessary to be successful in clubs.
Chapter Video
As in any other fast-moving industry, the landscape in Hospitality and Tourism is always changing. This video explores 10 of the more important current trends impacting the industry.
Key Takeaways
- The Tourism industry is the largest industry in the world with significant benefit and costs to a region. The global competition for the tourism dollar is significant within the US and between countries.
- Hotels vary significantly in size, quality, purpose, chain affiliation, and ownership. The complexity of the operation and leadership vary as well.
- Food and Beverage is made up of a wide variety of restaurant types from QSR, Fast Casual, Fine Dining and Ethnic. Institutional food service in business, hospitals, education, parks and concessions are a significant part of the Food and Beverage industry.
- The evolution of tastes and consumer expectations in food and beverage continue to provide opportunity and challenges in the industry for ethnic sustainable, organic, local, craft, and other unique experiences.
References
Portions of this chapter were adapted from Westcott, Morgan (Ed) Introduction to Tourism and Hospitality in BC. CC BY 4.0. https://opentextbc.ca/introtourism. Available for free at: http://open.bccampus.ca.
Figures
Figure 16.1: Tourists gather at the Eiffel Tower. Siebe Warmoeskerken. 2018. Unsplash license. https://unsplash.com/photos/mxNrtFzOd-I.
Figure 16.2: The impact of global tourism before and after the pandemic. Kindred Grey. 2022. CC BY 4.0. Data from https://wttc.org/Portals/0/Documents/Reports/2021/Global%20Economic%20Impact%20and%20Trends%202021.pdf [international spending, GDP, and jobs]; https://data.worldbank.org/indicator/BX.GSR.TRVL.ZS [global service exports]. https://archive.org/details/16.2_20220627.
Figure 16.3: The Pineapple Hotel in Liverpool. Rodhullandemu. 2012. CC BY-SA 3.0. https://commons.wikimedia.org/wiki/File:Pineapple,_Park_Road,_Liverpool.jpg.
Figure 16.6: Example of a hotel market segmentation by STR’s Chain Scale. Kindred Grey. 2022. CC BY 4.0. https://archive.org/details/16.6_20220627.
Figure 16.7: The San Diego Marriott. Christina Hsu. 2009. CC BY-NC-SA 2.0. https://flic.kr/p/6KZ5Cv.
Figure 16.8: The Inn at Virginia Tech, managed by Benchmark Hospitality. Anastasia Cortes. 2016. Public domain. Provided by Steve Skripak.
Figure 16.9: Fine dining. Delightin Dee. 2021. Unsplash license. https://unsplash.com/photos/_WI3DGseB3g.
Figure 16.10: Subway is a quick-service restaurant. Szymon12455. 2018. Unsplash license. https://unsplash.com/photos/-jv94-xYy-E.
Figure 16.11: Panera is a fast-casual restaurant. Mike Mozart. 2014. CC BY 2.0. https://commons.wikimedia.org/wiki/File:Panera_Bread_(13883443466).jpg.
Figure 16.12: A fine-dining restaurant in the Netherlands. Ronan Kruithof. 2019. Unsplash license. https://unsplash.com/photos/PCE0T5i4pDI.
Figure 16.13: Afton Mountain Vineyards, VA. Kevin Oliver. 2017. CC BY-NC-ND 2.0. https://flic.kr/p/V9h6v5.
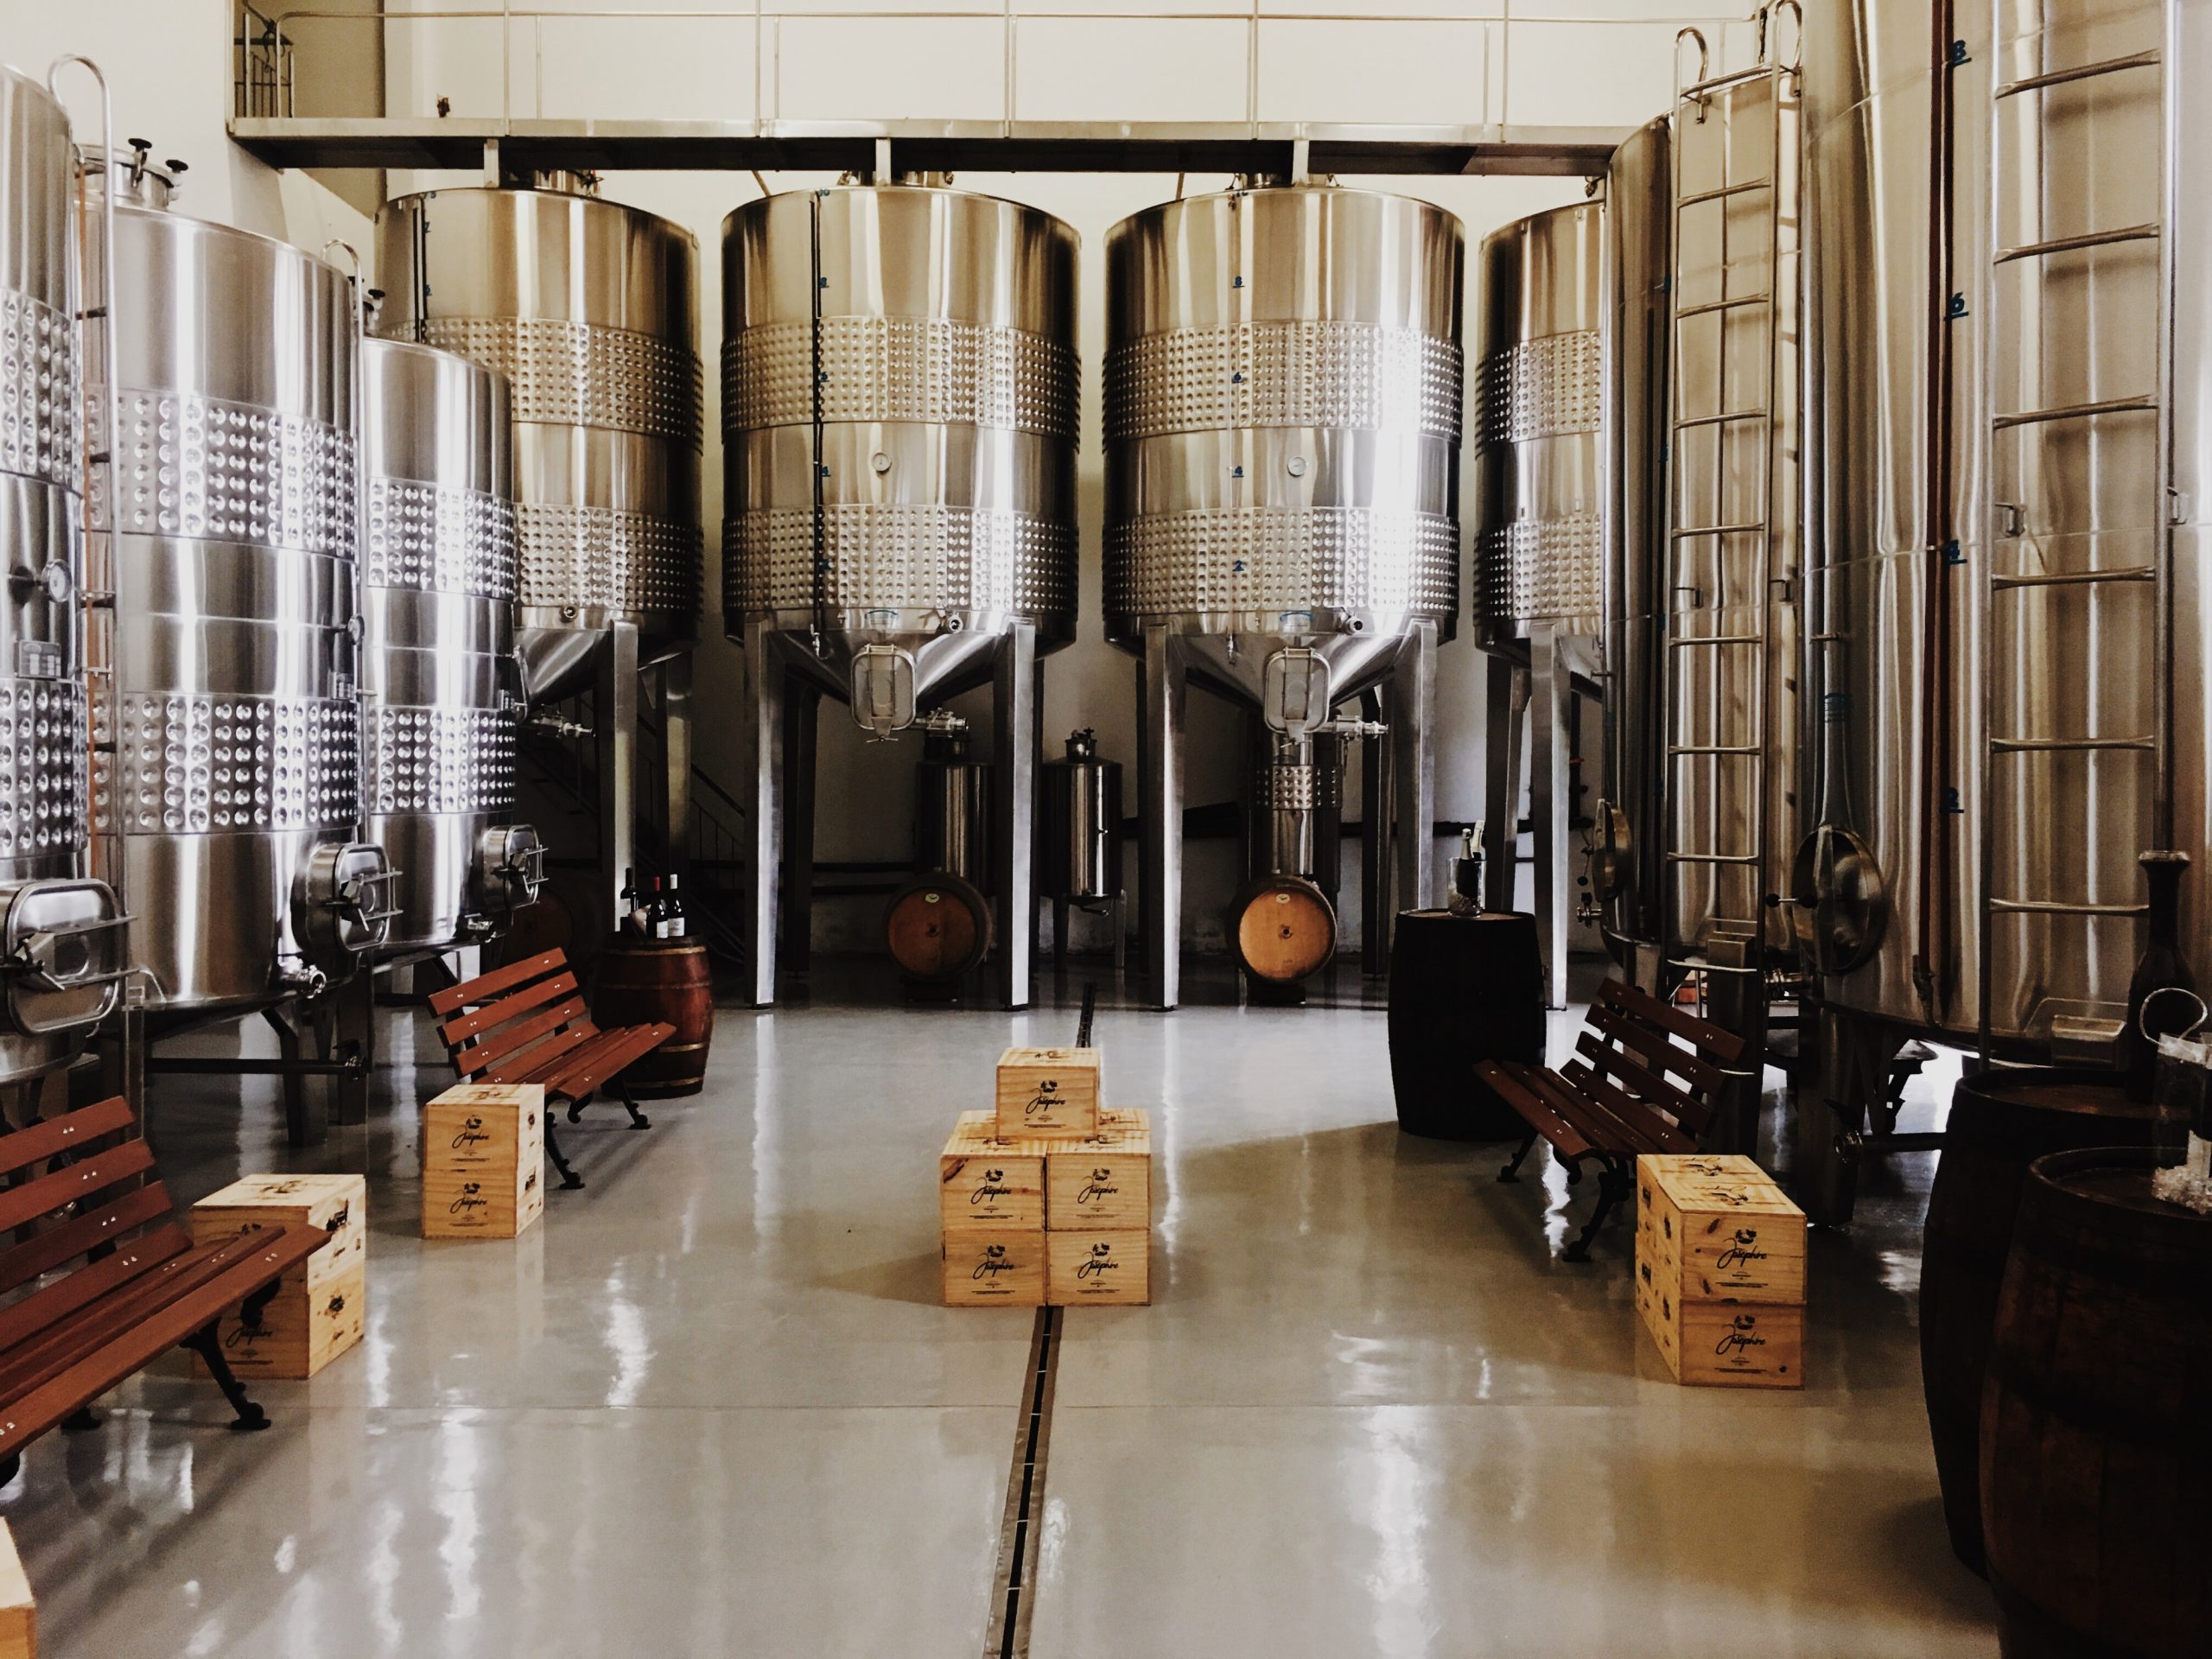
Figure 16.14: Beer being brewed in steam-fired kettles in a Brazillian brewery. Roberta keiko Kitahara Santana. 2019. Unsplash license. https://unsplash.com/photos/RfL3l-I1zhc.
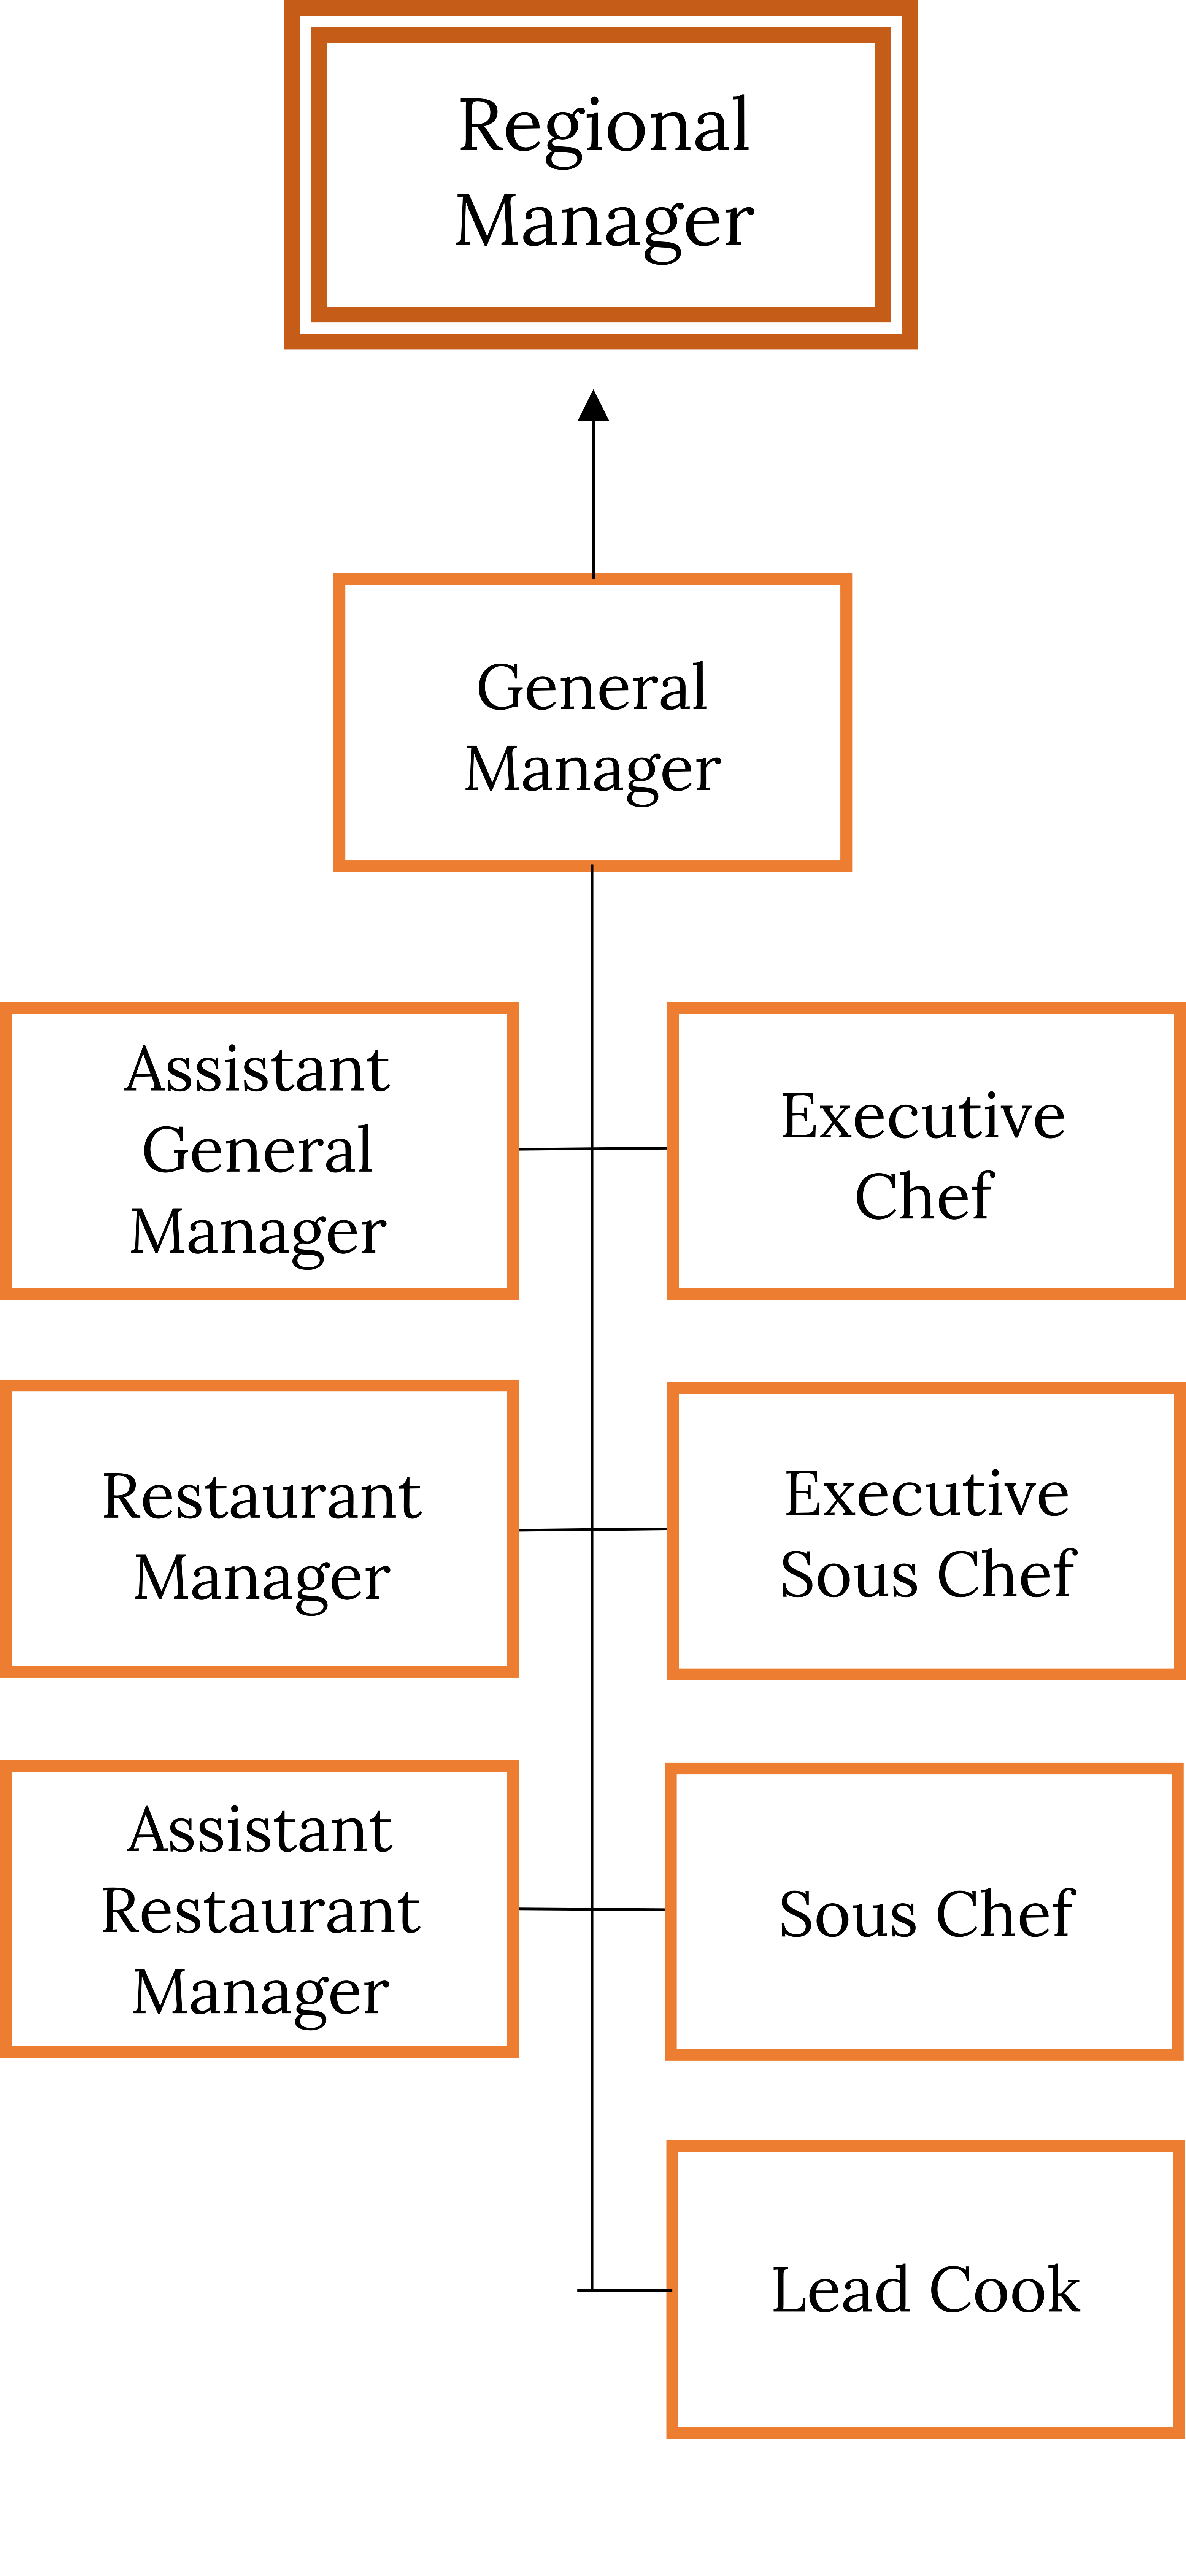
Figure 16.15: Restaurant industry career path. Kindred Grey. 2022. CC BY 4.0. https://archive.org/details/16.15_202206.
Figure 16.16: Restaurant operating expenses as a percent of revenue. Adapted from National Restaurant Association (2016). Restaurant Operations Report 2016 Edition. Washington, D.C.
Figure 16.17: Adventure tourism: whitewater rafting in Argentina. Jonatan Lewczuk. 2018. Unsplash license. https://unsplash.com/photos/hN7jhC_YWk0.
Figure 16.18: U.S. and global casino revenues (2005-2019). (2005-2015) Data Retrieved from: https://gaming.unlv.edu/reports/national_annual_revenues.pdf; 2016 data retrieved from: https://web.archive.org/web/20170301070205/http://gaming.unlv.edu/reports/national_monthly.pdf; 2017 data retrieved from: https://www.americangaming.org/resources/state-of-the-states-2018-the-aga-survey-of-the-commercial-casino-industry/; 2018 data retrieved from: https://web.archive.org/web/20190201140714/https://gaming.unlv.edu/reports/national_monthly.pdf; 2019 data retrieved from: https://abcnews.go.com/Entertainment/wireStory/us-commercial-casinos-won-436-billion-2019-37-71069042; Global revenue data retrieved from: https://www.statista.com/statistics/271577/global-casino-gaming-market-revenue/; Number of commercial casinos data retrieved from: https://www.statista.com/statistics/187972/number-of-us-commercial-casinos-since-2005/.
Figure 16.19: Disney is one of the most well-known theme parks. Bastien Nvs. 2020. Unsplash license. https://unsplash.com/photos/g3CR0UJ1CyM.
Figure 16.20: The Bejing olympics is an example of a mega-event. zhang kaiyv. 2021. Unsplash license. https://unsplash.com/photos/VAnriQouDIw.
Figure 16.21: Mardi Gras in New Orleans, 2018. Cayetano Gil. 2018. Unsplash license. https://unsplash.com/photos/T0tb5Olqkis.
Figure 16.22: Cruise ship near St. Thomas, U.S. Virgin Islands. Peter Hansen. 2017. Unsplash license. https://unsplash.com/photos/MeGmdPNe36w.
Figure 16.23: The Old Course at Half Moon Bay, CA. Cristina Glebova. 2022. Unsplash license. https://unsplash.com/photos/ihZwGiVMUCY.
- World Tourism Organization UNWTO (2015). “Why Tourism?” Retrieved from: http://www2.unwto.org/content/why-tourism ↵
- United Nations Statistics Division (2010, December). “Tourism as an Internationally Traded Service and Beyond.” Newsletter of the Interagency Task Force on Statistics of International Trade in Services. No. 6. p. 1. Retrieved from: http://unstats.un.org/unsd/tradeserv/tfsits/newsletter/TFSITS_newsletter_6.pdf ↵
- World Tourism Organization UNWTO (2015). “Exports from International Tourism Rise 4% in 2015.” Retrieved from: http://media.unwto.org/press-release/2016-05-03/exports-international-tourism-rise-4-2015 ↵
- Association of Bhutanese Tour Operators (2010). “UNWTO Tourism Vision 2020 Forecast Released.” Retrieved from: http://www.abto.org.bt/2010/06/unwto-tourism-2020-vision-forecast-released/ ↵
- United Nations Environment Programme (2016). “Negative Socio-Cultural Impacts from Tourism.” Retrieved from: http://www.unep.org/resourceefficiency/Business/SectoralActivities/Tourism/FactsandFiguresaboutTourism/ImpactsofTourism/Socio-CulturalImpacts/NegativeSocio-CulturalImpactsFromTourism/tabid/78781/Default.aspx ↵
- United Nations Environment Programme (2016). “Tourism’s Three Main Impact Areas.” Retrieved from: http://www.unep.org/resourceefficiency/Business/SectoralActivities/Tourism/TheTourismandEnvironmentProgramme/FactsandFiguresaboutTourism/ImpactsofTourism/EnvironmentalImpacts/TourismsThreeMainImpactAreas/tabid/78776/Default.aspx ↵
- Discover Hospitality (2015). “What is Hospitality?” Retrieved from: https://web.archive.org/web/20150814071021/http://discoverhospitality.com.au/what-is-hospitality ↵
- L. P. Coyle (1982). “Pineapple” in World Encyclopedia of Food. New York: Facts on File. p. 517. ↵
- C. Crandell, K. Dickinson, and G. I. Kanter (2004). "Negotiating the hotel management contract" In Hotel Asset Management: Principles & Practices. East Lansing, MI: University of Denver and American Hotel & Lodging Educational Institute. ↵
- S. Rushmore (2005). “What Does a Hotel Franchise Cost?” Canadian Lodging Outlook. Retrieved from: www.hotel-online.com/News/PR2005_4th/Oct05_FranchiseCost.html ↵
- Ibid.; N. Migdal (n.d.). “Franchise Agreements vs. Management Agreements: Which One Do I Choose?” Hotel Business Review. Retrieved from: hotelexecutive.com/business_review/2101/test-franchise-agreements-vs-management-agreements-which-one-do-i-choose ↵
- Stephen Rushmore Jr., Erin S. Bagley (2014). “2014 United States Hotel Franchise Fee Guide.” HVS. Retrieved from: http://www.hvs.com/article/7097/2014-united-states-hotel-franchise-fee-guide/ ↵
- H. G. Parsa, K. R. Lord, S. Putrevu, and J. Kreeger (2015). “Corporate Social and Environmental Responsibility in Services; Will Consumers Pay for It?” Journal of Retailing and Consumer Services. Vol. 22. pp. 250-260. ↵
- A. H. Mak, M. Lumbers, A. Eves, and R. C. Change (2012). “Factors Influencing Tourist Food Consumption.” International Journal of Hospitality Management. Vol. 31. No. 3. pp. 928-936. ↵
- Virginia is for Wine Lovers. (n.d.) Virginia is for Lovers. Retrieved from: https://www.virginia.org/things-to-do/food-and-drink/wineries ↵
- Kathleen Willcox, July 6, 2017, “Climate change is putting English Sparkling Wine on the Map” Retrieved from https://www.vinepair.com/articles ↵
- Craft Beverage Modernization and Tax Reform Act of 2015, S. 1562, 114th Cong. (2015). Retrieved from: https://www.congress.gov/bill/114th-congress/senate-bill/1562/text ↵
- Wyden, Ron (2015). One Pager Craft Beverage Modernization and Tax Reform Act of 2015. Retrieved from: https://www.wyden.senate.gov/imo/media/doc/One%20Pager.pdf ↵
- CIDER Act, H. R. 600, 114th Cong. (2015). Retrieved from: https://www.congress.gov/bill/114th-congress/house-bill/600/text ↵
- Pazniokas, Mark and Moore, Maya. (2019) CT Legislature Passes Law to Help Beer, Cider Makers, Hartford Business Journal. Retrieved from: https://www.hartfordbusiness.com/article/ct-legislature-passes-law-to-help-beer-cider-makers ↵
- Jaken Emen, “What the Country’s New Cider Act Means for You” Retrieved from: https://www.eater.com/2016/1/28/10854324/new-us-cider-act ↵
- Brewers Association (n.d.), For Small & Independent Craft Brewers, Brewers Association. Retrieved from: https://www.brewersassociation.org ↵
- Hudson Lindenberger, June 16, 2021 , “Alcohol Consumption In the US Saw Its Most Significant Volume Gain in Almost Two Decades” Retrieved from: https://www.forbes.com/sites/hudsonlindenberger/2021/06/16/alcohol-consumption-in-the-united-states-saw-its-most-significant-volume-gain-in-almost-two-decades-in-2020/?sh=5b55ed8b724d ↵
- Maisey, Jeff (2016, May 19). Devil of a Deal, Virginia Craft Beer. Retrieved from: https://virginiacraftbeer.com/devil-of-a-deal ↵
- Maker’s Mark Ambassador Program (n.d.) Maker’s Mark Ambassador Experience. Retrieved from: https://www.makersmark.com/ambassadors ↵
- Fortune Business Insights (n.d.). Tequila Market Share, Size & COVID-19 Impact Analysis. Report ID: FBI104172. Retrieved from: https://www.fortunebusinessinsights.com/tequila-market-104172 ↵
- U.S. Census Bureau, (2021, August 12). 2020 Census Illuminates Racial and Ethnic Composition of the Country. Retrieved from: https://www.census.gov/library/stories/2021/08/improved-race-ethnicity-measures-reveal-united-states-population-much-more-multiracial.html ↵
- Pete Johnson, P. (2020, November 17). Craft Beverage Modernization and tax reform act. Brewers Association. Retrieved from: https://www.brewersassociation.org/current-issues/craft-beverage-modernization-and-tax-reform-act-24 ↵
- Lucas, A. (2021, June 1). To-Go Cocktails Will Stick Around in at Least 20 States After the Pandemic. CNBC. Retrieved from: https://www.cnbc.com/2021/05/28/to-go-cocktails-will-stick-around-in-at-least-20-states-after-covid.html ↵
- American Restaurant Association and Deloitte Development LLC (2016). 2016 Restaurant Operations Report. Washington, D.C.: National Restaurant Association. p. 5. ↵
- Ibid. ↵
- J. Tribe (2011). The Economics of Recreation, Leisure, and Tourism, 4th ed. Oxford, England: Elsevier. ↵
- Tourism BC (2013). “2009/2010 Outdoor Recreation Study.” Destination British Columbia. Retrieved from: http://www.destinationbc.ca/getattachment/Research/Research-by-Activity/All-Research-by-Activity/Outdoor-Recreation-Study-2009-2010,-January-2013/Outdoor-Recreation-for-Distribution-14Jan13-FINAL-DRAFT-(2).pdf.aspx ↵
- United Nations World Tourism Organization (2014). Global Report on Adventure Tourism. UNWTO and the Adventure Tourism Trade Association. p. 12. Retrieved from: http://cf.cdn.unwto.org/sites/all/files/pdf/final_1global_report_on_adventure_tourism.pdf ↵
- Publisher. (2021, August 16). Adventure Travel is Trending Upward. Leisure Group Travel. Retrieved from: https://leisuregrouptravel.com/adventure-travel-is-trending-upward/ ↵
- K. Colston (2014, April 24). "Non-Traditional Event Venues – Endless Entertainment." Retrieved from: http://helloendless.com/non-traditional-event-venues/ ↵
- CLIA (2016). CLIA 2015 Annual Report: One Voice: Advancing Our Industry Together. Cruise Lines International Association. p. 10. Retrieved from: http://www.cruising.org/docs/default-source/market-research/clia_2015_annualreport_web.pdf?sfvrsn=0 ↵
- Ibid. ↵
- CLIA (2015). CLIA 2015 Cruise Industry Outlook: Cruising to New Horizons and Offering Travelers More. Cruise Lines International Association. p. 28. Retrieved from: http://www.cruising.org/docs/default-source/research/2015-cruise-industry-outlook.pdf ↵
- Government of Canada (2014). “NAICS 2007: 5615 Travel Arrangement and Reservation Services.” Statistics Canada. Retrieved from: http://stds.statcan.gc.ca/naics-scian/2007/cs-rc-eng.asp?criteria=5615 ↵
- C. Goeldner and B. Ritchie (2003). Tourism: Principles, Practices, Philosophies, 9th ed. Hoboken, New Jersey: John Wiley & Sons, Inc. ↵
- Published by Statista Research Department, & 24, M. (2022, May 24). Revenue of Leading OTAs Worldwide 2021. Statista. Retrieved from: https://www.statista.com/statistics/934995/revenue-of-leading-otas-worldwide/ ↵
- C. Goeldner and B. Ritchie (2003). Tourism: Principles, Practices, Philosophies, 9th ed. Hoboken, New Jersey: John Wiley & Sons, Inc. ↵
- The Destination Marketing Association International (2014). “The value of DMOs.” Retrieved from: http://www.destinationmarketing.org/value-dmos ↵

.jpg)