1 The Obstructive Lung Diseases
Learning objectives
- Use pathophysiological characteristics of asthma to distinguish it from other pulmonary disorders.
- Determine the likely cause of airway hyperreactivity from a patient history.
- Use the pathophysiological characteristics of chronic bronchitis and emphysema to distinguish them from other pulmonary disorders.
- Interpret the findings of a physical examination of a person with chronic obstructive pulmonary disease (COPD).
- Describe the pathophysiology of cystic fibrosis.
- Describe the pathological and clinical manifestations of cystic fibrosis.
- Learn the possible etiologies and pathophysiology of bronchiectasis.
- Distinguish the presence of bronchiectasis from patient history, exam, and radiography.
Asthma
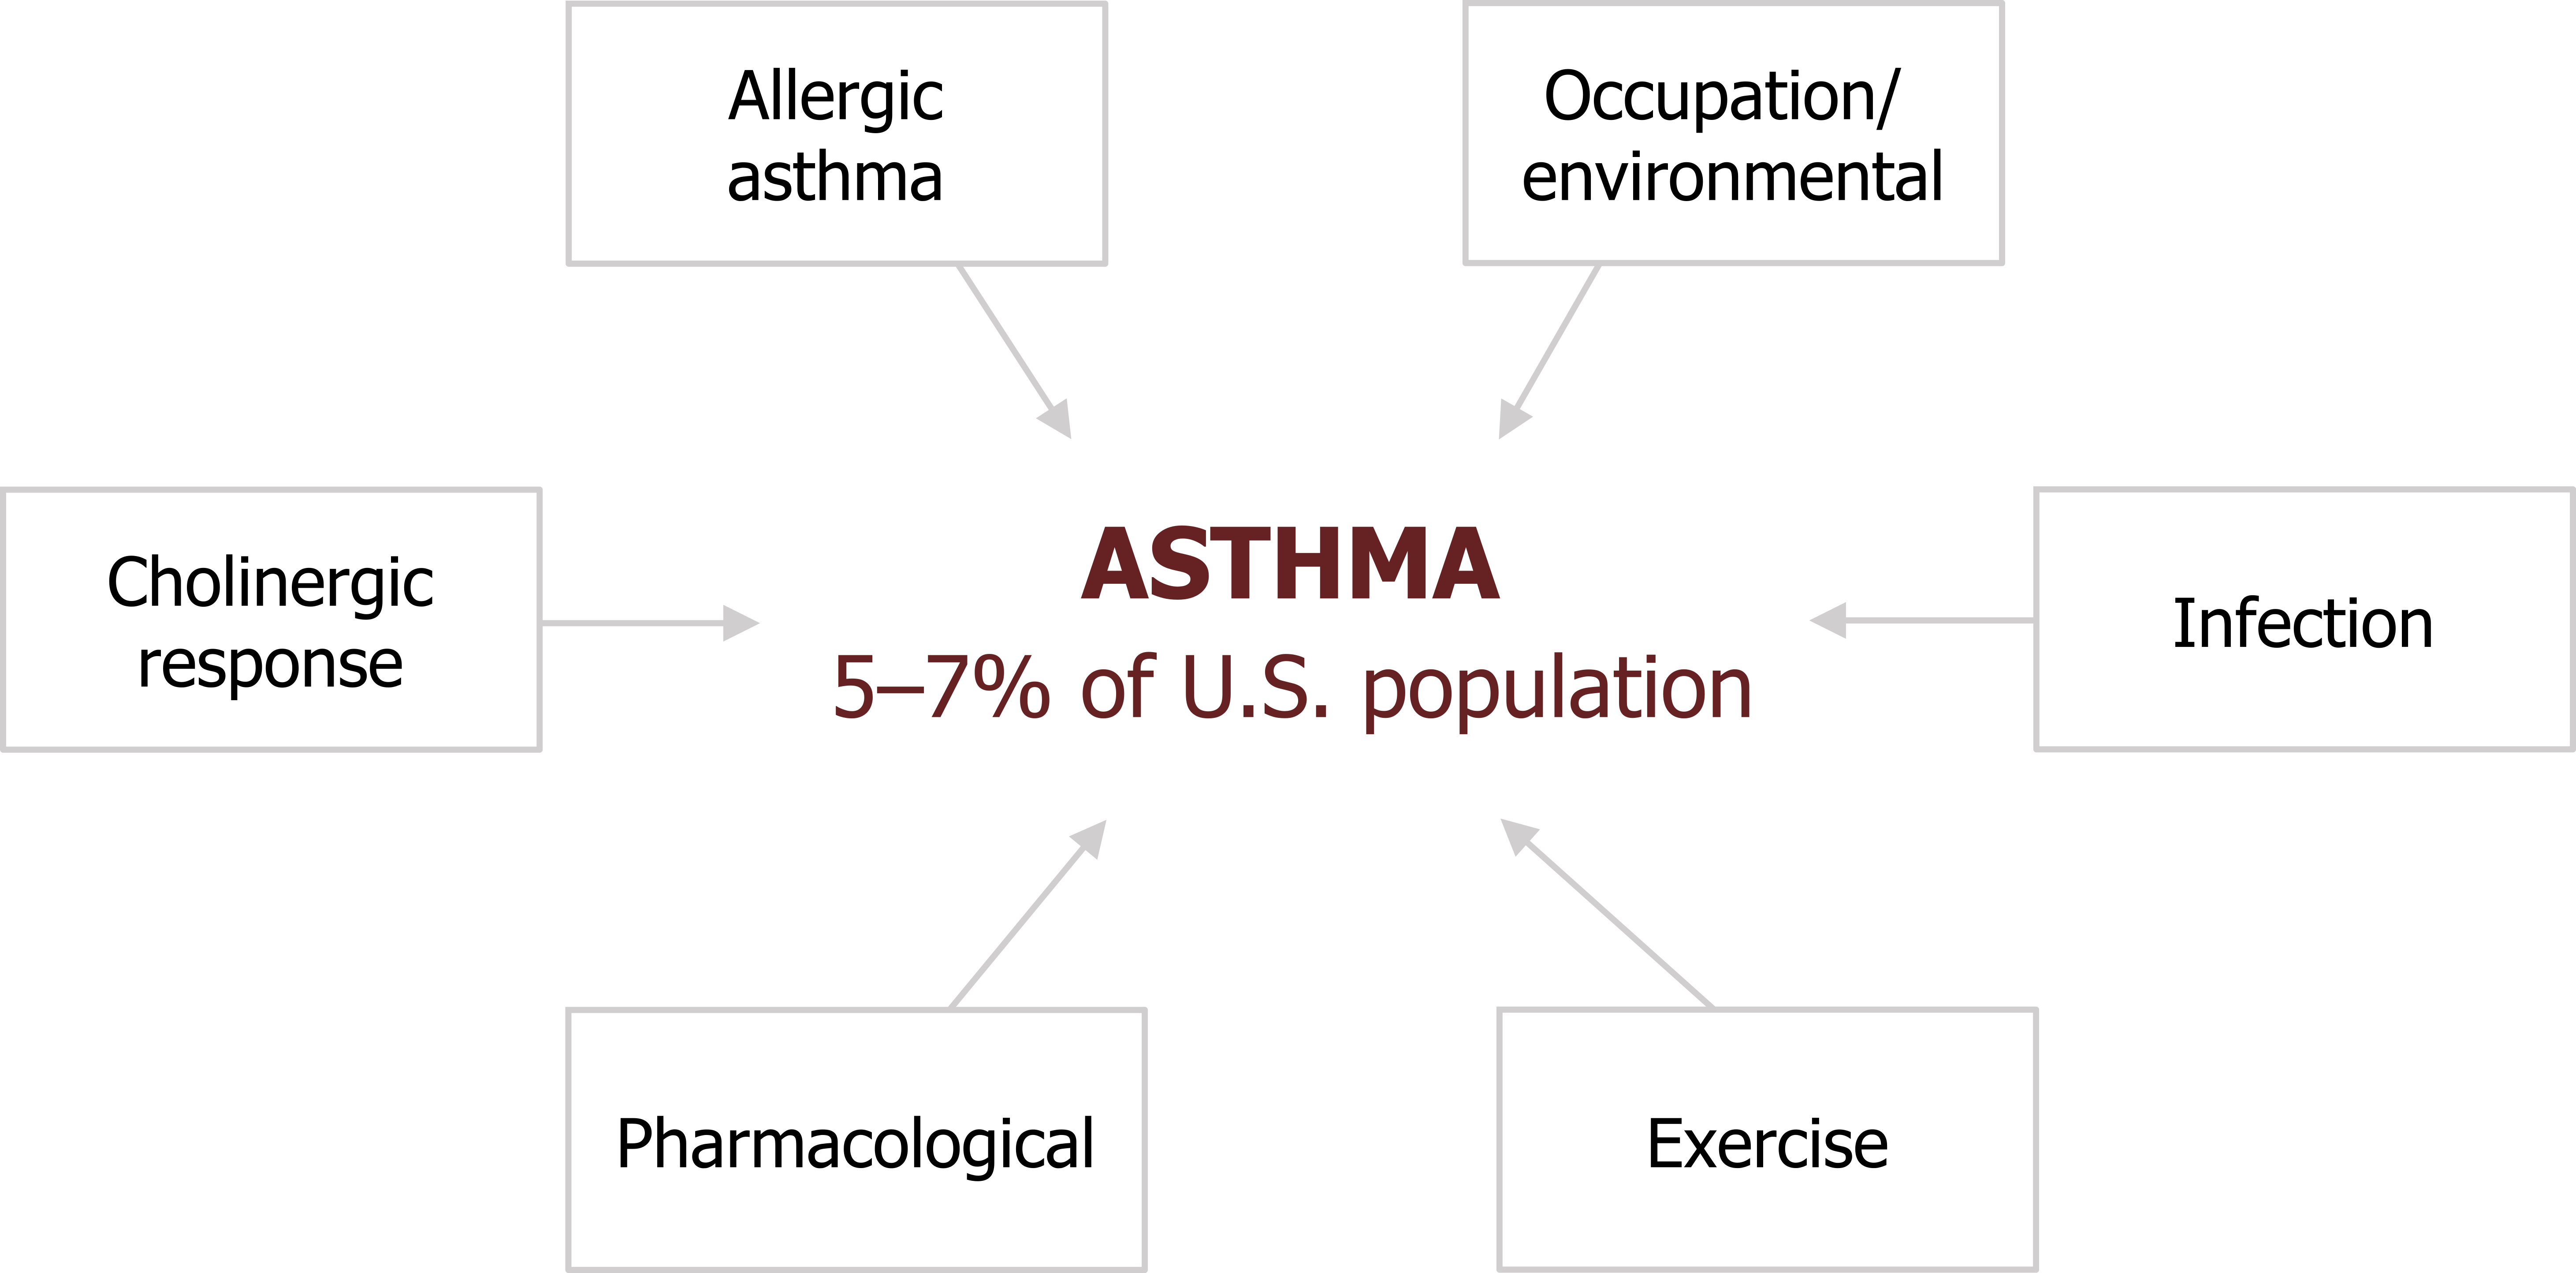
Asthma is a commonly occurring member of the obstructive lung disorders and is distinguished by its acute, or episodic, nature. It affects between 5 and 7 percent of the U.S. population and is characterized by a hyperresponsive airway that shows episodic bronchoconstriction, inflammation, and elevated mucous secretion.
About half of asthma arises before ten years old, and about one-third of all cases have a genetic or familial component.
There are numerous underlying mechanisms of asthma (figure 1.1), and they may not be exclusive or independent within the same patient.
- Allergic asthma: (sometimes called atopic, or extrinsic, asthma) is probably the most common and thoroughly researched.
- Cholinergic: Because airways are under neural control, asthma can also be caused by failing autonomic reflexes.
- Occupational/environmental: Inhaled environmental substances, particularly those found in certain work places, can also sensitize airway responses.
- Infection: Triggering of inflammatory responses to infection can also produce or exacerbate an asthmatic response.
We will also look at how exercise and certain pharmacological agents can produce asthma.
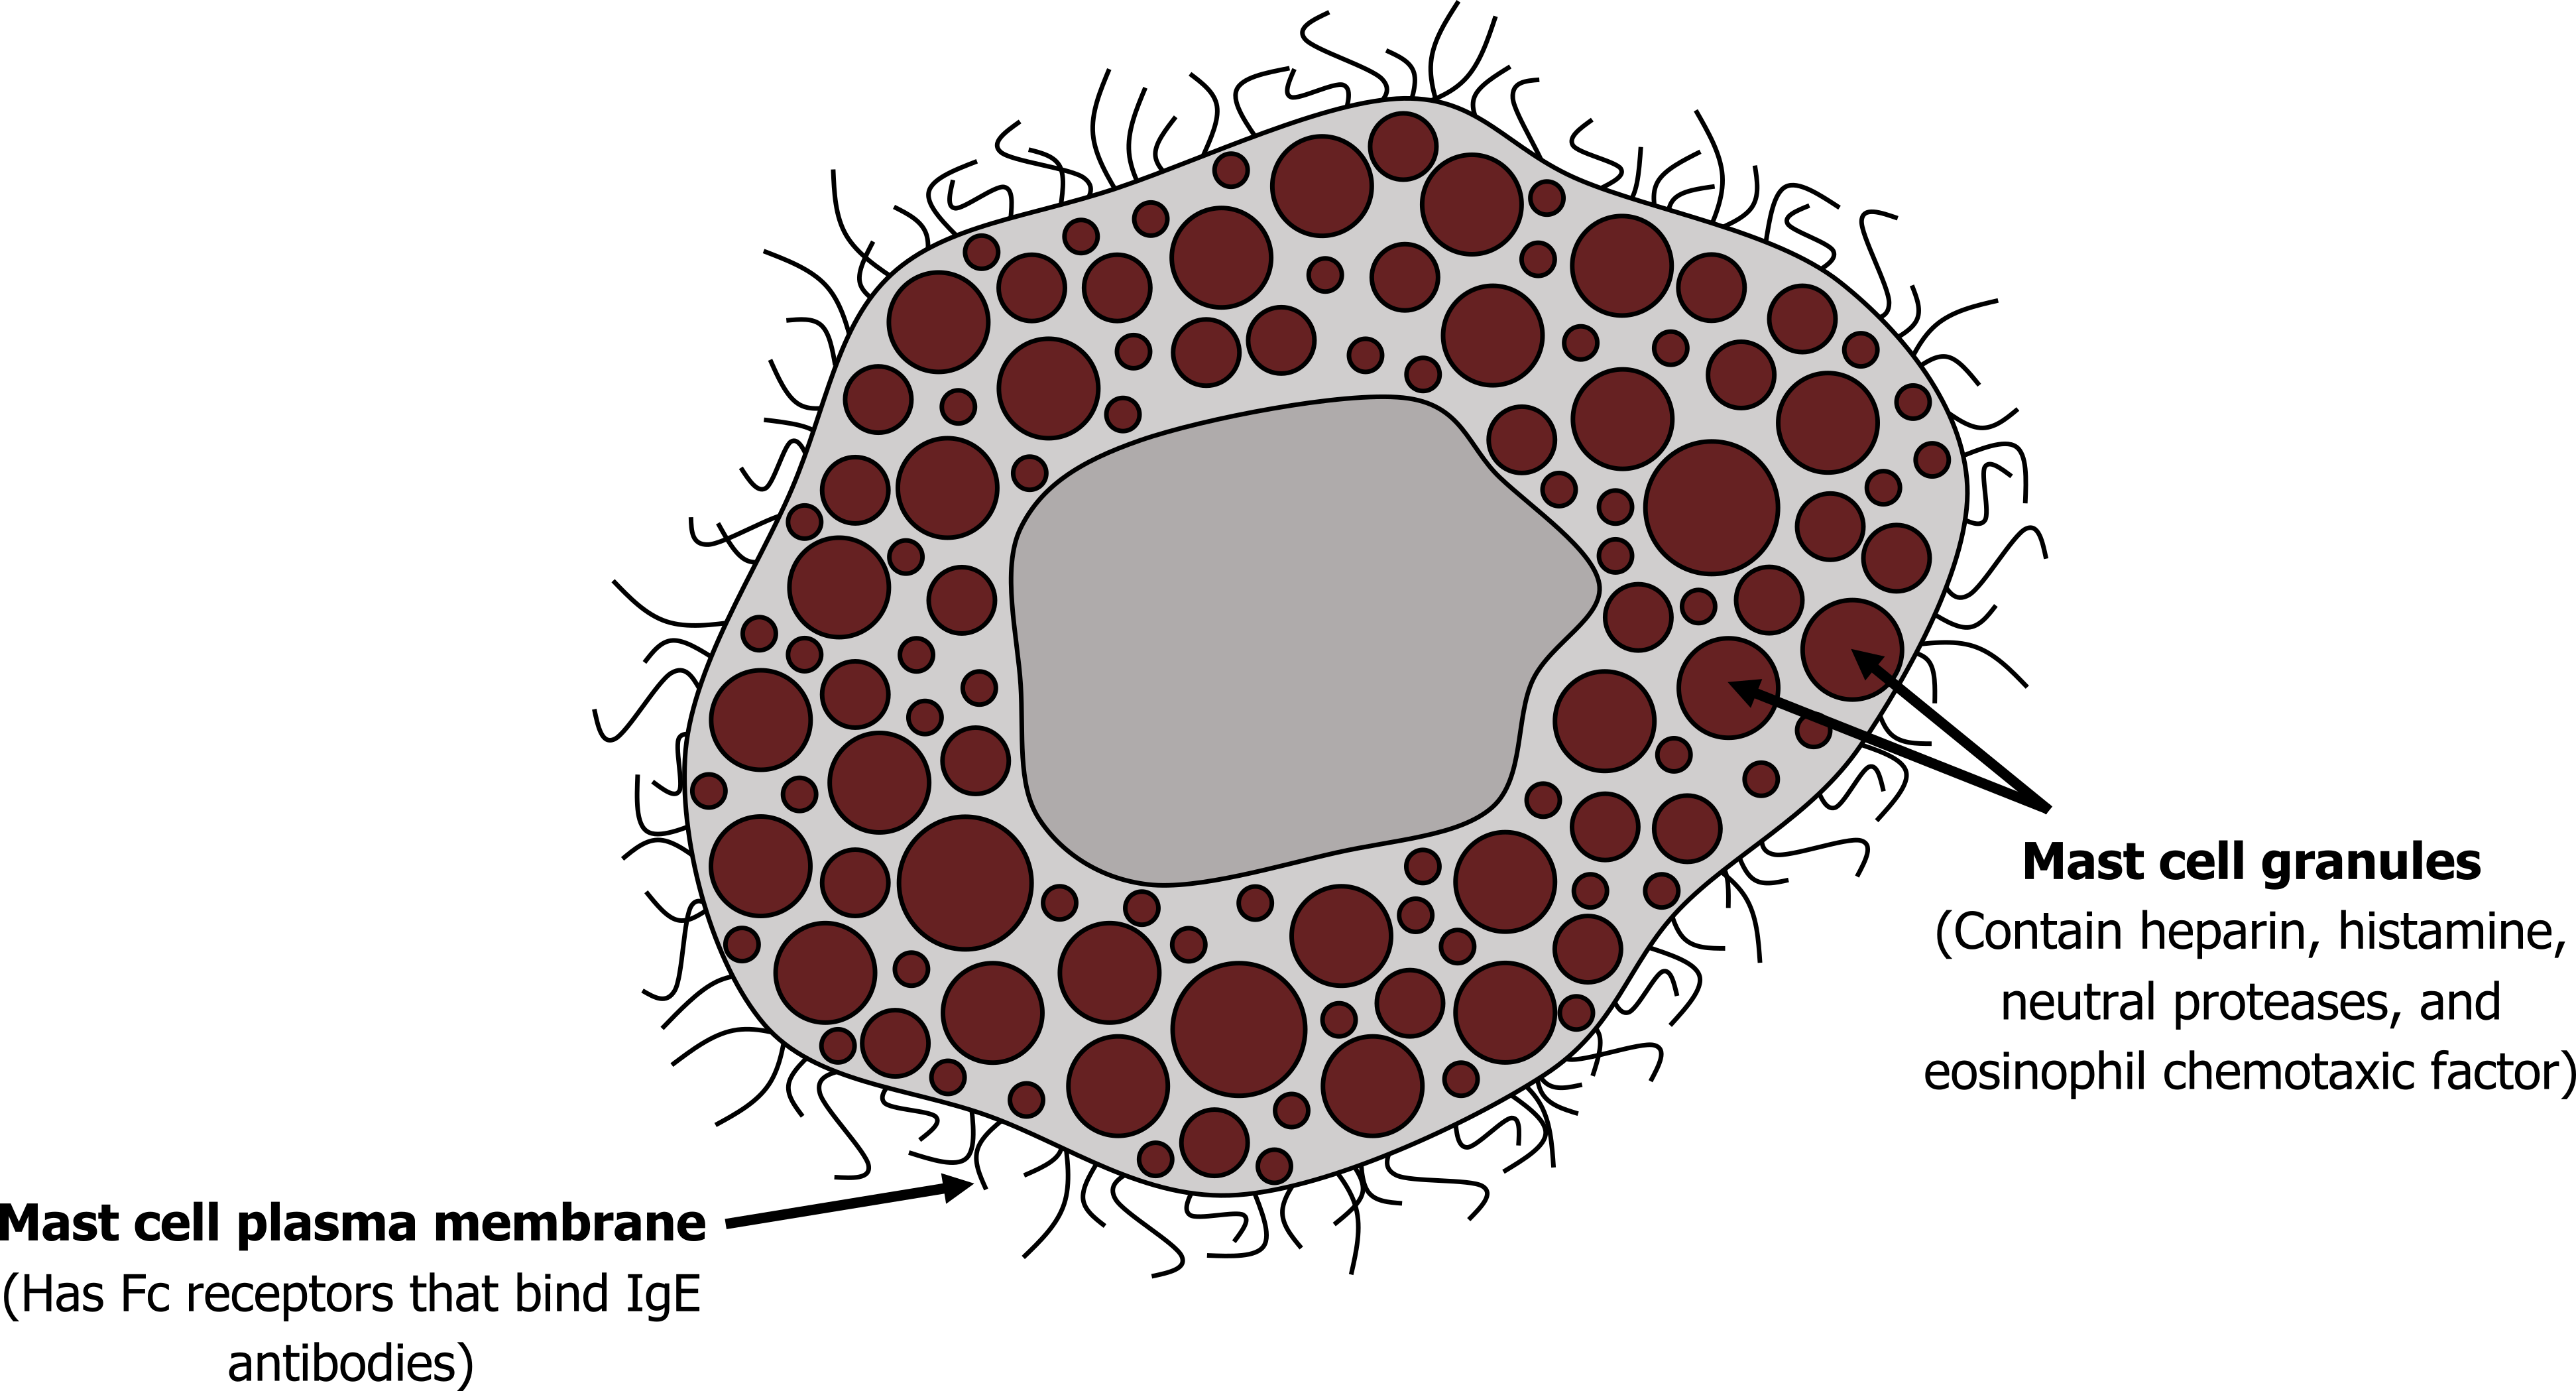
Allergenic asthma: Most allergic asthma is caused by the presence of an excessive amount of IgE (the hallmark antibody of an allergy). Formation of an immune complex between the antigen and the overexpressed IgE results in binding to surface receptors on mast cells and basophilic granulocytes, of which there are plenty in the lung. The IgE receptor binding results in the release of a cocktail of proinflammatory and airway-active substances. Some of these, including histamine and cytokines that attract eosinophils and neutrophils, are stored in vesicles of mast cells shown in figure 1.2. Others are produced on demand, including leukotrienes, and are derivatives of arachidonic acid (we will return to this later).
The results of this cocktail’s release are the hallmarks of asthma:
- contraction of smooth muscle in the airway, producing bronchoconstriction;
- microvascular leaking and congestion, producing airway wall edema; and
- increased airway secretion.
The timeline from the exposure to the antigen to asthmatic response is not straightforward. A response may occur within minutes (“early response”), or hours later (“late response”). Some patients show only an early response, some only a late one, and some show both in a “dual” response. The late response may correspond to the arrival of leucocytes in response to the initial release of cytokines. It may also be due to a mild stimulus arriving later in an airway that was sensitized earlier.
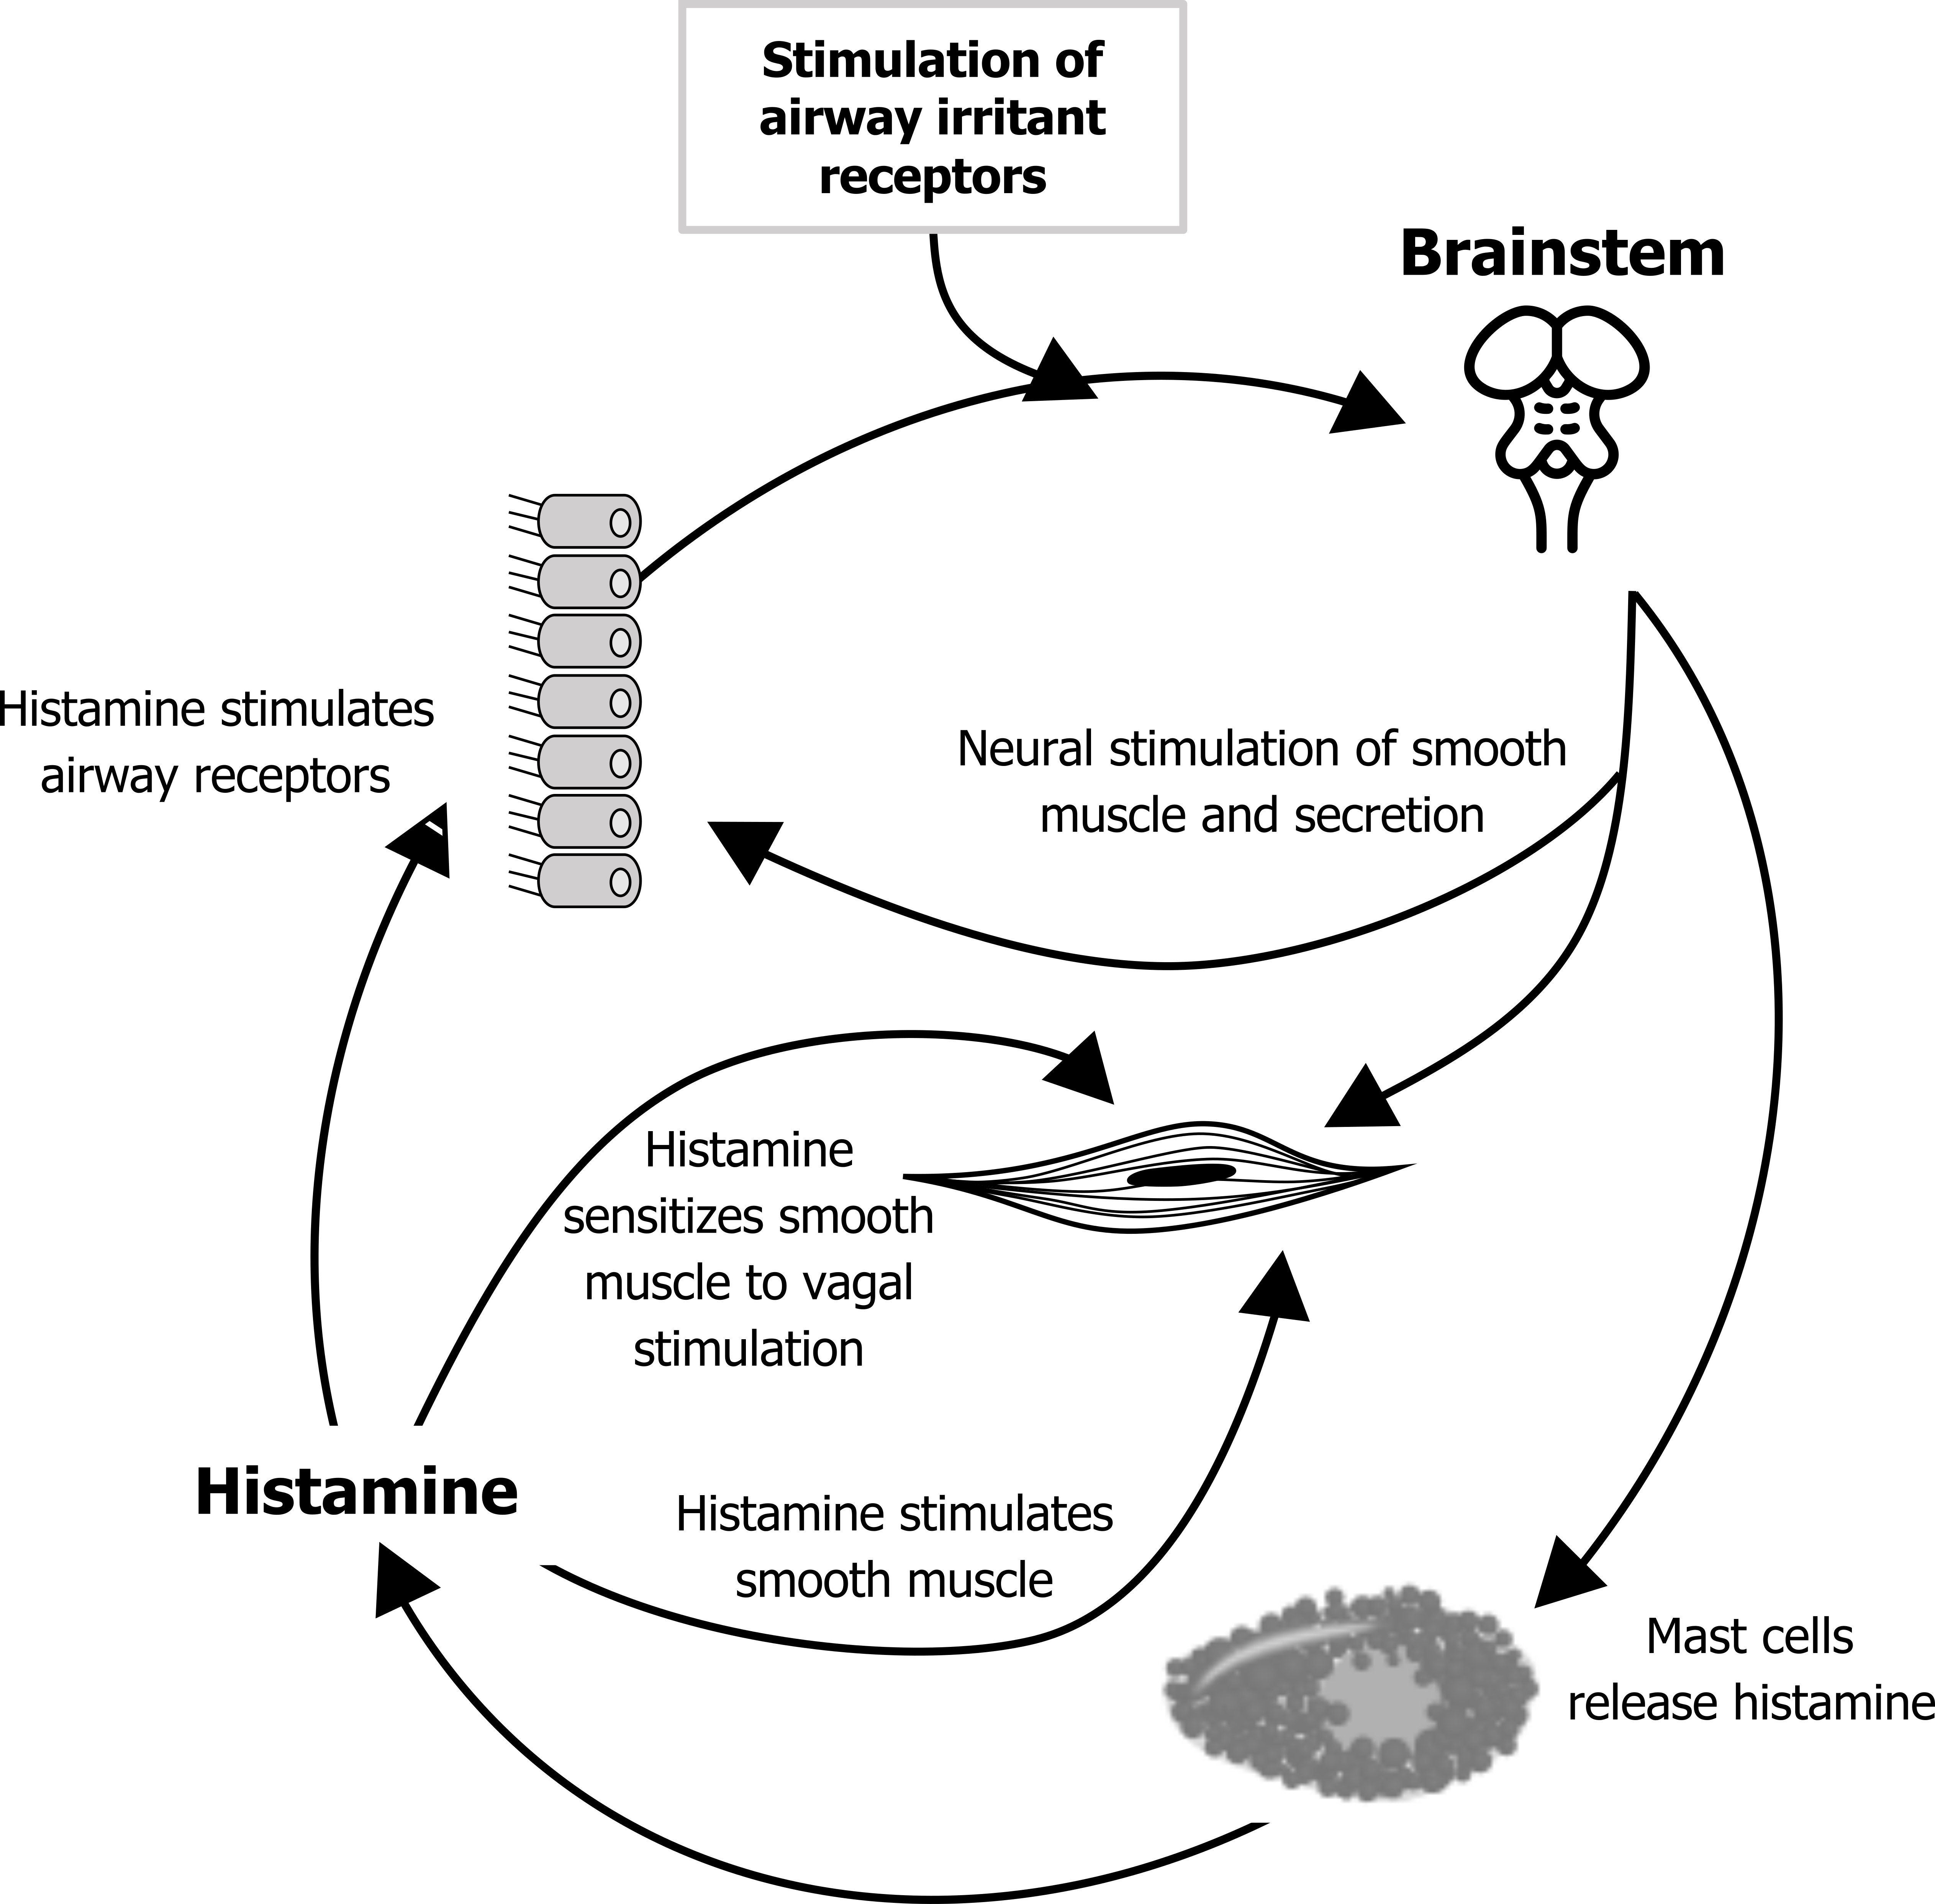
Cholinergic asthma: Because it is open to the external environment, the airway has defensive, vagal reflexes (figure 1.3). An inappropriate exaggeration of some of these may lead to asthma. The basic reflex arch that ends with a cholinergic response begins with stimulation of airway irritant receptors in the epithelium. An afferent signal to the brainstem instigates an efferent signal to cause airway smooth muscle contraction and mucus secretion by glandular cells. The reflex also stimulates mast cells to release their cocktail, which includes histamine.
The released histamine stimulates the airway receptors, setting up the potential for a positive feedback loop and perpetuating the cycle of bronchoconstriction and secretion. The histamine also stimulates bronchoconstriction through its direct action on the smooth muscle as well as sensitizing the smooth muscle to further vagal stimulation. These processes are summarized in figure 1.3.
The cholinergic response may help produce an asthmatic response to another stimulus that normally would not have produced one (i.e., it may play a part in the hypersensitivity of the asthmatic airways). Likewise, the presence of an infection, particularly a viral infection, may place the airway in a proinflammatory state.
Neural airway control may also contribute to the high prevalence of nocturnal asthma, as during rest when the airways are predominantly under parasympathetic control. But other factors (summarized in figure 1.4) may contribute:
- Normal circadian fluctuations in epinephrine, cortisol, histamine, and other circulating factors may leave the airway more susceptible at night or the early morning.
- The normal suppression of the cough reflex may leave secretions in the airway and promote a proinflammatory state.
- The airway may also be demonstrating a late response to an exposure that happened earlier in the day.
- Being in the supine position promotes gastric reflux, which, while not necessarily causing aspiration, can induce oesphageal vagal reflexes that instigate the airway defensive reflexes we have just seen.

Figure 1.4: Factors promoting asthma at night.
Exercise-induced asthma: Although exercise is associated with increased airway caliber, it can also induce asthma. Increased airway flow to meet the increased metabolic demand of exercise results in loss of fluid and heat from airway surfaces. This leaves the peribronchial fluid in a hypertonic state and causes excitation of the irritant airway receptors, which leads to release of the mast cells’ cocktail.
Exercise-induced asthma is more prevalent in cold (i.e. dry air) where water loss will be higher, so occurs more in sports such as cross-country skiing than swimming in a warm humid environment. Bronchoconstriction usually occurs when exercise stops—when the protective effect of sympathetic activity to the airway smooth muscles ceases.
Drug-induced asthma: There are several pharmaceutical and food products that can promote asthma, including tartrazine (a yellow food coloring) and sulfides used as food preservatives. Additionally, 10 to 20 percent of asthmatics are sensitive to aspirin.
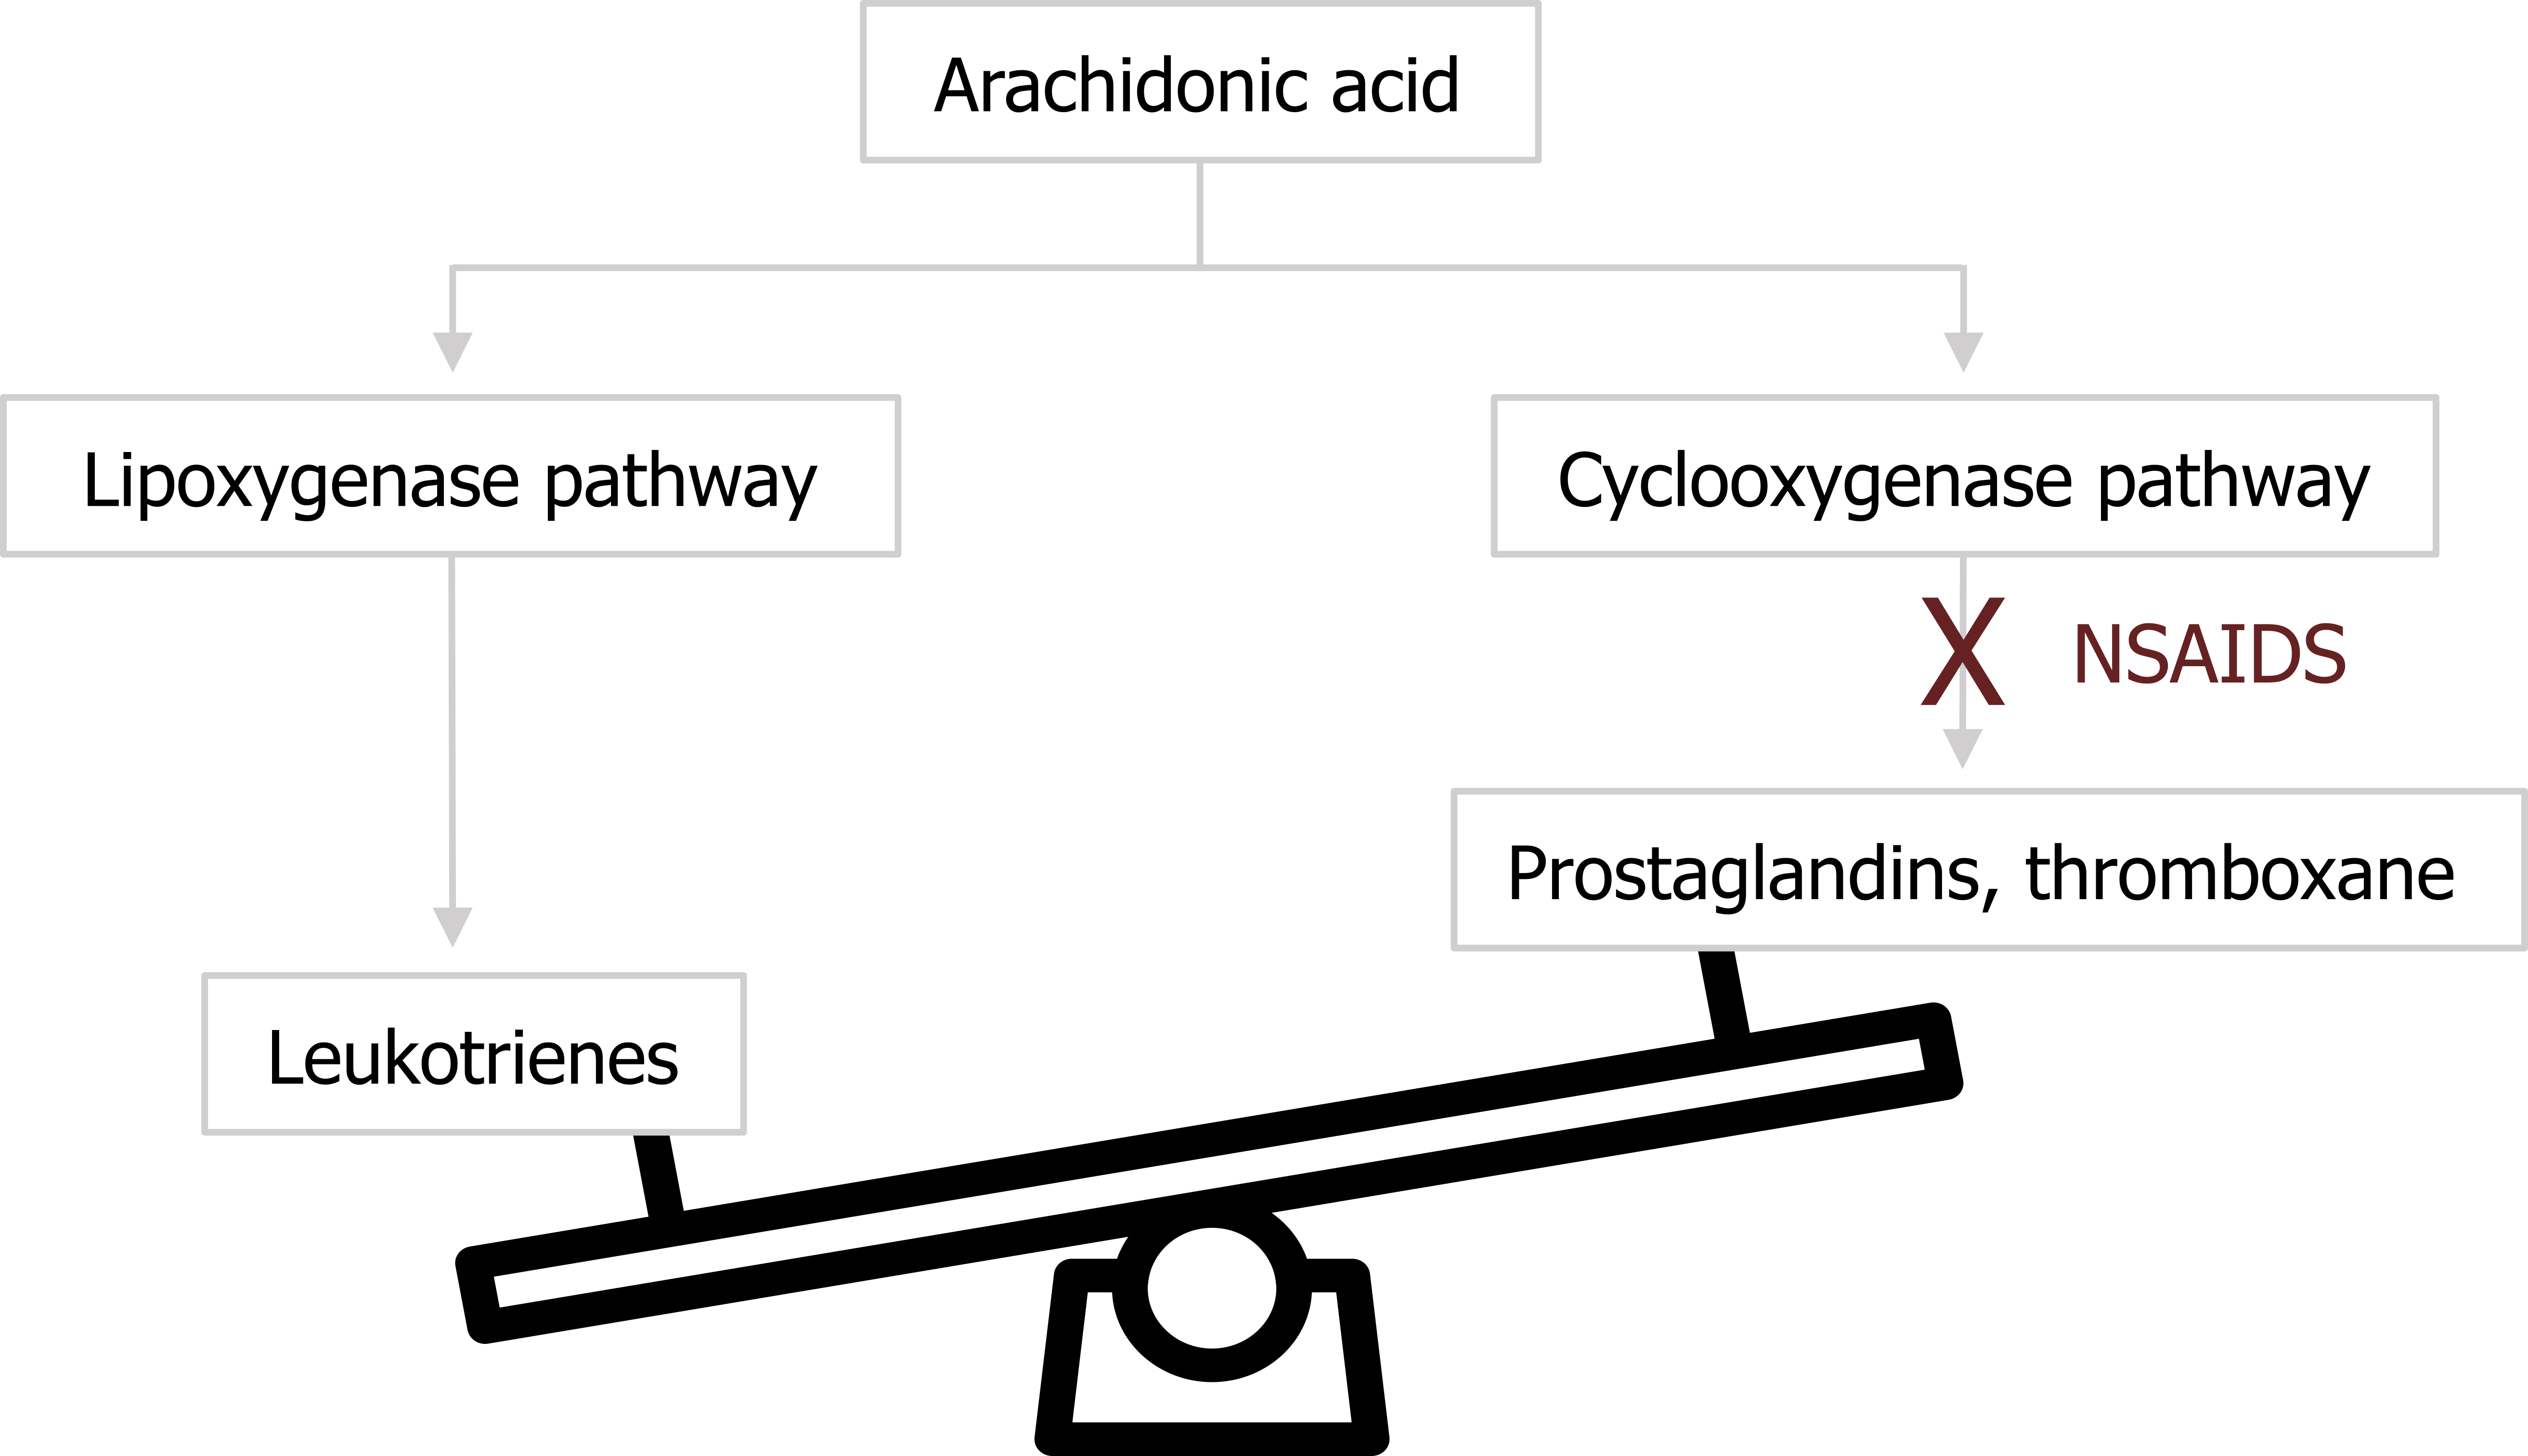
Recall that some of the on-demand components of the mast cell’s cocktail were derived from arachidonic acid. There are two pertinent pathways in which arachidonic acid is used: the lipoxygenase pathway and the cyclooxygenase pathway (figure 1.5). The first leads to the production of leukotrienes, which are potent bronchoconstrictors. The second leads to the production of prostaglandins and thromboxane. Normally the distribution of arachidonic acid down these pathways is balanced to meet demand. However, NSAIDS such as aspirin are COX 2 inhibitors and block the cyclooxygenase route, leaving more substrate for the lipoxygenase pathway and production of leukotrienes (figure 1.5) with their bronchoconstrictive effect.
Environmental/occupational asthma: As the airway is open to the environment, it is susceptible to inhaled substances that can cause sensitization; there are over two hundred substances known to cause asthma, both organic and inorganic. Some common ones are listed below.
| Chemical | Occurrence |
|---|---|
| Isocyanates | Polyurethane, plastics, varnish, spray paints |
| Trimellitic anhydride | Epoxy resins |
| Organic dust | Plants, grains, animal products |
Table 1.1: Some of the most common environmental causes of asthma. Taking a pulmonary history should include asking about potential environmental exposures.
Determining whether airway hypersensitivity is due to environmental factors is complicated by widely varying latency periods. Short latency periods can be as brief as twenty-four hours and are associated with vapor or smoke exposure that does not cause an immunological response. Longer latency periods that may last years are more commonly associated with an immunological response to large particles that act like antigens.
The situation is further confused by occupation-related responses, which often cause the airway to become more sensitive to some of the other causes of asthma covered here. This makes the role of an environmental factor more difficult to determine.
Pathophysiology of Asthma
With numerous and maybe concurrent mechanisms, what does asthma look like in the airway? The normal lumen of the airway has a relatively lower resistance, as depicted in panel A of figure 1.6, but in mild asthma the lumen is narrowed (thereby raising resistance to airflow) through swelling of the airway wall, contraction of airway smooth muscle, and blockage (or plugging) of the airway by increased mucus secretion (figure 1.6B). This worsens in more severe asthma until the lumen can be extremely narrow (figure 1.6C) or even completely blocked.
Other characteristics of asthma include the presence of eosinophillic that infiltrate into the airway walls. The eosinophil enzymes also leave a telltale sign: Charcot–Leyden crystals, as shown in the circled area of figure 1.7A.
The sputum of the asthmatic may also contain Curshman’s spirals (figure 1.7B), which are casts of small bronchioles consisting of mucus and shed epithelial cells. However, Curshman’s spirals are not exclusive to asthma.
With persistent asthma the airway undergoes remodeling (figure 1.8), with thickening of the airway wall and basement membrane, enlarged submucosal glands, and hypertrophy and hyperplasia of airway smooth muscle.
Clinical Presentation of Asthma
One useful diagnostic element of asthma is its episodic or acute behavior. However, as patients may be asymptomatic between attacks, the severity of asthma can be difficult to determine without performing bronchial challenge tests.
The characteristic signs of asthma progress and vary with declining FEV1 (summarized in figure 1.9). Most attacks start with mild wheezing and coughing, which progress with the severity of attack. The location and form of sensations vary between patients, but most asthmatics complain of chest tightness. This sensation is more commonly reported by asthmatics than other pulmonary patients, so it is a useful diagnostic sign.
As airway resistance increases, the accessory muscles are deployed to maintain sufficient airflow through the narrowing airways, and the patient experiences an increased effort to breathe. Increased expiratory efforts produce dynamic airway collapse and lead to hyperinflation. Further decreases in airway caliber result in insufficient alveolar ventilation and deranged blood gases. The sensation reported at this point is air hunger. Once the patient is severely bronchoconstricted, delivery of inhaled therapies is much more difficult, and mechanical ventilation to support the respiratory muscles becomes complicated. Other signs present during a severe attack are raised heart (tachycardia) and breathing (tachypnea) rates as well as a paradoxical pulse (i.e., a rise in blood pressure during expiration).
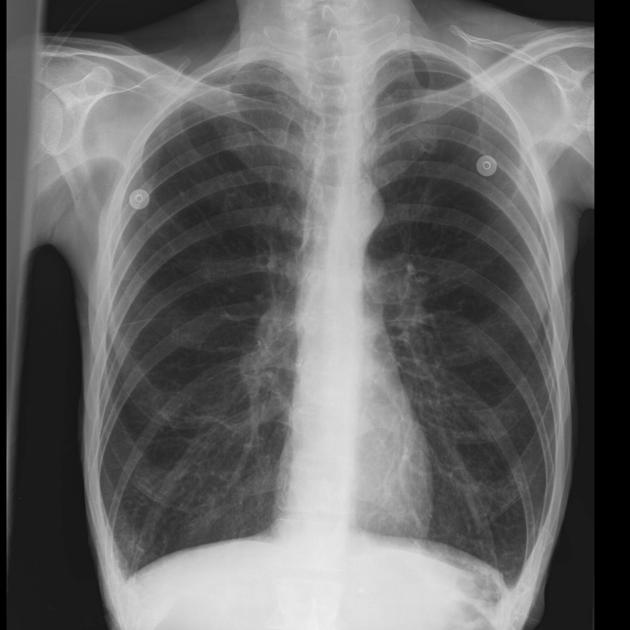
The typical chest x-ray of an asthmatic (figure 1.10) shows hyperlucent lung fields, evidence of hyperinflation and peribronchial infiltrate, and perhaps areas of atelectasis. However, the chest x-ray is not particularly effective at distinguishing asthma from some other obstructive disorders.
Chronic Obstructive Pulmonary Disease
Chronic obstructive pulmonary disease, or COPD, actually covers two obstructive disorders—chronic bronchitis and emphysema.
Although chronic bronchitis and emphysema have different underlying pathologies, they frequently have the same root cause and are often found together in a patient. In brief, chronic bronchitis is associated with an increase in mucus production, while emphysema involves disruption of the lung structure.
The relative role of chronic bronchitis in COPD has diminished since the Clean Air Act reduced atmospheric sulphur dioxide, but with 90 percent of COPD caused by cigarette smoking there is still plenty of bronchitis and emphysema to treat—at enormous cost to the health system from over eight million hospitalizations a year that are mostly paid for by Medicare. The COPD patient tends to be older and poorer and will likely have comorbidities, the most common of which is hypertension. What is perhaps more disturbing is that of the most common causes of death, COPD is the only one whose incidence continues to rise.
We will now look at the underlying mechanisms of COPD. Despite the fact it is usually composed of some elements of both chronic bronchitis and emphysema, we will deal with each separately for the sake of simplicity.
Chronic Bronchitis
Chronic bronchitis is clinically defined as a persistent and productive cough that lasts for at least three months per year for two consecutive years.
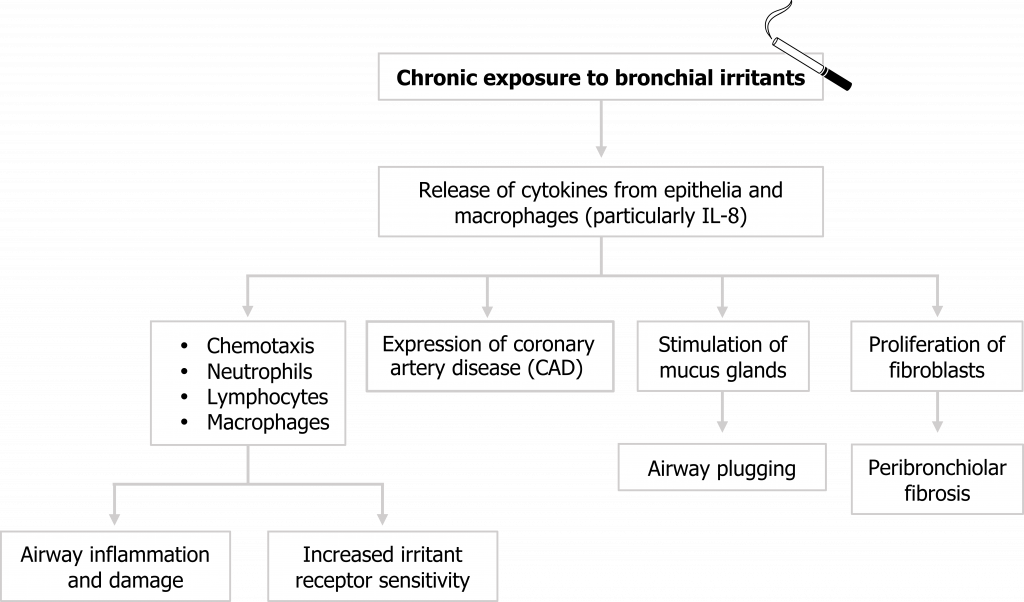
Chronic bronchitis arises from chronic exposure to bronchial irritants, the most common of which is tobacco smoke. These irritants initiate the release of cytokines from airway epithelial cells and macrophages that result in a cascade of responses (summarized in figure 1.11).
Neutrophils, lymphocytes, and macrophages are attracted to the irritated airway, and their presence is maintained through increased expression of cell adhesion molecules on the airway walls. These immune cells lead to acute airway wall inflammation that narrows the airway, and if chronic, can lead to tissue damage. The cytokines released by these cells also sensitize airway irritant receptors, which exacerbates the response to future irritant exposure.
Mucus production increases, and the glands themselves may also release cytokines that further exacerbate the inflammatory response. The mucus also contributes to airway narrowing, and mucus plugs may form that completely block bronchioles.
Mesenchymal cells transition into fibroblasts as part of the inflammatory response, and their chronic presence leads to the deposition of fibrotic tissue.
Collectively these responses to the irritants result in a narrowed airway that is (1) hypersensitive, (2) fibrosed, and (3) blocked by excessive secretions.
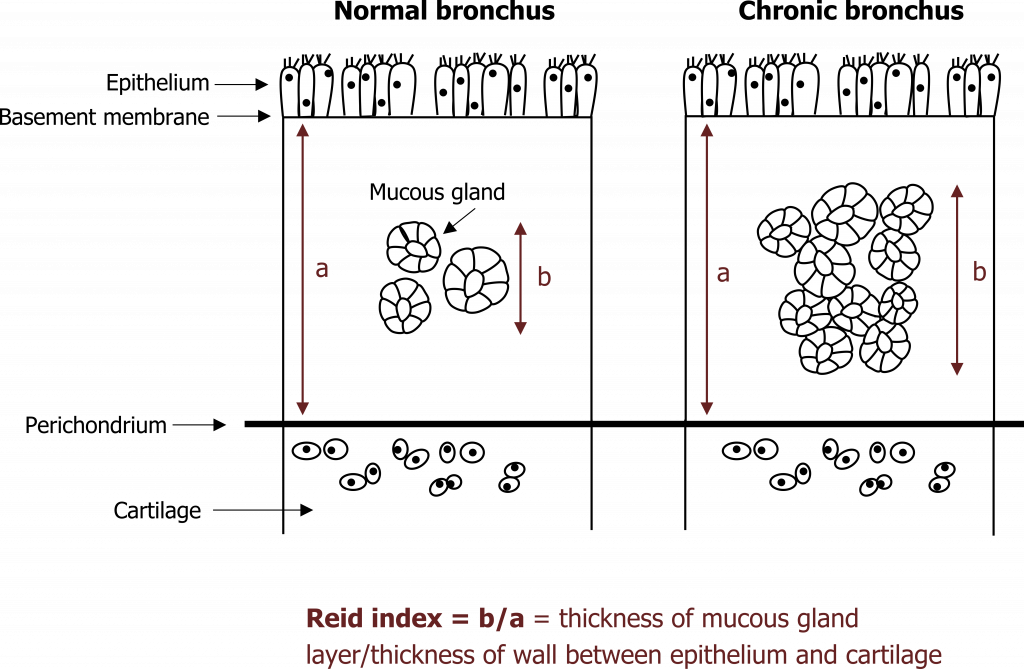
Continued exposure to irritants leads to other chronic changes beyond fibrosis. With excessive stimulation, the size and number of mucus glands increases. The size of mucosal glands is used as a diagnostic test, and the Reid index describes what proportion of the submucosa is spanned by a gland—in the normal airway a normal gland spans less than 40 percent of the submucosa’s depth, but in chronic bronchitis this exceeds 50 percent (figure 1.12).
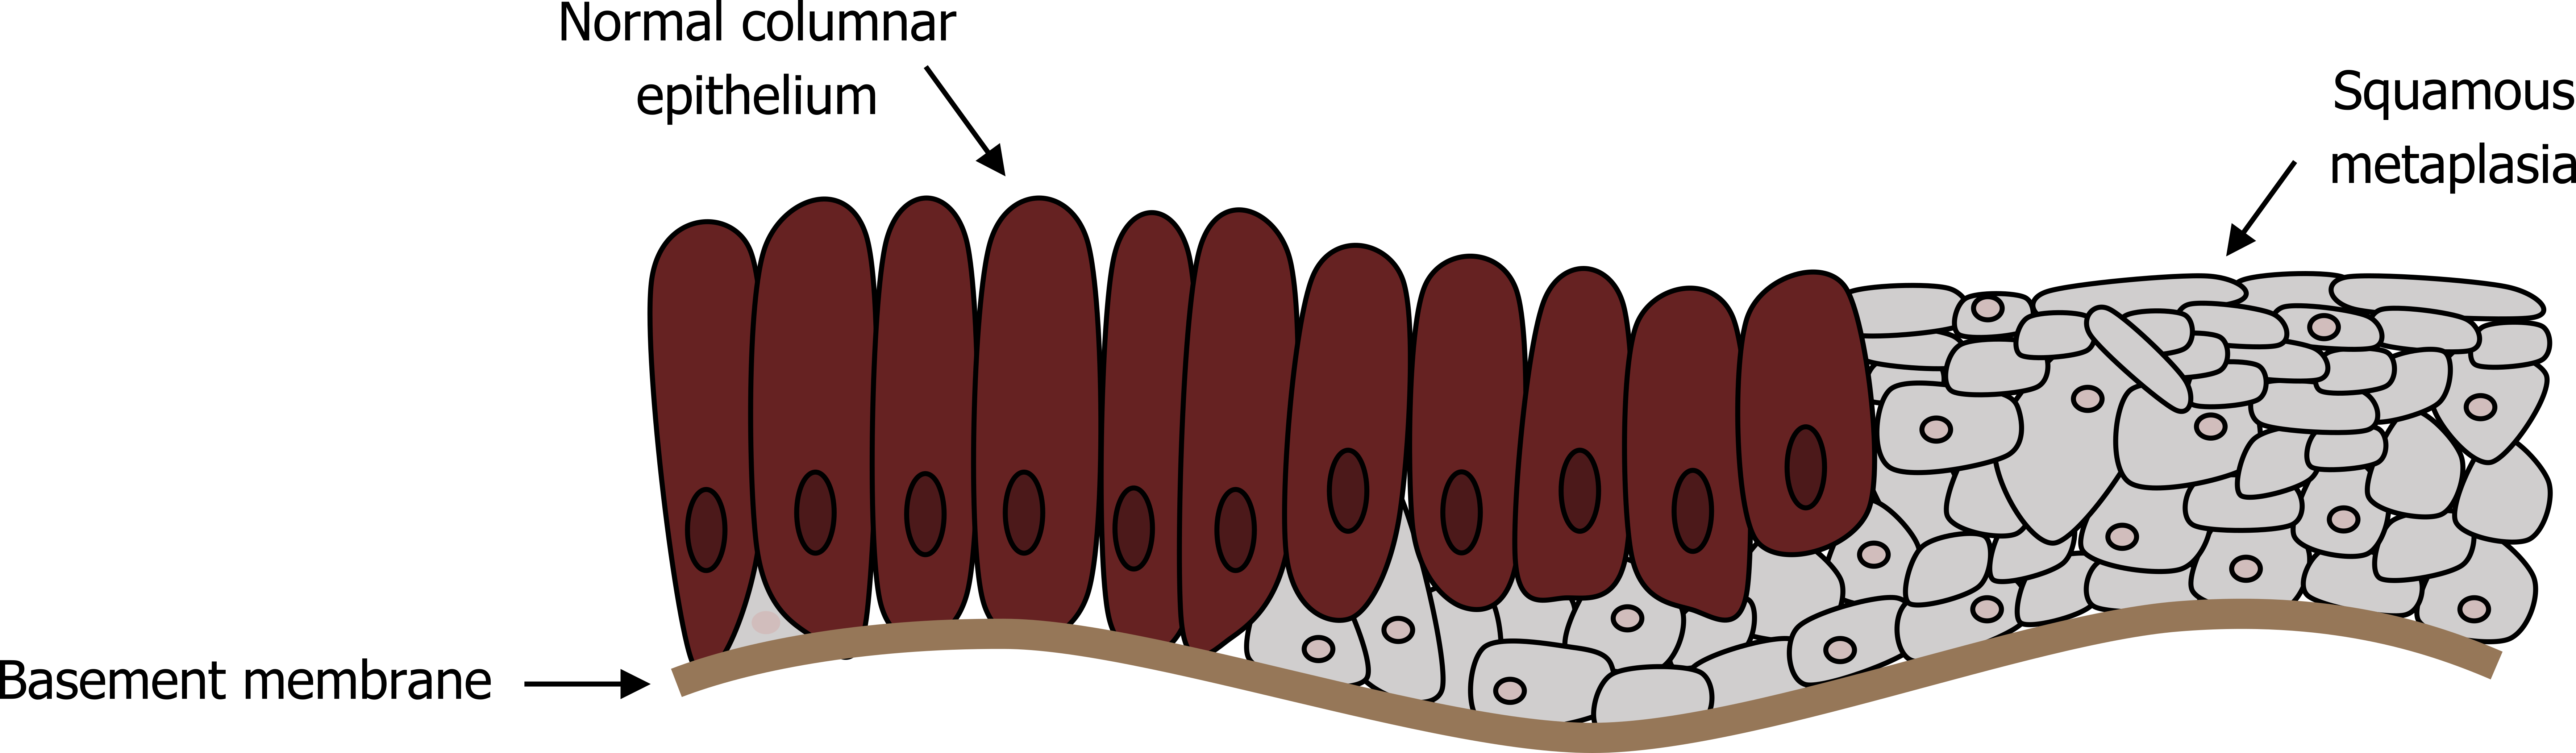
In conjunction with an increased mucus production capacity, the airway has a reduced mucus clearance capability with airway remodeling, including squamous metaplasia replacing normal ciliated columnar epithelium (figure 1.13). The mucus escalator is also compromised by a decline in function of the remaining cilia with exposure to cigarette smoke.
These changes result in an airway that produces more mucus and is less capable of removing it. The static mucus not only causes airway plugging, but can also promote infections that lead to episodic and characteristic exacerbation of COPD symptoms.
Clinical Presentation of Chronic Bronchitis
The signs and symptoms of chronic bronchitis depend on the level of airway obstruction and the consequent decline in lung function (summarized in figure 1.14).
As with many pulmonary diseases, the onset can be insidious. Small airway damage may be present but undetectable with normal spirometry, while the patient becomes accustomed to and tolerates a persistent productive cough. However, with continued irritant exposure, this initial simple bronchitis progresses.
Secretions continue to worsen and peribronchiolar fibrosis marks the onset of obstructive bronchitis that is reflected by significant expiratory airflow limitation. At this point the patient may have tolerated years of productive cough and experienced frequent chest infections related to poor mucus clearance. COPDers are particularly susceptible to Haemophilus influenza and Streptococcus pneumoniae. The sputum is abundant and capable of plugging significant numbers of airways and may be blood tinged; COPD is the most common cause of hemoptysis. Airways may demonstrate hyperreactivity and mimic an asthmatic response.
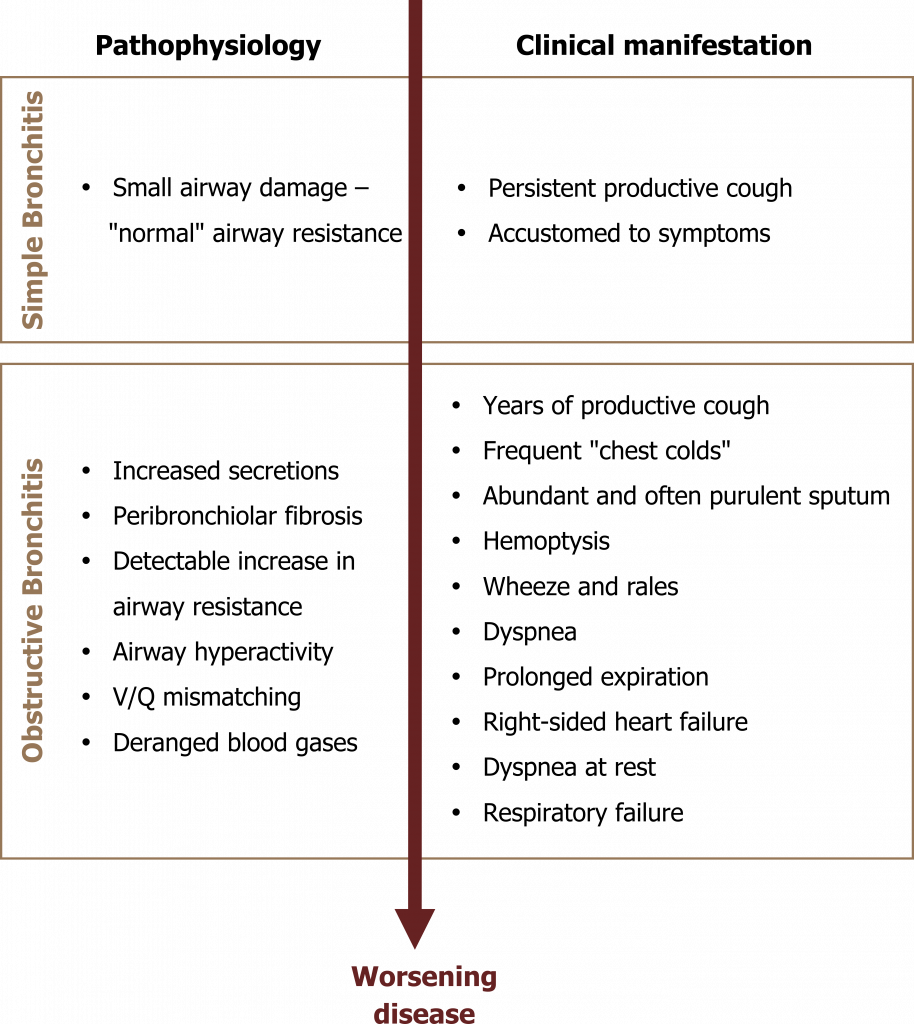
The onset of dyspnea is insidious and is usually first experienced during exertion—leading the patient to avoid exercise, which in turn leads to deconditioning and a worsening of the symptom. Lung sounds include wheezes and rales, the rales often clearing after cough.
With worsening airway flow limitation expiration becomes prolonged and may be incomplete due to airway collapse that leads to characteristic hyperinflation.
Mucus plugging and airway closure leads to areas of V/Q abnormalities through the lung, and localized areas of hypoxia can lead to pulmonary vasoconstriction. When significant regions of the lung are vasoconstricted, pulmonary vascular resistance can rise enough to induce right-sided heart failure.
With continued progression of the disease, blood gases become deranged as insufficient alveolar ventilation is achieved. As the disease approaches its end stage, the patient experiences dyspnea at rest until respiratory failure occurs and the patient is hypoxemic and hypercarbic.
Emphysema
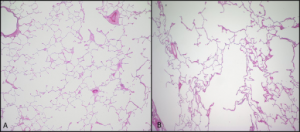
Emphysema, a possible second component to COPD, involves permanent enlargement of airspaces distal to the terminal bronchioles and destruction of alveolar walls, as is evident in figure 1.15.
The pattern of airspace destruction varies with underlying cause and revolves around the acinus (figure 1.16), the functional unit of the lung comprised of the terminal airways and the alveoli that collectively make up the respiratory zone of the lung. In its broadest classification, emphysema can take on either a centriacinar or panacinar distribution (figure 1.16). In centriacinar emphysema, the respiratory duct is affected while the distal alveoli are mostly unaffected. This is more commonly found in the upper lung fields and associated with smoking and the concurrent presence of chronic bronchitis.
This pathology slide in figure 1.15 illustrates this pattern of tissue destruction with isolated areas of damage, surrounded by relatively normal alveolar structure.
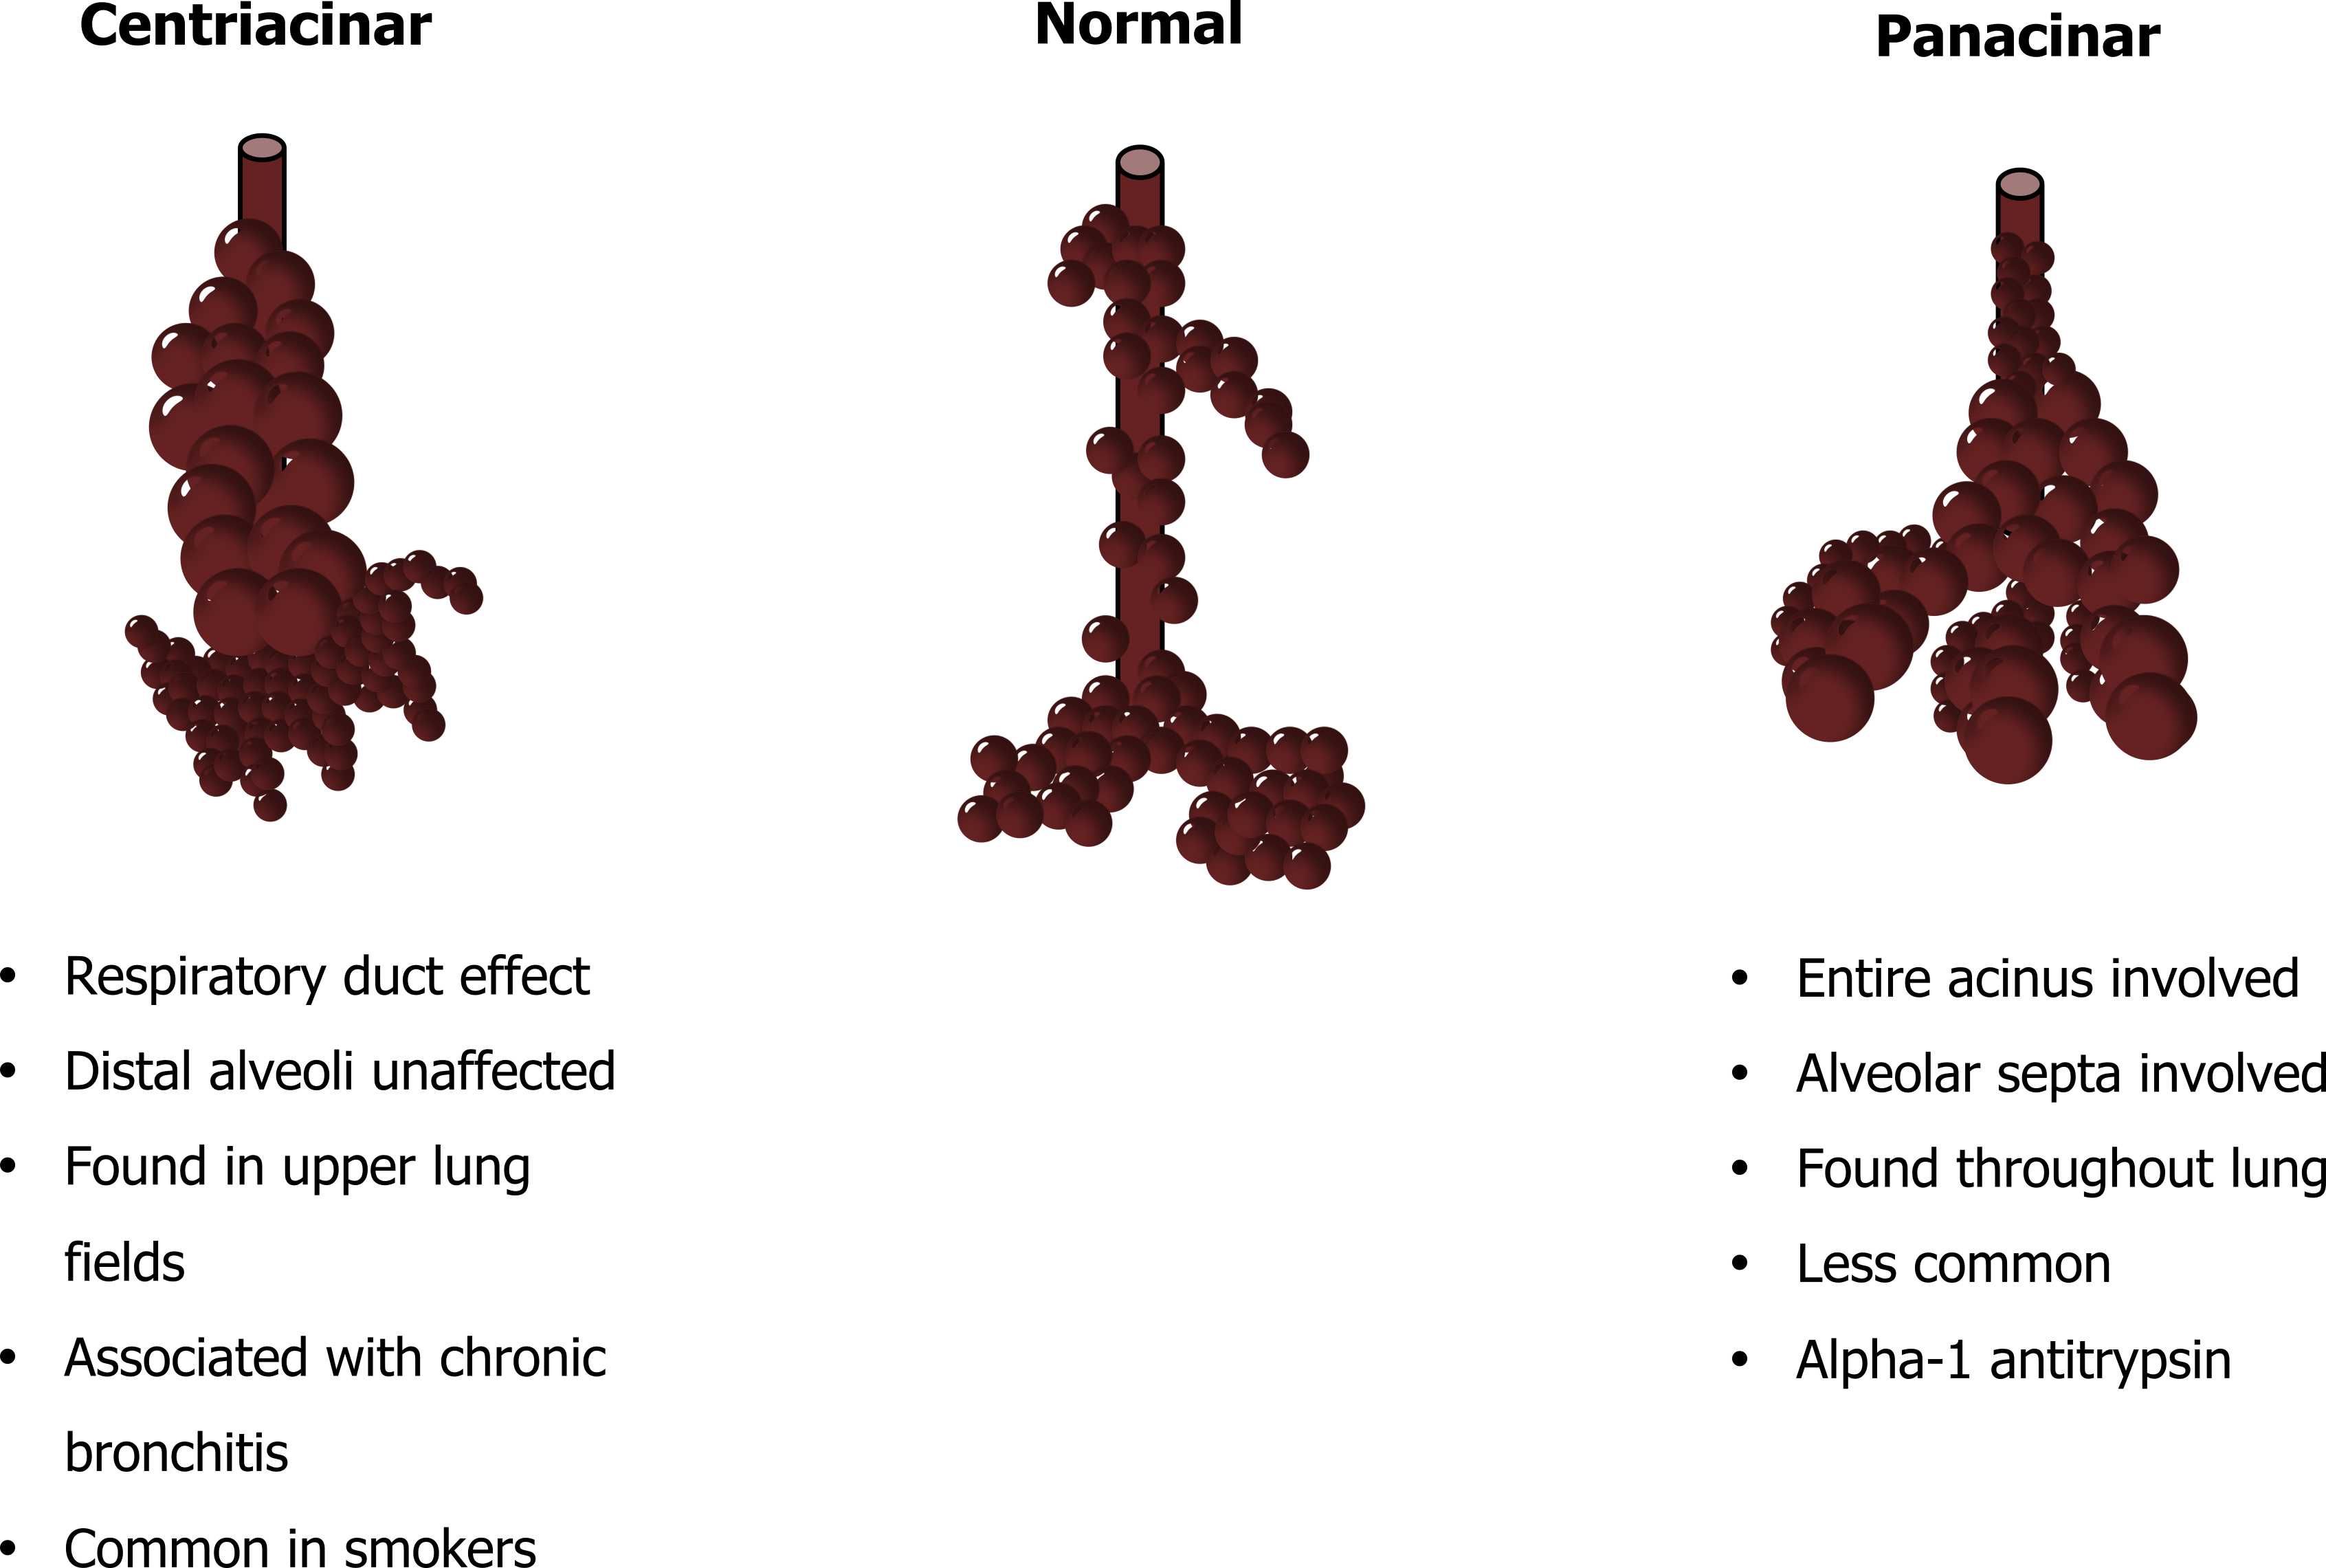
Panacinar emphysema, as the name suggests, involves the entire acinus (figure 1.16), and the alveolar structure is more involved creating large airspaces that occur throughout the lung. This is evident in the pathology slide in figure 1.16 that shows much more uniform damage than the centriacinar example. Panacinar emphysema is much less common and is the pattern of destruction associated with alpha-1 antitrypsin deficiency, which we will deal with in a moment.
So having seen the morphology of emphysema, we will look at how this damage occurs.
Pathophysiology of Emphysema
The normal structure of alveoli and respiratory ducts consists of type 1 and type 2 pneumocytes with elastic fibers that contribute to the structure’s mechanical behavior. Emphysema involves the loss of these parenchymal fibers.
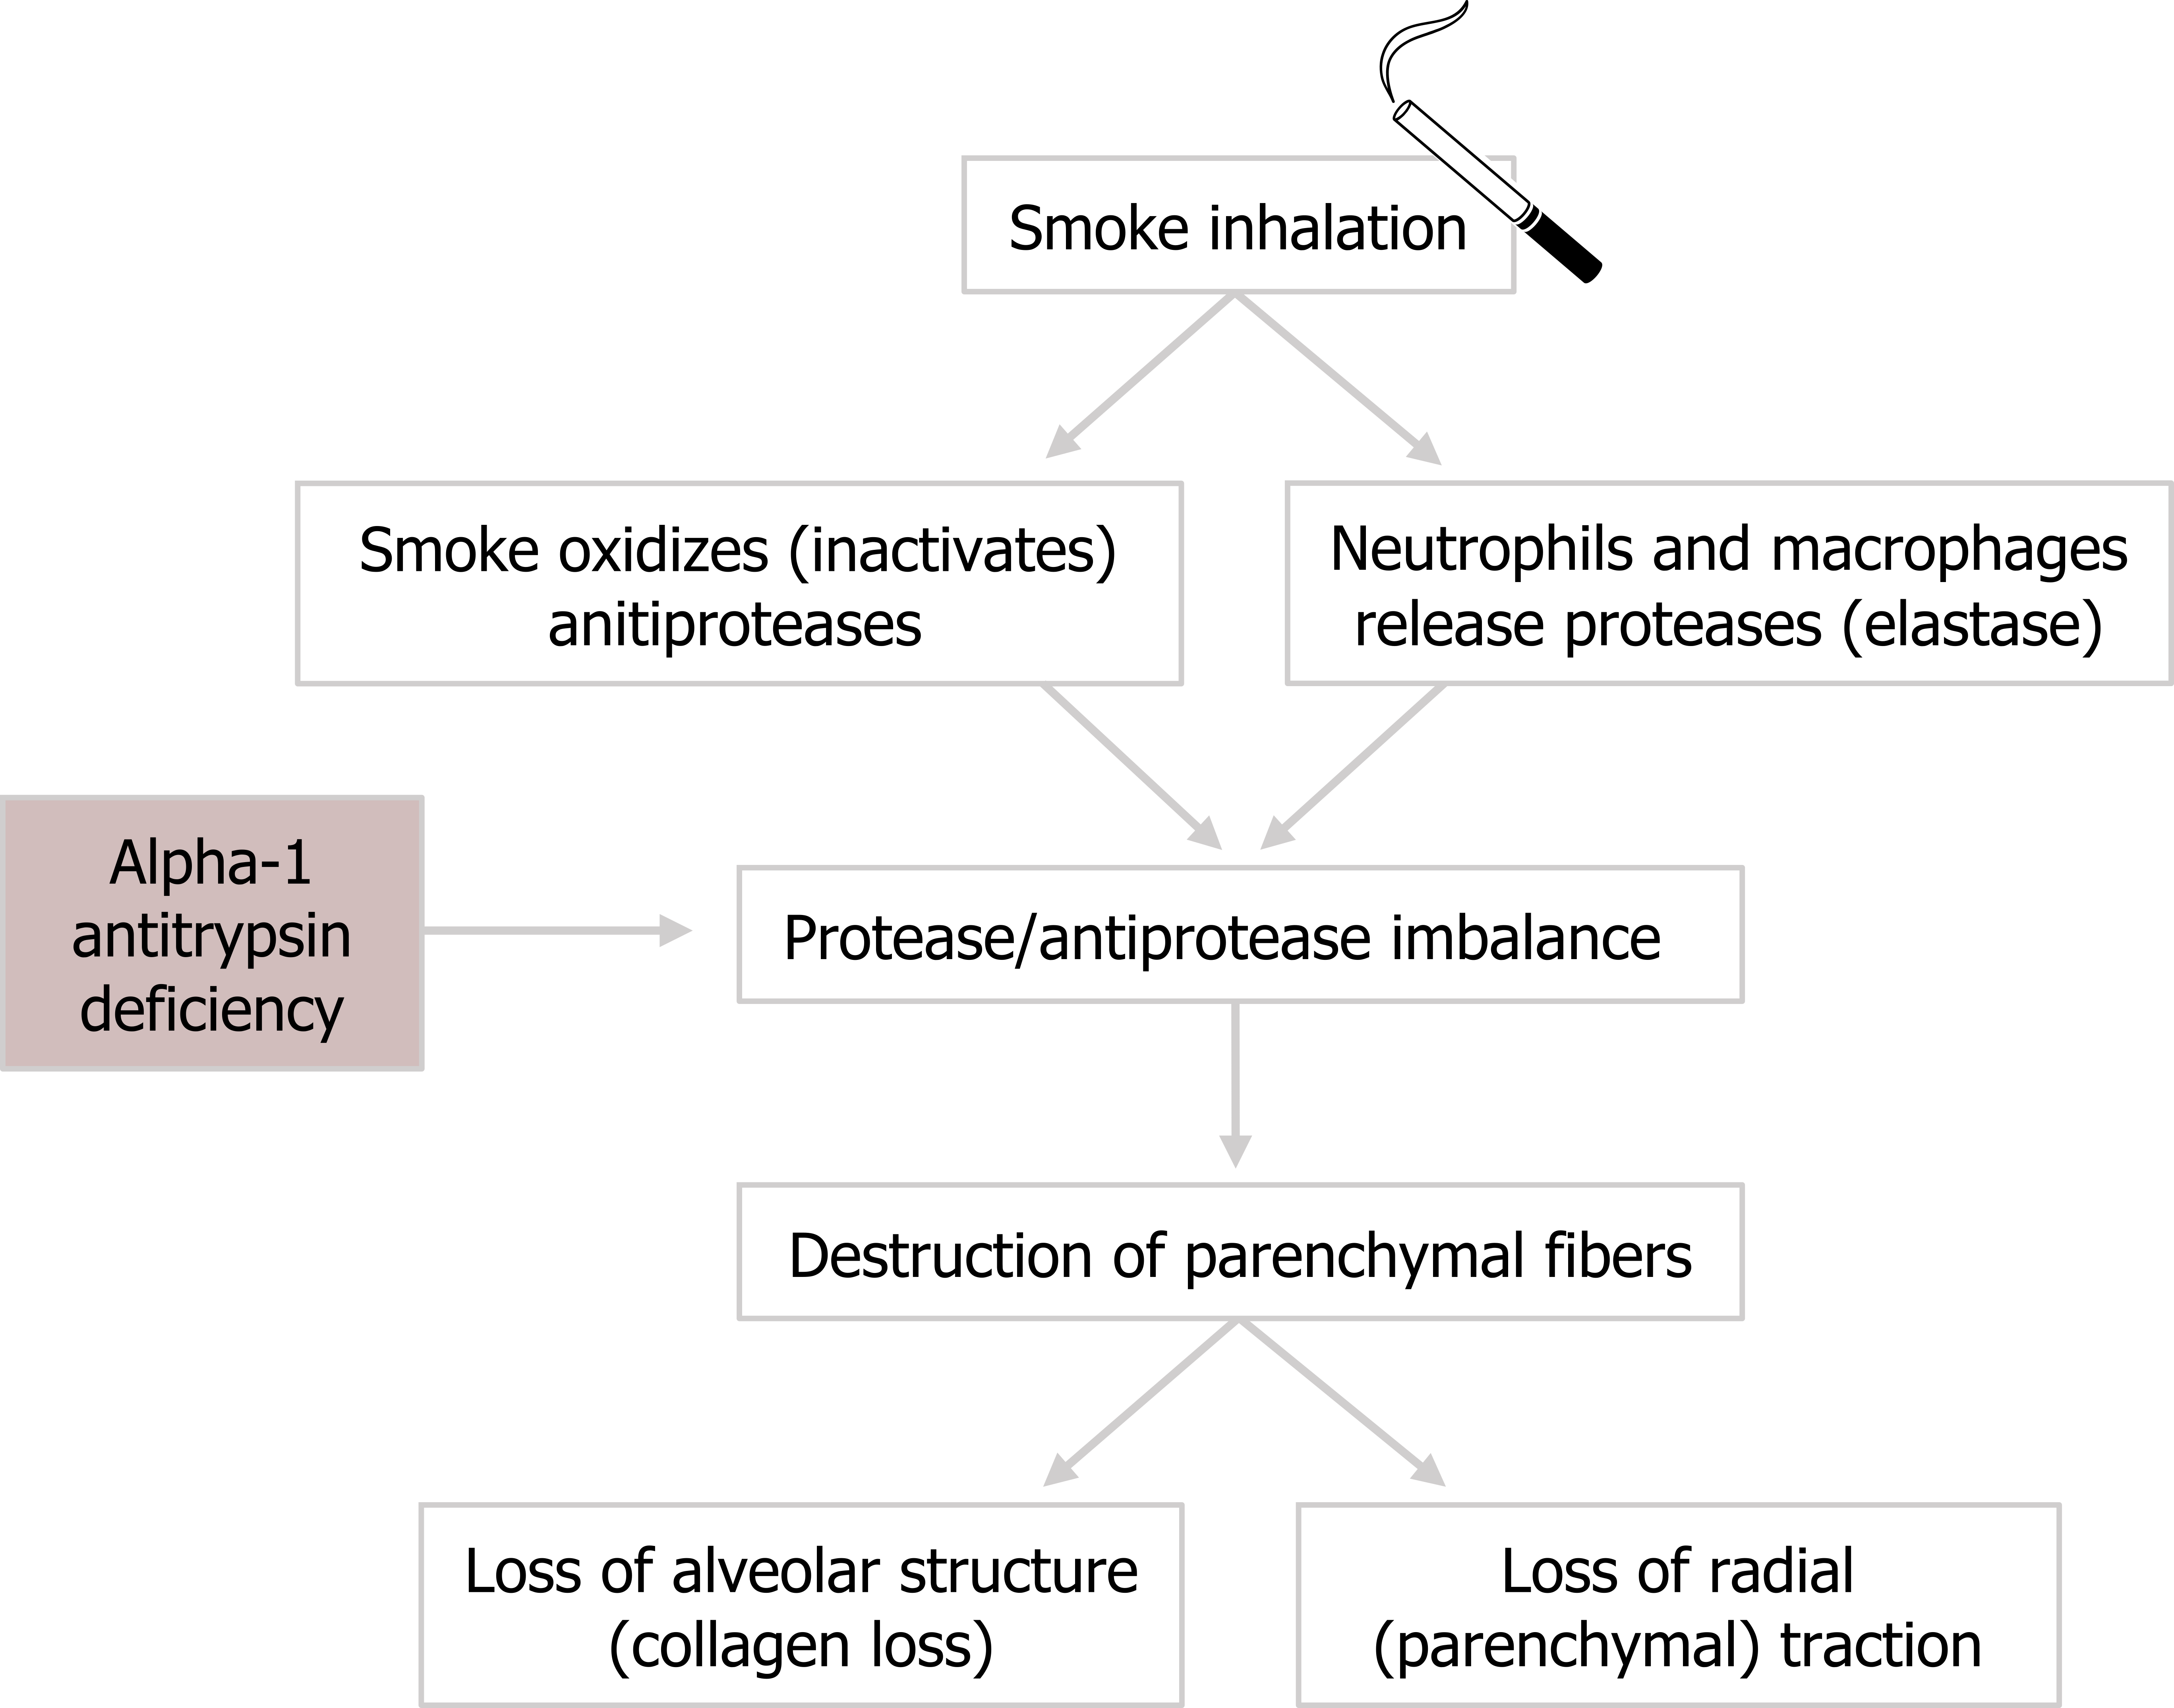
The presence of irritants, such as cigarette smoke, causes oxidization and the dysfunction of antiprotease enzymes. Without their inhibitory action, the activity of proteases increases and causes the destruction of local tissue. One of these proteases is elastase, whose elevated activity leads to irreparable loss of parenchymal fibers.
Elastase is also released by neutrophils and macrophages that arrive in response to the inflammatory cascade caused by the inhaled smoke. This causes further destruction of elastin fibers.
The pathogenesis of emphysema (figure 1.17) might be summarized as an imbalance between the activities of antiproteases and proteases. Antiproteases are suppressed, and proteases are elevated.
The emphysema in about 1 percent of COPD patients is caused by a genetic lack of alpha-1 anti-trypsin. Even without tobacco use, these patients have an antiprotease/protease imbalance that results in loss of elastin and collagen and produces the panacinar emphysema shown previously (figure 1.16). If an alpha1-anti-trypsin patient does smoke, this imbalance is worsened and emphysema may develop by their late twenties.
The loss of the elastic tissue and alveolar structure produces several pathophysiological changes in lung mechanics and function that result in typical clinical signs.
Clinical Presentation of Emphysema
Lung recoil is the opposing force to the chest wall’s tendency to spring outward. The loss of elastin reduces lung recoil and the chest wall can move outward, producing a characteristic “barrel-chest” (figure 1.18).
The lack of recoil also means that passive expiration is ineffective and active expiration must be employed. The positive pleural pressure associated with active expiration enhances dynamic airway collapse that leads to gas trapping and characteristic hyperinflation (figure 1.18). To prevent this, the emphysema patient may adopt pursed lip breathing to maintain airway pressure during expiration that props open the airways.
The hyperinflation and nonuniform tissue damage can lead to a heterogenous distribution of ventilation and V/Q abnormalities that diminish gas exchange. Gas exchange will also be diminished by the enlargement of airspaces, reducing available surface area (figure 1.18).
The deterioration of gas exchange and lung mechanics worsens as more lung becomes involved, and the stage of the disease, and any concurrent chronic bronchitis, is classified by the level of airway flow limitation (e.g., FEV1/FVC).
It might also be worth noting here that COPD can produce or be associated with a number of comorbidities; we have already mentioned hypertension, but pulmonary artery disease, coronary heart disease, heart failure, lung cancer, and malnutrition may contribute to a low quality of life that is typically associated with COPD. This in turn may contribute to the high incidence of anxiety disorders and depression experienced by COPD patients.
Cystic Fibrosis
Cystic fibrosis (CF) is an inherited disorder that affects the exocrine glands of not only the lungs, but also the pancreas, intestines, and bile ducts. We will focus only on the pulmonary aspects here and see how CF produces an obstructive lung disease.
Cystic fibrosis affects the composition of the fluid lining the airways. Changes in this fluid lead to serious sequelae that dramatically shorten life expectancy. Even with modern therapy, many CF patients only live until their thirties or early forties, and some still die in infancy.
There are two hypotheses about the pathophysiological mechanism of CF: the low volume and the high salt. We will focus only on the low volume hypothesis as there is increasing evidence to support this and emerging evidence against the high salt hypothesis.
Pathophysiology of Cystic Fibrosis
Control of the airway fluid relies on the action of ion channels in the apical membranes of epithelial cells, and there are two channels to focus on: CFTR and ENaC. The CFTR channels let chloride out of the cell, while the ENaC lets sodium in (top panel, figure 1.19).
This exchange helps maintain a healthy fluid layer in the airway, but fails in CF because of a nonfunctioning CFTR channel (right panel, figure 1.19).
There are numerous mutations that are known to produce a dysfunctional CFTR channel, but 70 percent of CF cases are due to the delta-F-508 mutation (so named as the mutation leads to a deletion of phenylalanine at position 508 of the CFTR protein). This is a Mendelian recessive trait, and CF occurrence is 1 in 2,500 live births.
So what are the consequences of CFTR dysfunction? Chloride ends up being trapped inside the cell (bottom panel, figure 1.19), and this leads to a greater influx of sodium through the ENaC down its electrochemical gradient, leaving a higher concentration of salt inside the cells that pulls water in from the airway lumen. The low fluid volume in the airway results in:
- viscous mucus, and
- collapse of cilia.
This combination severely impacts mucus clearance (thicker, heavier mucus with compromised cillary escalator). The defective CFTR channel therefore results in mucus retention and airway obstruction. This in turn leads to reduced alveolar ventilation and repeated infections. The two most common culprits for infection in CF are Staphylococcus aureus and Pseudomonsa aeruginosa. Normal functional CFTR appears to suppress P. aeruginosa, perhaps explaining its prevalence in cystic fibrosis where it can be found in the sputum of almost all CF patients.
The consequences of repeated infection are a mixture of serious conditions and pathologies including atelectasis, pneumonia, bronchiectasis, and other structural abnormalities of the airways (figure 1.20).
The findings of CF obviously include the results of other effected organs, such as the pancreas. But nowadays these are more easily addressed, and it is pulmonary involvement that still proves critical. The onset of pulmonary involvement is variable and may be weeks or years after birth.
Clinical Presentation of Cystic Fibrosis
Findings progress with progressive airway damage (figure 1.21), but start with cough that may be dry at first but transitions to productive to expel the copious, viscous mucus. With poor mucus clearance, the patient experiences repeated infections that exacerbate symptoms at each stage of the disease.
CF patients usually have an abnormal sinus x-ray and evidence of chronic sinusitis as well as a high occurrence of nasal polyps.
With increasing and irreversible airway damage, the patients begins to experience dyspnea, and the damage may lead to hemoptysis, spontaneous pneumothorax, and a barrel chested appearance. Signs of prolonged pulmonary dysfunction appear as the disease progresses, such as finger clubbing, cyanosis, and cor pulmonale (right-sided heart failure caused by lung disease). As the patient approaches respiratory failure the accessory muscles are deployed. Patients succumb to the respiratory failure or an overwhelming infection.
Because CF also affects sweat gland function, the sweat test remains a standard diagnostic with a chloride level greater than 60 mEq/L being indicative of CF. This test is more reliable in children than adults, who may have developed other conditions that affect the composition of sweat.
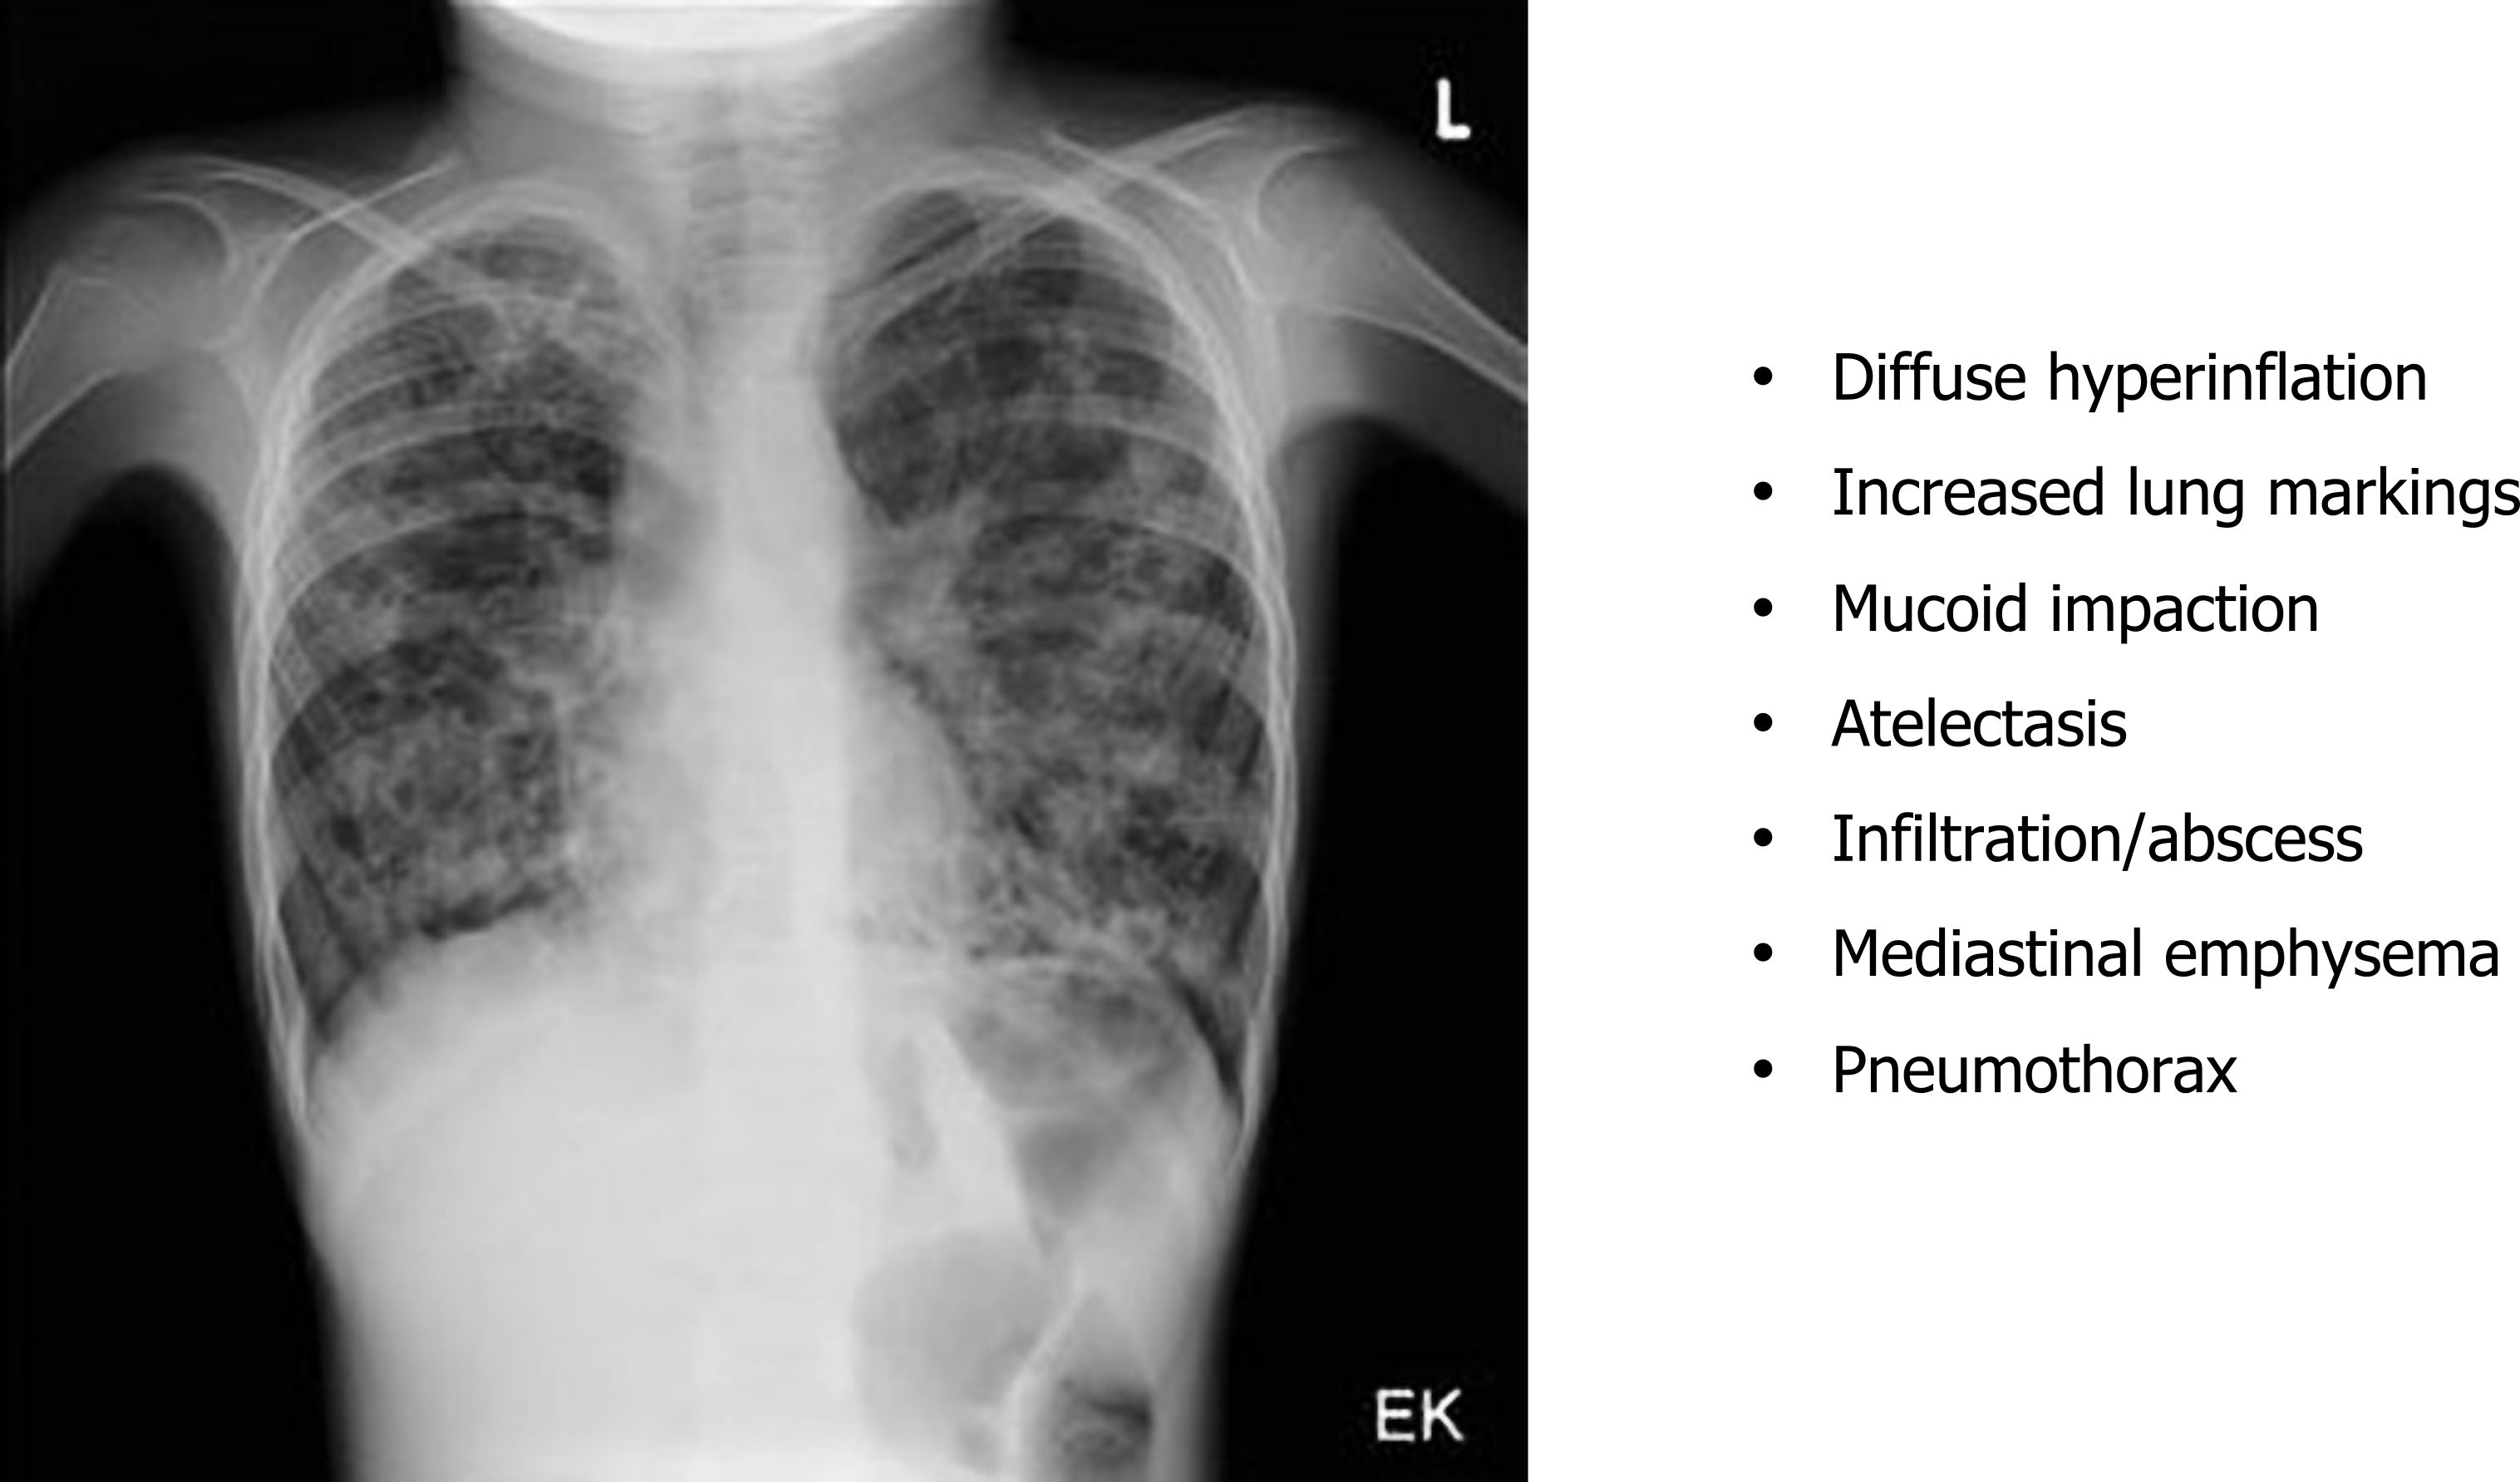
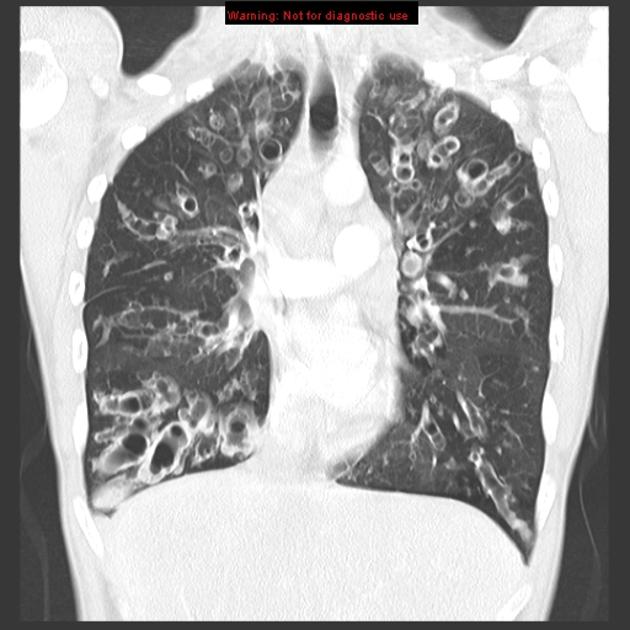
Chest x-rays show (figure 1.22) signs of hyperinflation associated with gas trapping and the hallmarks of any other complications that the CF has induced. These are viewed more clearly with the common use of high-resolution computed tomography (HRCT)(figure 1.23) to determine the type and extent of damage that may include bronchiectasis and mucus impactions.
Spirometry detects the airway obstruction and hyperinflation that produce a low vital capacity and high residual volume.
Bronchiectasis
This section will address bronchiectasis, a form of airway obstruction that is often a manifestation of chronic airway inflammation. Bronchiectasis involves a permanent dilation of a bronchi or bronchiole—think of bronchiectasis as the airway equivalent of an aneurysm.
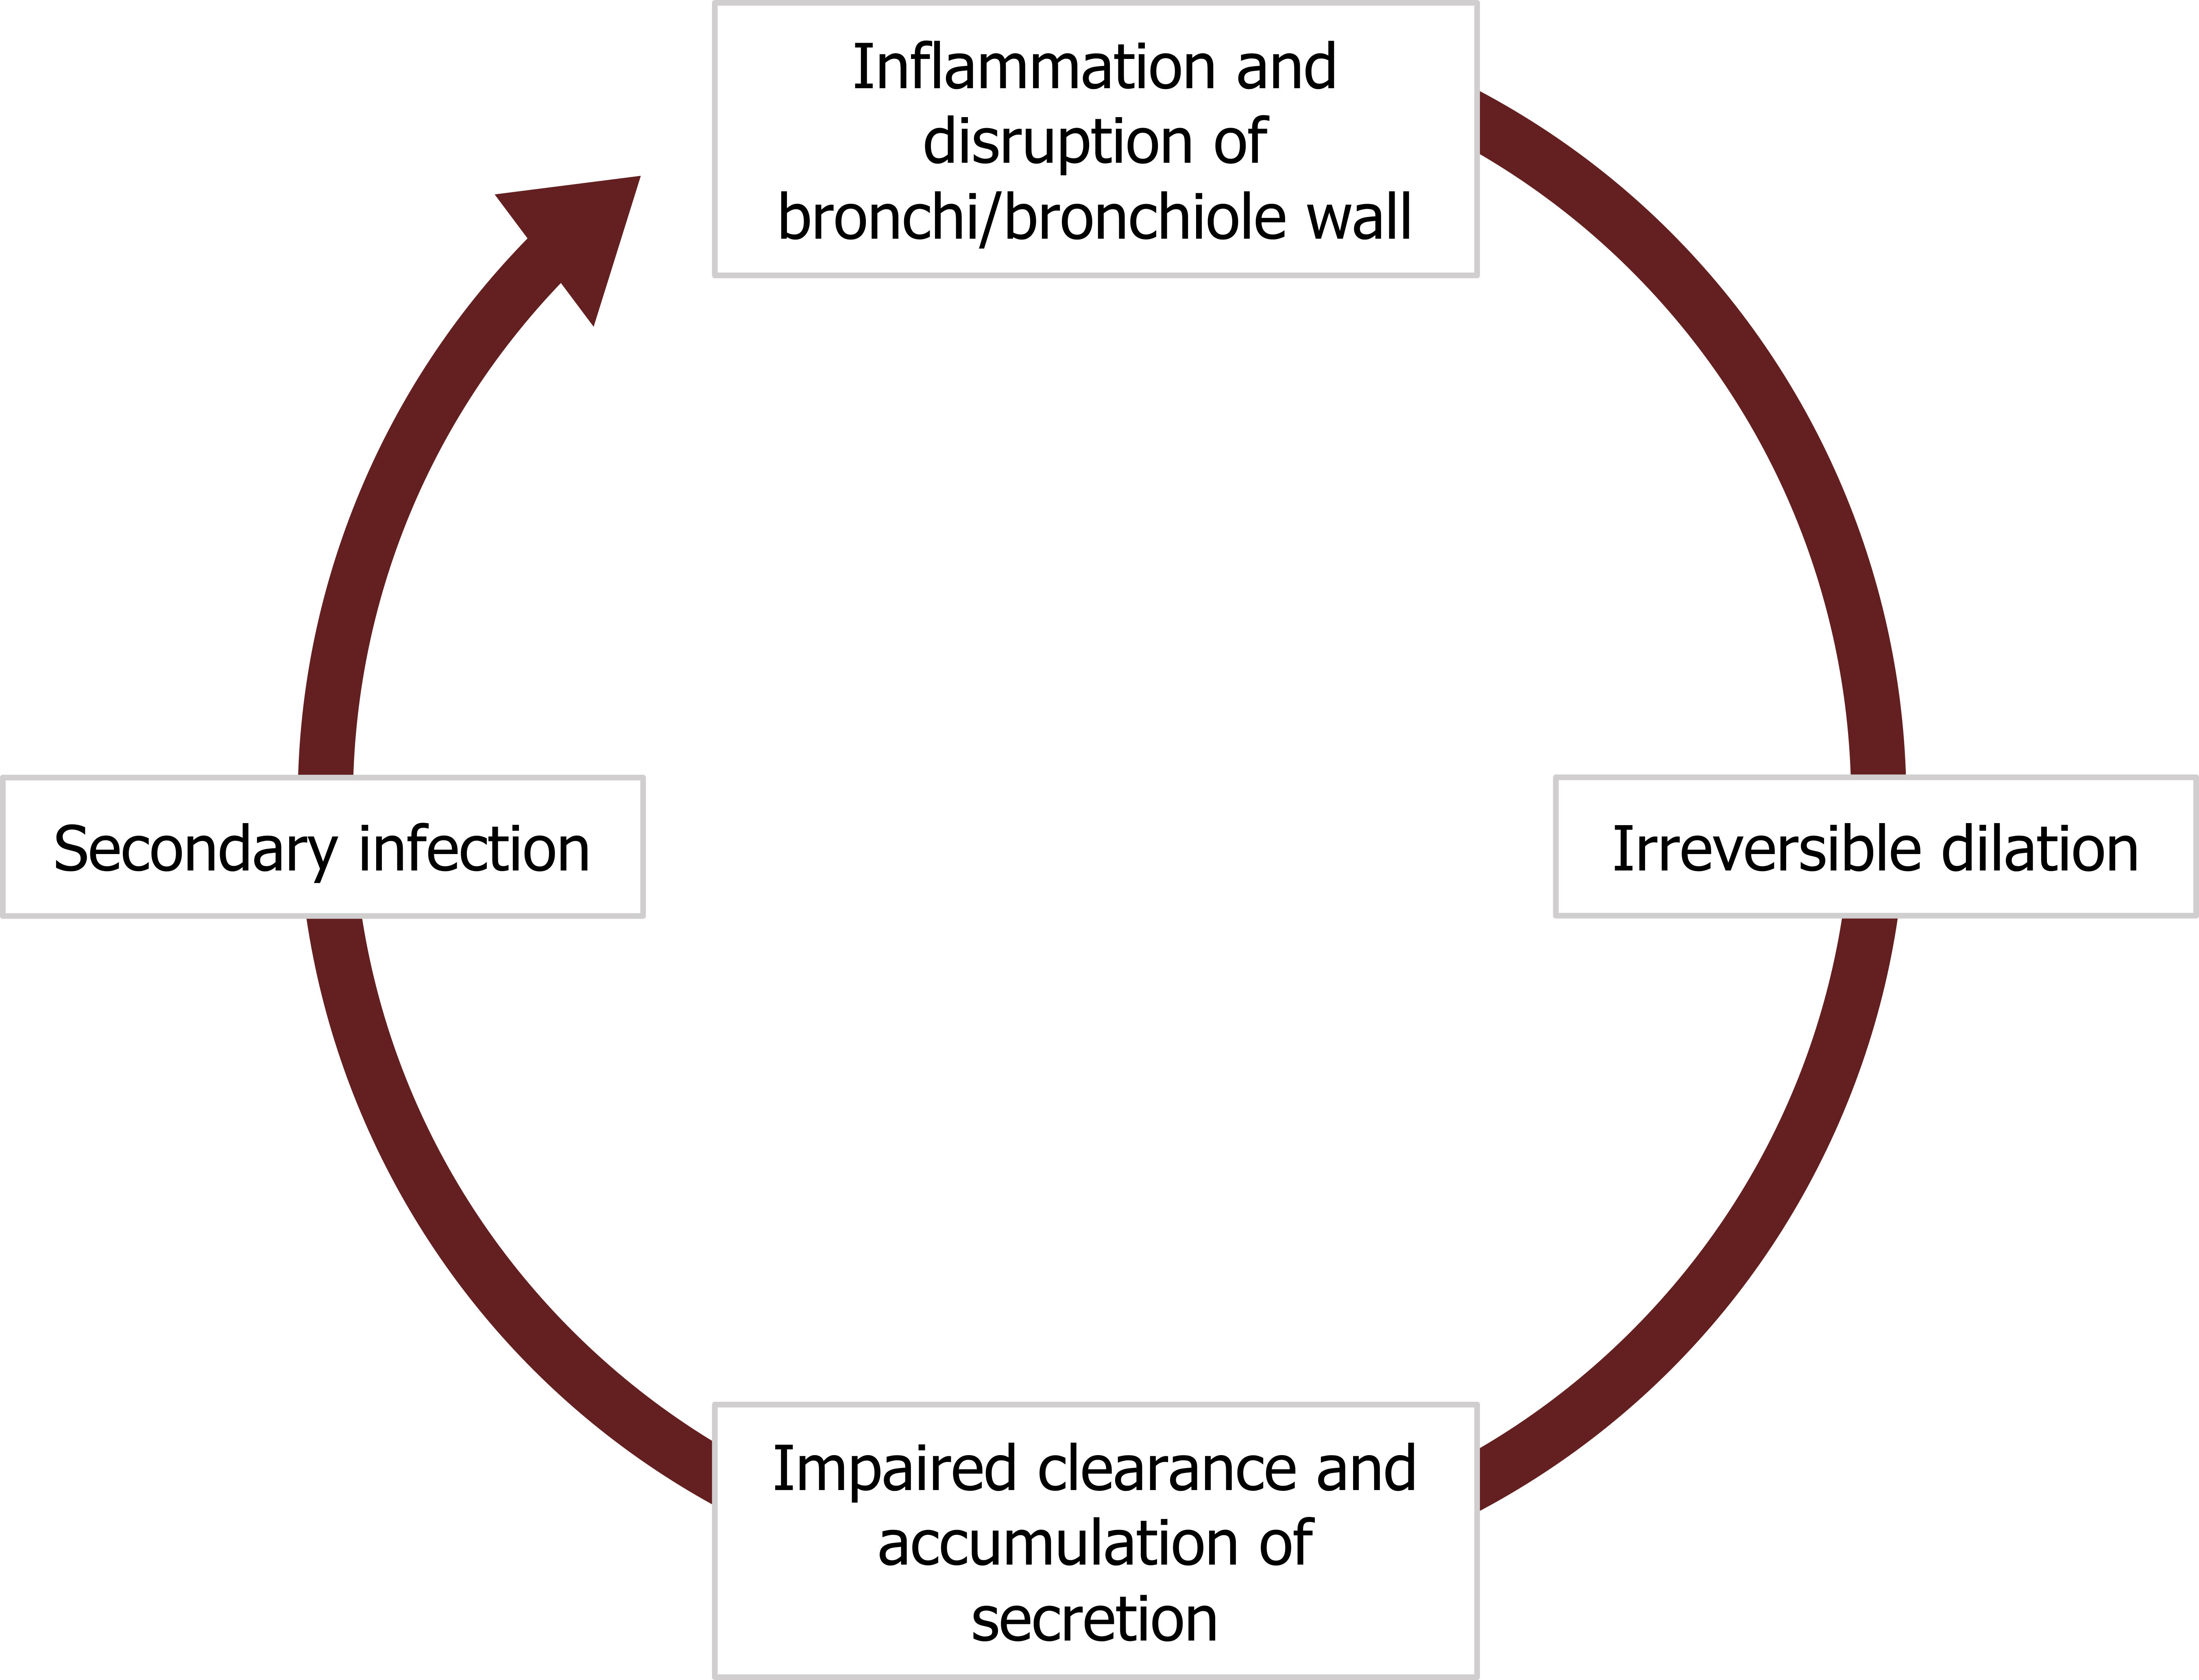
A bronchiectasis starts with a section of airway wall becoming inflamed (figure 1.24), disrupting and weakening its structure. This weakening leads to a permanent dilation of the airway that impairs the clearance of secretion. Because the airway is inflamed, the amount of secretion may be significant and it begins to accumulate.
The stagnant secretion promotes a secondary infection that leads to further inflammation, wall disruption, and dilation. Thus the airway has entered a vicious cycle that causes the dilation and retention of mucus to perpetuate (figure 1.24).
The establishing of a bronchiectasis has an initial phase leading to persistent inflammation, desquamation (which worsens the mucus clearance), and the ulceration. In what is probably a familiar story, the continued inflammation leads to fibrosis in the chronic phase of development, and this can lead to airway destruction and perhaps the condition of bronchiolitis obliterans.
Let us look at how this process can get started.
Pathogenesis of Bronchiectasis
There are some common culprits for initiating bronchiectasis (figure 1.25). Most start with either a decline in mucus clearance and the associated inflammation or damage to the airway wall.
About 50 percent of bronchiectasis cases are associated with cystic fibrosis where the genetic condition causes production of copious, thick mucus that is difficult to clear and often results in infection (commonly caused by Staphylococcus aureus).
Conditions causing cillary dyskinesia, as seen in Kartagener’s syndrome, also disrupt the mucocillary escalator.
Another common cause of bronchiectasis is an allergy to Aspergillus fumigatus, a common fungus. In hypersensitive or immune-compromised individuals, chronic exposure can lead to allergic bronchopulmonary aspiragillosis.
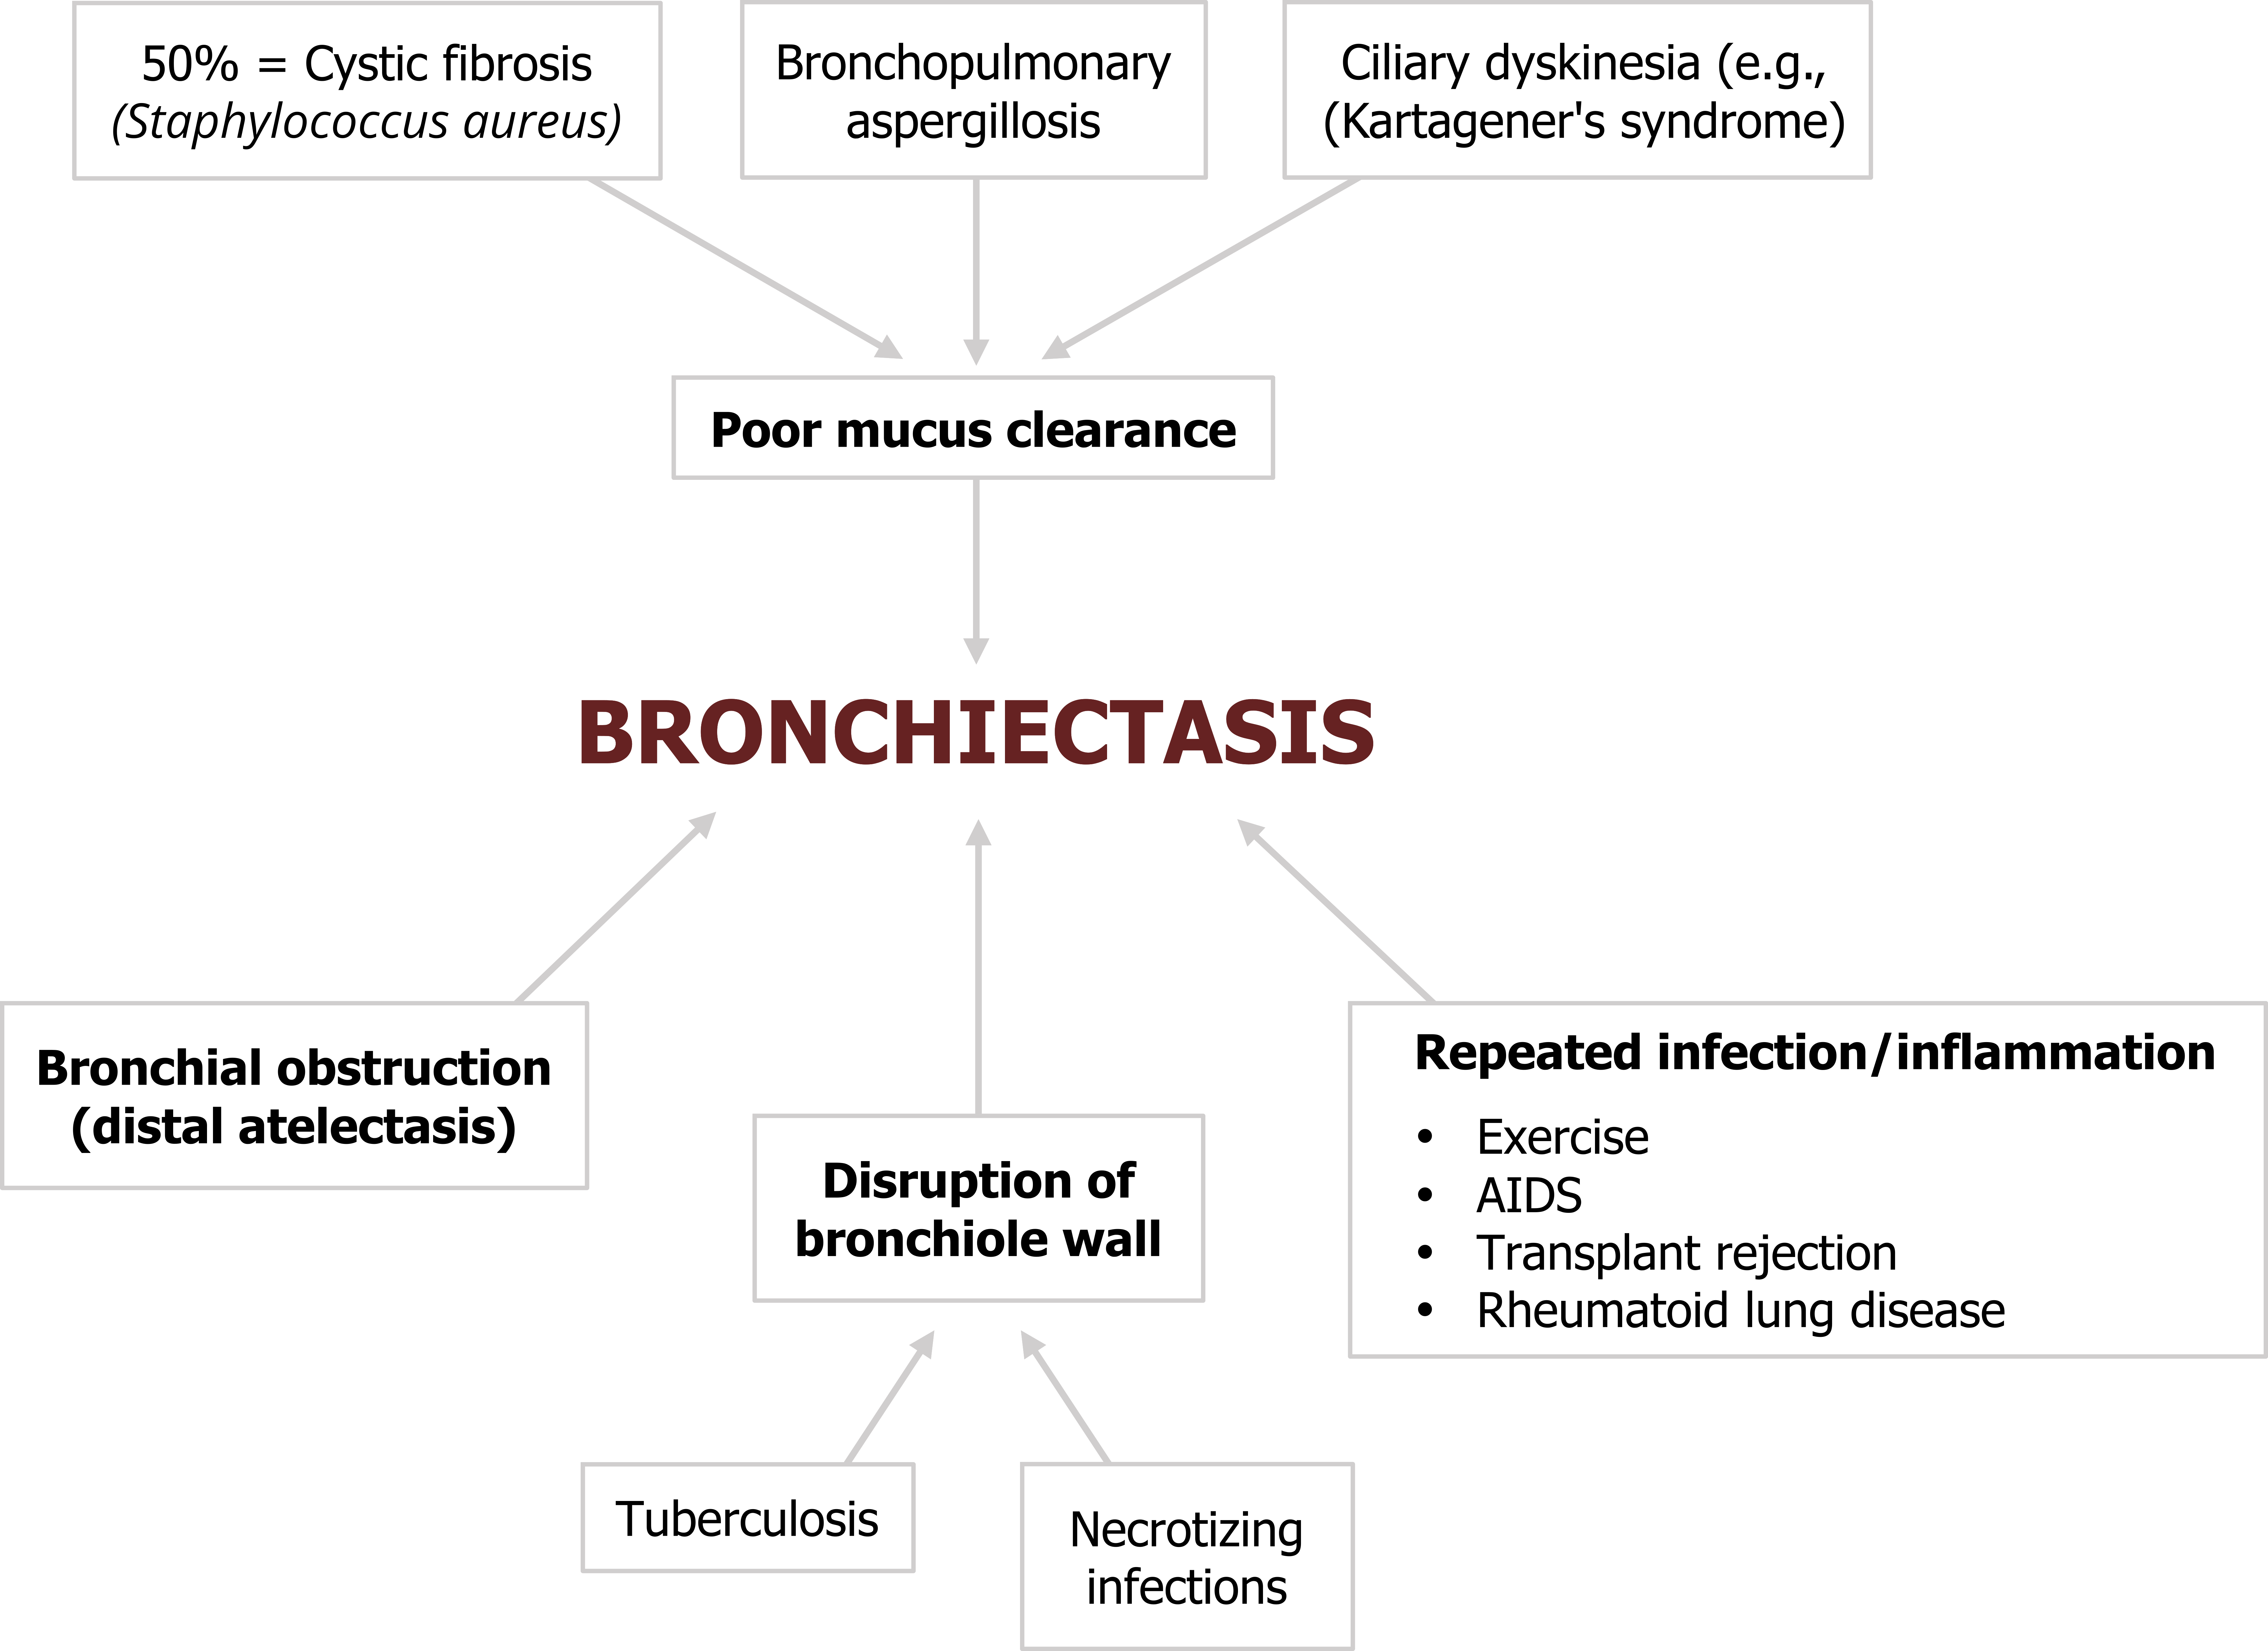
Bronchiectasis can be initiated in the vicinity of tuberculosis or other necrotizing infections that damage and weaken airway walls.
Obstruction of the bronchioles or bronchi by inhaled foreign objects, tumors, or compacted mucus can also initiate bronchiectasis through local inflammation and by preventing mucus clearance. The dilation of the airway can be worsened further by distal atelectasis that produces a negative pressure around the affected airway.
As you might have gather by now, repeated local infection or inflammation has the potential to initiate bronchiectasis, so it is perhaps not surprising that with the advent of high resolution computed tomography (CT) imaging, bronchiectasis has also been found in association with AIDS, transplant rejection, and rheumatoid lung disease.
We will now examine the results of these instigating factors.
Pathology of Bronchiectasis
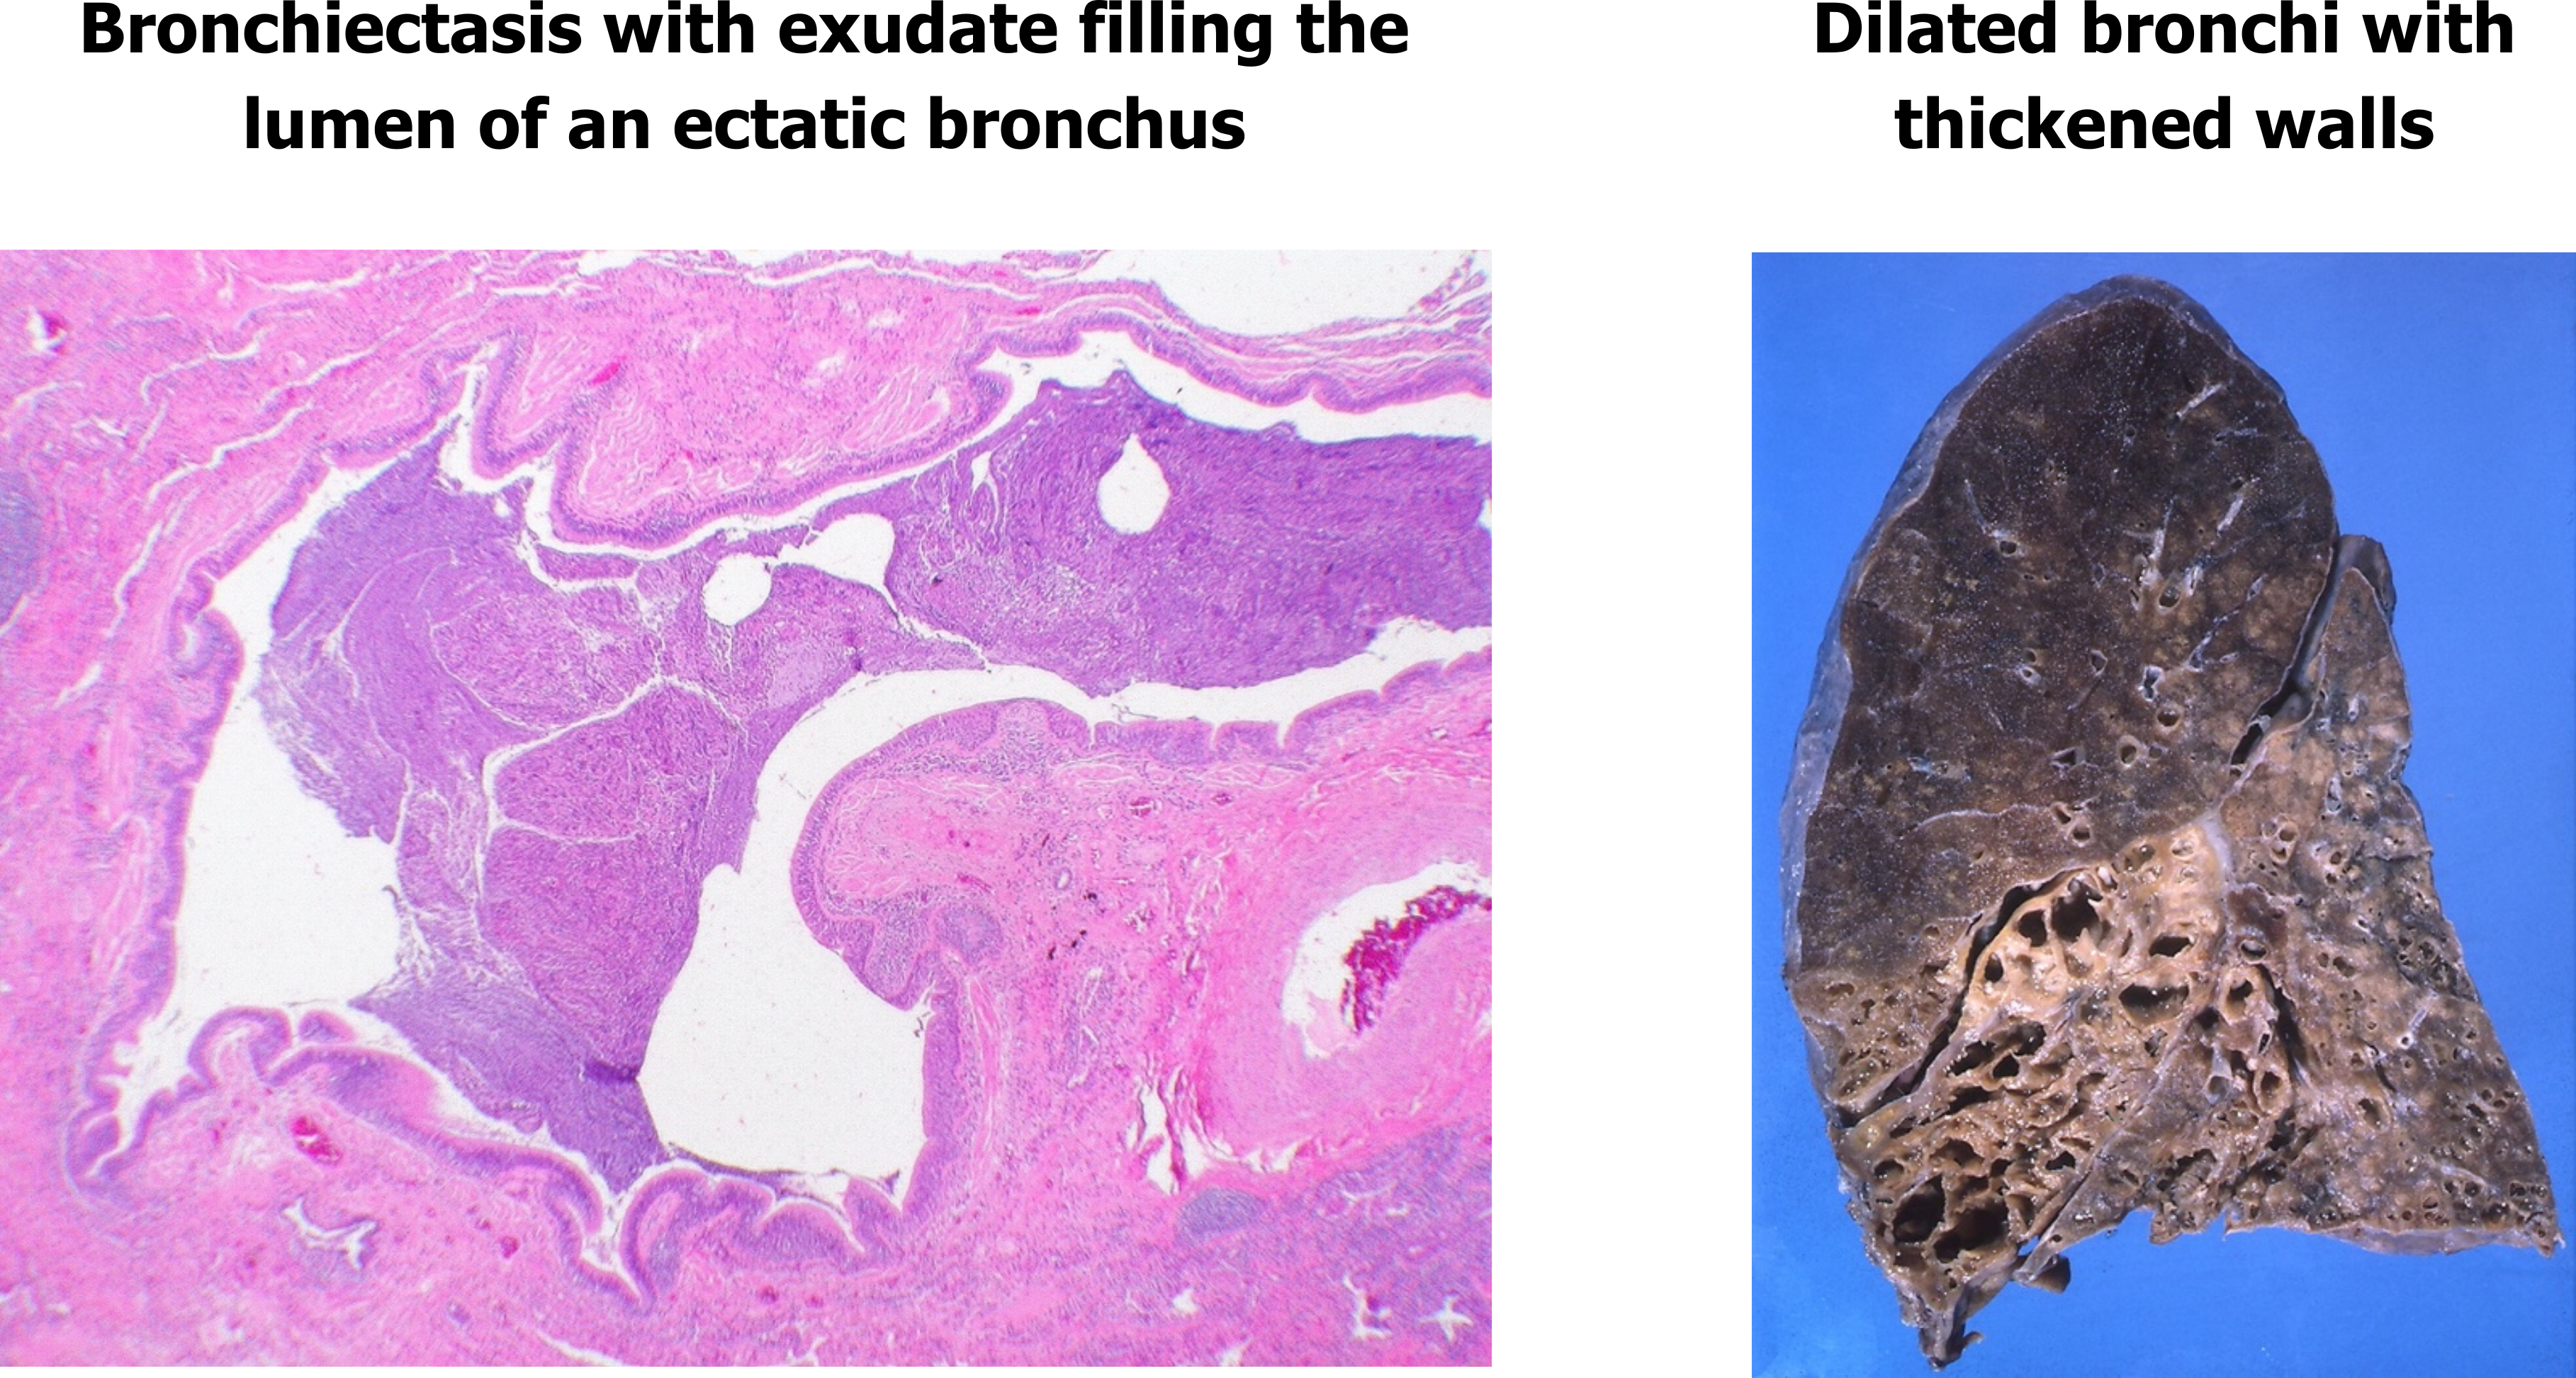
The outcomes of bronchiectasis are seen in the histology slide in figure 1.26, with the affected airway lumen filled with mucus and pus, and the airway walls exhibiting fibroglandular tissue and infiltration by inflammatory cells (outer red circle).
The gross view (right panel, figure 1.26) shows severely dilated bronchi and noticeable thickening of their walls.
There are different forms of bronchiectasis; these are classified by their shape (figure 1.27).

A bronchiectasis can be cylindrical, varicose (also known as fusiform), or cystic (also known as saccular). The shape is relevant to their effect on the efficacy of coughing; cylindrical form has very little effect on cough’s ability to clear mucus, whereas varicose and cystic forms tend to disproportionately collapse during cough and reduce its effectiveness at moving mucus up the airway.
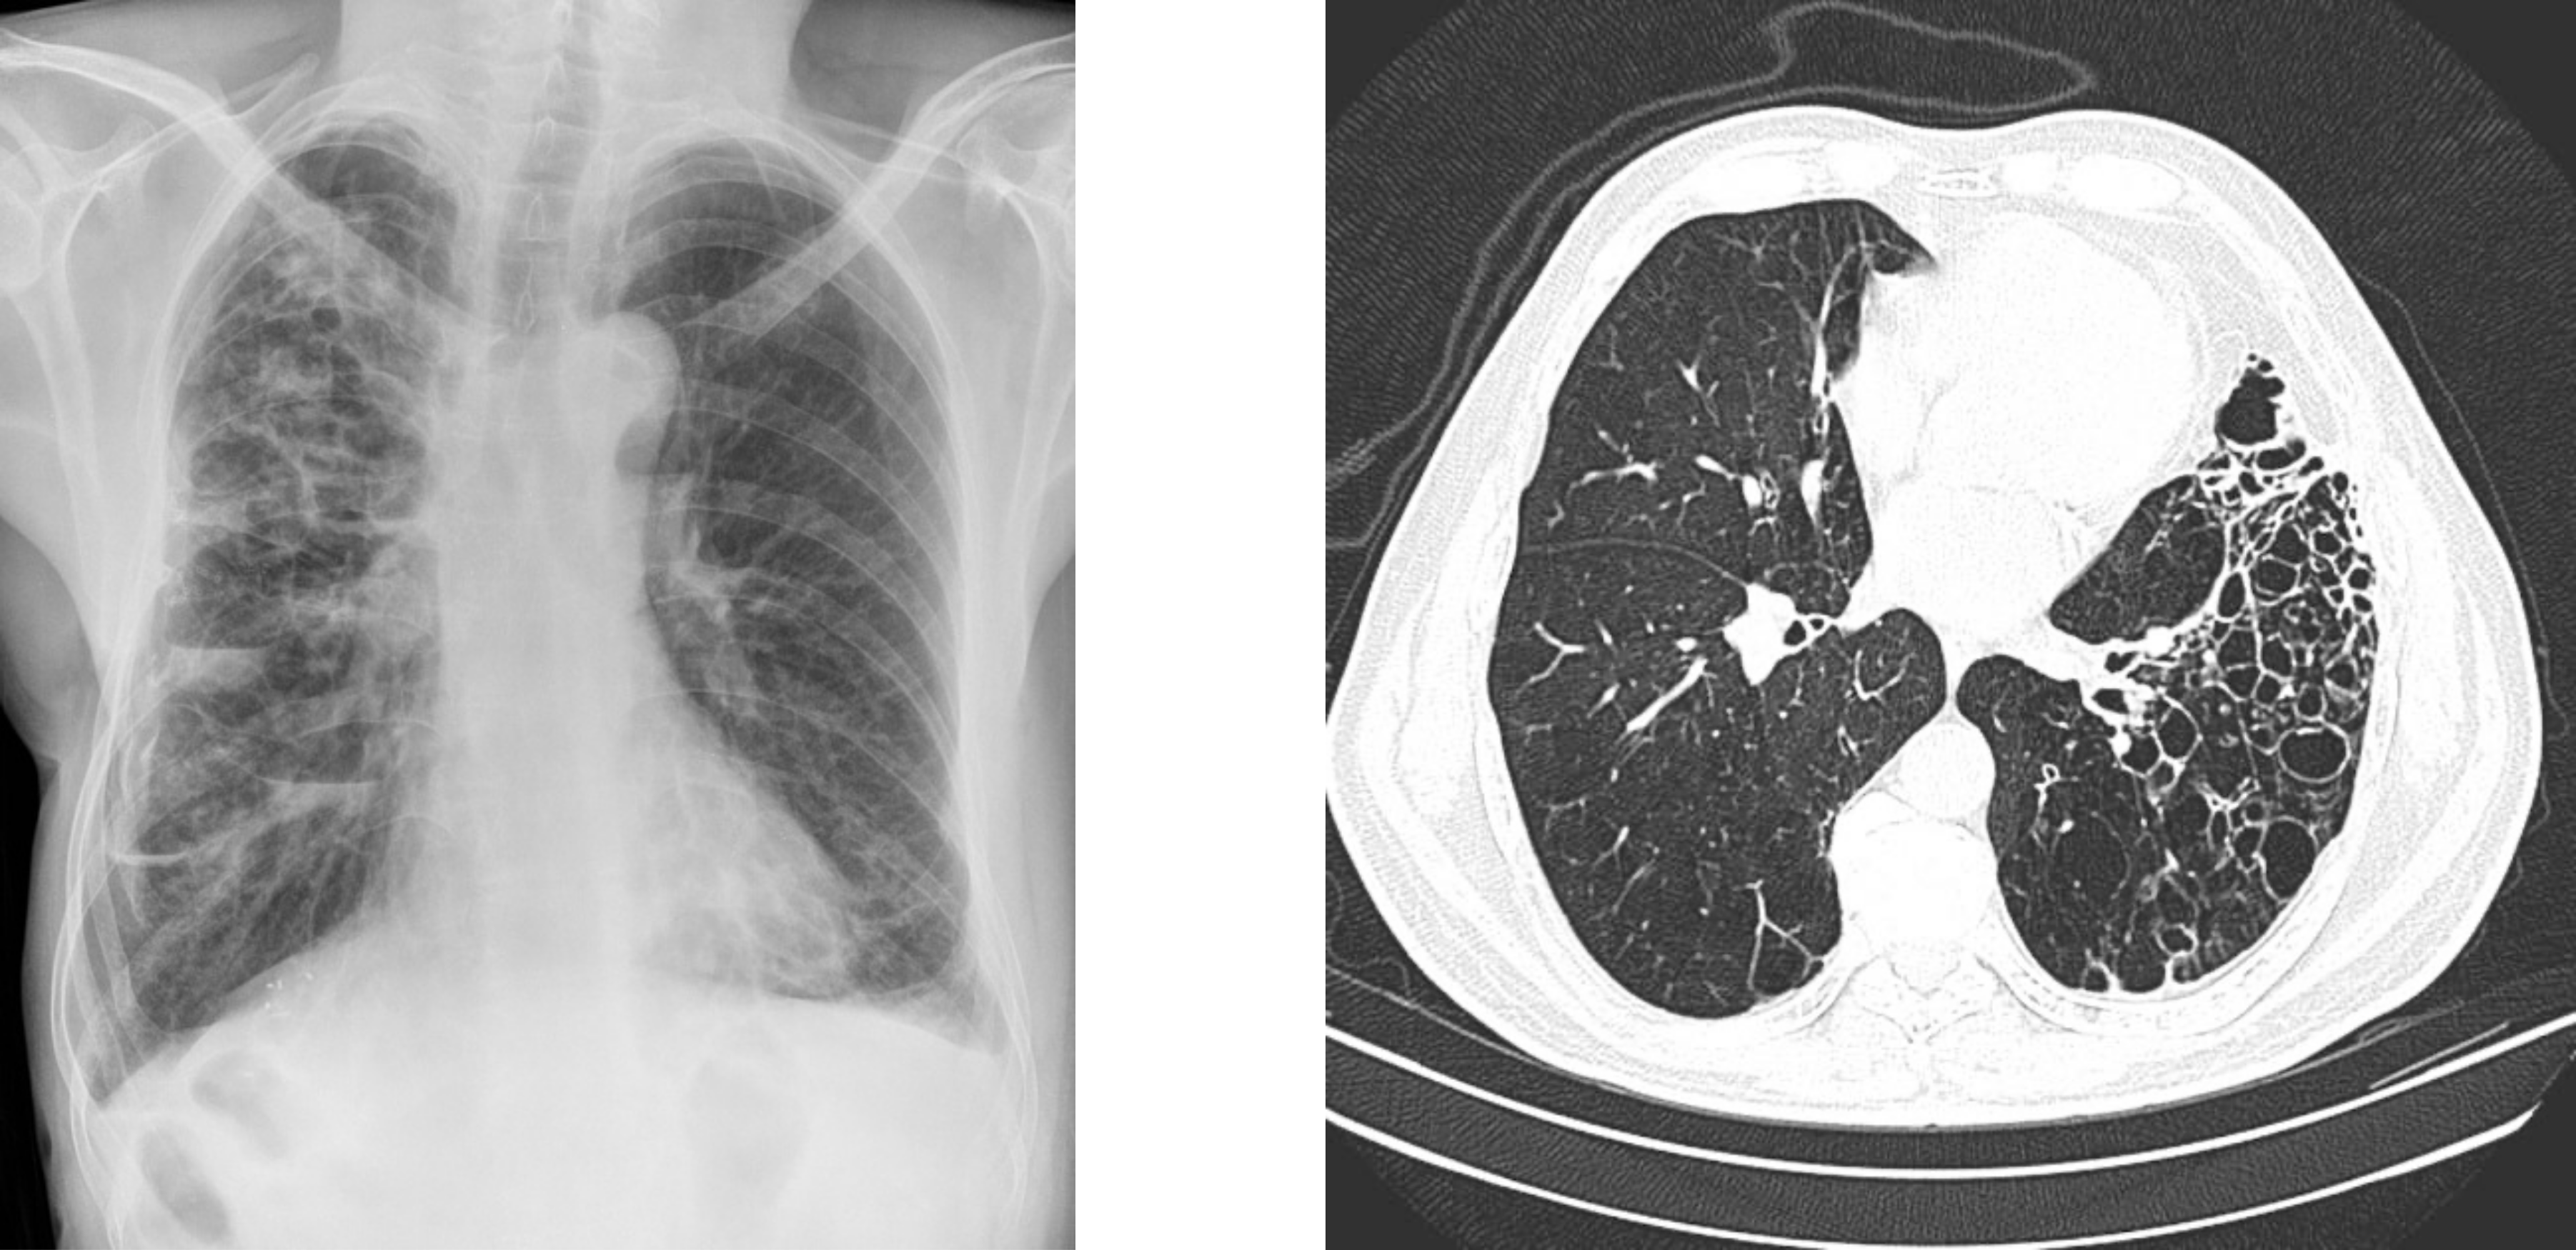
As shown in figure 1.28 an x-ray shows the presence of bronchiectasis, but it can be difficult to ascertain the form. High resolution CT (figure 1.28) is better at determining the form and has all but replaced the much more invasive bronchography, which involves instillation of radiopaque medium into the tracheobronchial tree.
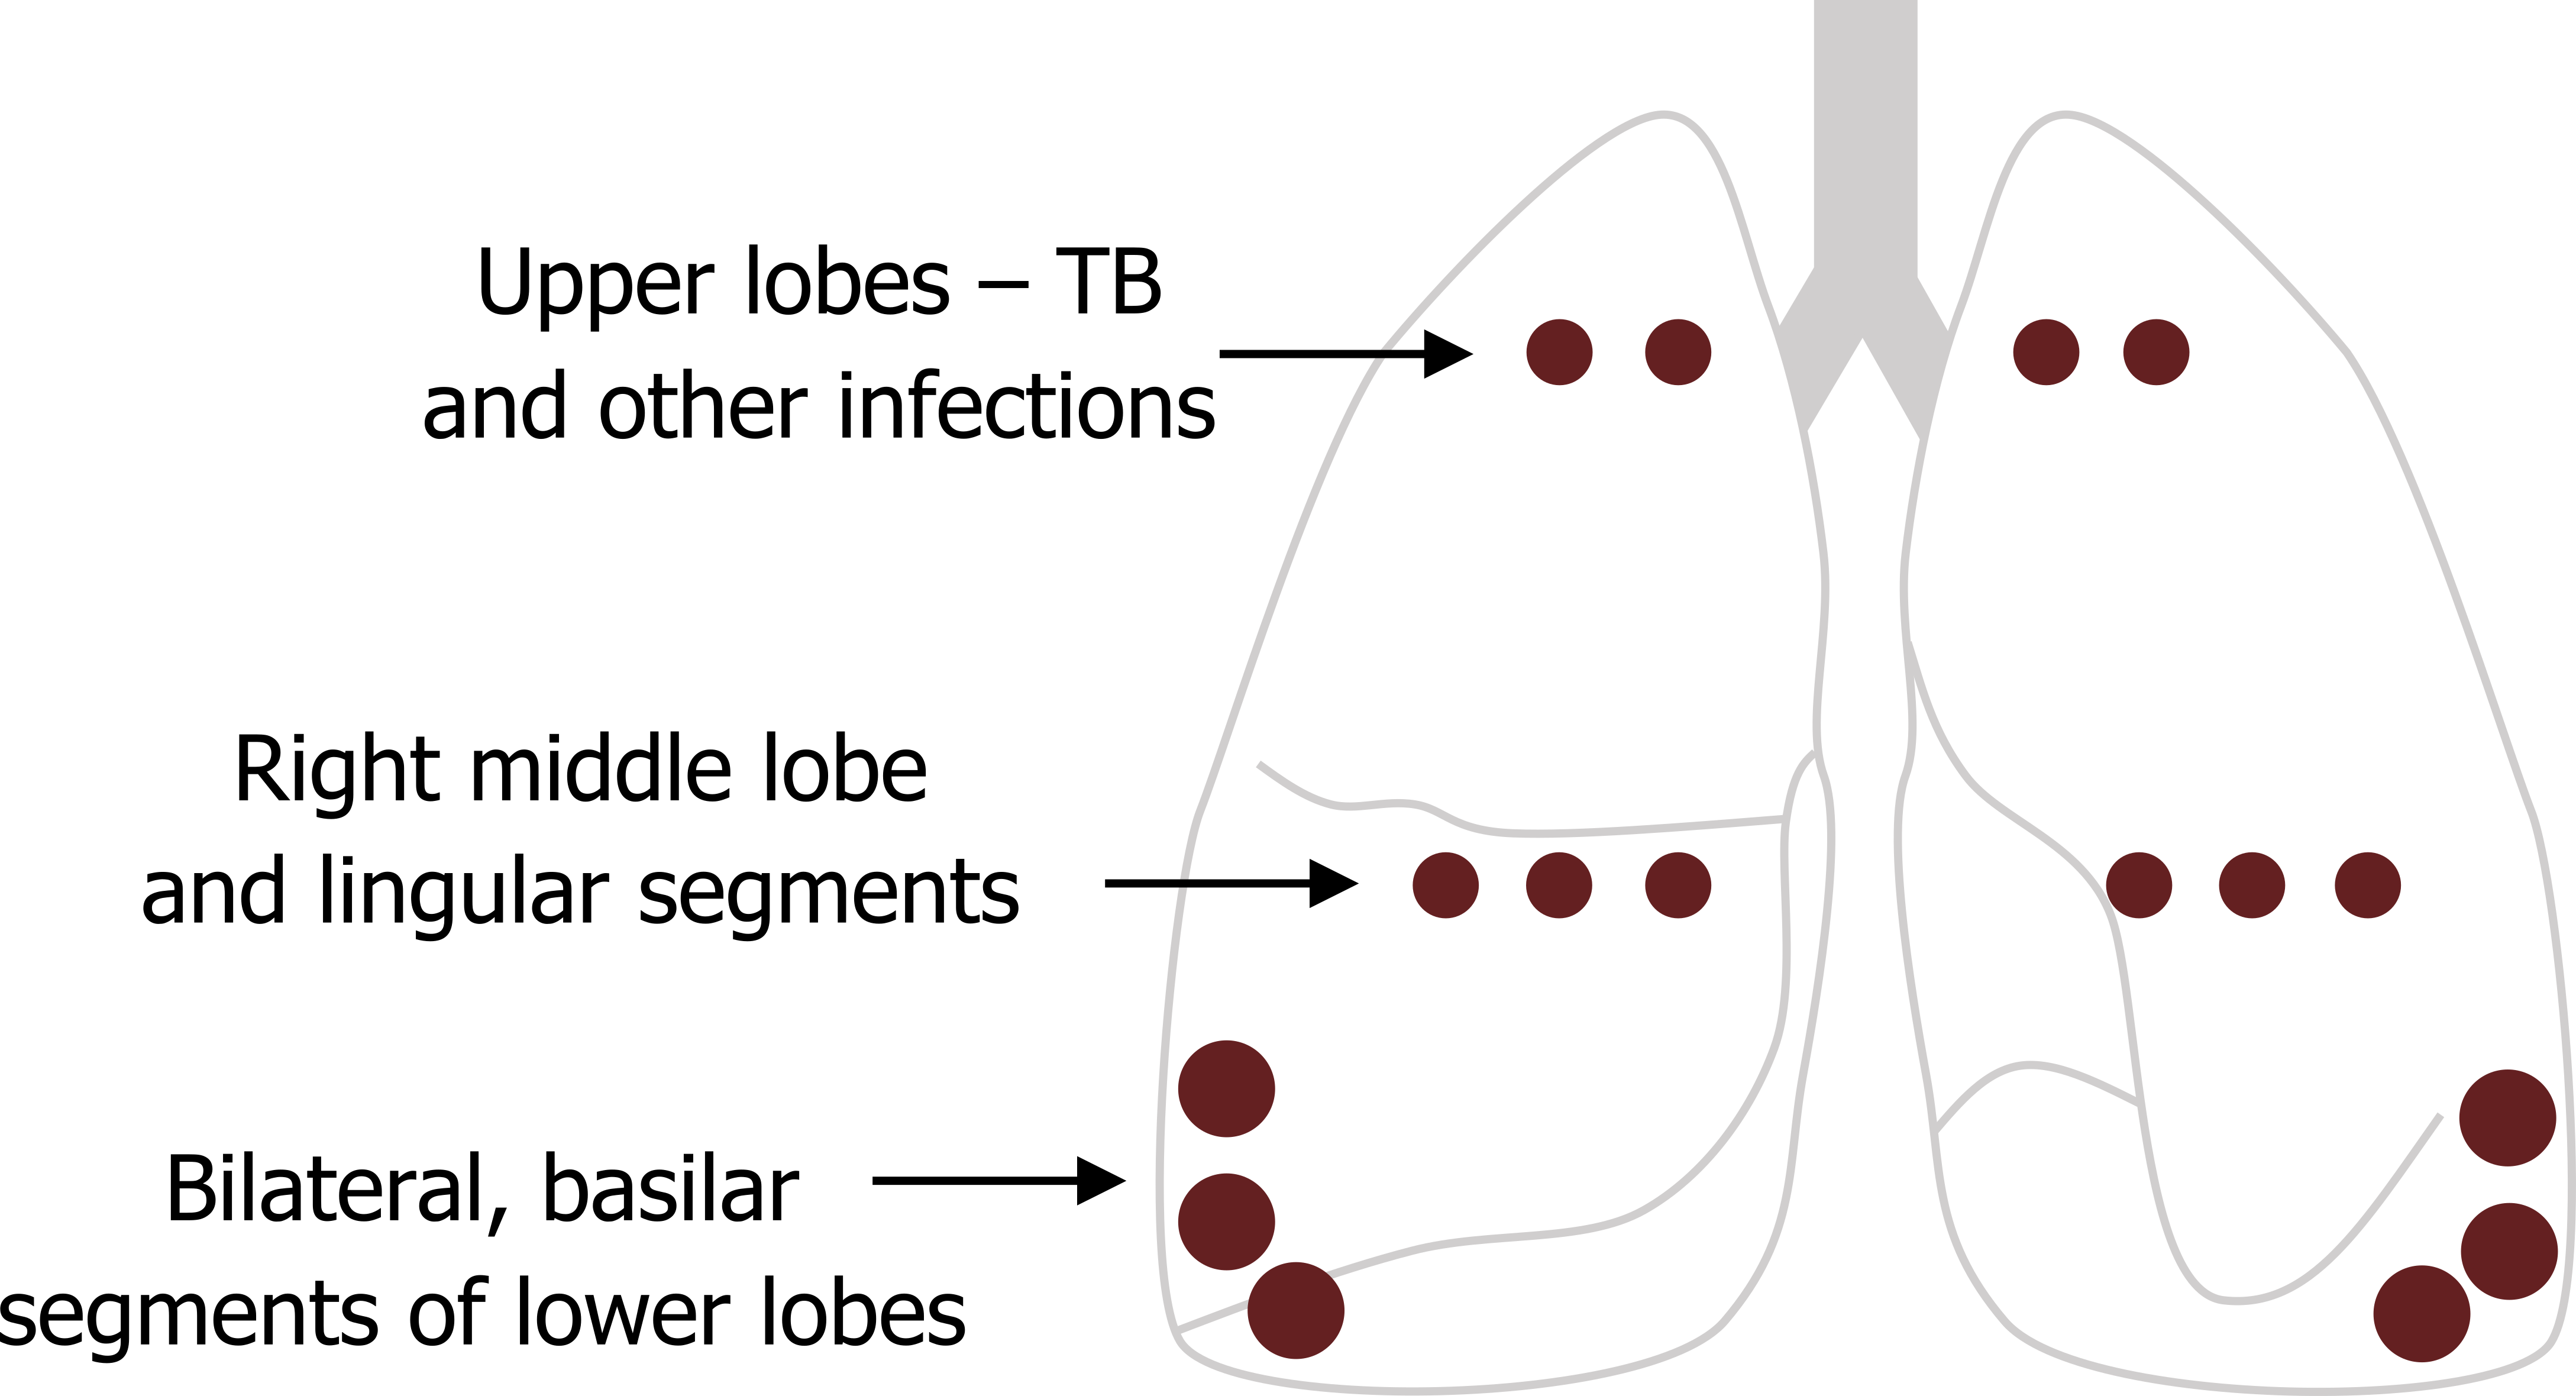
Where the bronchiectasis occurs in the lung is somewhat dependent on the cause. The segmental and subsegmental bronchi are the airway types most commonly affected, and the basilar segments of the lower lobes are the most frequent region in the lung. The second most common locations are the right middle lobe and lingual segments, while bronchiectasis caused by primary tuberculosis (TB) and other infections tend to occur in the upper lung fields where the infection is located (see figure 1.29).
So, how does bronchiectasis present, and what are the results of diagnostic tests?
Clinical Presentation of Bronchiectasis
The initial complaint is usually a persistent cough with copious expectoration. The amount of mucus the cough produces varies and can be as high as several hundred milliliters per day, particular when the dependent airways are involved. However, it is worth noting here that bronchiectasis in the upper lobes (usually associated with infection) may be dry with little or no mucus expectoration.
Generally though there is mucopurulent expectorate, and if it is associated with an anerobic infection it will likely have a foul odor. Sputum smears are loaded with white blood cells and can contain both gram-positive and -negative organisms.
The patient will likely have a history of recurrent pneumonia, the site of the pneumonia being consistent with locality of the bronchiectasis.
The expectorate may also contain blood. The degree and frequency of hemoptysis is variable and unpredictable, but occasionally it can be massive and life threatening.
The standard diagnostic tests may not be helpful in early stages, but typical signs appear with worsening airway involvement. In the early stages the patient will likely appear normal on a physical exam and have normal spirometry and arterial blood gas values. With more significant bronchiectasis, rales and rhonchi over the affected site can be heard.
Later signs with long-standing bronchiectasis include finger clubbing, but this is not exclusive to the condition.
A chest x-ray will show the peribronchial fibrosis and any atelectasis. But, as mentioned earlier, a high-resolution CT is much more effective at determining the degree and type of airway changes.
References, Resources, and Further Reading
Text
Farzan, Sattar, with Doris L. Hunsinger and Mary L. Phillips. “Chapters 8–11.” In A Concise Handbook of Respiratory Diseases. Reston, VA: Reston Publishing Company, 1978.
Husain, Aliya N. “Chapter 15: The Lung.” In Robbins and Cotran Pathologic Basis of Disease, 9th ed., edited by Vinay Kumar, Abul K. Abbas, and John C. Aster. Philadelphia: Saunders, an imprint of Elsevier Inc., 2015.
West, John B. “Chapter 4: Obstructive Diseases.” In Pulmonary Pathophysiology: The Essentials, 7th ed. Baltimore: Lippincott Williams & Wilkins, a Wolters Kluwer business, 2008.
Figures
Figure 1.1: Forms and prevalence of asthma. Grey, Kindred. 2022. CC BY 4.0. https://archive.org/details/1.1_20220203/mode/1up
Figure 1.2: Example of a mast cell loaded with secretory granules. Grey, Kindred. 2022. CC BY 4.0. https://archive.org/details/1.2_20220203
Figure 1.3: Vagal reflex of irritant airway receptors and the onset of asthma. Grey, Kindred. 2022. CC BY-SA 3.0. Added Mast cell by Colt browning from WikimediaCommons (CC BY-SA 3.0) and brainstem by tezar tantular from Noun Project (CC BY 3.0). https://archive.org/details/1.3_20220203
Figure 1.4: Factors promoting asthma at night. Grey, Kindred. 2022. CC BY-SA 3.0. Added FullMoon2010 by Gregory H. Revera from WikimediaCommons ( CC BY-SA 3.0). https://archive.org/details/1.4_20220203
Figure 1.5: NSAIDS including aspirin shift metabolism of arachidonic acid towards bronchoconstrictive leukotrienes. Grey, Kindred. 2022. CC BY 4.0. Added see saw by Made by Made from Noun Project (CC BY 3.0). https://archive.org/details/1.5_20220203
Figure 1.6: Illustrations of normal (A), mildly asthmatic (B) and severely asthmatic (C) airways. Grey, Kindred. 2022. CC BY 4.0. https://archive.org/details/1.6_20220203
Figure 1.7: Histological signs of asthma, A = Charcot–Leyden crystals, B = Curshman’s spirals. Grey, Kindred. 2022. CC BY-SA 3.0. Added Charcot-Leyden crystals, HE 2 by Patho from WikimediaCommons (CC BY-SA 3.0) and Curshman’s Spiral by Doc James from WikimediaCommons (CC BY 4.0). https://archive.org/details/1.7_20220203
Figure 1.8: Components of airway remodeling in persistent asthma. Grey, Kindred. 2022. CC BY 4.0. https://archive.org/details/1.9_20220203
Figure 1.9: The progression of an asthma “attack.” Grey, Kindred. 2022. CC BY 4.0. https://archive.org/details/1.8_20220203
Figure 1.10: Typical chest x-ray of asthma showing hyperlucent fields and hyperinflation. Delgado, J., Bell, D., et al. 2021. CC BY-NC-SA 3.0. “Case 1” from https://doi.org/10.53347/rID-50343.
Figure 1.11: Pathophysiology of chronic bronchitis. Grey, Kindred. 2022. CC BY 4.0. Added cigarette by Christian Frost from Noun Project (CC BY 3.0). https://archive.org/details/1.11_20220203
Figure 1.12: The Reid index compares the width of mucus glands to the width of the submucosal layer of airways. Grey, Kindred. 2022. CC BY 4.0. https://archive.org/details/1.12_20220203
Figure 1.13: Prolonged irritant exposure can lead to airway remodeling with loss of normal ciliated epithelium. Grey, Kindred. 2022. CC BY 4.0. https://archive.org/details/1.13_20220203
Figure 1.14: The pathophysiological and clinical events as chronic bronchitis progresses. Grey, Kindred. 2022. CC BY 4.0. https://archive.org/details/1.14_20220203
Figure 1.15: Histological comparison of normal (left) and emphysematous (right) lung tissue. Yuan, R., et al. “Figure 5.” In “Quantification of Lung Surface Area Using Computed Tomography.” Respiratory Research 11, no. 1 (2010): 153. Openi, CC BY 2.0.
Figure 1.16: Characteristic patterns of emphysema. Grey, Kindred. 2022. CC BY 4.0. Added Sphere by Ates Evren Aydinel from Noun Project (CC BY 3.0). https://archive.org/details/1.16_20220203
Figure 1.17: Pathological process of emphysema. Grey, Kindred. 2022. CC BY 4.0. Added cigarette by Christian Frost from Noun Project (CC BY 3.0). https://archive.org/details/1.17_20220203
Figure 1.18: The pathophysiological events that lead to the clinical signs of emphysema. Grey, Kindred. 2022. CC BY 4.0. https://archive.org/details/1.18_20220203
Figure 1.19: Ion currents in normal and CF cells impact on fluid layer and cilia. Grey, Kindred. 2022. CC BY 4.0. Added ion channel by Léa Lortal from Noun Project (CC BY 3.0). https://archive.org/details/1.19_20220203
Figure 1.20: Pulmonary consequences of CF. Grey, Kindred. 2022. CC BY 4.0. Added Staphylococcus aureus VISA 2 by Janice Haney Carr (CDC) from WikimediaCommons (public domain) and Pseudomonas by Janice Haney Carr (CDC) from WikimediaCommons (public domain). https://archive.org/details/1.20_20220203
Figure 1.21: Clinical signs of the pulmonary progression of CF. Grey, Kindred. 2022. CC BY 4.0. https://archive.org/details/1.21_20220203
Figure 1.22: Typical Chest X-ray findings of CF. Grey, Kindred. 2022. CC BY-NC-SA 3.0. Added Case 1 by Gaillard, F., Skalina, T., et al. from https://doi.org/10.53347/rID-1188 (CC BY-NC-SA 3.0). https://archive.org/details/1.22_20220203
Figure 1.23: HRCT of CF lungs showing multiple, severe bronchiectasis. Gaillard, F., El-Feky, M., et al. 2021. CC BY-NC-SA 3.0. “Case 8” from https://doi.org/10.53347/rID-8313.
Figure 1.24: Pathophysiology of bronchiectasis. Grey, Kindred. 2022. CC BY 4.0. https://archive.org/details/1.24_20220203
Figure 1.25: Instigating factors for bronchiectasis. Grey, Kindred. 2022. CC BY 4.0. https://archive.org/details/1.25_20220203
Figure 1.26: Histological and gross changes. Grey, Kindred. 2022. CC BY-SA 2.0. Added Follicular bronchiolitis associated with bronchiectasis and rheumatoid arthritis – Case 296 by Yale Rosen from Flickr (CC BY-SA 2.0) and Bronchiectasis by Yale Rosen from WikimediaCommons (CC BY-SA 2.0). https://archive.org/details/1.26_20220203
Figure 1.27: Forms of bronchiectasis. Grey, Kindred. 2022. CC BY 4.0. https://archive.org/details/1.27_20220203
Figure 1.28: Chest x-ray and computed tomography of severe bronchiectasis. Bickle, I., Niknejad, M., et al. T. 2021. CC BY-NC-SA 3.0. “Case 1” and “Case 3” from https://doi.org/10.53347/rID-50703.
Figure 1.29: Common locations of the segmental and sub-segmental broncho affected by bronchiectasis. Grey, Kindred. 2022. CC BY 4.0. https://archive.org/details/1.29_20220203
