7 Ischemic Heart Disease
Learning Objectives
- Distinguish between different degrees of myocardial ischemia and their pathophysiological impact.
- Determine the location of infarcted myocardium using a 12-lead ECG.
Atherosclerosis is the pathological process by which the structure of an artery is disrupted through the deposition of cholesterol with the intima of the wall. Initially starting as a “fatty streak” the accumulating cholesterol can lead to the formation of an atherosclerotic plaque with a more complex, but ultimately less stable, structure. During this process the endothelium becomes dysfunctional and the growing plaque can impinge on the lumen of the vessel causing reduced blood flow to the downstream tissue and cause ischemia. When the atherosclerotic plaque forms within the coronary arteries (coronary artery disease, or CAD), the subsequent myocardial ischemia can lead to acute coronary syndromes and ST segment elevation MI, or STEMI. When present in other circulations, atherosclerosis can contribute to stroke, peripheral arterial disease, aortic aneurysms, renal artery disease, and mesenteric ischemia.
The process by which atherosclerotic plaques form is summarized in figure 7.1, but there are four fundamental stages:
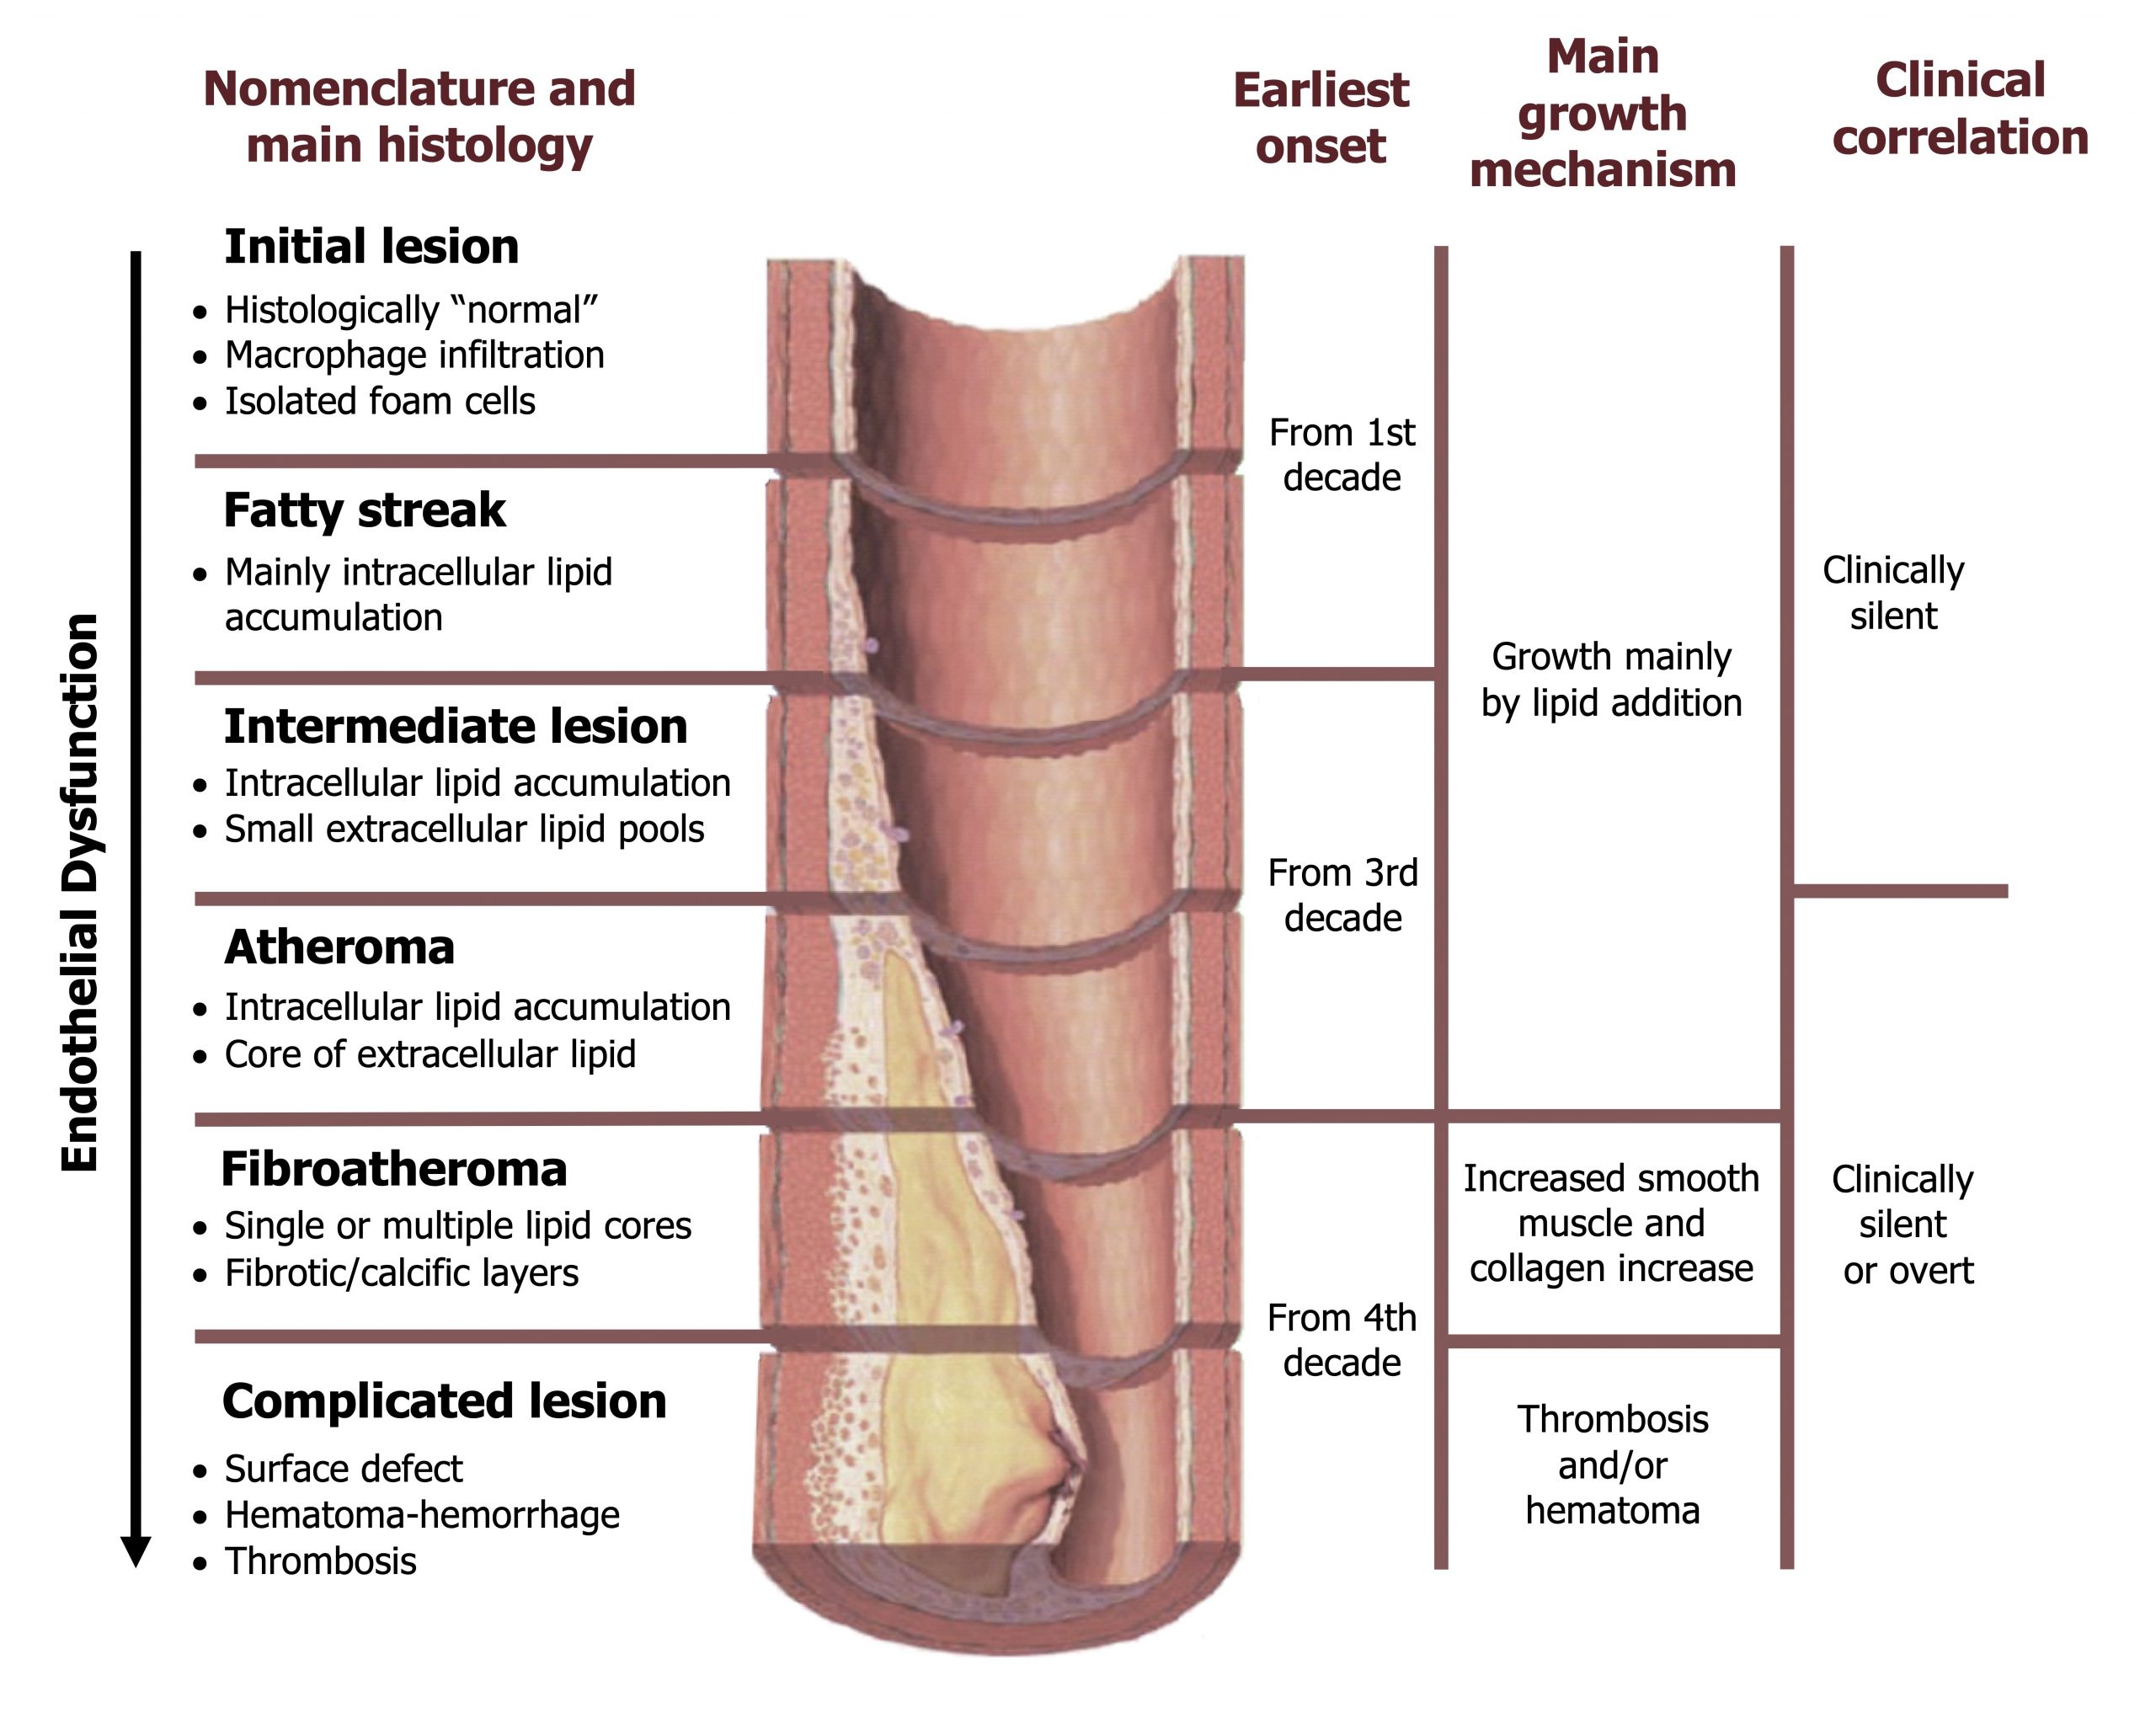
- Endothelial cell injury. The process is likely initiated by endothelial damage. The potential causes of this damage are numerous and involve any toxin to which the endothelium is exposed. This is reflected in the risk factors for CAD such as tobacco use, diabetes, and dyslipidemia, all of which can cause endothelial damage. As well as chemical insults to the endothelium, excessive physical force can also cause damage and likely contributes to the correlation of CAD and hypertension.
- Lipoprotein deposition. The damaged endothelium allows entry of cholesterol (LDL) into the vessel wall, whereupon it is oxidized (mLDL) and results in an inflammatory response that includes expression of MCP-1 (monocyte chemattractant protein-1) that attracts monocytes from the bloodstream. The monocytes enter the wall, and the mLDL promotes their transition to macrophage. The macrophages ingest the mLDL to become “foam cells” that form the fatty streak.
- Inflammatory reaction. As well as consuming the mLDL, the macrophages release cytokines that attract other white blood cells (including T-lymphcytes) to the vessel wall through endothelial expression of adhesion molecules (e.g., ICAM-1, VCAM-1, E-selectin, and P-selectin).
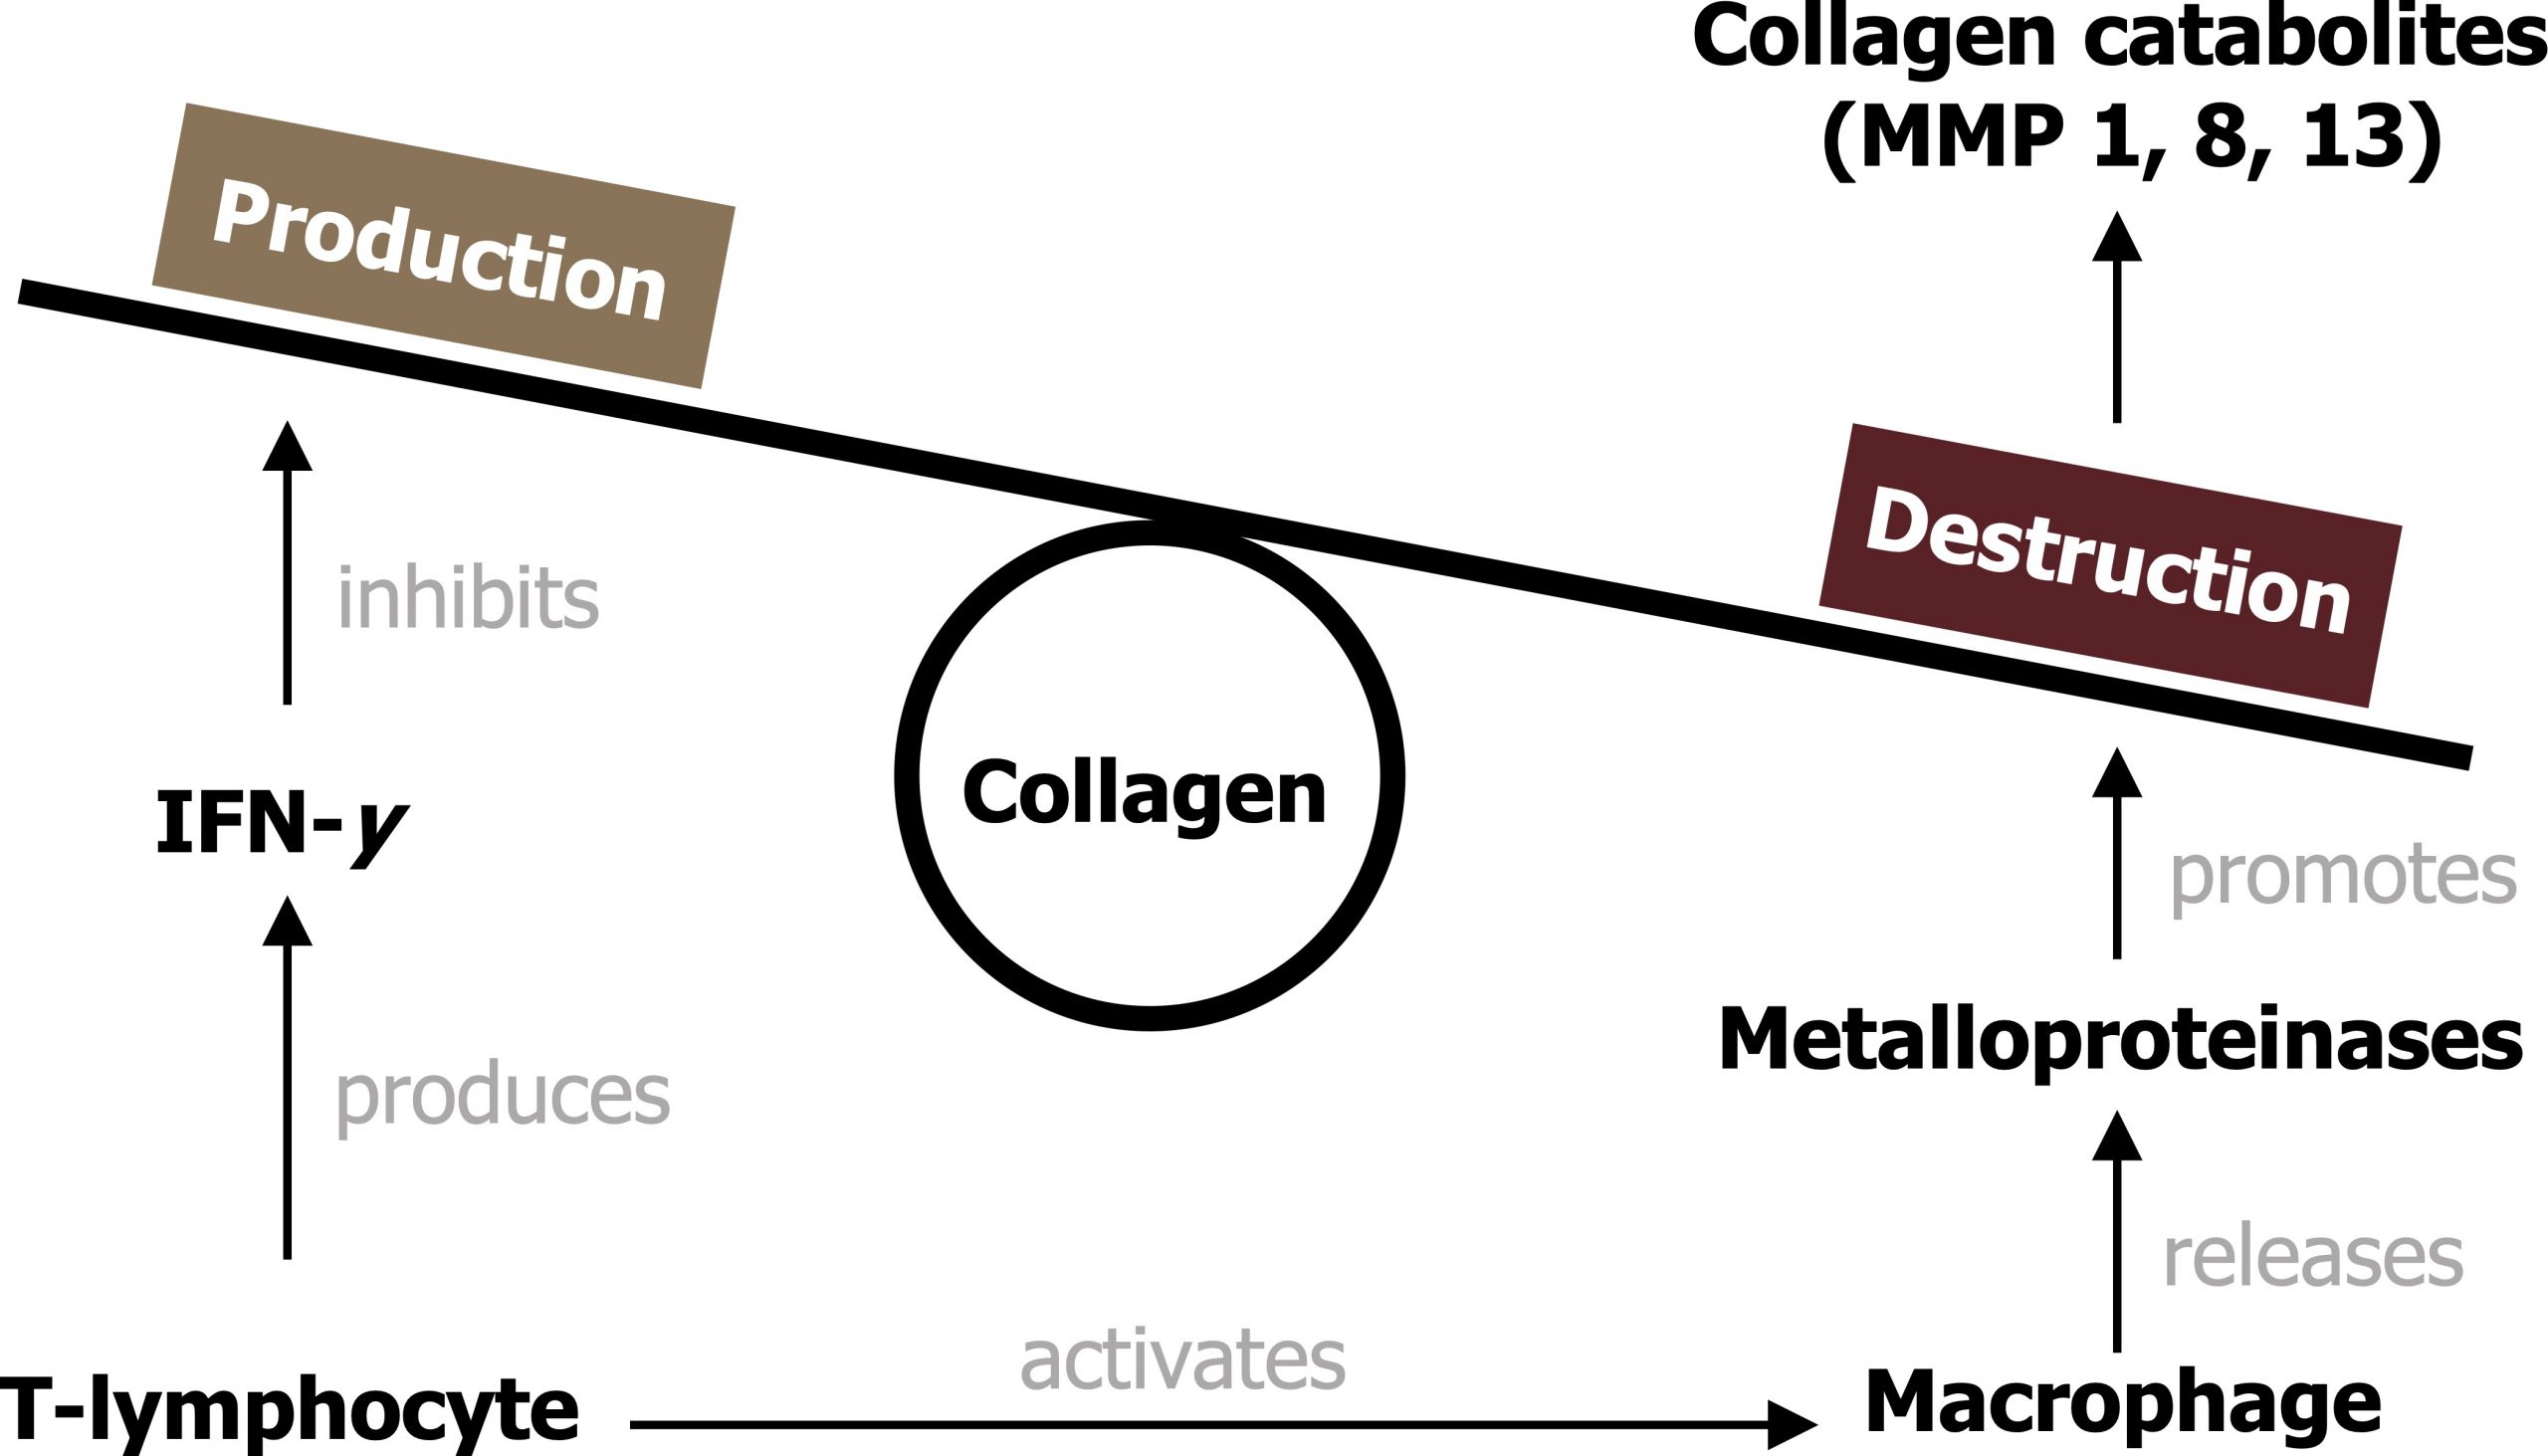
- Smooth muscle cell cap formation and weakening. The T-lymphocytes release cytokines that promote migration of smooth muscle cells to the surface of the plaque that create a “fibrous cap.” This cap is initially thick and therefore stable. However, continued arrival and action of T-lymphocytes subsequently weaken the plaque’s structural integrity as they penetrate the cap and release IFN-y that inhibits collagen production, while activated macrophages simultaneously destroy the cap’s collagen. Calcification of the plaque also reduces its integrity. The weakened plaque is now more prone to rupture and inducing formation of a thrombus (see figure 7.2).
Types of Myocardial Ischemia and Infarction
The degree of occlusion caused by the plaque and the oxygen demand of the myocardium determine the degree of ischemia that can develop. Arterial occlusion tends not to be a significant factor until the lumen is occluded by about 70 percent. Vascular occlusion may also be masked by formation of anastomoses (new vessels that bypass the occlusion). Rupture of the plaque and formation of a thrombus can drastically and quickly reduce the lumen and blood flow. The degree and duration of ischemia determine the type of acute coronary syndrome that occurs and the clinical impact. Mild or brief ischemia can lead to angina pectoris with no permanent tissue damage, but when ischemia is prolonged then myocardial infarction becomes more likely, and significant changes in ECG and release of cardiac enzymes are seen.
Stable and unstable angina pectoris
While not considered an acute coronary syndrome, stable angina is pain associated with periods of myocardial ischemia, usually associated with exertion and an increase in myocardial oxygen demand that is unmeet because of insufficient tissue perfusion. The inadequate perfusion is most commonly caused by coronary artery disease (vessel occlusion). Stable angina is predictable and regular, and resolves when the myocardial oxygen demand is reduced (i.e., cessation of exercise).
Unstable angina is more serious and may be an unpredictable exacerbation of anginal pain that had previously been stable. It may occur at rest or lower than usual levels of exertion. Unstable angina is part of the acute coronary syndrome spectrum and may reflect rupture of a plaque that has led to thrombosis. The ECG in unstable angina may show hyperacute T-waves, flattening of the T-waves, inverted T-waves, and ST depression. Without the presence of myocardial damage, unstable angina is not associated with elevated cardiac enzymes (e.g., troponin). Continued or worsening stenosis of the coronary artery leads to tissue infarction and more clinically significant elements of acute coronary syndrome.
Non-ST segment elevation myocardial infarction
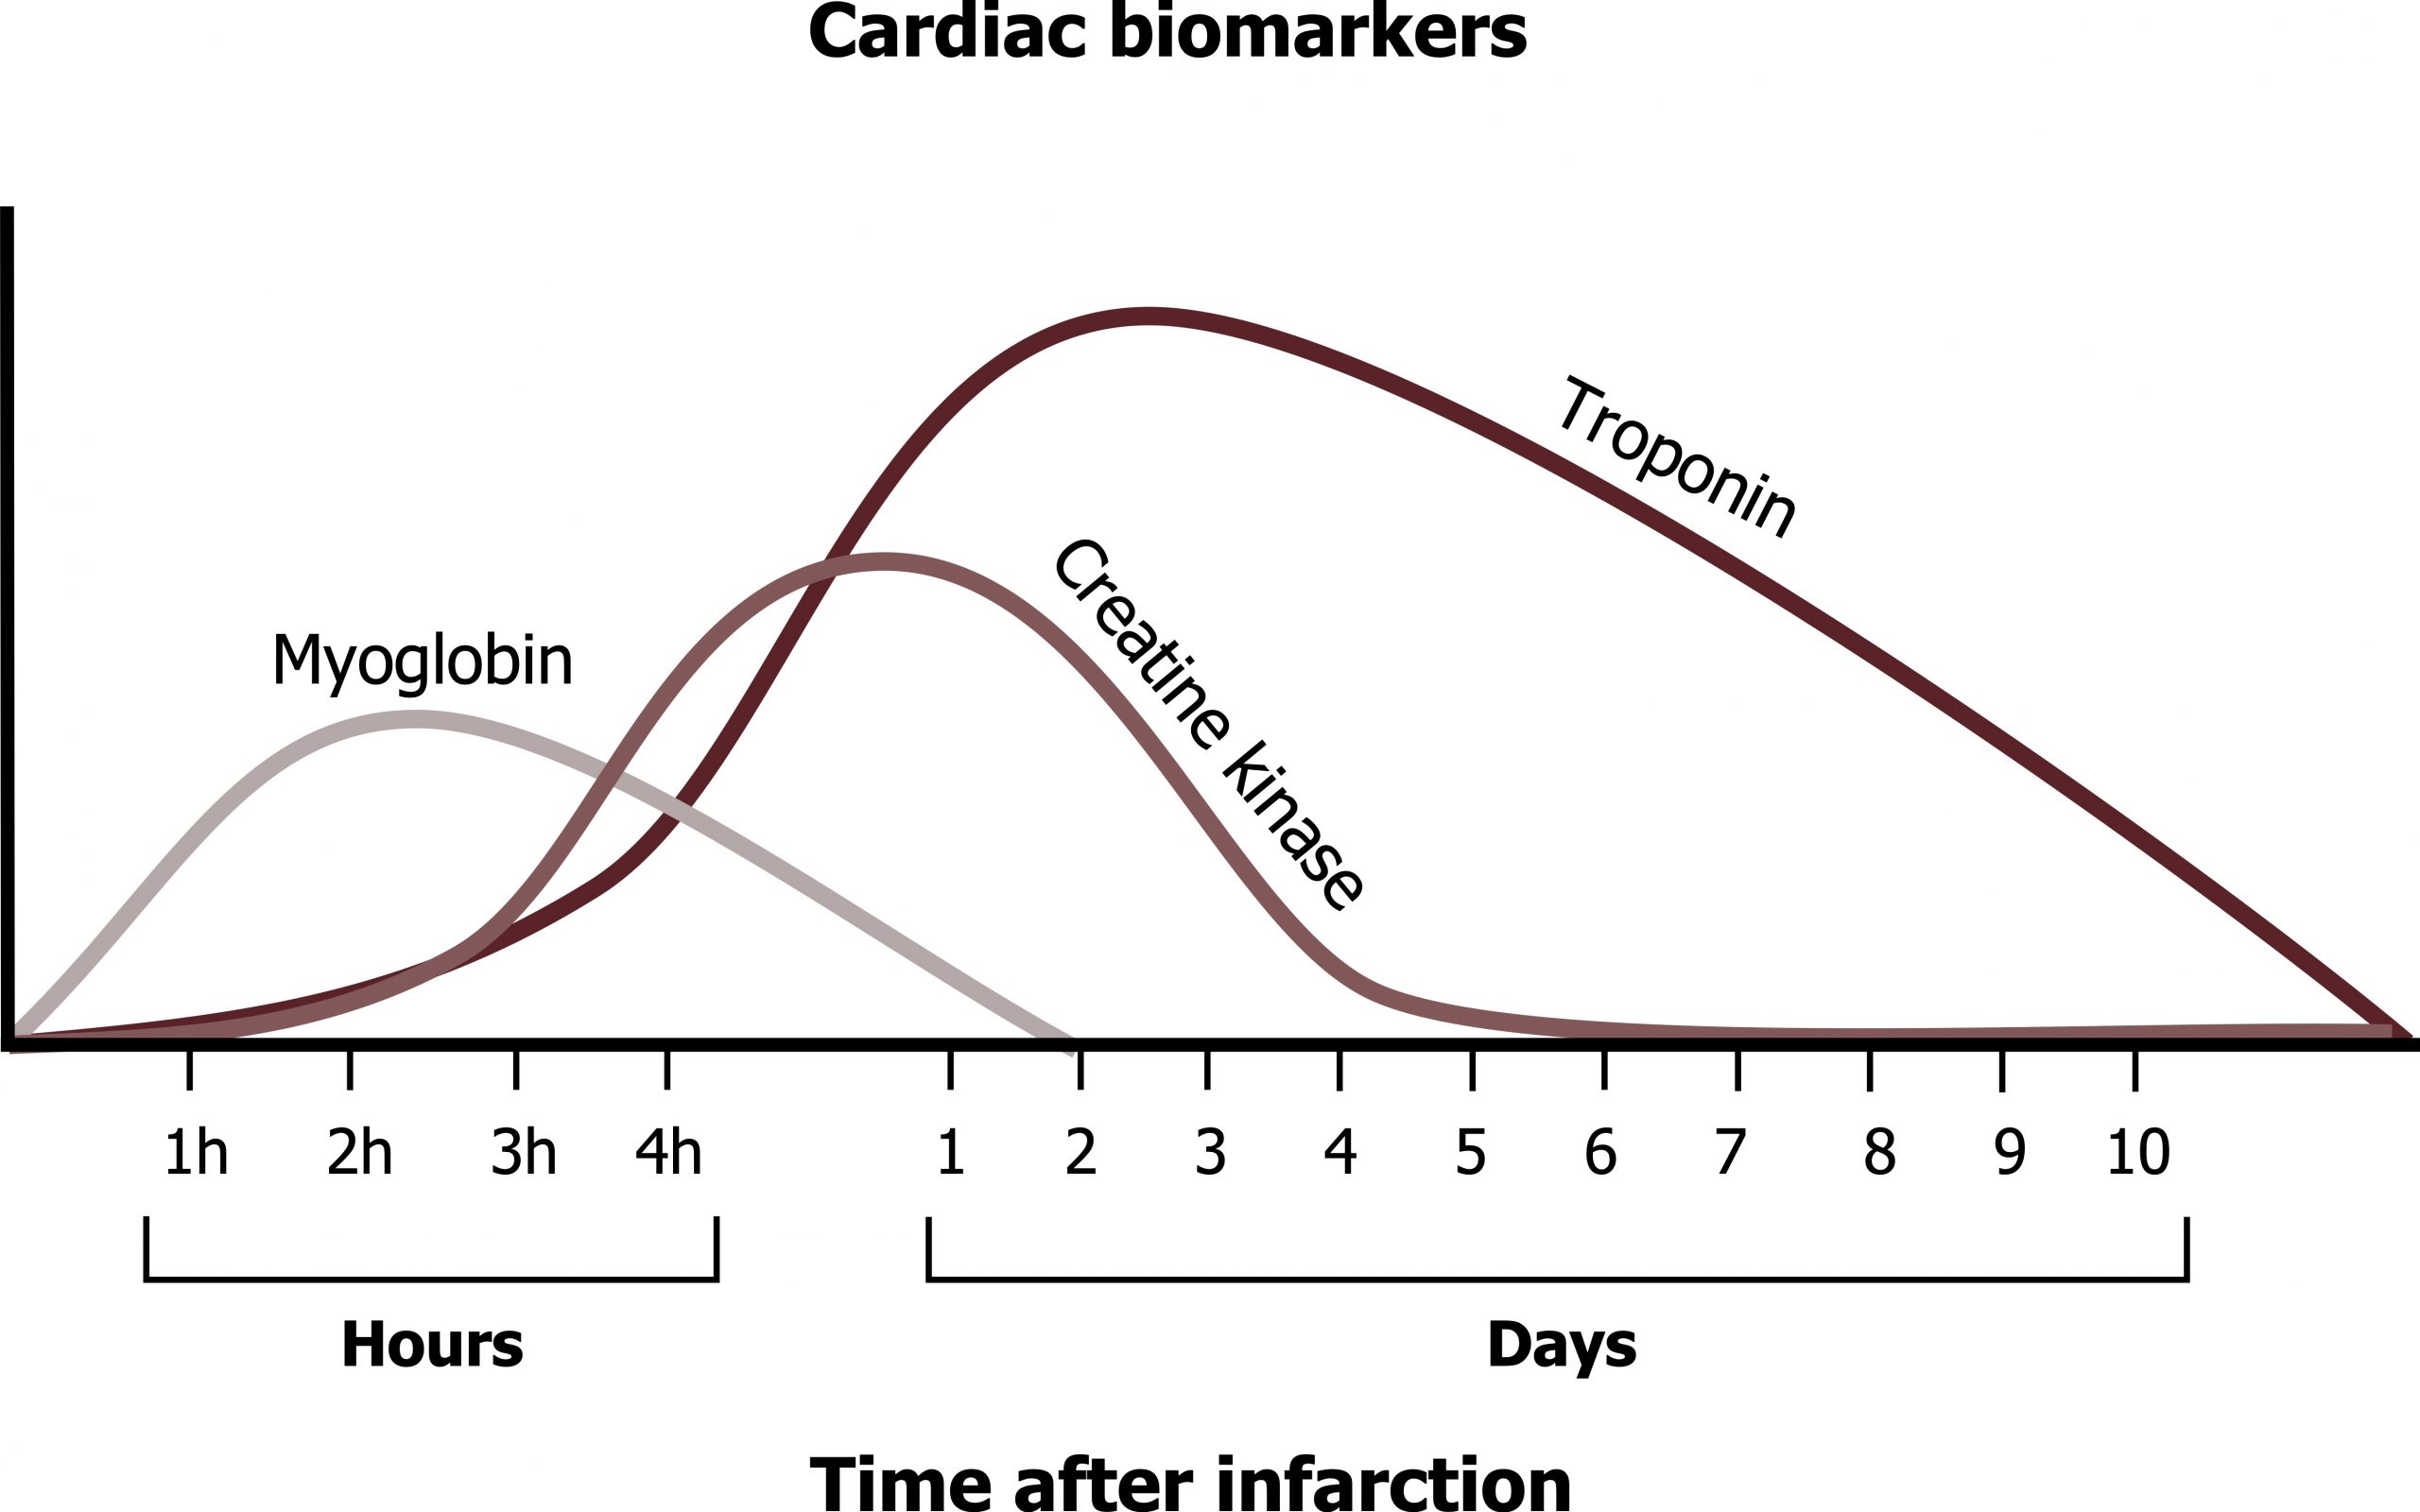
With non-ST segment elevation myocardial infarction (NSTEMI), there is necrosis of the myocardium. Although, as the name suggests, there is no consistent ST segment elevation in a NSTEMI, other ECG changes may be seen. These include transient ST elevation, ST depression, or new T-wave inversions. The lysing myocytes release their contents including enzymes that can be used as biomarkers of the necrotic event. Presence of elevated cardiac enzymes distinguishes NSTEMI from unstable angina, but denotes myocardial damage and a poorer prognosis. There are several cardiac enzymes that can be detected (myoglobin, creatine kinase, and troponin I), and each has a different timeline from onset of infarction (figure 7.3). But because of improvements in test sensitivity, the test enzyme of choice is troponin I.
Troponin
Troponin I is a normal protein important in the contractile apparatus of the cardiac myocyte. It is released into the circulation about three to four hours after MI and are still detectable for ten days afterward. The long half-life allows for the late diagnosis of MI but makes it difficult to detect reinfarction (a major complication associated with new thrombus formation during stent placement). Although there are a number causes for troponin elevation unrelated to MI, troponin elevation is much more sensitive and specific than myoglobin and even creatine kinase.
ST segment elevation myocardial infarction
ST segment elevation myocardial infarction (STEMI) most often results from complete occlusion of a major epicardial vessel. The resultant myocardial infarction raises cardiac enzymes measured in the blood (as with NSTEMI), but is accompanied by an ST segment elevation on the 12-lead ECG. This is the most serious of the acute coronary syndromes.
Pathophysiology of a STEMI
The most common cause of a STEMI is rupture of an atherosclerotic plaque. The continued degradation and calcification of the fibrous cap results in it breaking and spilling its contents into the bloodstream. Tissue factor within the necrotic core instigates the coagulation cascade when it is exposed to the blood and a thrombus is formed and the vessel is occluded. Plaques rupture most frequently at their “shoulder,” the thin peripheral edges where proteolytic and apoptotic activity are highest and mechanical forces are most effective. The tissue downstream from the occlusion experiences ischemia and then infarcts. The impact on cardiac function and output depends on the site and extent of the infarcted tissue. For example, if a significant section of the left ventricular wall is involved, then the fall in cardiac output may be catastrophic, or if the papillary muscles of a valve are included, the valve may become incompetent and allow regurgitation.
Physical Exam of a STEMI
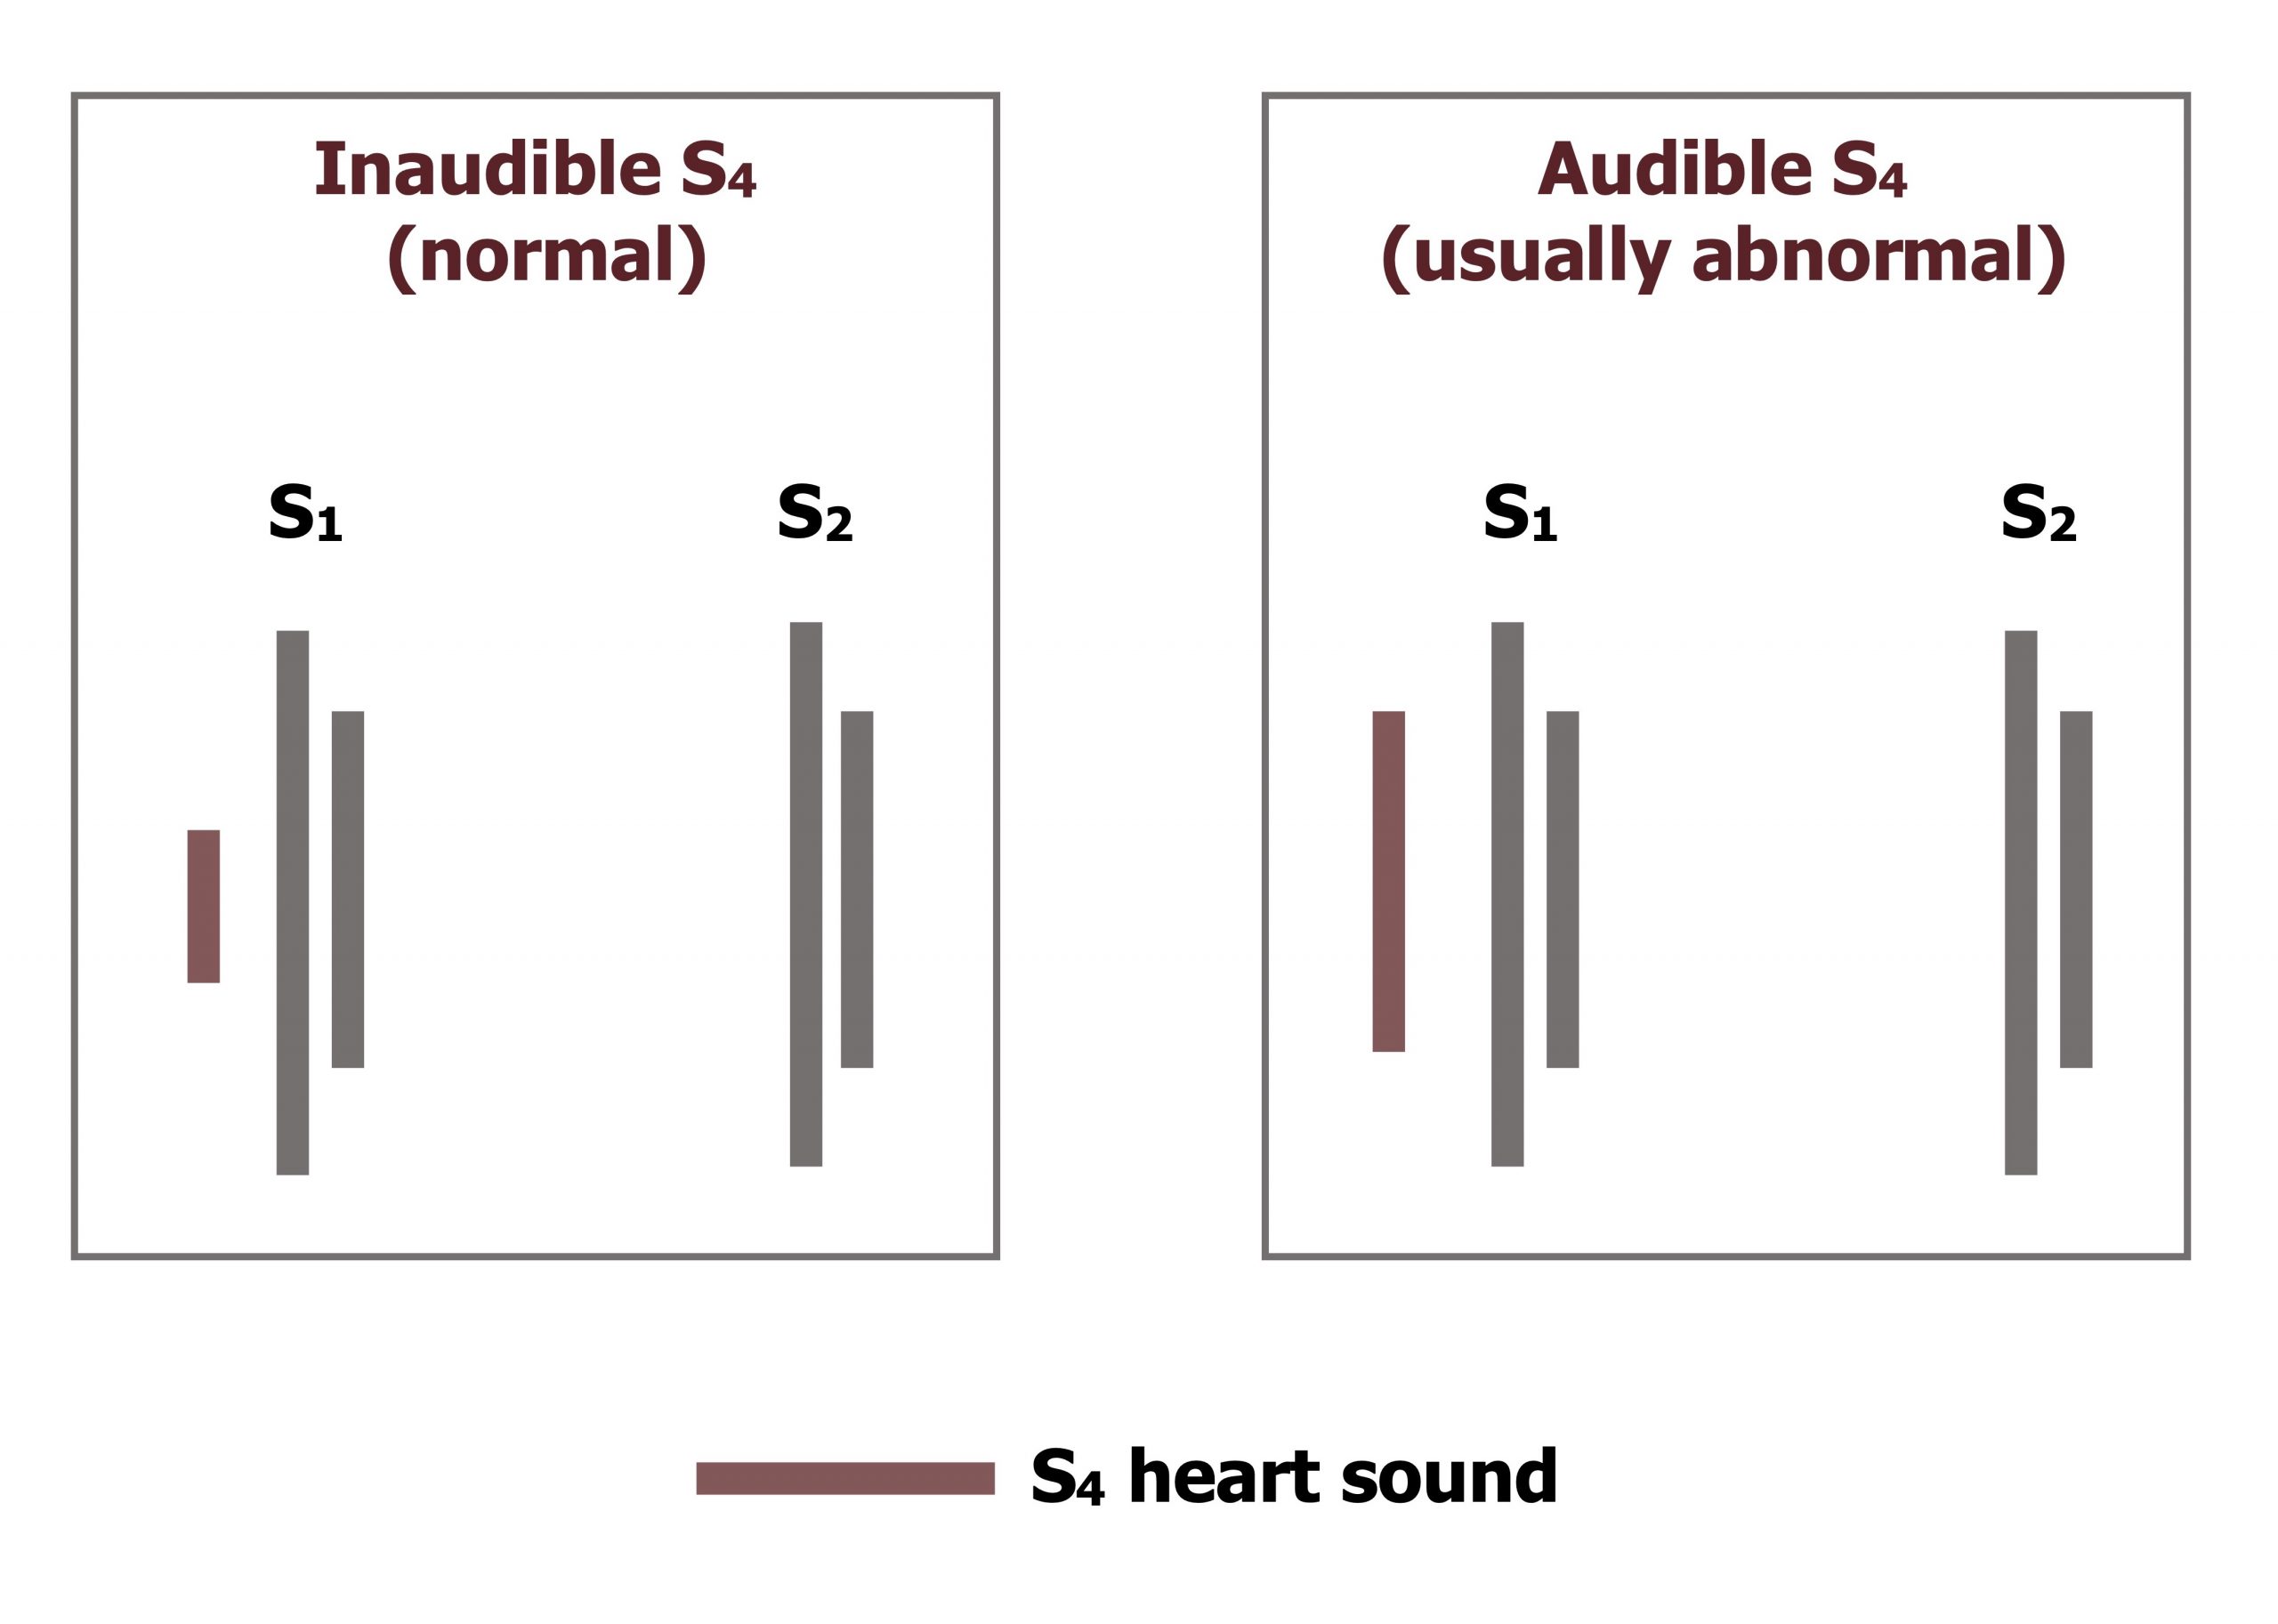
The physical examination findings may include elevated heart rate and blood pressure due to increased sympathetic tone. However, if cardiac function is severely impacted because of the size or location of the infarction, cardiogenic shock may result with a fall in blood pressure. The insufficient ATP production in the ischemic region means the interaction of actin and myosin in the cardiac myocytes cannot be broken and the muscle cannot relax. An S4 heart sound (figure 7.4) occurs when the noncompliant, stiffened left ventricle vibrates when blood enters from the atrium. The S4 sound is also known as an atrial gallop—not because the sound comes from the ventricle, but because it is associated with atrial contraction (and ventricular filling). If the infarction involves an impact of the papillary muscle function, the associated valve will fail and the regurgitation will cause a holosystolic murmur. A STEMI in the left ventricle sufficient to cause congestion and a rise in left-ventricular and end-diastolic pressure can lead to rises in left atrial and pulmonary pressure; this may be heard on the lung exam as rales due to the transient pulmonary edema.
Diagnosis of a STEMI
As mentioned above the two most important tools for diagnosing a STEMI are the ECG and the presence of cardiac enzymes that have been released into the bloodstream. Figure 7.4 shows the time line of myoglobin, creatine kinase, and troponin elevations after an infarction. Using the values of all three enzymes allowed the history of an infarction to be generated, but amazing improvements in the sensitivity of the troponin I test have allowed it to become the gold standard because of its specificity to the myocardium.
Changes in ECG
The first ECG sign to arise during a STEMI are “hyperacute T-waves” (figure 7.5). These T-waves are taller than normal and caused by the release of intracellular potassium from lysing cells and the consequent hyperkalemia in the surrounding tissue. Hyperacute T-waves are not often seen clinically because they occur so early in the event and prior to the patient’s arrival in the hospital. Subsequent ECG stages are more commonly observed, and these include the ST elevation.
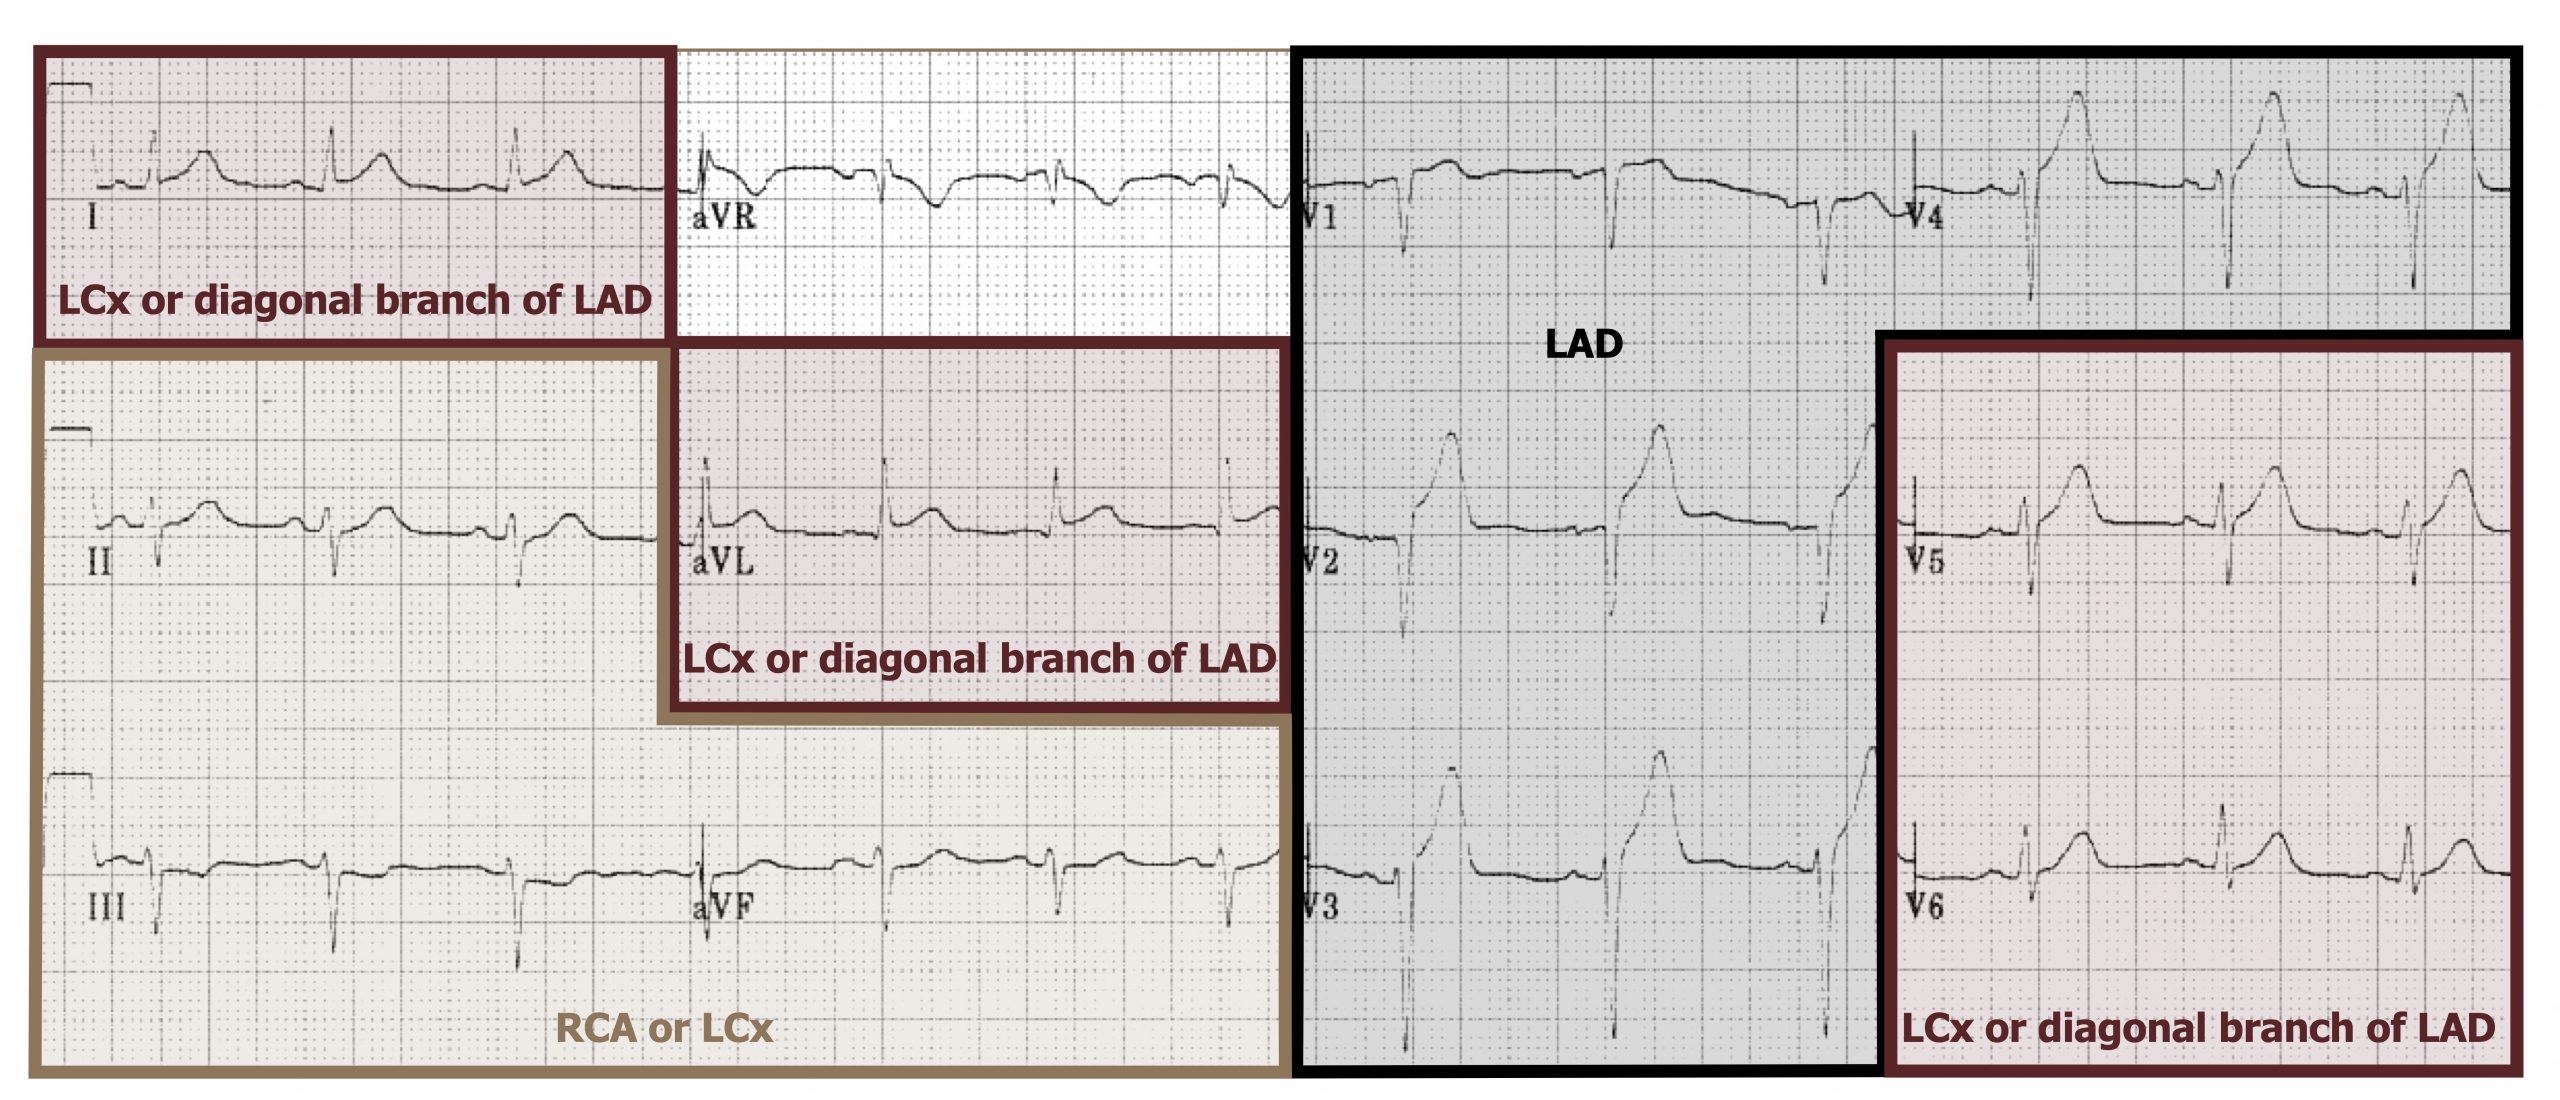
Determining which ECG leads show the ST elevation allow for the location of the infarcted tissue to be determined and provide insight into which coronary vessel is effected. How the leads of a twelve-lead ECG relate to the coronary vessels is summarized in figure 7.6. The following looks at the characteristic ECG changes in relation to location in a bit more detail (tip: relate back to figure 7.6 as you read the next sections).
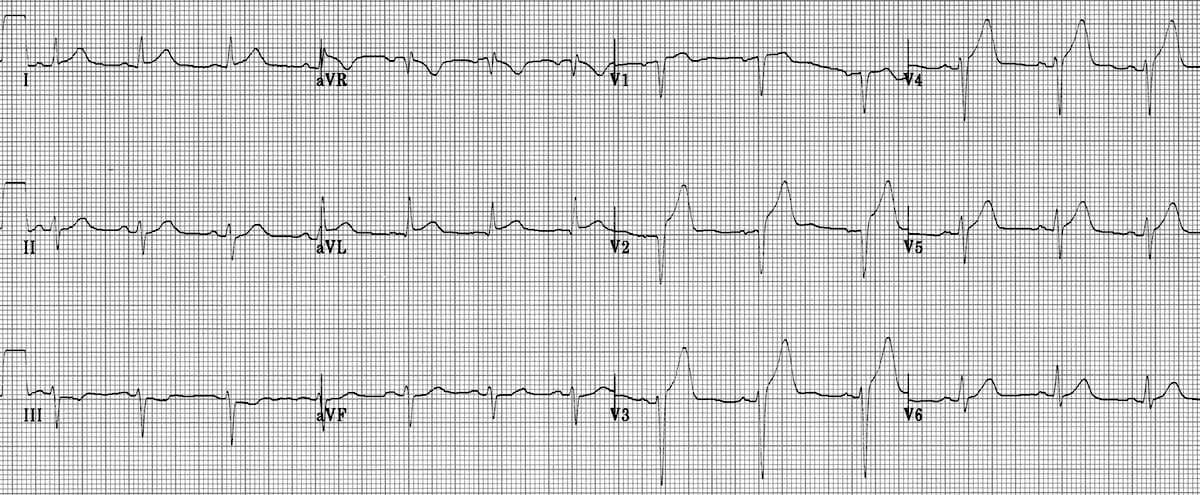
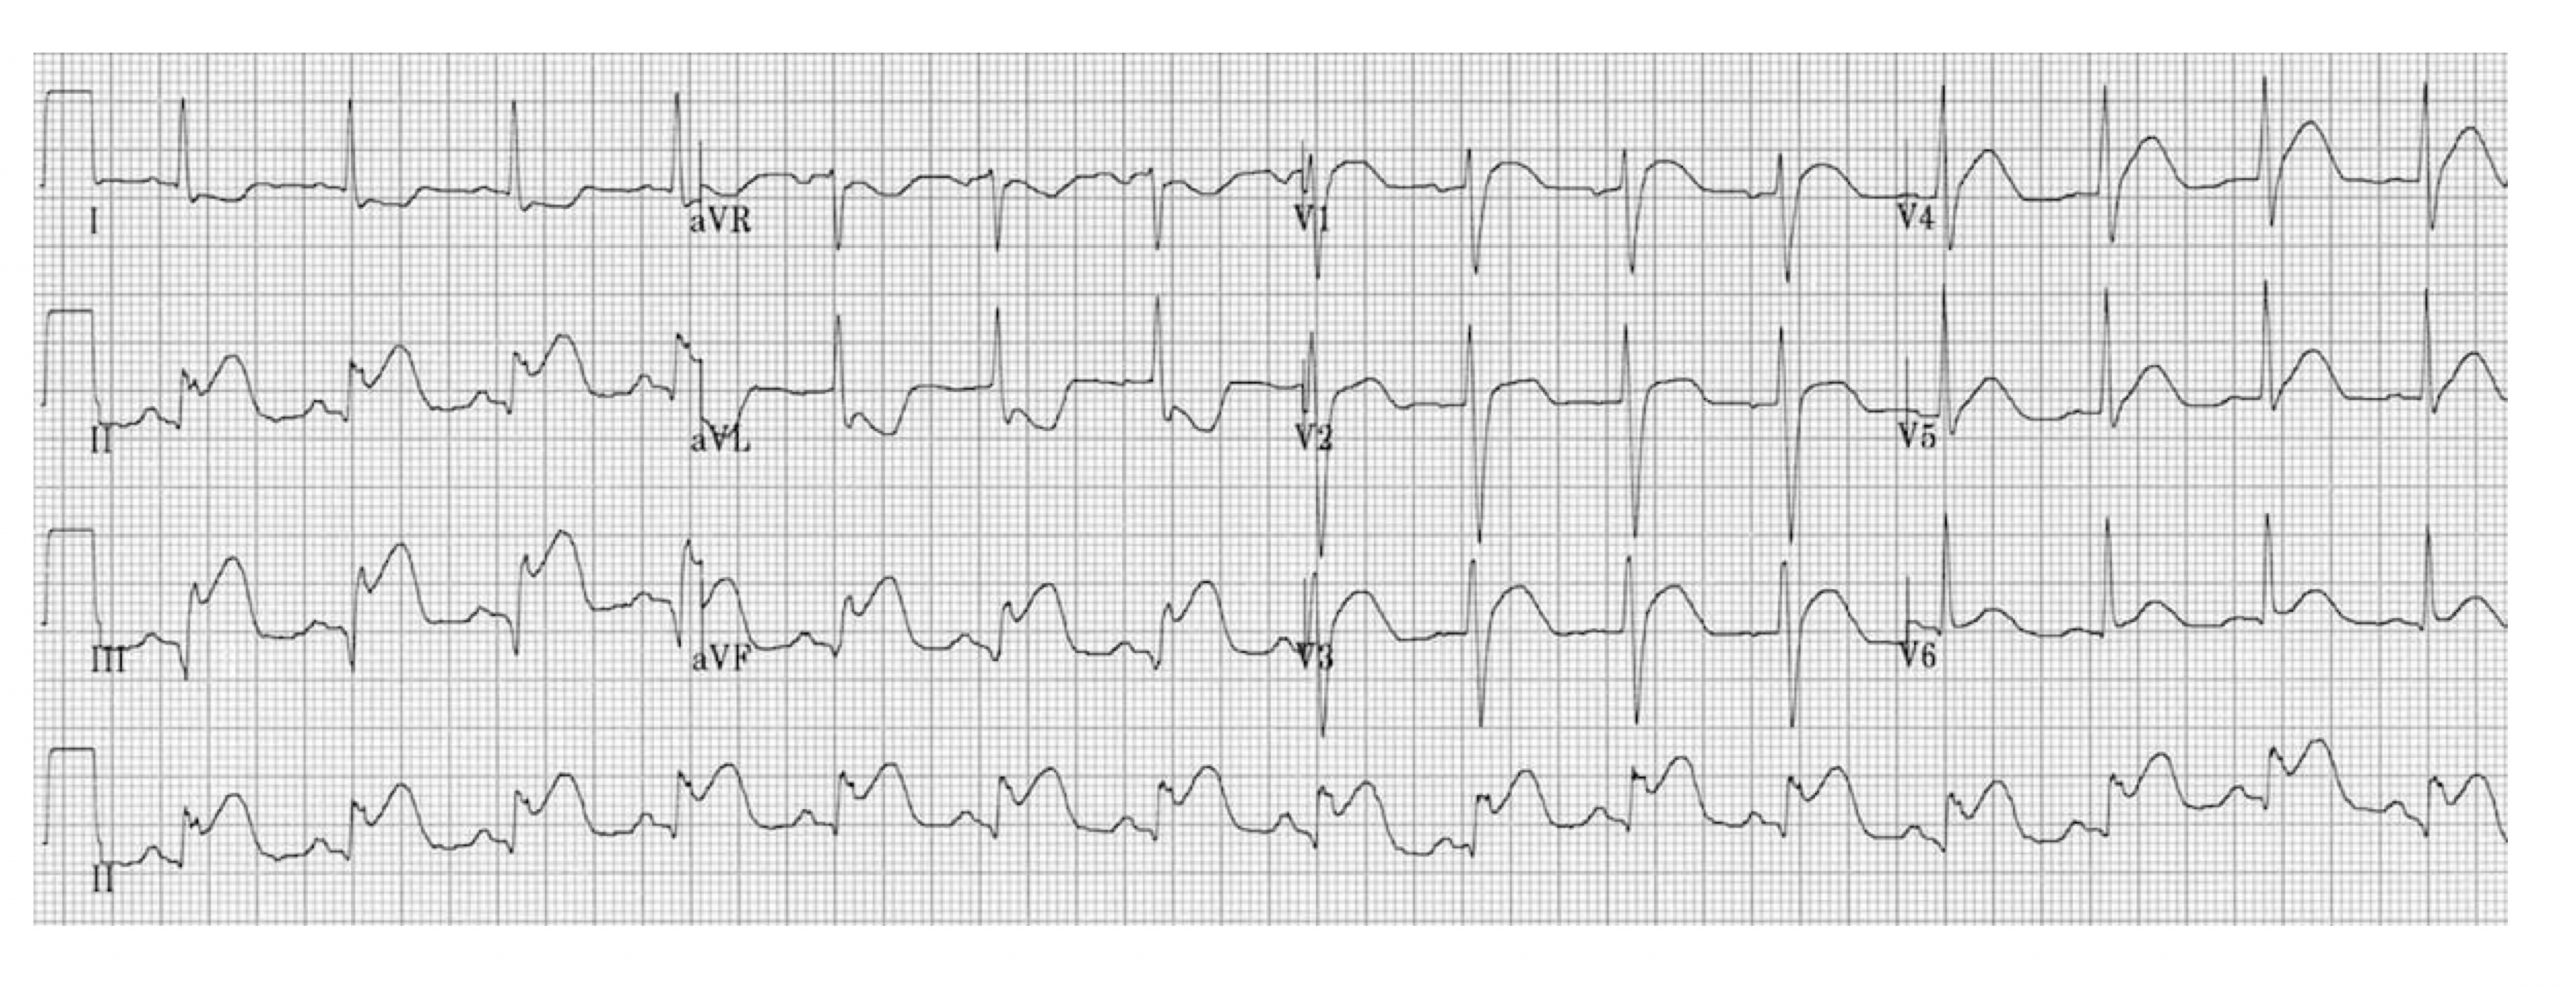
Anterior wall myocardial infarctions (AWMI)
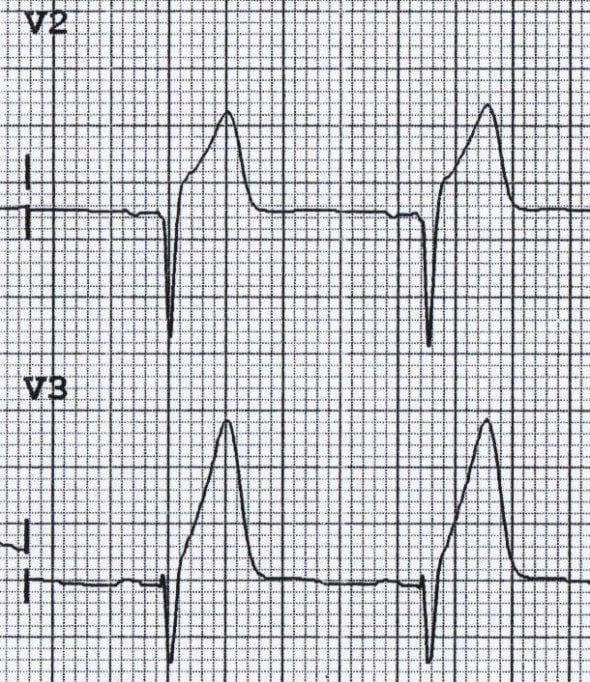
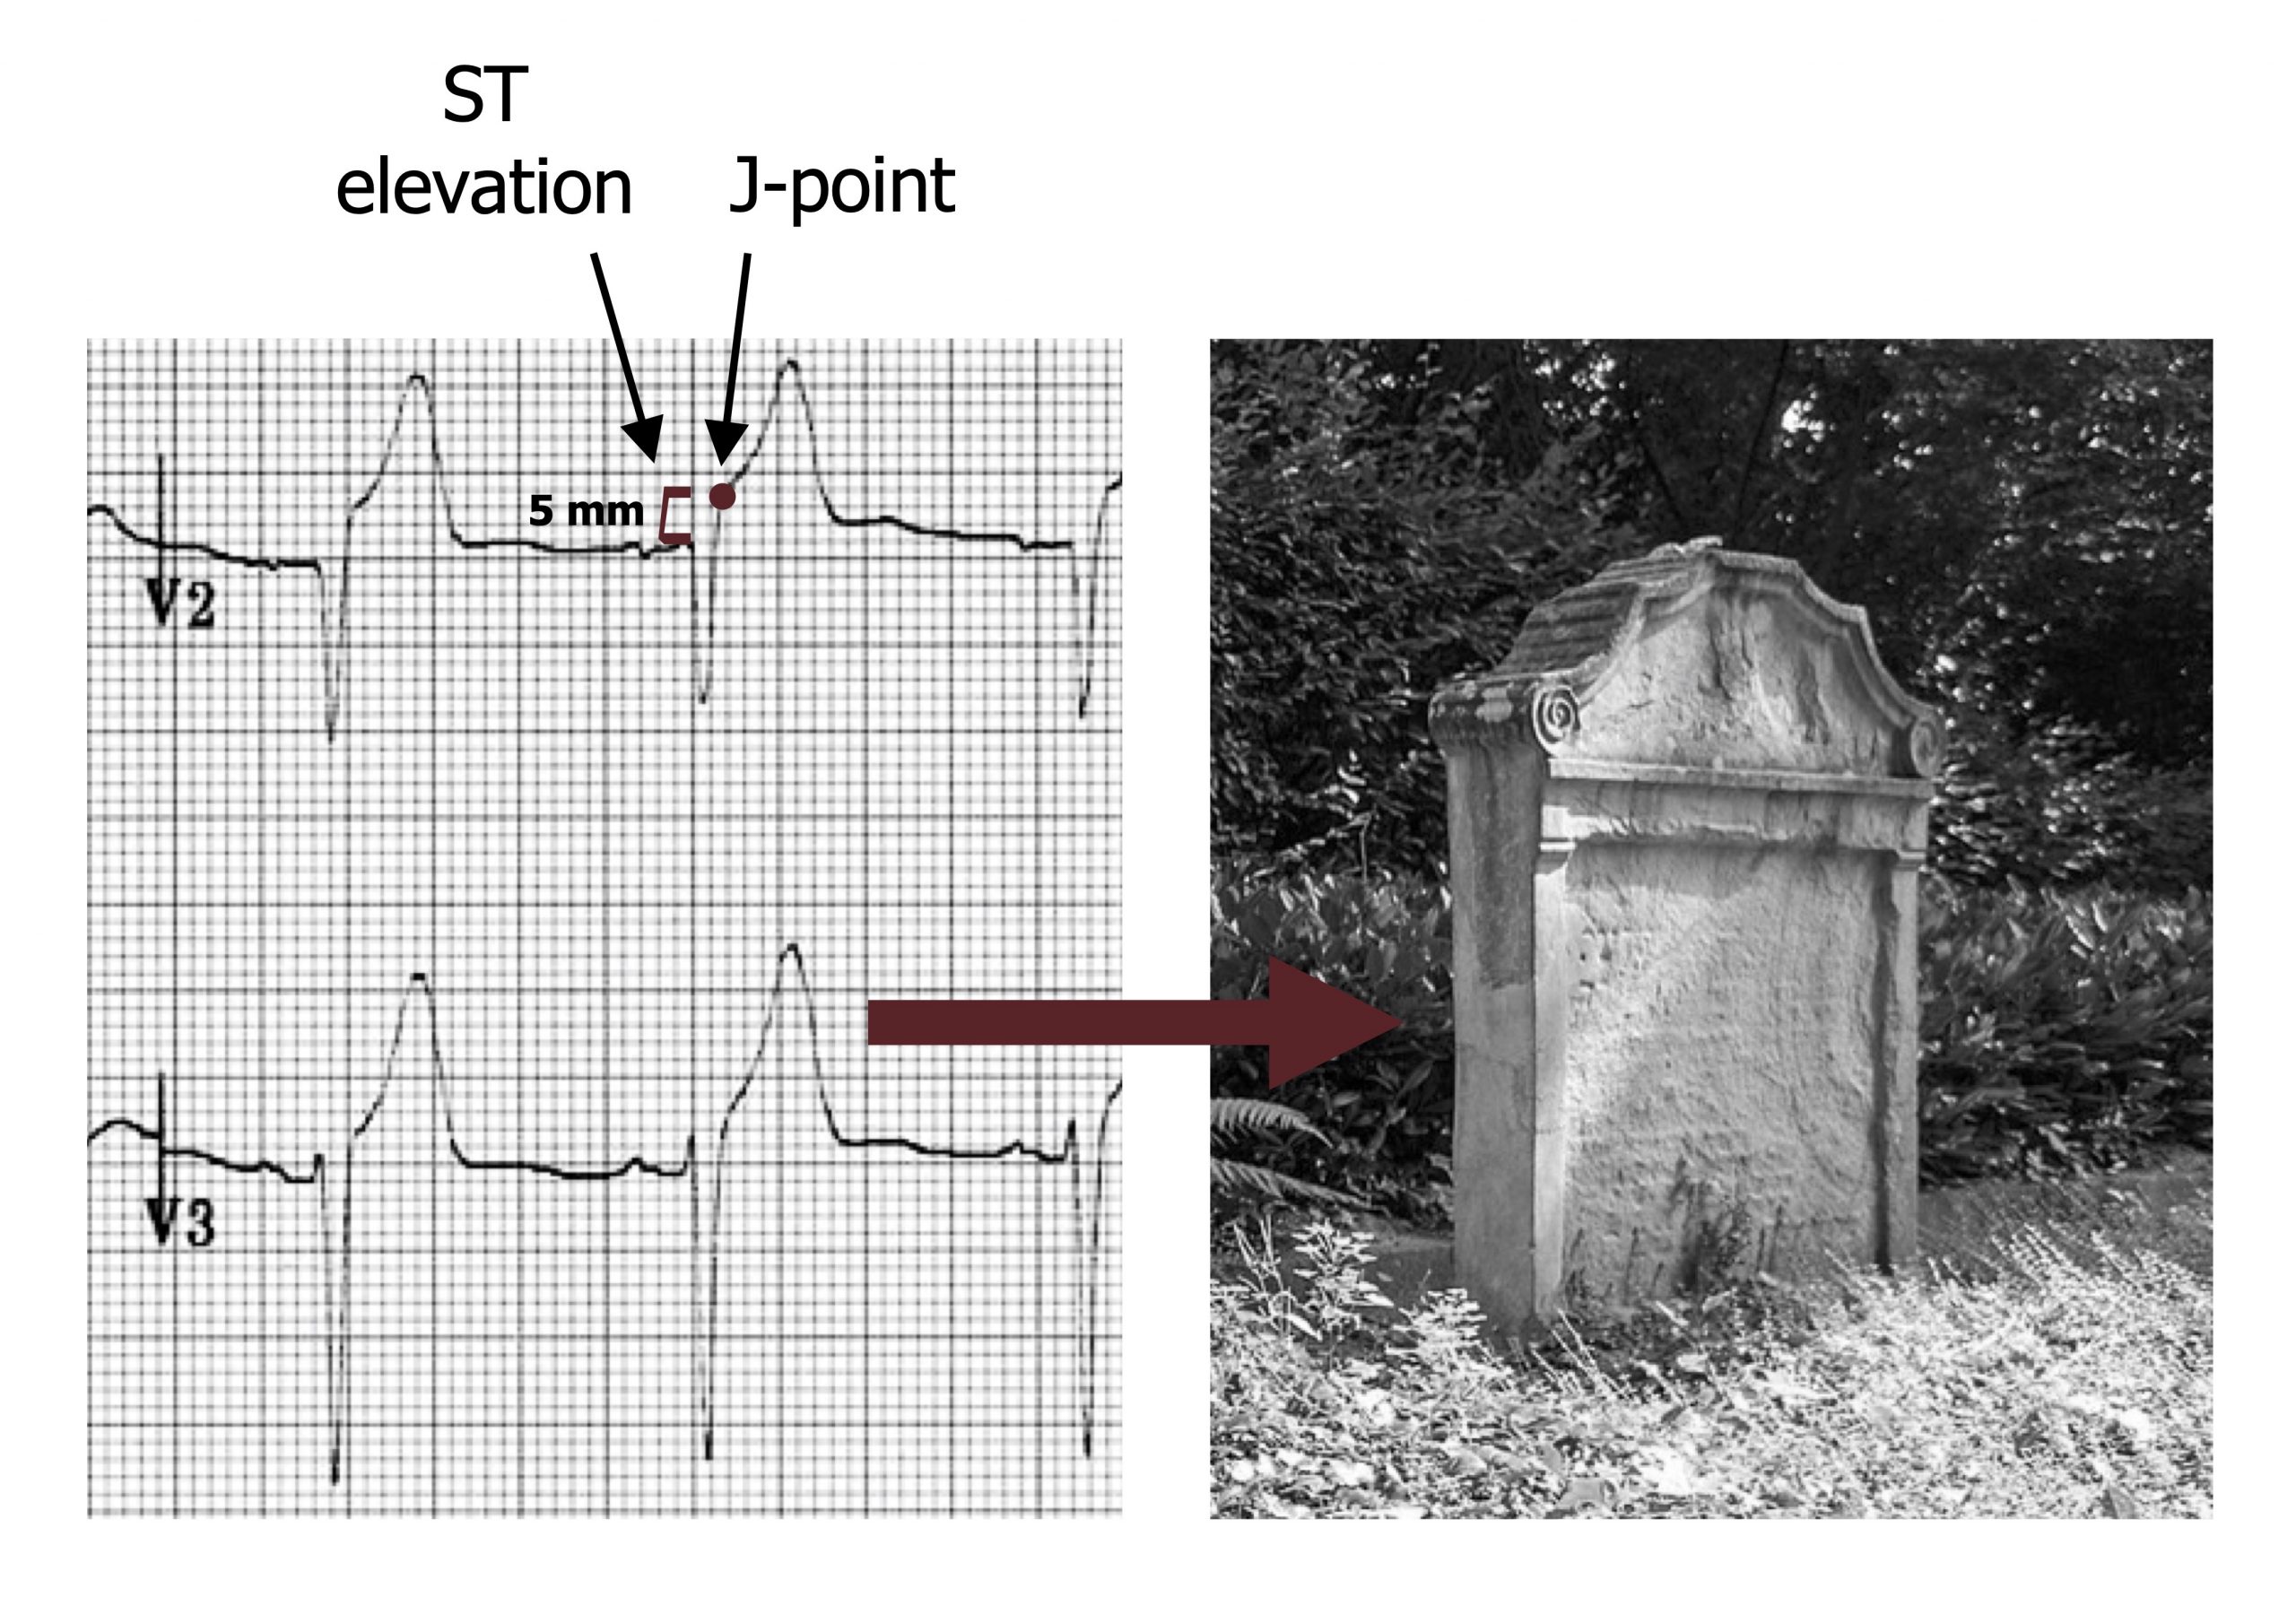
The anterior wall is affected when the left anterior descending coronary artery becomes occluded. Additional involvement of lateral and septal regions is indicative of the left main coronary artery being involved. Inclusion of these regions is termed an extensive anterior infarction. The ECG shows ST segment elevation in leads V3 and V4 (the anterior leads), seen as a raised J-point (see figure 7.7). A reciprocal ST depression will be seen in leads II, III, and aVF (the inferior leads). If the extent of the infarction is large, the elevated ST segment may been seen in the lateral and septal leads. The elevated ST segment is also associated in a change in shape of the T-wave as it becomes broader and loses its concave shape on the downward section. This broad T-wave can be higher as well as the ST elevation progresses, and its height can surpass the R-wave. These morphological changes result in a T-wave that looks like a tombstone (see figure 7.7).
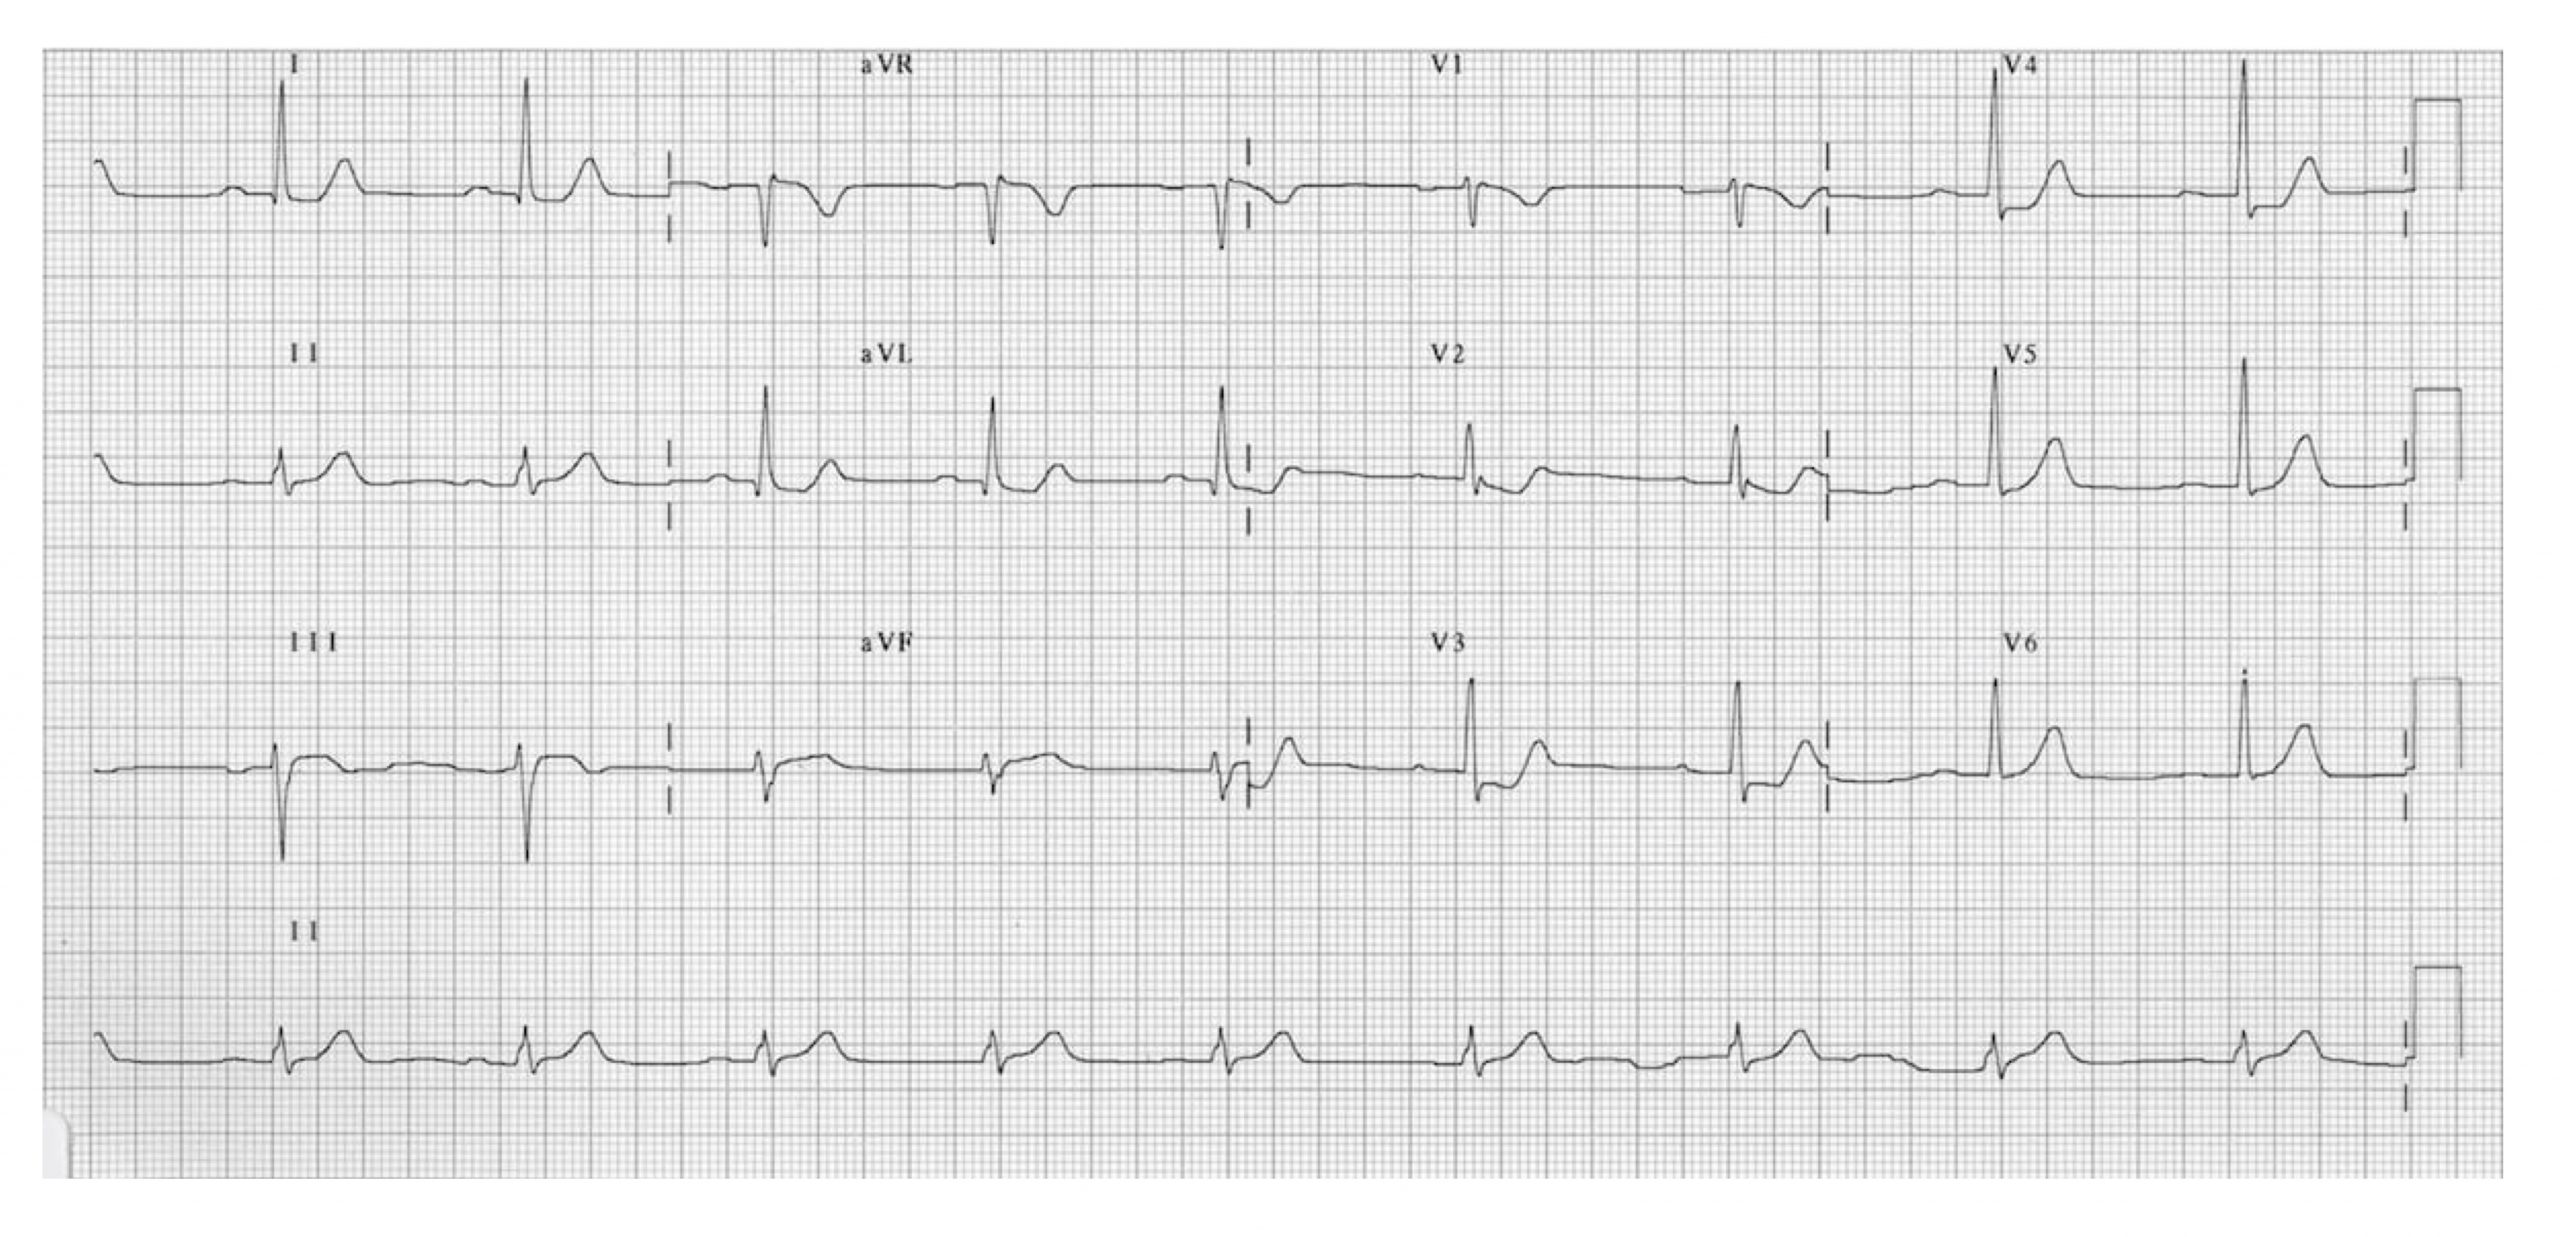
Inferior wall myocardial infarction (IWMI)
Occlusion of the right coronary artery is the usual culprit for an inferior wall myocardial infarction (IWMI), which may be severe enough to extend to posterior regions. The ECG findings of an acute inferior myocardial infarction (figure 7.9) will be an ST segment elevation in leads II, III, and aVF (the inferior leads) and reciprocal depression in lead aVL (a lateral lead); without the reciprocal depression in aVL, alternative causes of ST segment elevation in the inferior leads should be considered (e.g., pericarditis). Because the right coronary artery perfuses the SA node, bradycardia may occur. An inferior MI can have multiple potential complications, including cardiogenic shock, atrioventricular block, or ventricular fibrillation, and can be fatal.
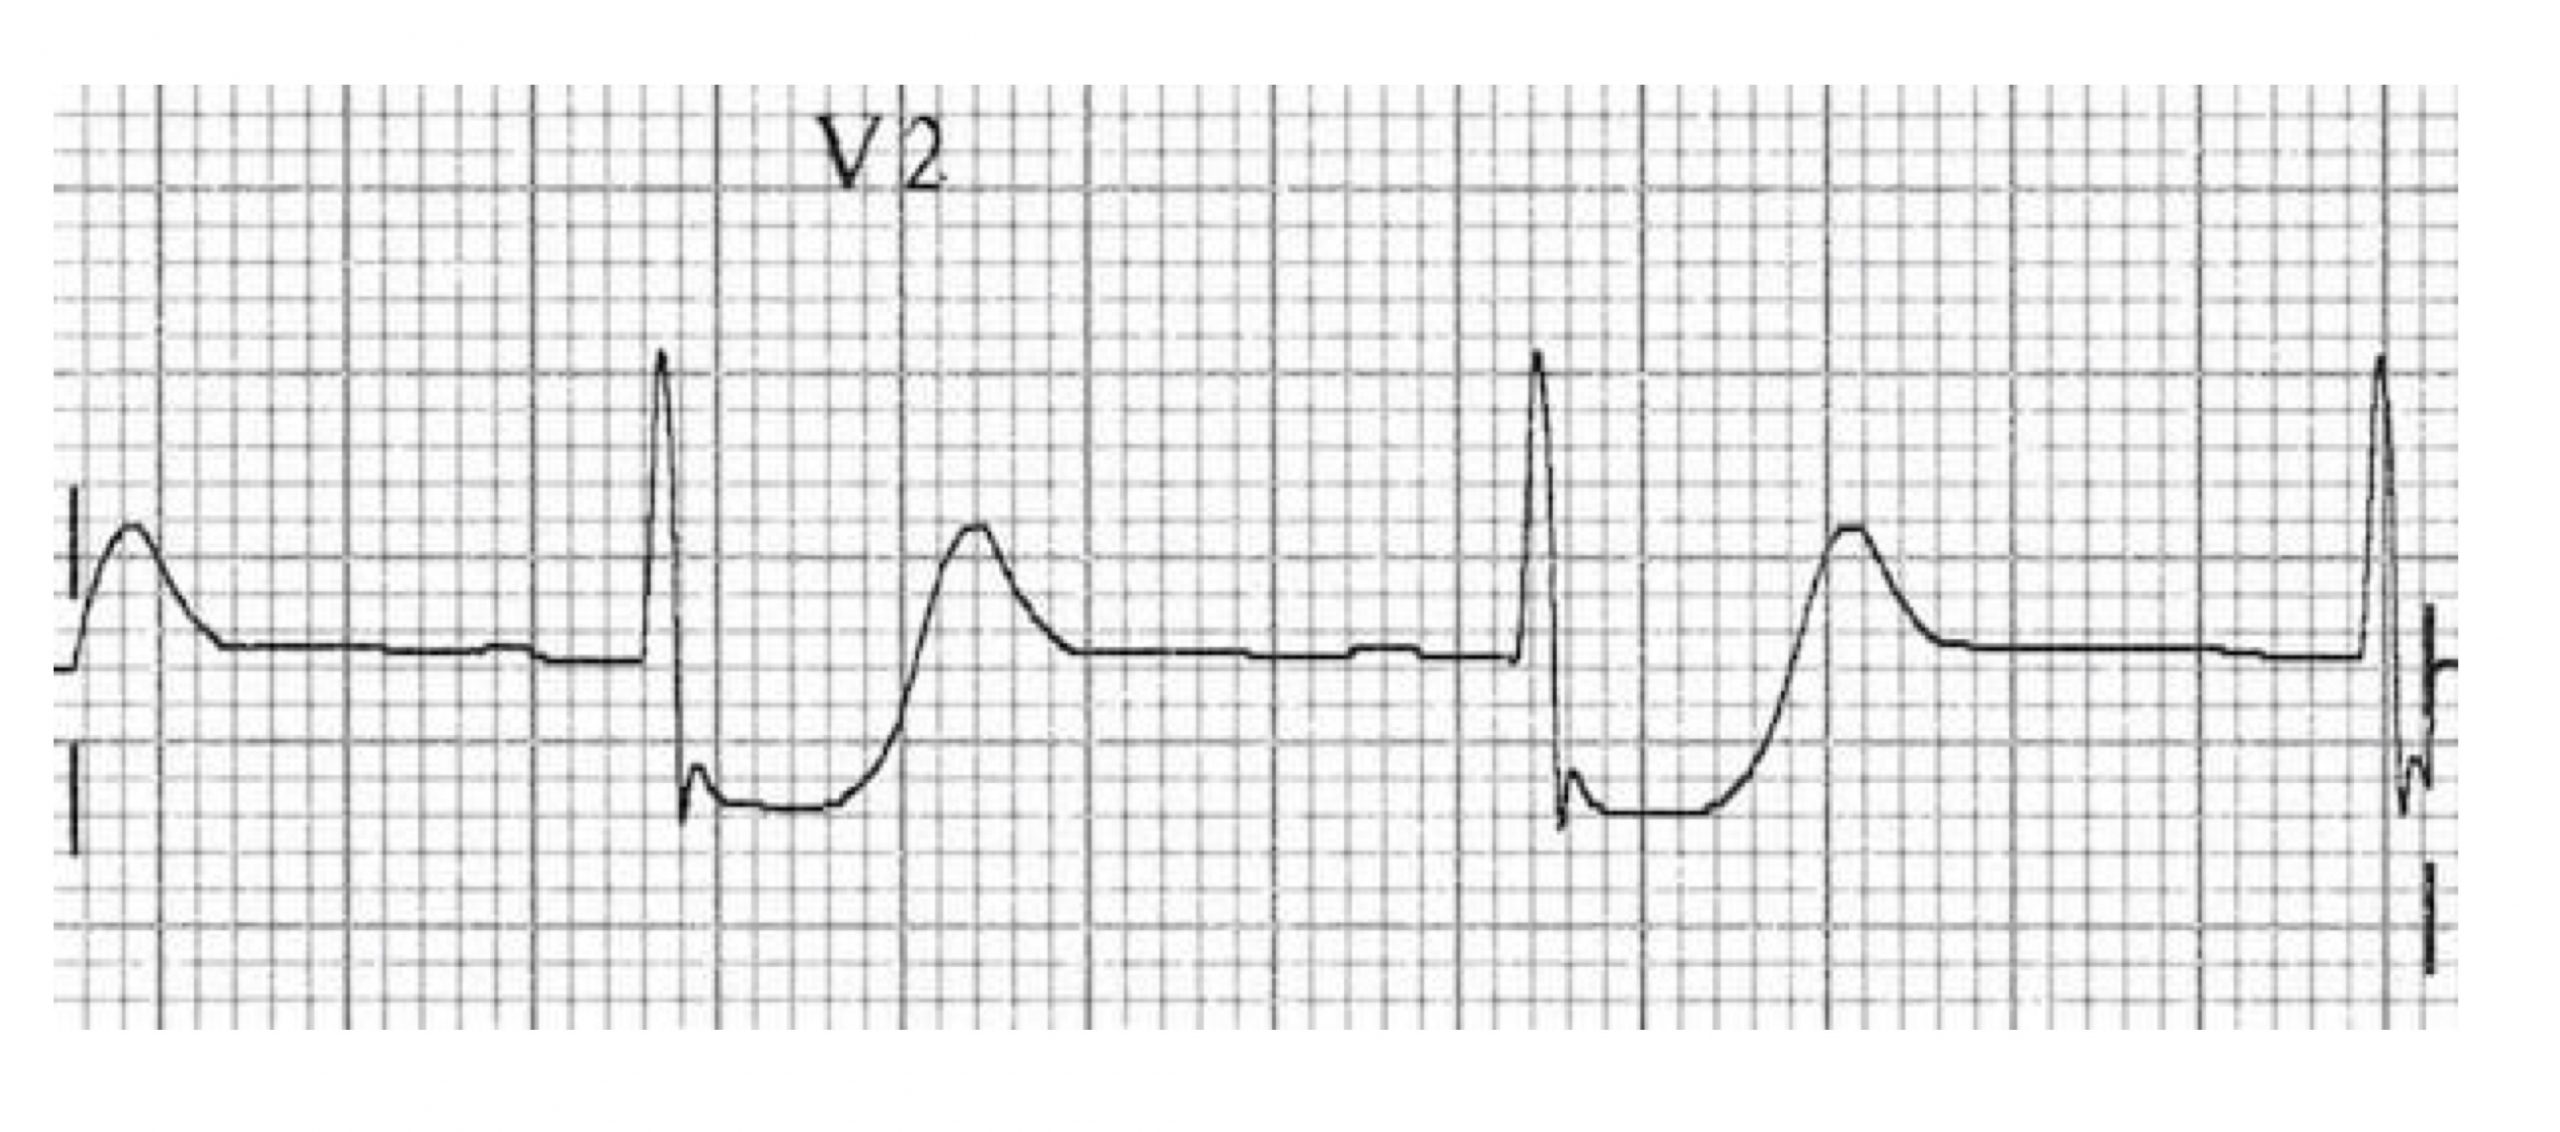
Posterior wall myocardial infarction (PWMI)
Most posterior myocardial infarctions occur with occlusion of the posterior descending artery (which in most people is a branch of the right coronary artery); because of the shared supply, a posterior infarction is often accompanied by an IWMI. The ECG findings include ST segment elevation in V7–V9 (the posterior leads that are placed on the posterior axillary line, not shown in figure 7.11) and ST depression in V1–V4 (the septal and anterior leads, shown in figure 7.10). If an IWMI is also present then there will be an ST elevation in leads II, III, and aVF (the inferior leads). A twelve-lead ECG showing a posterior wall infarction is shown in figure 7.11.
The location of the infarction, leads showing ST elevation and depression, and the involved coronary artery are summarized in table 7.1.
| Infarction | ST Elevation | ST Depression | Coronary artery |
|---|---|---|---|
| Anterior wall | V3 and V4 | II, III, aVF | Left anterior descending |
| Inferior wall | II, III, aVF | aVL | Right |
| Posterior wall | V7-V9 | V1-V4 | Posterior descending |
Table 7.1: Location of the infarction, leads showing ST elevation and depression, and the involved coronary artery.
References, resources, and further reading
Text
Rhee, June-Wha, Sabatine, Marc S., and Leonard S. Lilly. “Ischemic Heart Disease.” In Pathophysiology of Heart Disease: A Collaborative Project of Medical Students and Faculty, 5e, edited by Leonard S. Lilly, Chapter 6. Philadelphia: Lippincott Williams & Wilkins, a Wolters Kluwer Business, 2010.
Rhee, June-Wha, Sabatine, Marc S., and Leonard S. Lilly. “Acute Coronary Syndromes.” In Pathophysiology of Heart Disease: A Collaborative Project of Medical Students and Faculty, 5e, edited by Leonard S. Lilly, Chapter 7. Philadelphia: Lippincott Williams & Wilkins, a Wolters Kluwer Business, 2010.
Surawicz, Borys, Rory Childers, Barbara J. Deal, and Leonard S. Gettes. “AHA/ACCF/HRS Recommendations for the Standardization and Interpretation of the Electrocardiogram.” Circulation 119, no. 10 (2009): e235–e240.
Surawicz, Borys, and Timothy Knilans. Chou’s Electrocardiography in Practice, 6th ed. Philadelphia: Saunders, 2008.
Figures
Figure 7.1: Sequences in progression of atherosclerosis. Grey, Kindred. 2022. CC BY-SA 4.0. Added Npatchett. “Late Complications of Atherosclerosis.” 2015, from WikimediaCommons, CC BY-SA 4.0. https://archive.org/details/7.1_20220113
Figure 7.2: Weakening of an atherosclerotic plaque by T-lymphocytes. Grey, Kindred. 2022. CC BY 4.0. https://archive.org/details/7.3_20220113
Figure 7.3: Timeline of cardiac biomarkers after a myocardial infarction. Grey, Kindred. 2022. CC BY 4.0. https://archive.org/details/7.3_20220113_202201
Figure 7.4: Comparison of audible and inaudible S4 sounds. Grey, Kindred. 2022. CC BY 4.0. https://archive.org/details/7.2_20220113_202201
Figure 7.5: Hyperacute T-waves associated with an early myocardial infarction. Burns, Ed, and Robert Buttner. Prinzmetal Angina Figure, T Wave. Life in the Fast Lane, 2021. https://litfl.com/t-wave-ecg-library/, CC BY-NC-SA 4.0.
Figure 7.6: Which leads look at which coronary vessels? LCx = left circumflex, LAD = left anterior descending, RCA = right coronary. Grey, Kindred. 2022. CC BY-NC-SA 4.0. Added Burns, Ed, and Robert Buttner. Example 1, Anterior Myocardial Infarction. Life in the Fast Lane, 2022. https://litfl.com/anterior-myocardial-infarction-ecg-library, CC BY-NC-SA 4.0. https://archive.org/details/7.6_20220113
Figure 7.7: An ECG showing a anterior wall infarction with the characteristic ‘tombstoning’ of the T-wave. Grey, Kindred. 2022. CC BY-NC-SA 4.0. Added Burns, Ed, and Robert Buttner. Example 1, Anterior Myocardial Infarction. Life in the Fast Lane, 2022. https://litfl.com/anterior-myocardial-infarction-ecg-library, CC BY-NC-SA 4.0. Added Rabich, Dietmar. “Lüdinghausen, Jüdischer Friedhof — 2013 — 2855.” 2013, from WikimediaCommons, CC BY-NC-SA 4.0. https://archive.org/details/7.6_20220113_202201
Figure 7.8: AWMI. Burns, Ed, and Robert Buttner. Example 1, Anterior Myocardial Infarction. Life in the Fast Lane, 2022. https://litfl.com/anterior-myocardial-infarction-ecg-library, CC BY-NC-SA 4.0.
Figure 7.9: IWMI. Buttner, Robert, and Ed Burns. Example 3, Inferior STEMI. Life in the Fast Lane, 2021. https://litfl.com/inferior-stemi-ecg-library, CC BY-NC-SA 4.0.
Figure 7.10: Typical appearance of posterior infarction in V2. Burns, Ed. Typical Appearance of Posterior Infarction in V2 Figure, Posterior Myocardial Infarction. Life in the Fast Lane, 2021. https://litfl.com/posterior-myocardial-infarction-ecg-library, CC BY-NC-SA 4.0.
Figure 7.11: Posteror wall MI. Burns, Ed. Example 2a, Posterior Myocardial Infarction. Life in the Fast Lane, 2021. https://litfl.com/posterior-myocardial-infarction-ecg-library, CC BY-NC-SA 4.0.
