2 Heart Failure
Learning Objectives
- Define systolic and diastolic heart failure.
- Define heart failure with reduced and preserved ejection fraction.
- Define the compensatory mechanisms activated during heart failure as beneficial or maladaptive.
- Describe the morphological and histological changes to the myocardium in response to heart failure.
While there are numerous pathological causes of heart failure (examples in table 2.1), let us look at how three basic forms of cardiac dysfunction can contribute to impaired cardiac output and congestion. The failing heart may have:
- Impaired contractility: A decline in contractility is perhaps easiest to visualize; the pumping action of the heart is ineffective/reduced, and blood cannot be cleared from the chambers.
- An overwhelming afterload: An increased afterload causes the heart to have to work harder to eject blood, and failure to do so leads to poor ejection fractions and cardiac output.
- Problems with ventricular filling: Impaired ventricular filling during diastole means that the heart has a low preload, but because it cannot pump out what it does not receive, then cardiac output is lower.
For whichever reason the end effect of the failure is a decline in blood flow out of the heart, and consequently congestion on the way in.
| Form of dysfunction | Example causes |
|---|---|
| Impaired contractility | - Myocardial infarction - Coronary atherosclerosis - Severe anemia - Cardiomyopathy - Arrhythmias - Congenital heart disease |
| Increased afterload | - Severe lung disease - Hypertension - Sleep apnea - Valvular disease |
| Impaired ventricular filling/relaxation | - Cardiomyopathy - Arrhythmias - Congenital heart disease - Valvular disease |
Table 2.1: Changes in cardiac function in different disease states.
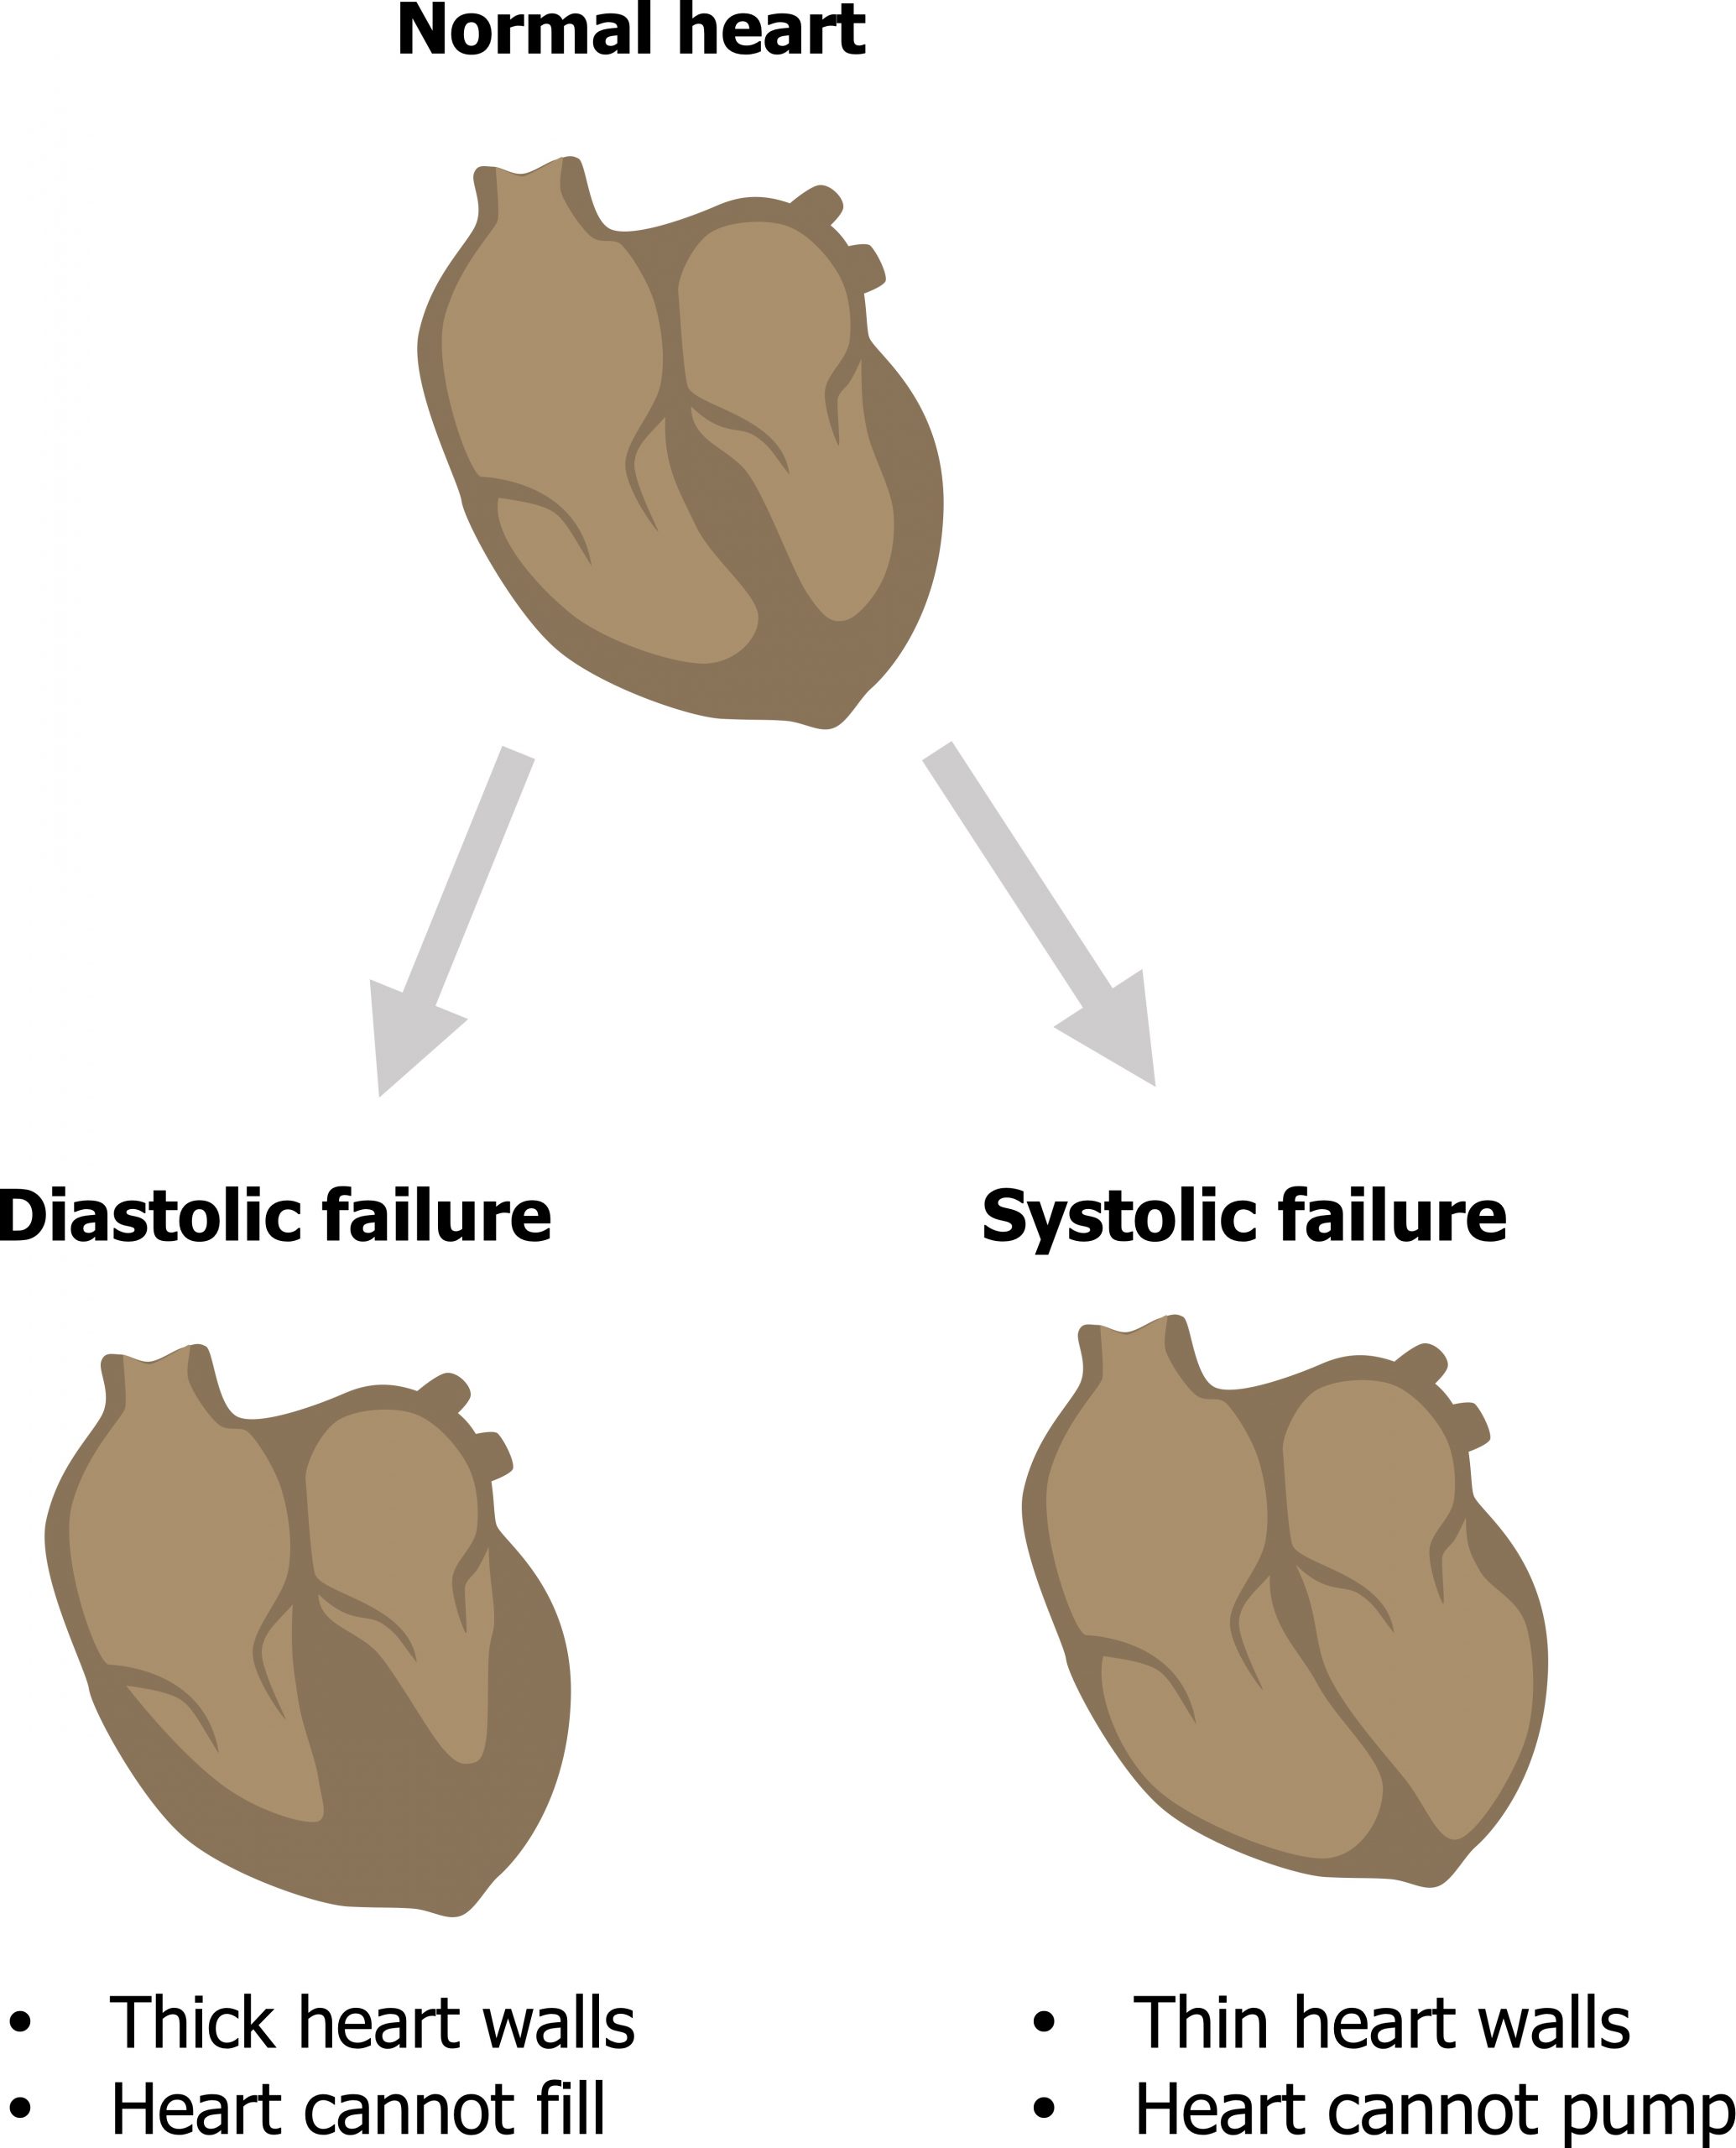
Impediments to emptying the heart during systole (i.e., a reduced contractility or increased afterload) were referred to as systolic heart failure. Similarly, problems with filling the ventricle during diastole were referred to as diastolic heart failure (figure 2.1).
In reality there is a great deal of overlap between these forms of heart failure, and elements of both can be present in the same patient. Similarly, as both forms result in congestion before the heart and reduced flow after it, they are hard to immediately distinguish. Consequently the type and degree of failure is now categorized by the effect on ejection fraction that can help distinguish the source of the problem.
Heart Failure and Ejection Fraction
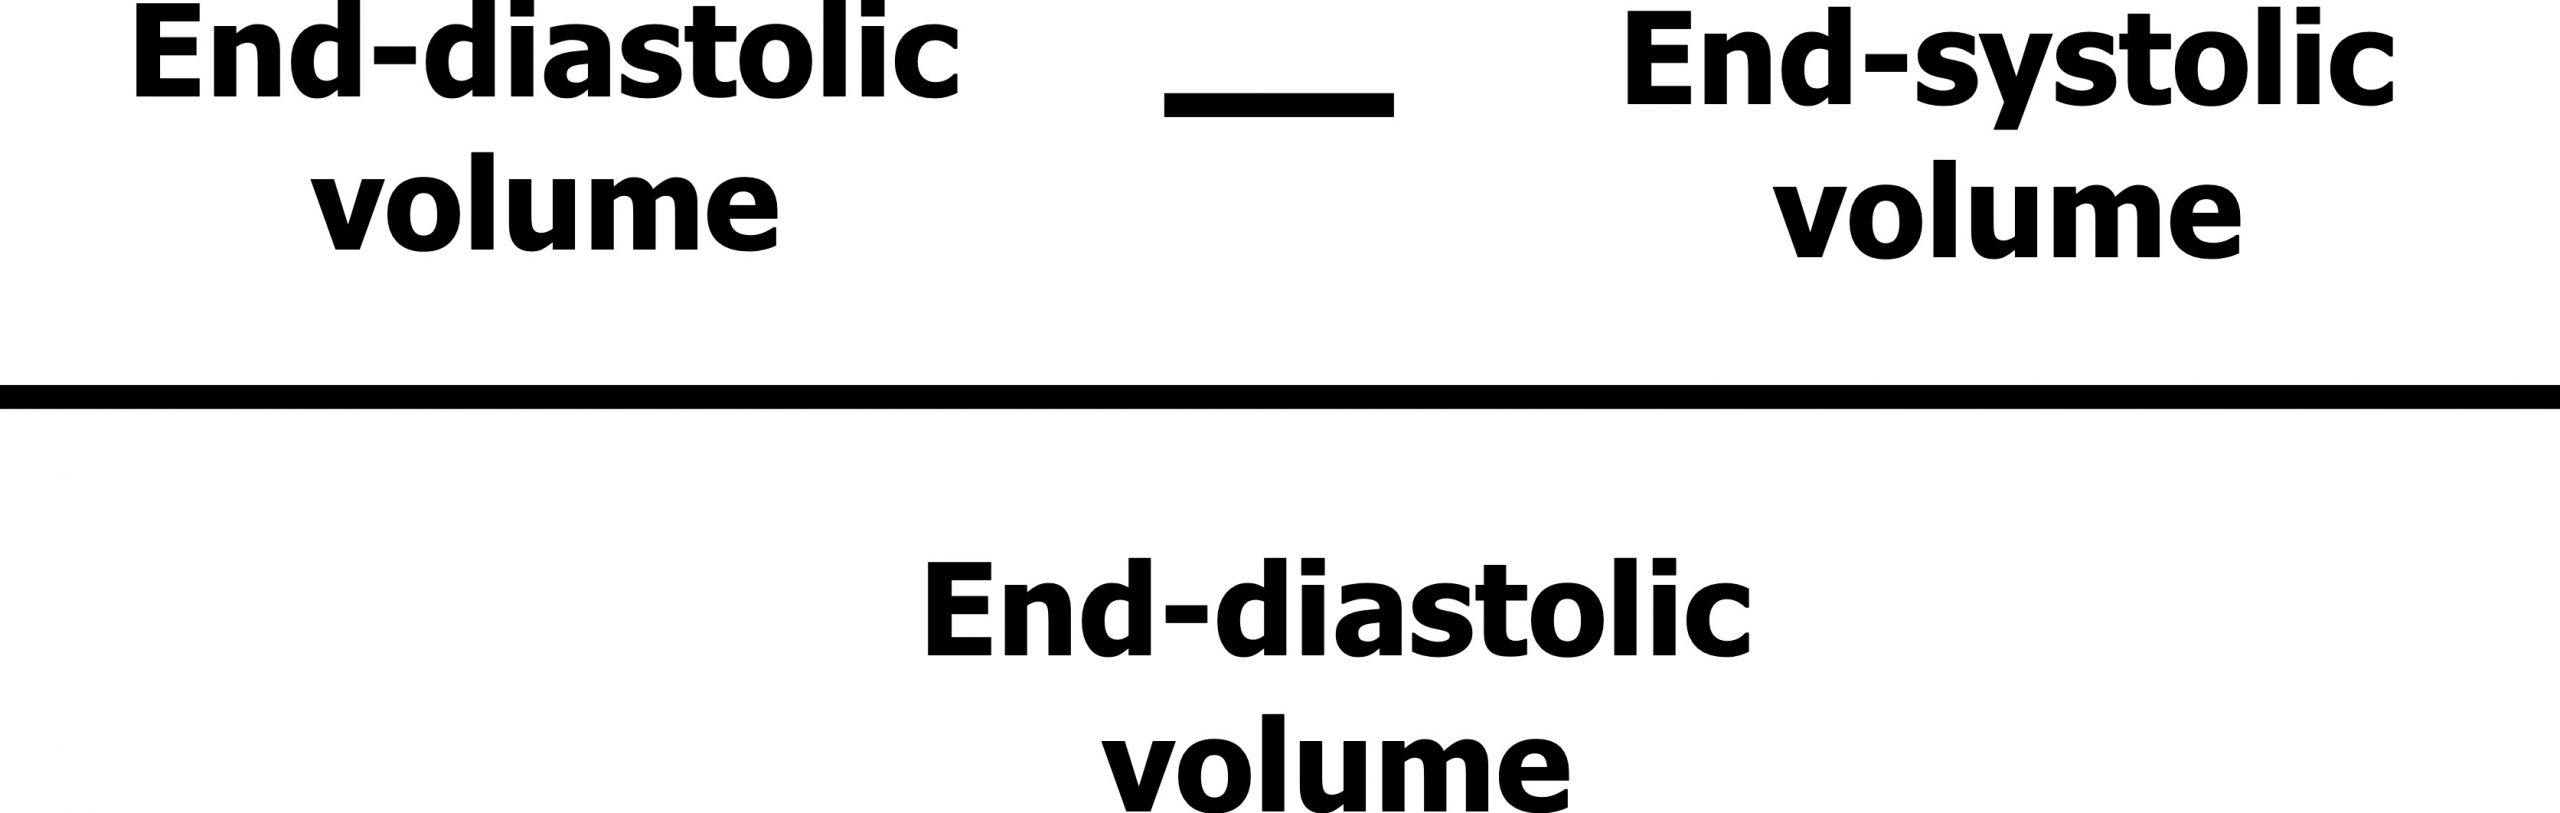
Let us quickly remind ourselves of what ejection fraction is. Ejection fraction is the proportion of blood volume that the left ventricle ejects in one beat. It is mathematically described as the starting volume (i.e., end-diastolic volume, EDV) minus the finishing volume (i.e., end-systolic volume, ESV) as a proportion of the starting volume (figure 2.2)—in simpler terms, what percentage of the ventricular blood volume was pushed out during a contraction.
Ejection Fraction in Systolic Failure
Let us first relate this to systolic failure by looking at what happens when the contractility of the myocardium is reduced. In systolic failure, there is a problem getting blood out of the heart, so the volume of blood coming out of the heart per beat (EDV-ESV) is reduced. However, the end diastolic volume will remain the same, or more likely rise. So our ejection fraction is reduced. Consequently, if you have a reduced ejection fraction you know you have a systolic failure. So to improve diagnosis, systolic failure is now referred to as heart failure with a reduced ejection fraction (HFREF).
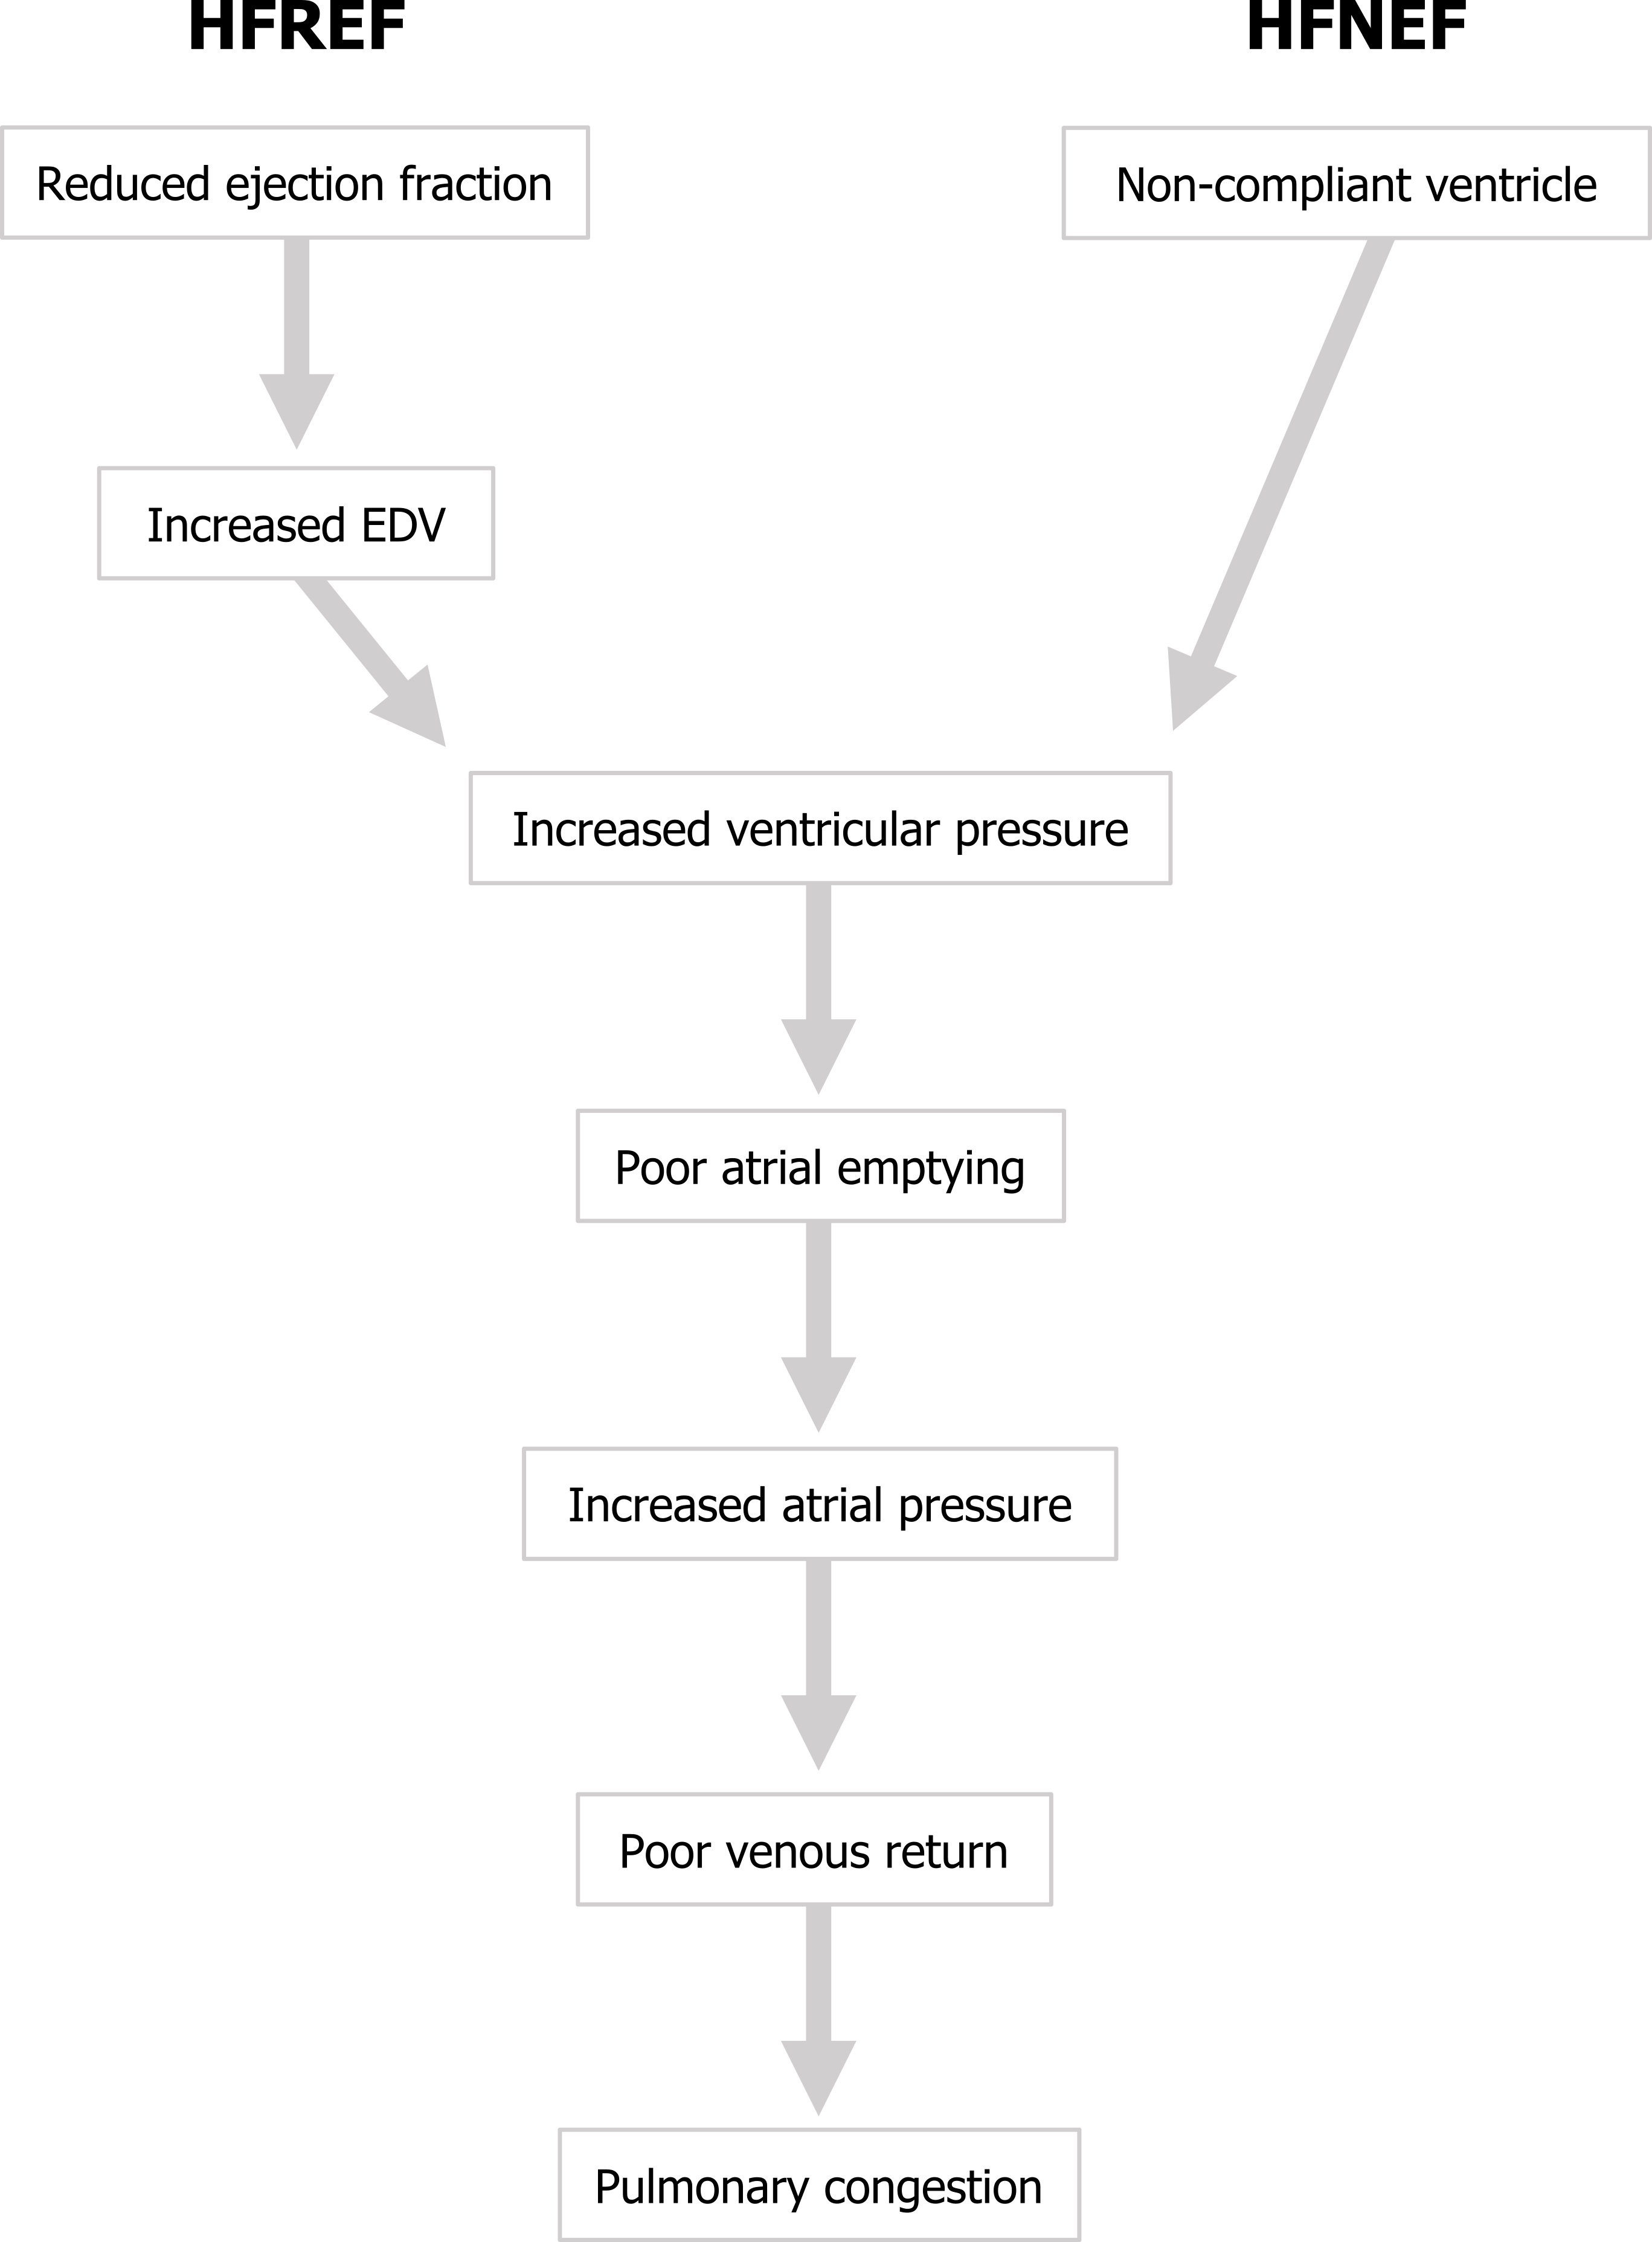
Let us look at the pathophysiological consequences of HFREF. With a poor ejection fraction blood will begin to accumulate in the ventricle, and EDV will begins to rise and consequently so will the ventricular pressure. The raised pressure will impede venous return and promote venous congestion as blood struggles to enter the heart, and in the case of left ventricular failure the congestion will occur first in the left atrium and then in the pulmonary system (figure 2.3).
So systolic failure is referred to as HFREF, but what started as a problem emptying the heart has led to congestion and has produced a problem getting blood into the heart. Let us compare this with diastolic failure.
Ejection Fraction in Diastolic Failure
Remember that in diastolic failure there is a problem relaxing/filling the ventricle. Consequently EDV tends to be lower than normal, and this lower volume of blood in the chamber is relatively easy for the heart to expel. So proportionately, the ejection fraction can be maintained, even if the absolute stroke volume may be low. This is now classified as heart failure with a normal ejection fraction (HFNEF).
The pathophysiological consequences of HFNEF stem from the poor relaxation of the ventricle and/or ability to accept blood. When the ventricle is noncompliant during diastole (i.e., does not relax properly), it does not take much blood volume to enter the chamber before the ventricle pressure begins to rise. This rise in ventricular pressure opposes the entry of more blood, so it accumulates in the atrium. Atrial pressure rises and venous return is impeded, so blood becomes congested in the venous system.
If you compare this sequence of events in HFREF and HFNEF in figure 2.3 the end point is the same—congestion in the venous system, hence the difficulty in distinguishing “systolic” and “diastolic” failure and the need to measure ejection fraction and the newer categories of HFREF and HFNEF. In summary, HFREF starts with a problem getting blood out, that leads to a problem getting blood in, whereas HFNEF starts with a problem getting blood in that leads to a problem getting blood out. Both produce congestion, and both result in a diminished cardiac output.
Acute Responses to Reduced Cardiac Output in Heart Failure: Good or Bad?
Initial responses to the diminished cardiac output include the acute compensatory responses to low blood pressure, myocardial stretch, or changes in renal perfusion. Let us do a quick review.
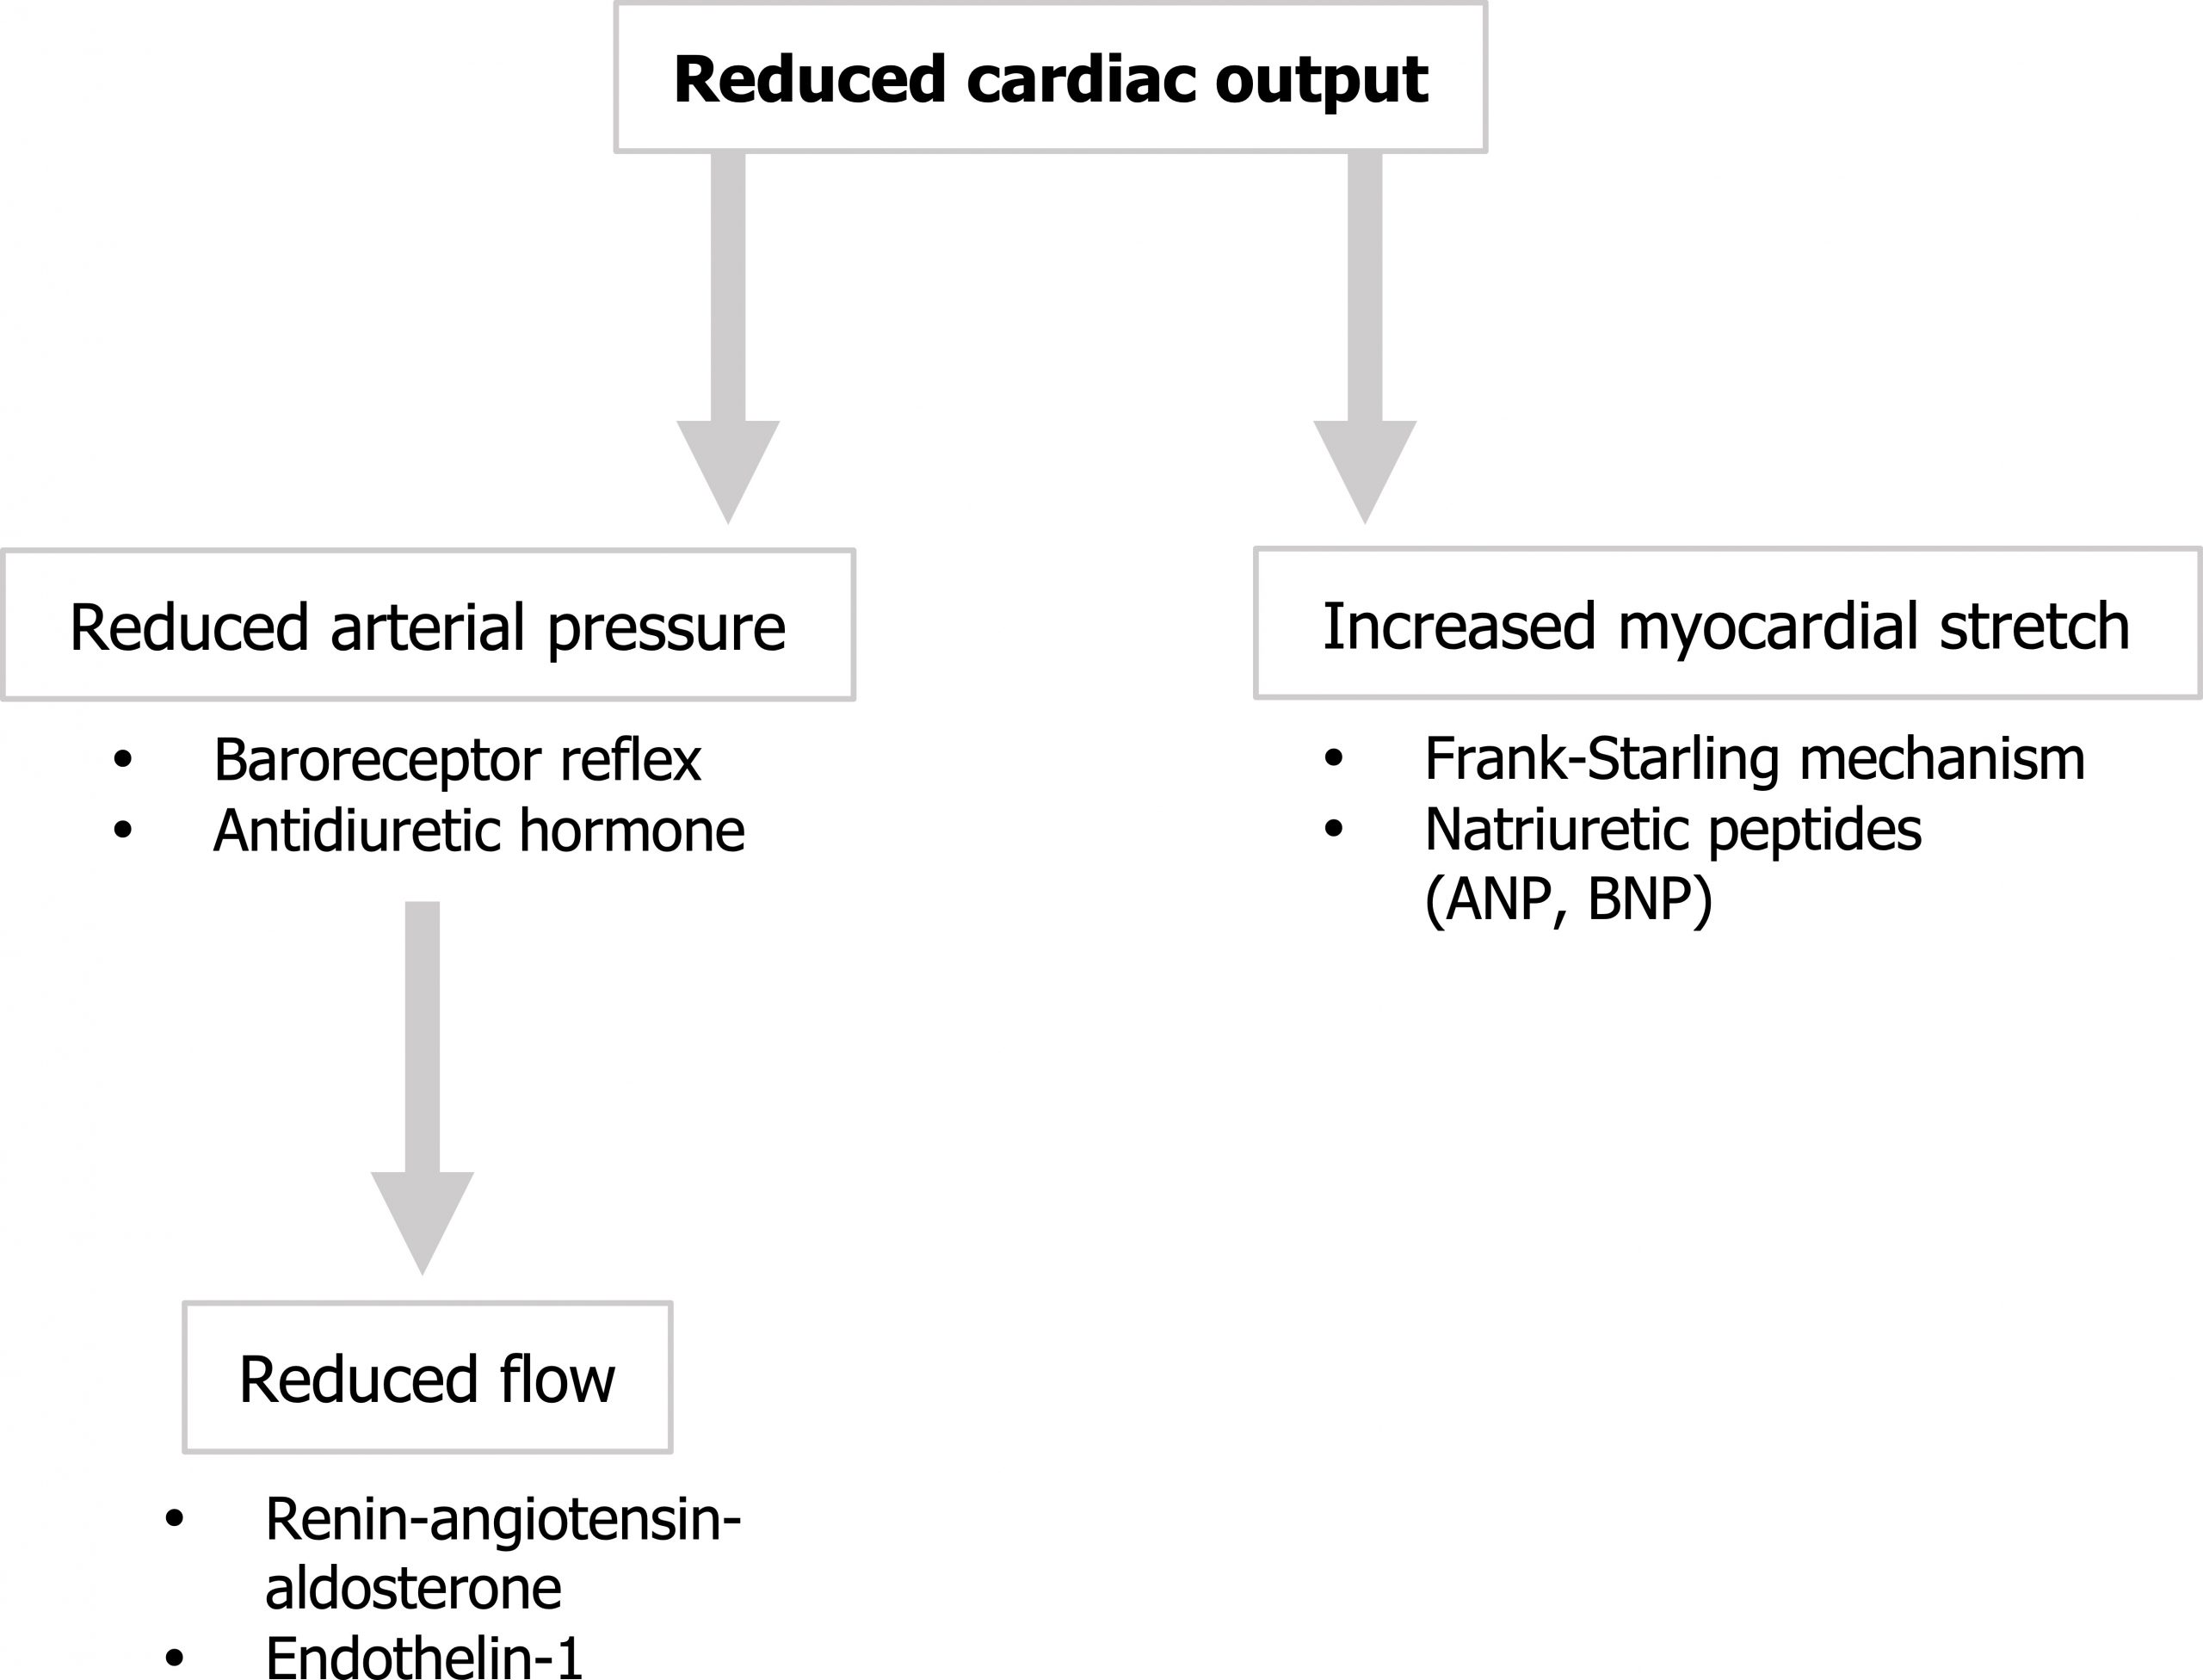
The reduced cardiac output leads to a reduced arterial blood pressure, which, in combination with low volume exiting the heart, results in lower blood flow. With less blood exiting the heart, more remains in the chamber, particularly with systolic failure, so the myocardium is stretched. These three factors (pressure, flow, and myocardial stretch) elicit mechanical, neural, and hormone responses intended to correct the fall in pressure, resume flow, and clear the heart of congestion—but these responses are intended for a normal heart, not one undergoing failure.
First, the extended myocardium elicits the Frank-Starling mechanism to increase contractility, while the release of ANP and BNP induces sodium and fluid loss at the kidney. Conversely, reduced renal blood flow instigates the RAAS system to cause salt and fluid retention and vasoconstriction aided by the release of Endothelin-1 from the endothelium of flow-deprived vessels. Finally, the reduced arterial pressure prompts the baroreceptor reflex that increases sympathetic tone to increase rate and contractility, and antidiuretic hormone causes fluid retention. See the summary in figure 2.4.
These compensatory effects are all attempts to improve cardiac output and blood pressure, but the failing heart is being forced to work harder against an increased afterload and move more volume. Consequently, but for the natriuretic peptides, these responses are maladaptive in the long term, and chronic changes to the heart are instigated.
Chronic Remodeling and Hypertrophy
The long-term structural changes begin with additional wall stress in the failing heart interacting with neurohormonal and cytokine alterations, but the wall stress seems to be an important instigator of hypertrophy and remodeling. Stress can be placed on the chamber walls in two major ways.
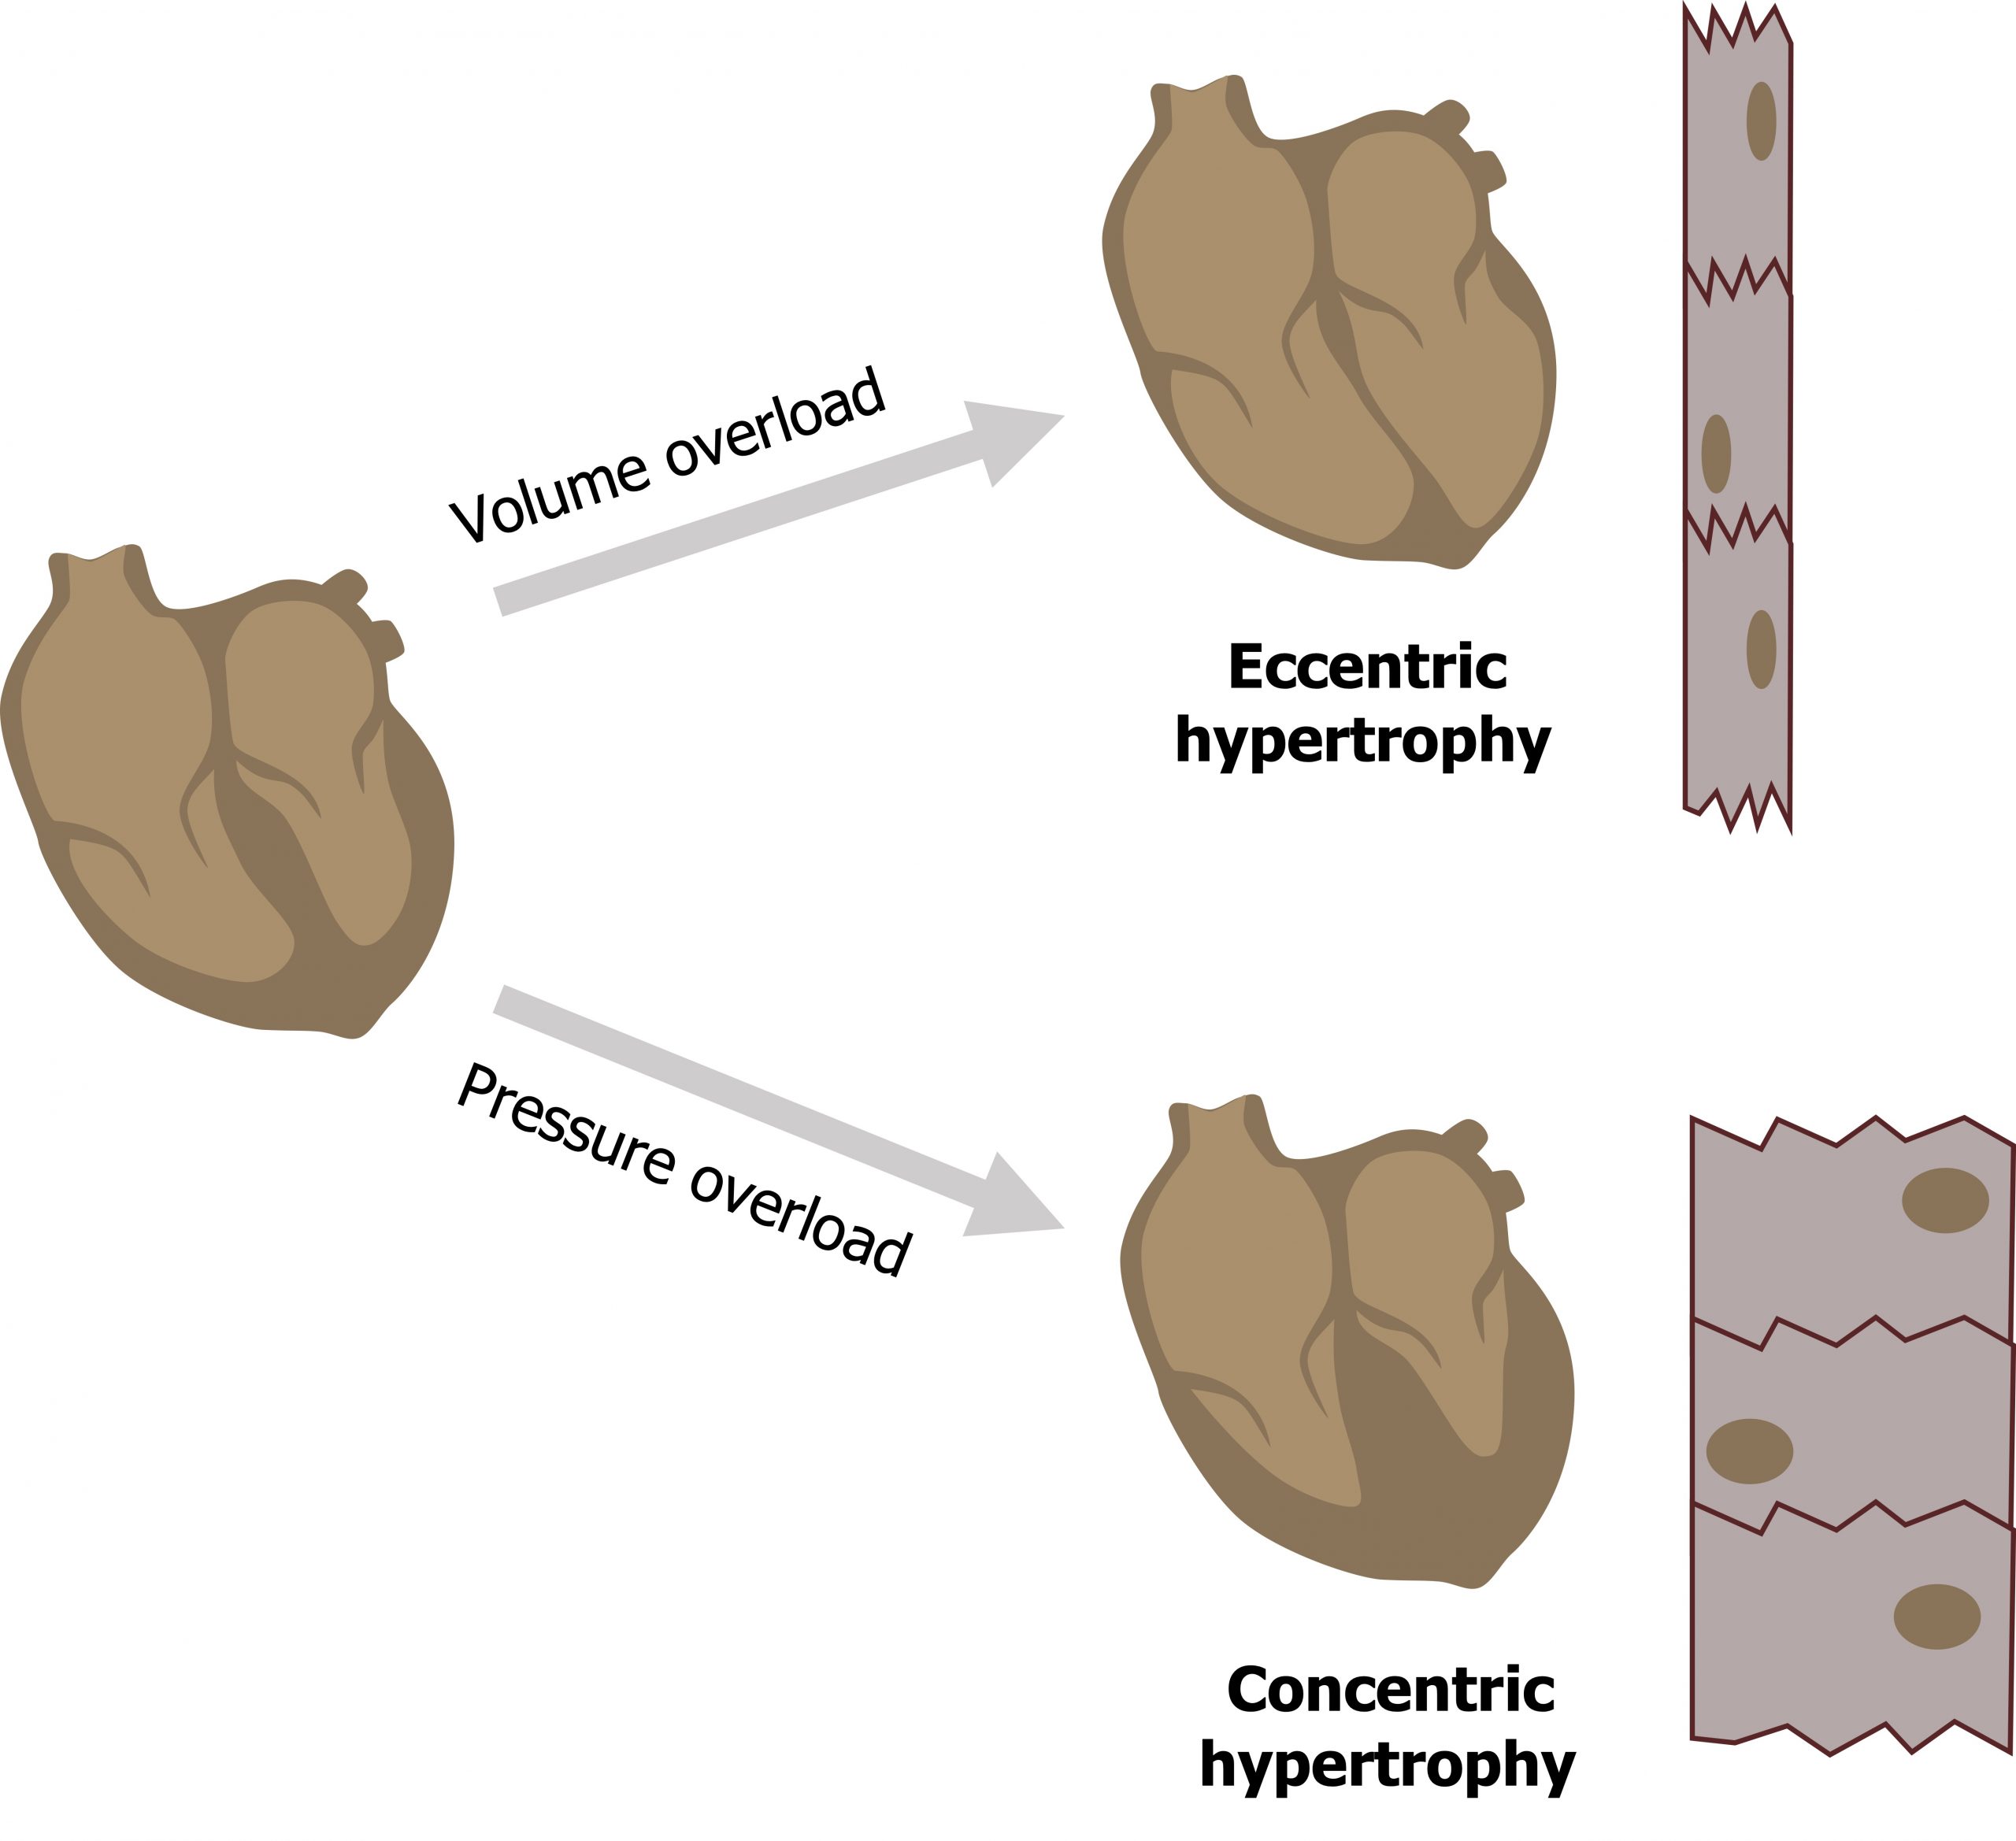
- Volume overload increases preload and consequently the chamber radius. Laplace’s law states that this larger radius means the chamber wall must generate more tension to contain the same chamber pressure.
- Pressure overload creates higher demands to generate greater pressures to overcome an increased afterload. This requires additional wall tension and also leads to hypertrophy.
But the two forms of overload (volume and pressure) lead to different patterns of hypertrophy. In volume overload the myocytes add more sarcomeres in series, so they elongate and contribute to the dilation of the chamber while there is a proportional increase in wall thickness. This is referred to as eccentric hypertrophy (figure 2.5).
Pressure loading, on the other hand, leads to the synthesis of new sarcomeres that are formed in parallel to the old ones, causing an increase in wall thickness without any dilation of the chamber. This is referred to as concentric hypertrophy (figure 2.5).
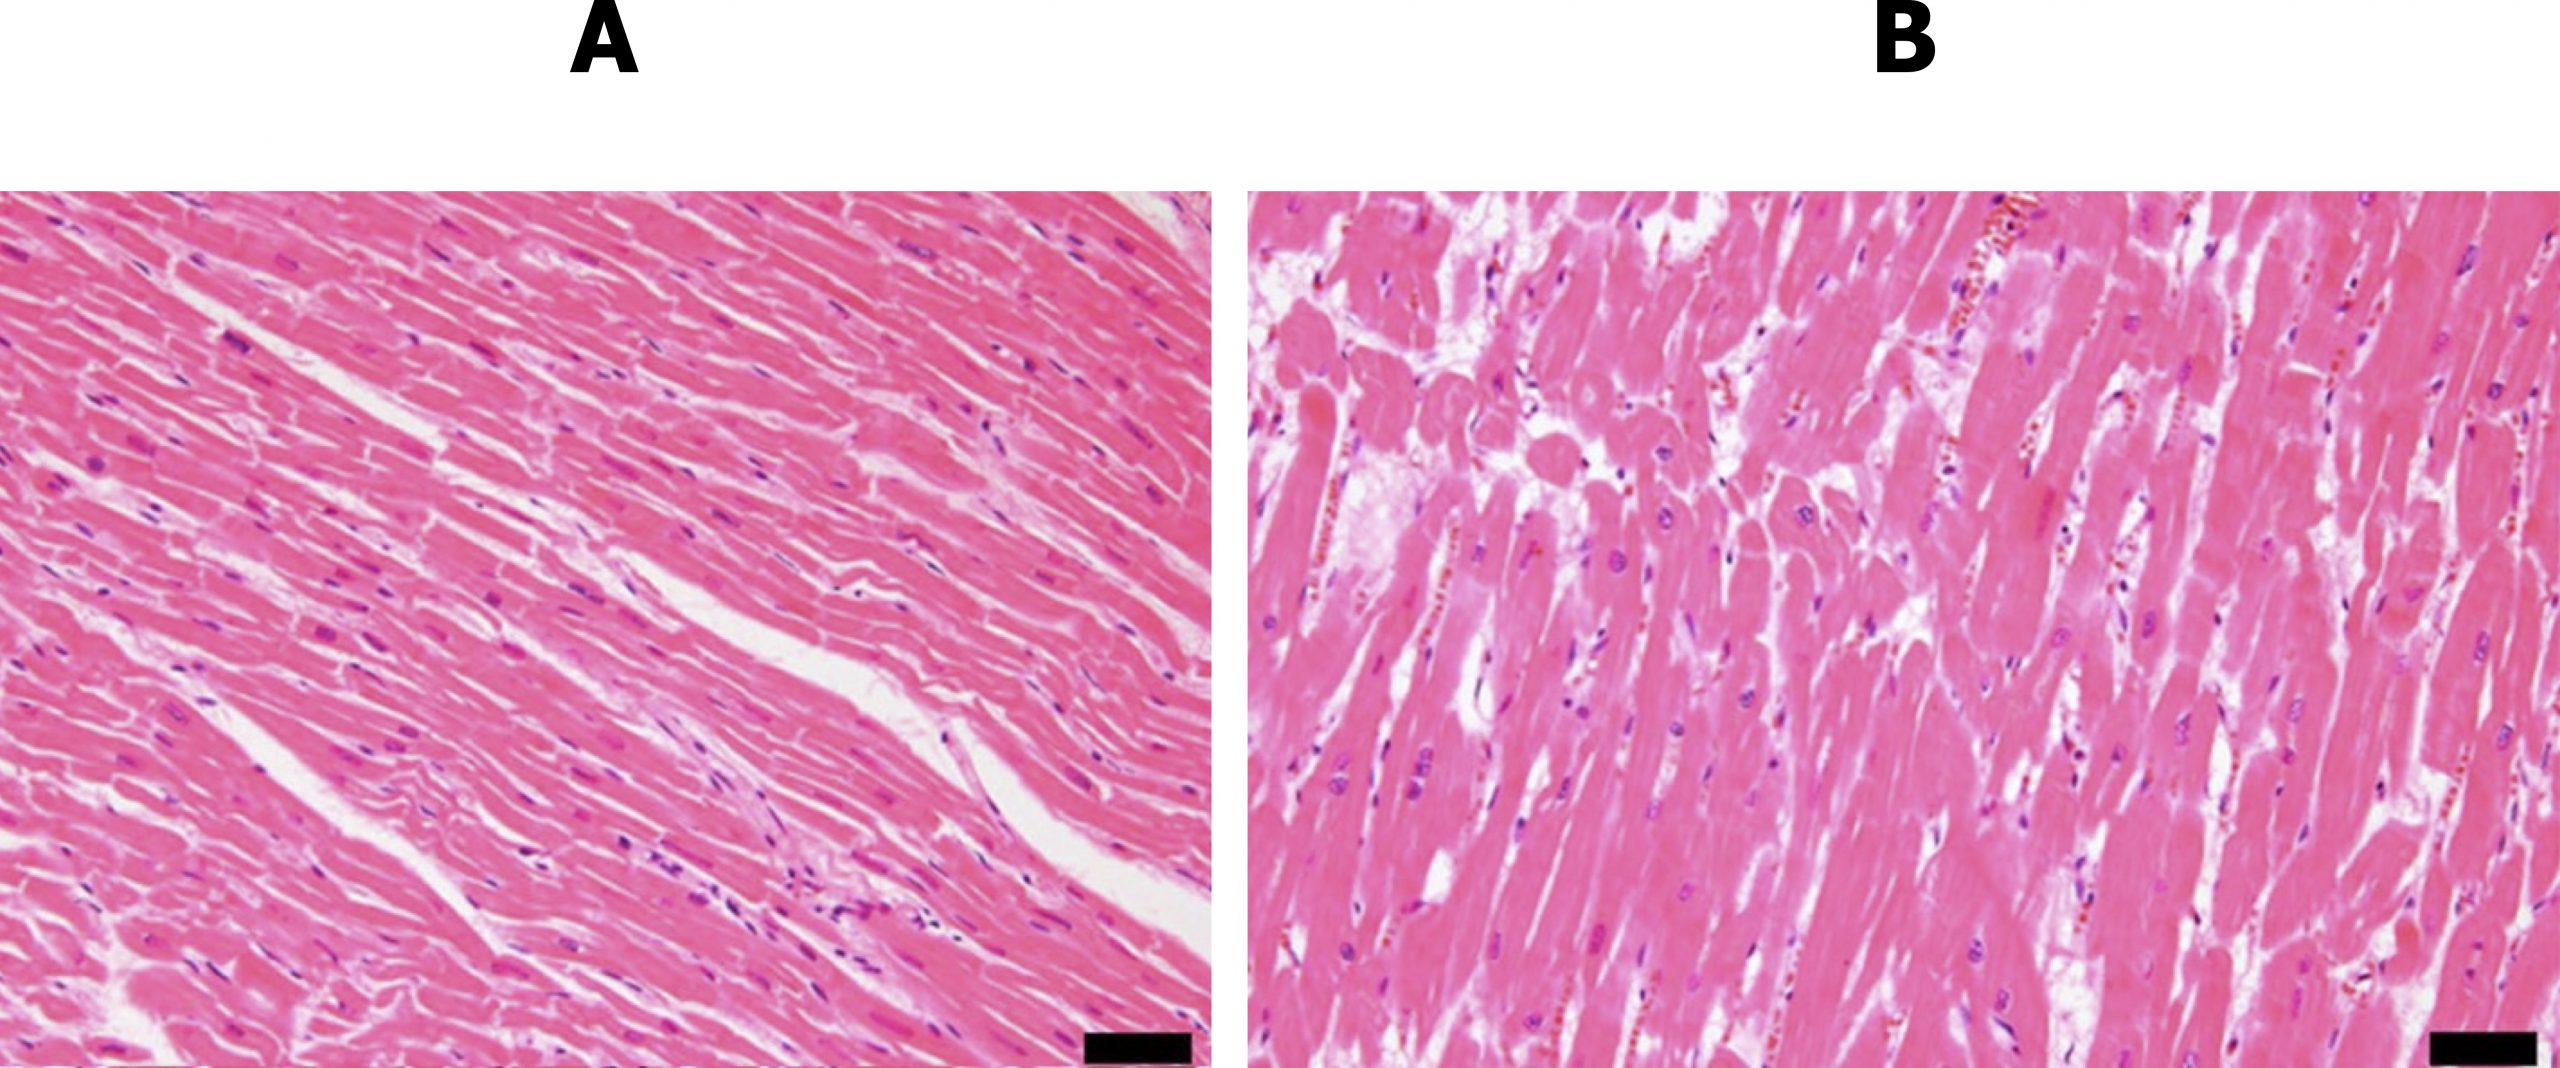
These adaptations are accompanied by increased deposition of connective tissue that may have conductive or contractive ramifications. The difference in myocytic arrangement and presence of connective tissue is clear in the histological views of normal myocardium and myocardium chronically exposed to valvular disease in figure 2.6.
Myocytes may also be lost through either apoptosis or necrosis. As hypertrophy occurs the blood supply to the thickening wall becomes inadequate so infarction and consequent necrosis are more likely. Factors that promote myocyte apoptosis are all present during heart failure and include elevated catecholamines, Angiotensin II, inflammatory cytokines, and wall stress.
These same factors also disrupt gene expression in myocytes and cause intracellular deficits, including loss of Ca++ homeostasis and production of high-energy phosphates. While the mechanisms of these intracellular effects is still being heavily researched, the inability to control calcium or regulate high-energy phosphates obviously has implications of excitation–contraction coupling.
So while hypertrophy may seem a sensible response in the failing heart, the patterns and inflammation and stress-driven changes are eventually maladaptive and lead to a progressive decline in cardiac function.
Clinical Manifestations of Heart Failure
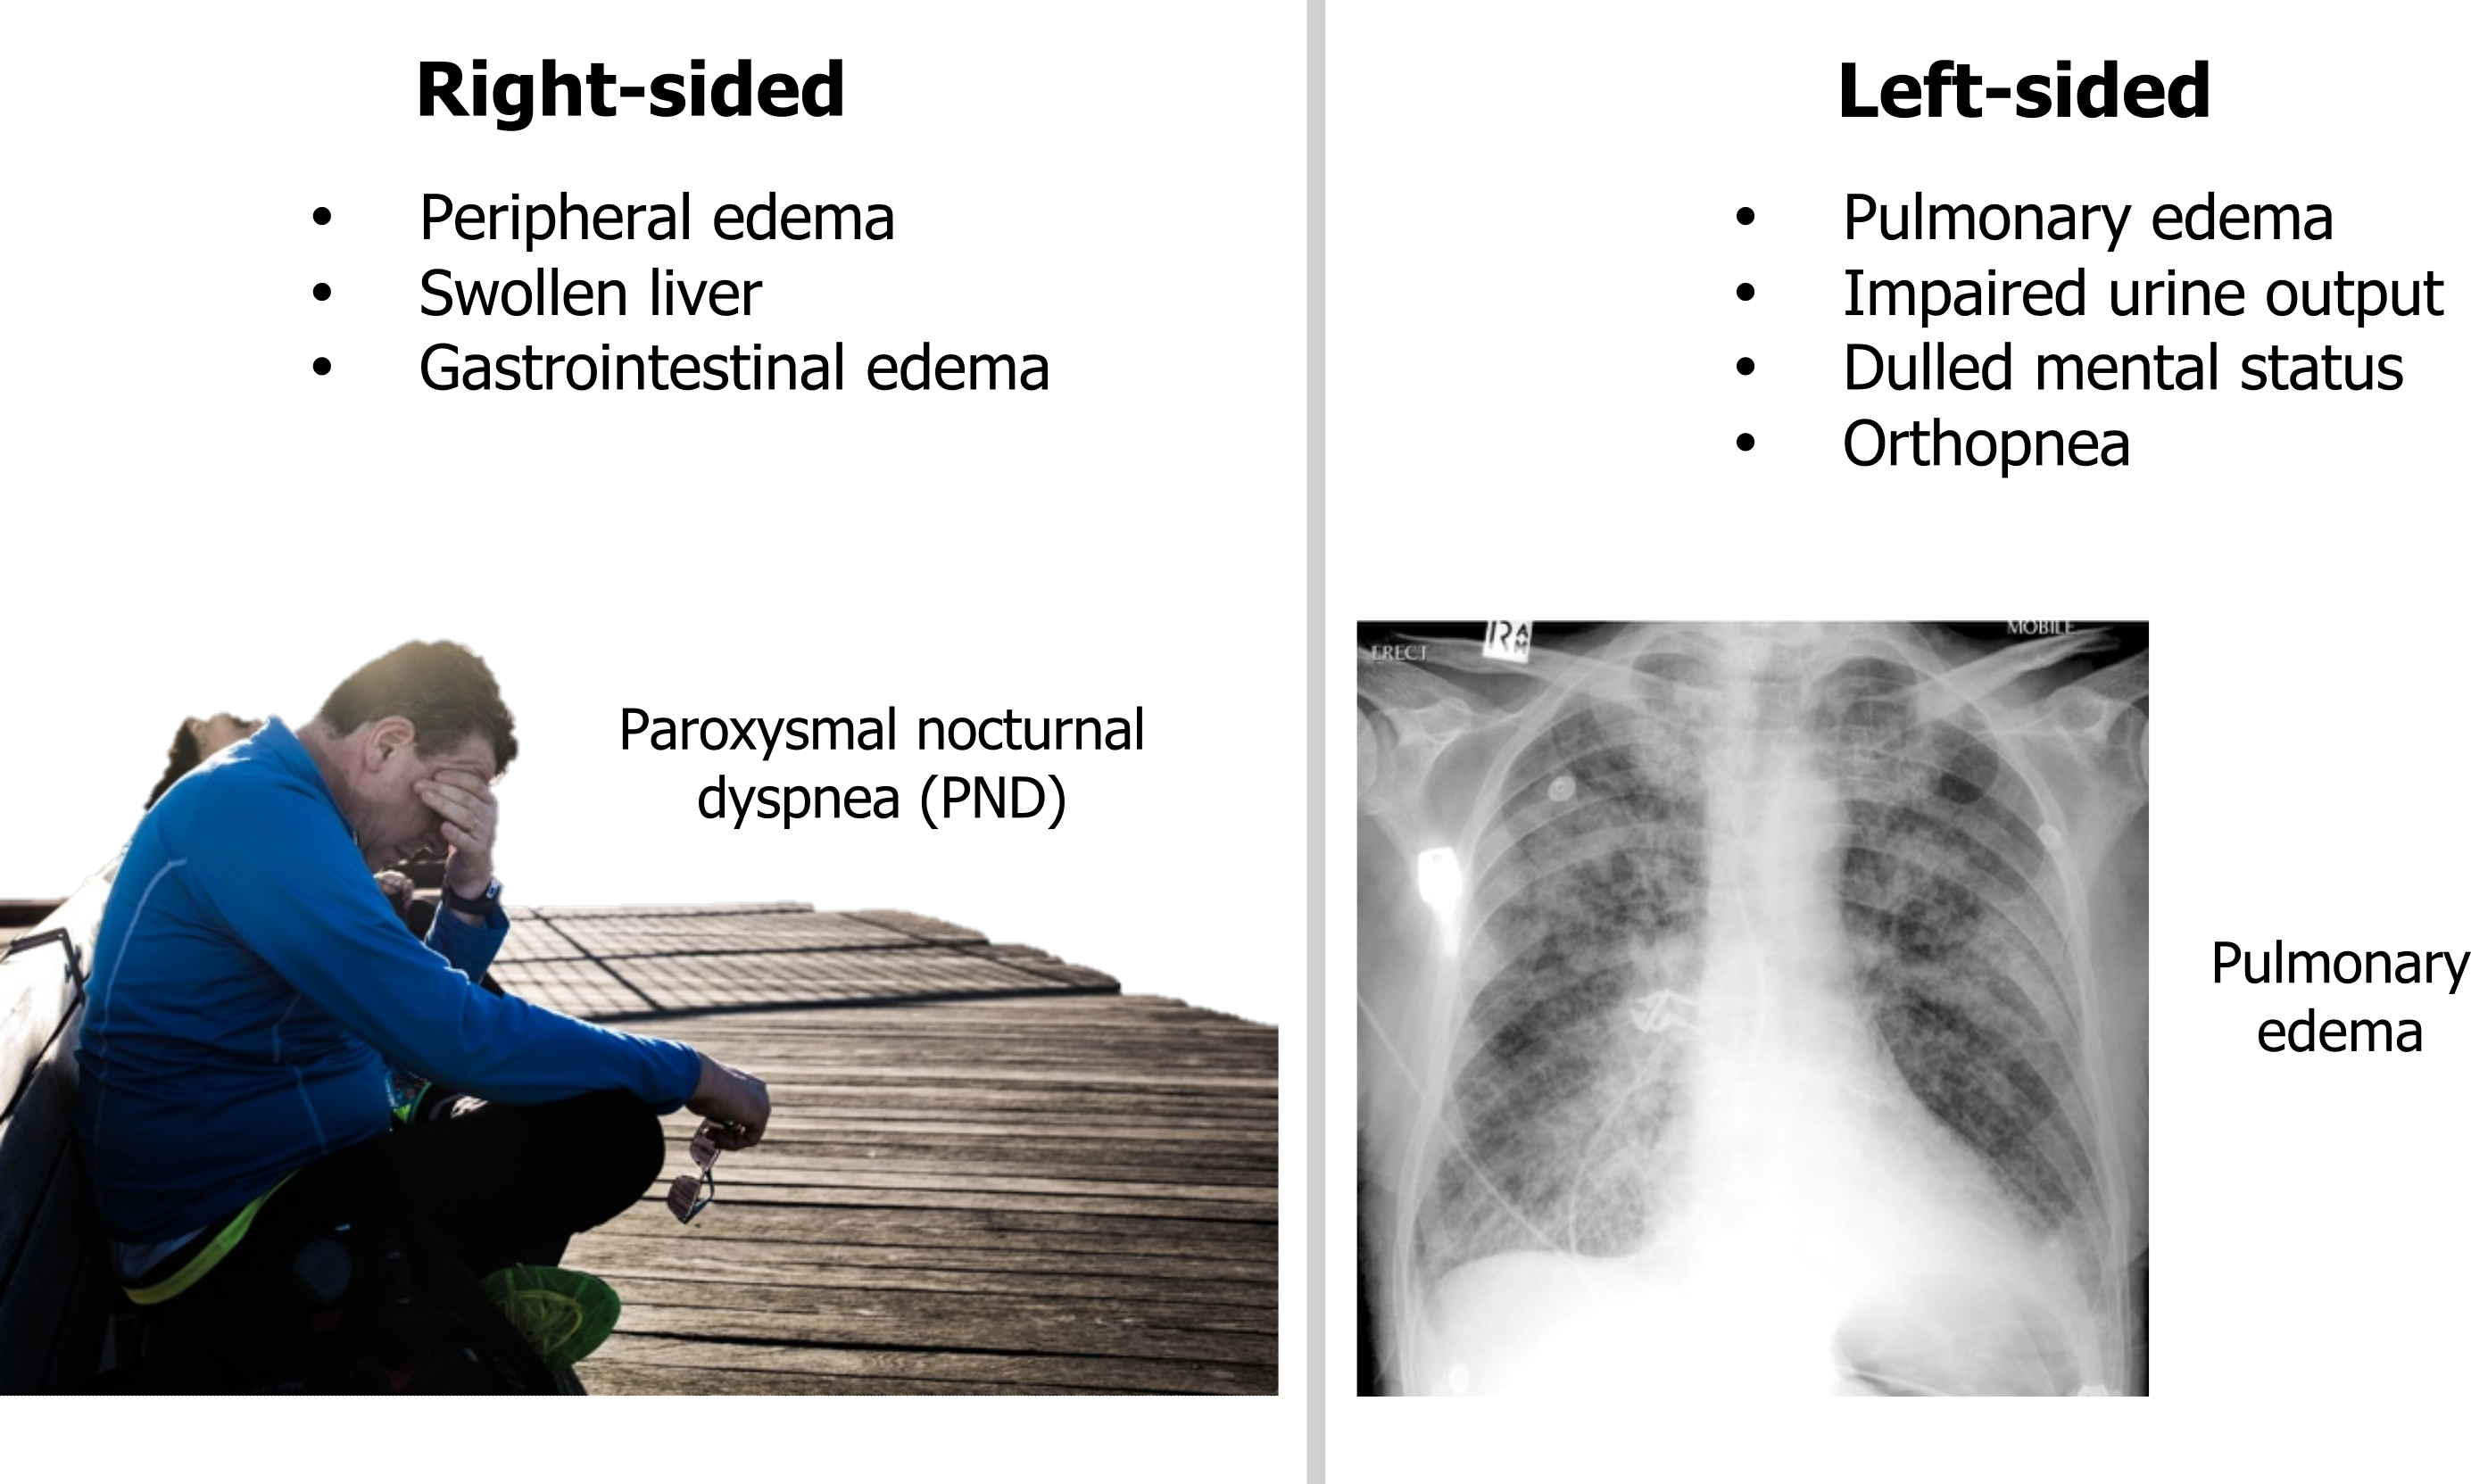
The clinical manifestations arise as fluid begins to move from the blood to the interstitium due to congestion (see summary in figure 2.7).
If the right heart fails, there is a rise in systemic venous pressure and peripheral edema arises. There may be abdominal discomfort as the liver becomes engorged and a loss of appetite or nausea as gastrointestinal edema arises. If the left heart fails, then the pulmonary circulation is exposed to the congestion and pulmonary edema arises.
Low cardiac output reduces renal filtration, so urine formation maybe impaired. Similarly cerebral blood flow may be compromised, causing dulled mental status.
Orthopnea arises when the patient lays down and venous return toward the failing left ventricle increases, compounding the pulmonary congestion. Patients often sleep propped up on pillows to elevate the heart and lungs. In severe cases the patient may only be able to sleep upright in a chair.
References, resources, and further reading
Text
Eberly, Lauren A., Eldrin F. Lewis, and Leonard S. Lilly. “Heart Failure.” In Pathophysiology of Heart Disease: A Collaborative Project of Medical Students and Faculty, 5e, edited by Leonard S. Lilly, Chapter 9. Philadelphia: Lippincott Williams & Wilkins, a Wolters Kluwer Business, 2010.
Malik, Ahmad, Daniel Brito, Sarosh Vaqar, and Lovely Chhabra. Congestive Heart Failure. Treasure Island, FL: StatPearls Publishing, 2022. https://www.ncbi.nlm.nih.gov/books/NBK430873/, CC BY 4.0.
Figures
Figure 2.1: Overly simplified schema of heart failure. Systolic = can’t get the blood out; Diastolic = can’t get the blood in. Grey, Kindred. 2022. CC BY 4.0. https://archive.org/details/2.1_20220113
Figure 2.2: Calculation for ejection fraction. Grey, Kindred. 2022. CC BY 4.0. https://archive.org/details/2.2_20220113_202201
Figure 2.3: Pathophysiological sequence of left ventricular failure. Grey, Kindred. 2022. CC BY 4.0. https://archive.org/details/2.3_20220113
Figure 2.4: Compensatory responses to reduced cardiac output. Grey, Kindred. 2022. CC BY 4.0. https://archive.org/details/2.4_20220113
Figure 2.5: The effects of volume and pressure overload on the morphology of the heart and cardiac myocytes. Grey, Kindred. 2022. CC BY 4.0. https://archive.org/details/2.5_20220113
Figure 2.6: Normal myocardium (A) and myocardium exposed to valvular disease (B). Kakimoto, Yu, Chisa Okada, Noboru Kawabe, Ayumi Sasaki, Hideo Tsukamoto, Ryoko Nagao, and Motoki Osawa. “Myocardial Lipofuscin Accumulation in Ageing and Sudden Cardiac Death.” Scientific Reports 9, no. 1 (2019). From Nature, CC BY 4.0.
Figure 2.7: Consequences of right- and left-sided heart failure. Grey, Kindred. 2022. CC BY-SA 3.0. Added Aguirre, Bruno. “Man Sitting on Bench beside Woman Photo.” 2017, from Unsplash, CC BY-NC 4.0. Added Gaillard, Frank. “Pulmonary Oedema.” 2011, from WikimediaCommons, CC BY-SA 3.0. https://archive.org/details/2.7-new
