5 Heart Sounds and Murmurs
Learning Objectives
- Describe the underlying events that produce the normal heart sounds, S1 to S4.
- Relate the timing and structure of a heart murmur to the underlying pathophysiology.
As unintrusive as the ECG is, listening to the heart is a cheap, quick, and informative clinical test. We will cover the basic structure, causes, and common pathologies of heart murmurs as a companion guide to clinical skills classes on auscultation of the chest. A good understanding of the cardiac cycle would be beneficial.
Heart Sounds
The first and second sounds (S1 and S2) are the fundamental heart sounds.
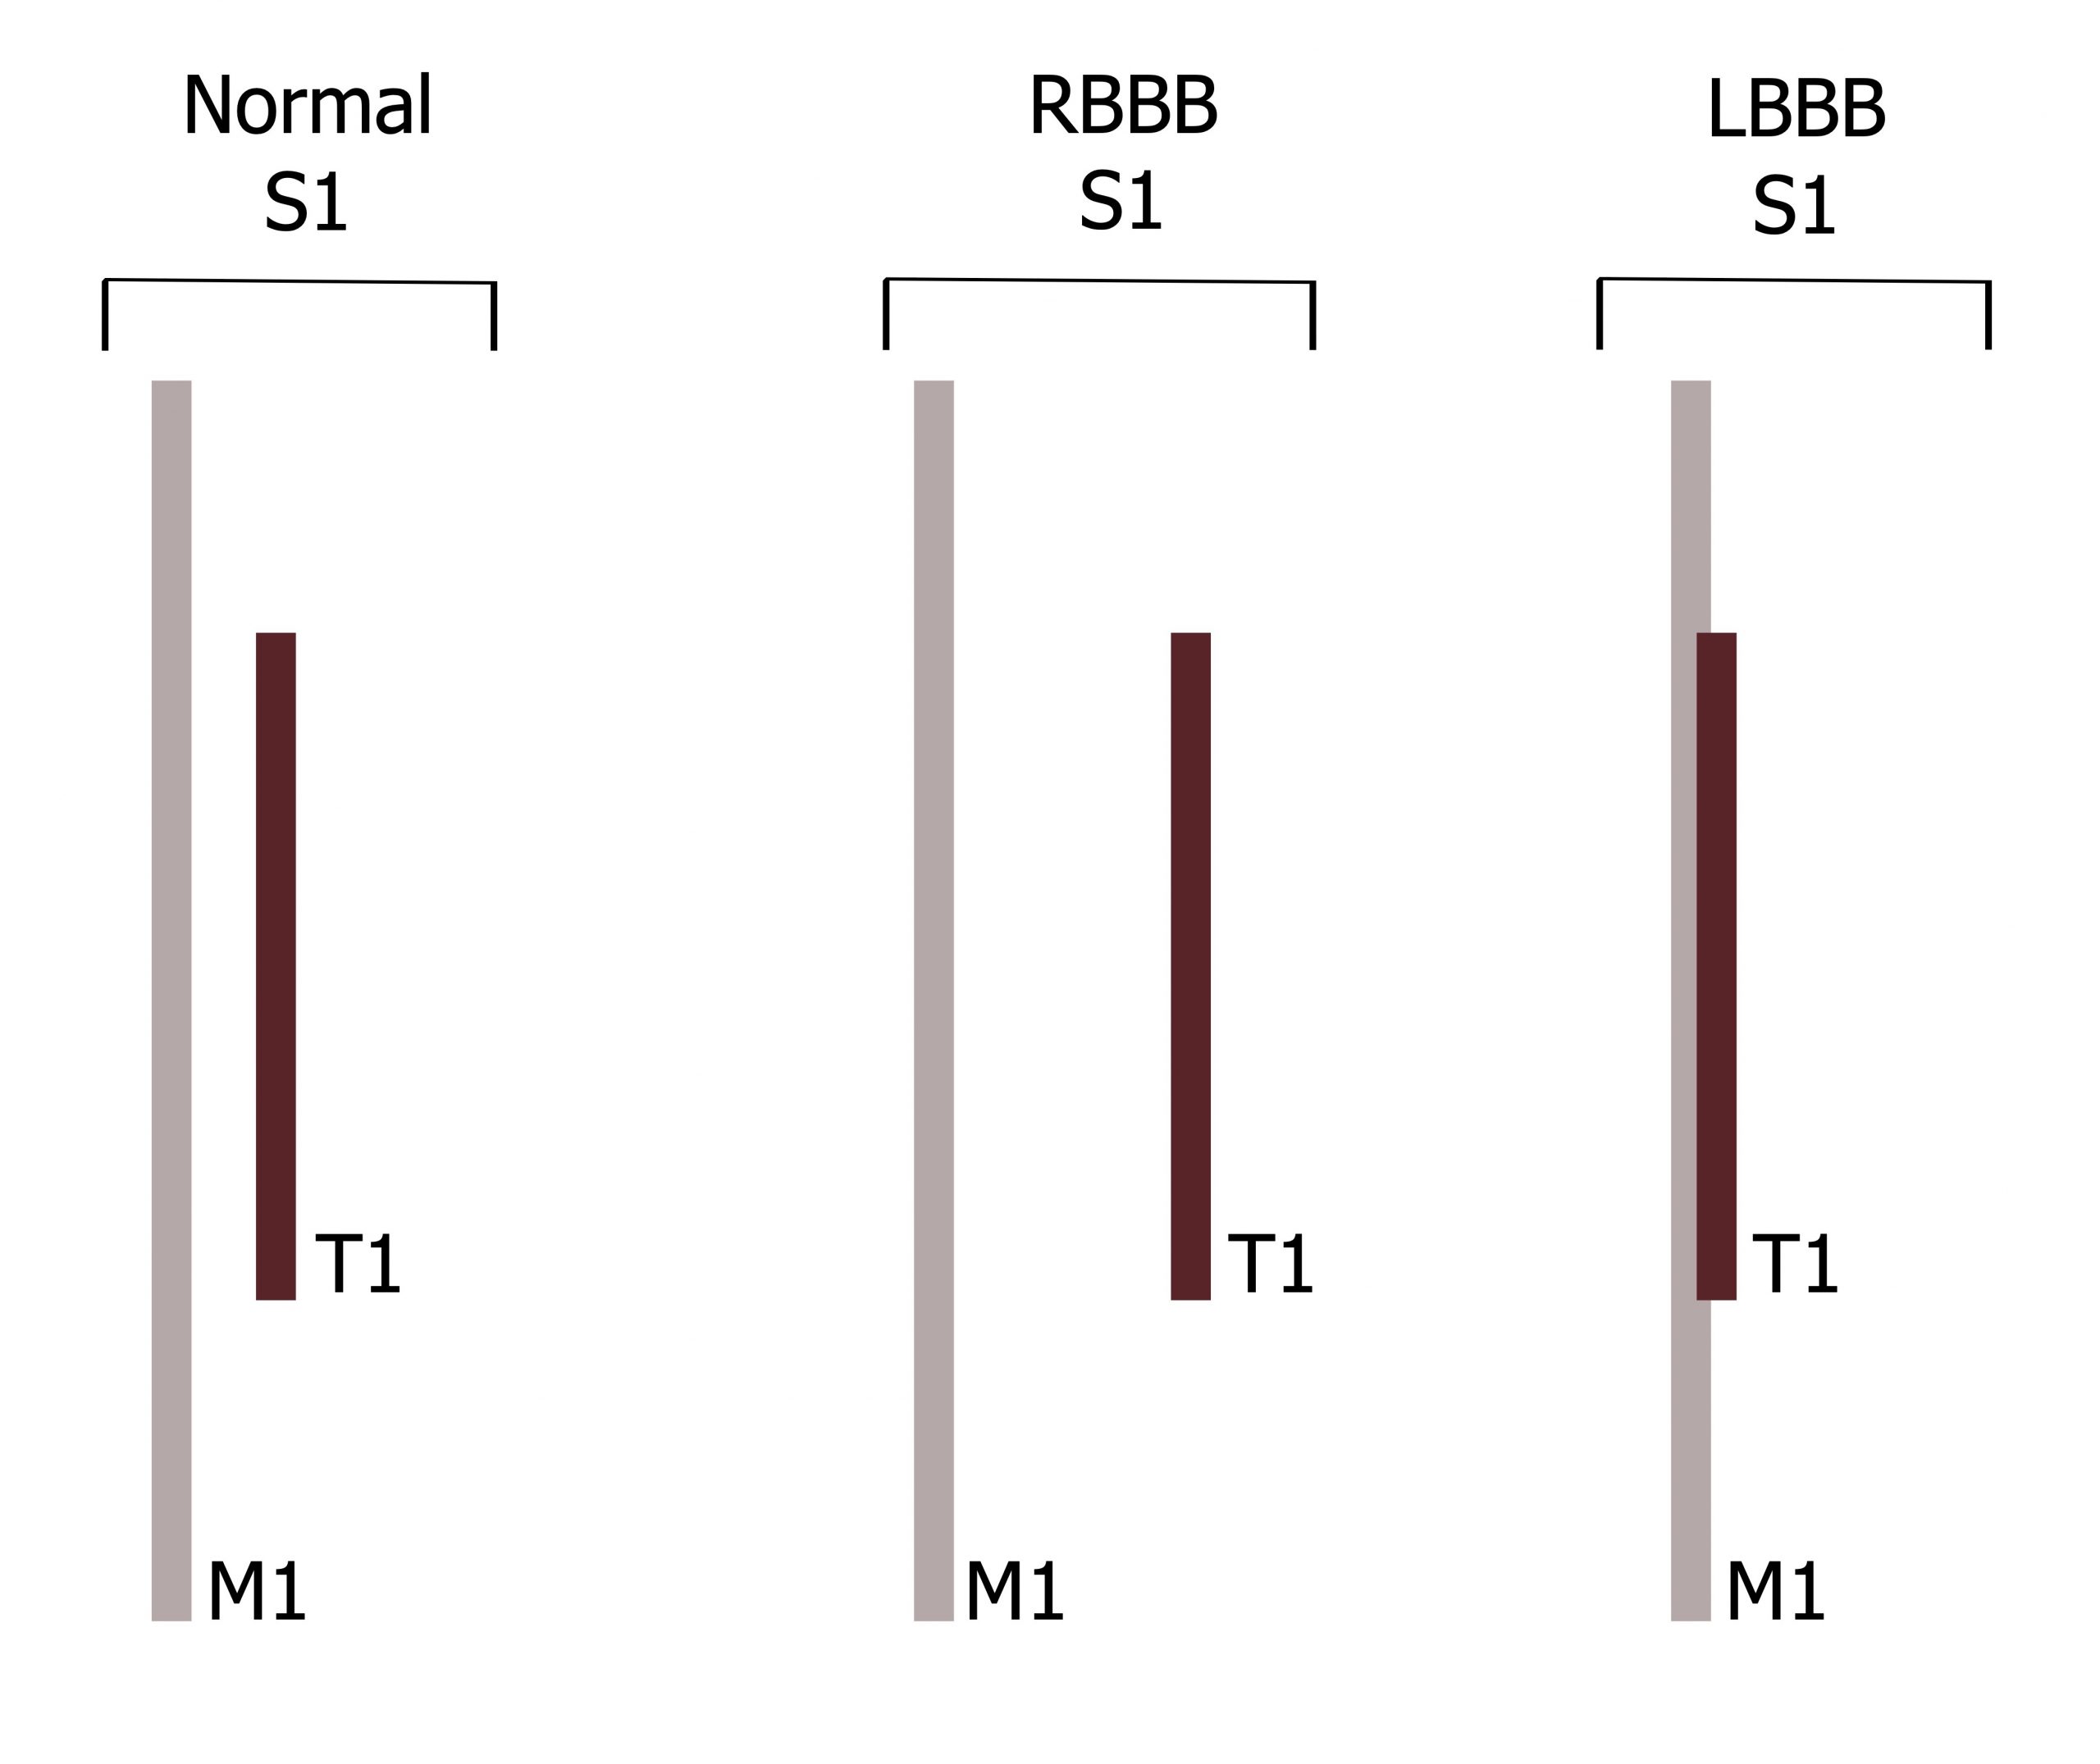
S1 occurs at the beginning of isovolumetric contraction. The ventricle is beginning to contract, so ventricular pressure quickly rises above atrial pressure and the atrioventricular (tricuspid and mitral) valves close, producing the S1 sound. The mitral valve normally closes slightly (0.04 seconds) before the tricuspid, causing S1 to be “split” (i.e., actually being two sounds, M1 and T1 (figure 5.1)), but the time gap is too short with a normal heart to be detectable with a stethoscope. The reasons for M1 preceding T1 are not clear, but may be due to the force generation of the left ventricle being slightly faster than that of the right ventricle. The splitting of S1 can be more pronounced and audible in the presence of a right bundle branch block (figure 5.1) that causes left ventricular contraction (and mitral valve closure) to markedly precede contraction of the right ventricle. Conversely, in the case of a left bundle branch block, the normal splitting of S1 may be absent (figure 5.1) as M1 is delayed and so occurs in synchrony with T1.
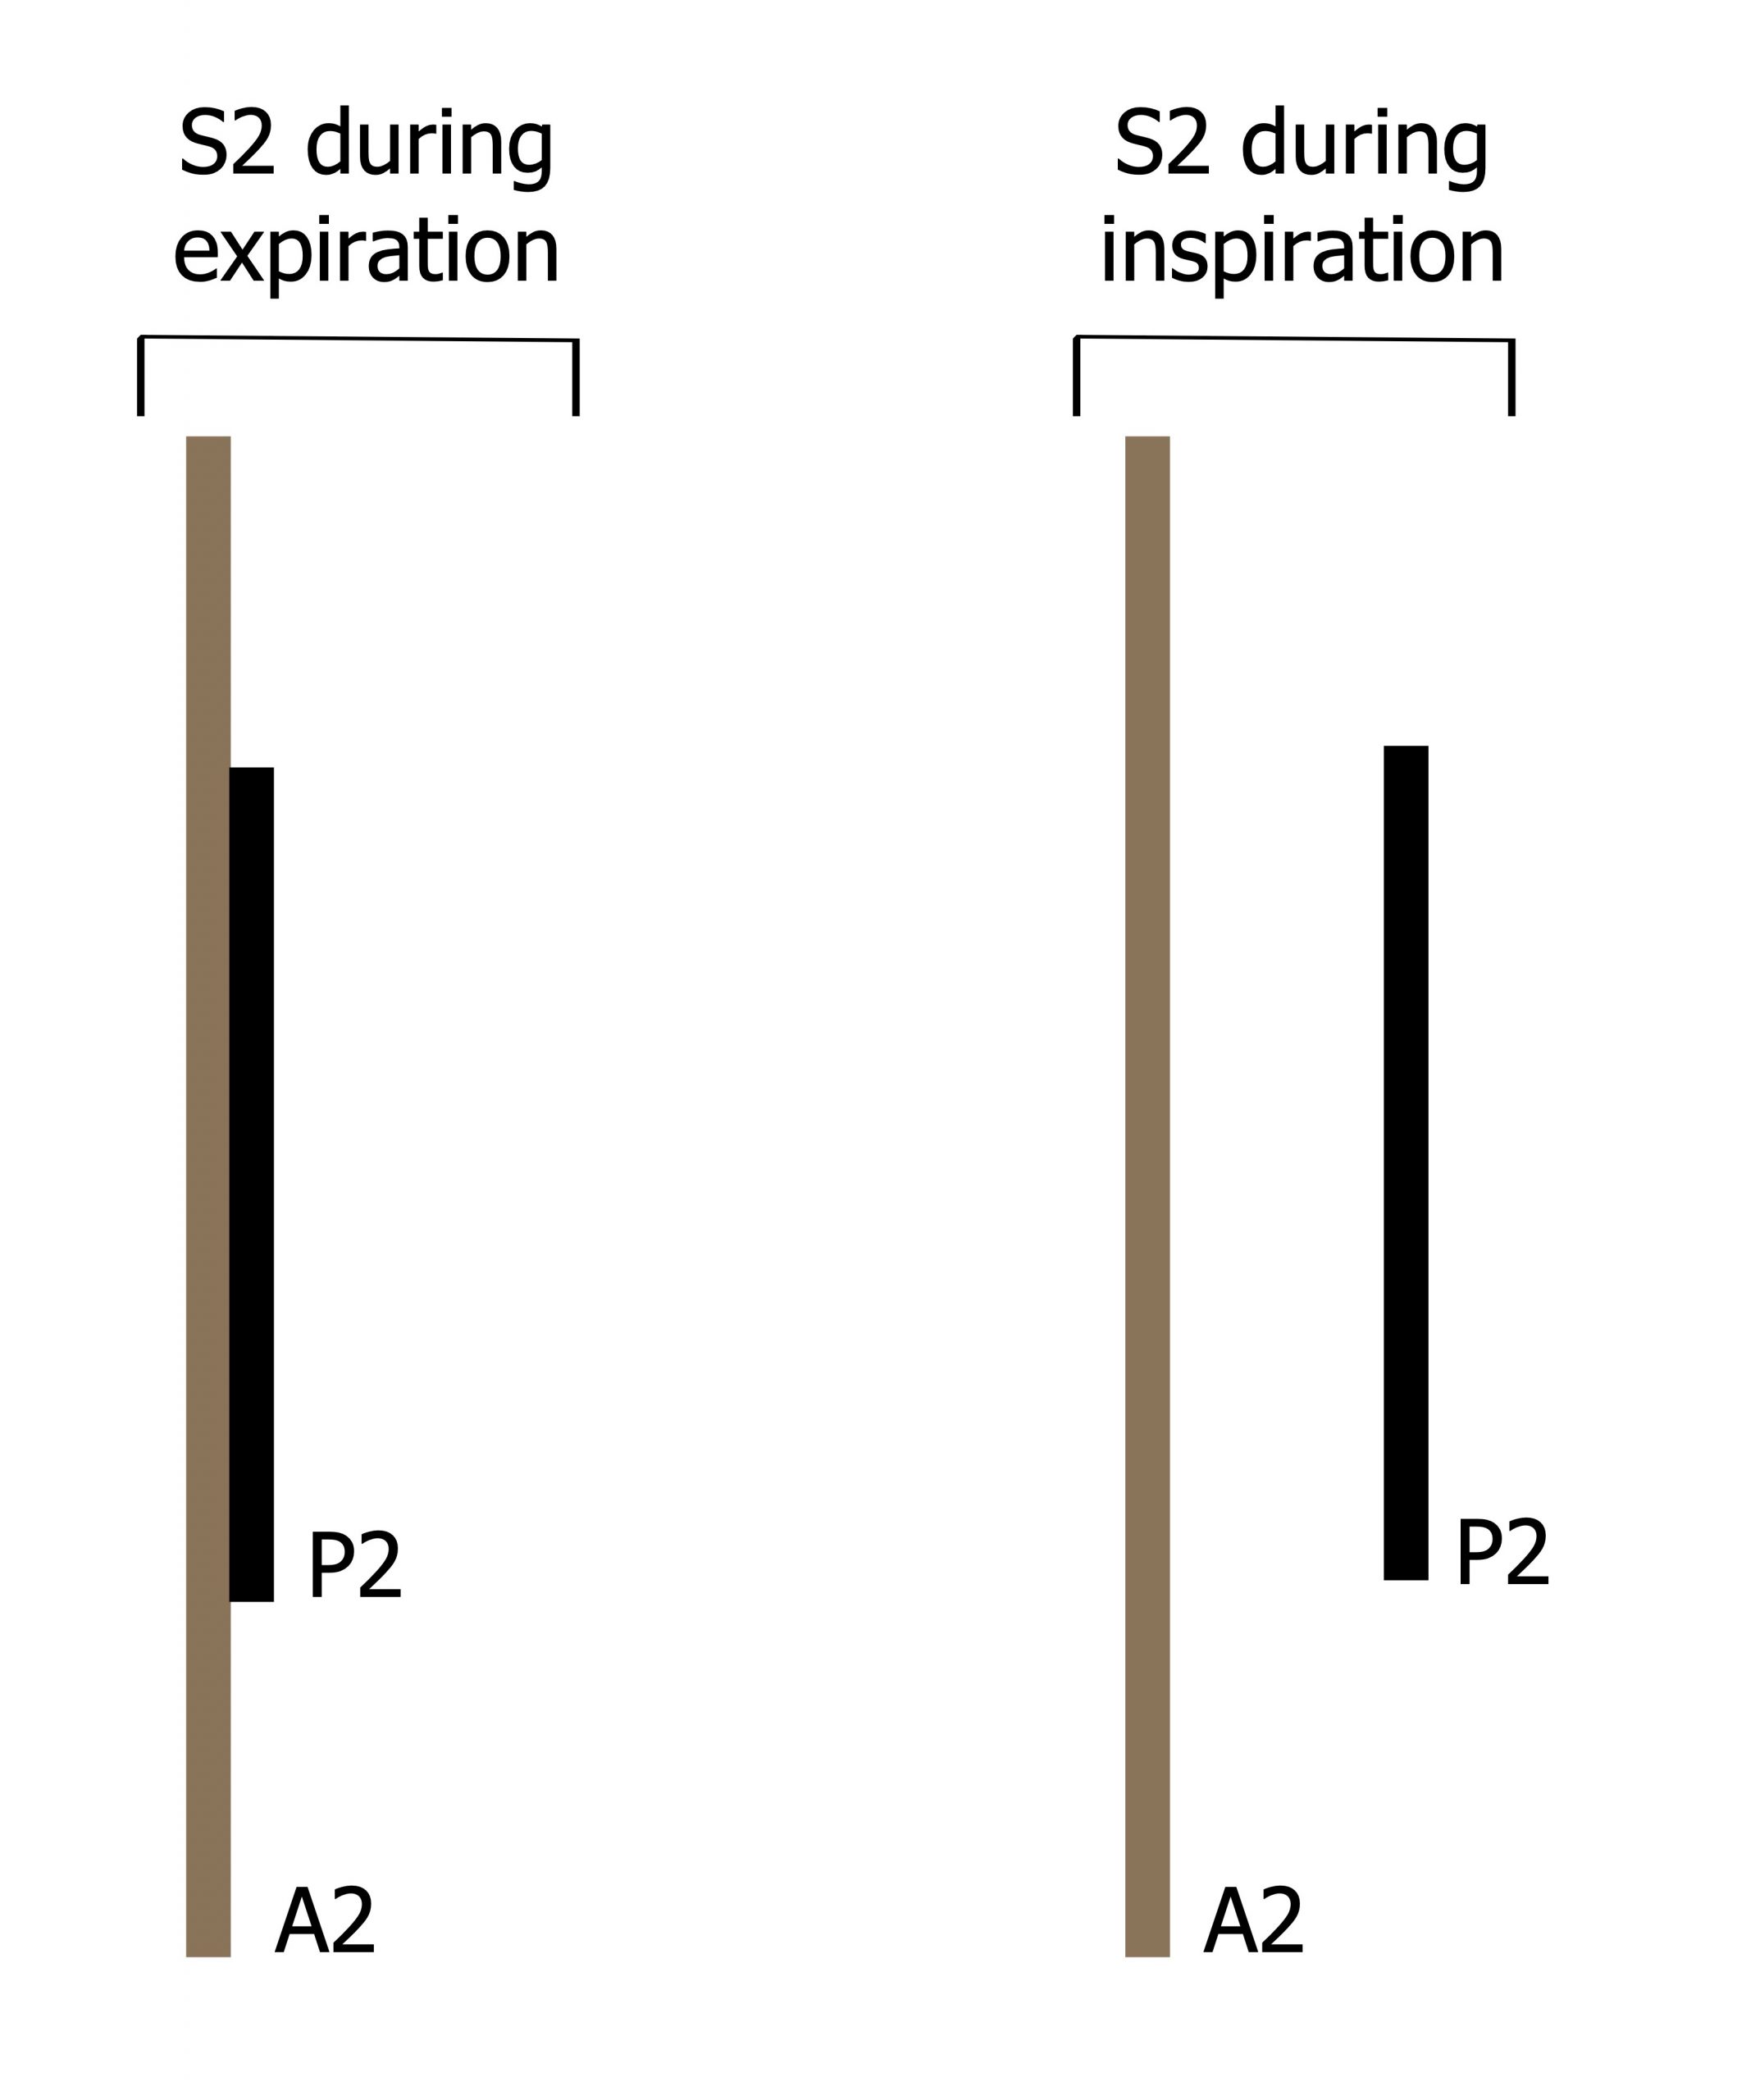
S2 is caused by closure of the aortic and pulmonic valves at the beginning of isovolumetric ventricular relaxation when ventricular pressure falls below pulmonary and aortic pressure. As aortic pressure (80 mmHg) is far greater than pulmonary artery pressure (10 mmHg), S2 is normally split with two components (A2 and P2) relating to the closure of the aortic and pulmonic valves, respectively. How split A2 and P2 are depend on physiological conditions, primarily the phase of breathing that influences the pulmonary artery pressure. In expiration pulmonary artery pressure is higher, so the pulmonic valve closes earlier and P2 occurs closer to A2. Conversely, during inspiration pulmonary artery pressure falls, so pulmonic valve closing occurs later and A2 and P2 occur further apart (figure 5.2). This physiological splitting can be heard with a stethoscope, but can be further influenced by diseases as listed in table 5.1.
| Changes in S2 splitting and possible underlying causes | |
|---|---|
| Abnormally wide splitting | - Right ventricle (RV) volume overload (e.g., atrial septal defect) - RV outflow obstruction (e.g., pulmonary stenosis) - RBBB |
| Narrow splitting | - Pulmonary hypertension - Mild to moderate aortic stenosis |
| Single S2 | - One semilunar valve is absent (e.g., truncus arteriosus, valvular atresia) - Large ventricular septal defect (equal ventricular pressures) - Pulmonary hypertension with equal ventricular pressures |
| Paradoxical splitting (P2 before A2) | - Severe aortic stenosis - LBBB |
Table 5.1: Changes in S2 splitting and possible underlying causes.
S3 is associated with the rapid filling phase of the ventricle (when the AV valves open), about 0.14 to 0.16 seconds after S2 (closure of the aortic and pulmonic valves). The exact cause of the sound is unclear, but a normal S3 occurs as a brief, low-frequency vibration. Previously thought to be an intracardiac sound arising from vibrations in the valve cusps or ventricular wall, more recent studies suggest the sound may be due to the filling ventricular wall hitting the inner chest wall, or it may arise from the ventricular apex as it hits a limitation of its longitudinal expansion.
| Common causes of abnormal S3 |
|---|
| Dilated cardiomyopathy |
| Chronic mitral valve regurgitation |
| Diastolic heart failure |
| Pregnancy (not pathological sign) |
| Athletes (not pathological sign) |
Table 5.2: Common causes of abnormal S3.
As S3 is a filling sound, an abnormal S3 (higher pitch and referred to as a ventricular gallop) is an important clue to heart failure or volume overload (see table 5.2). The absence of an abnormal S3 does not rule out heart failure, but its presence is a sensitive indicator of ventricular dysfunction. Constriction around the heart (e.g., constrictive pericarditis) may cause an early S3, or “pericardial knock.”
S4 is abnormal and is associated with poor ventricular compliance (e.g., ventricular hypertrophy). It occurs during atrial contraction and is associated with the atrial pressure pulse. The sound is thought to be caused by reverberation of the stiffened ventricular wall as blood is propelled into the ventricle from the atrium (hence it is also known as an atrial gallop). S4 and raised end-diastolic ventricular pressure (EDVP) commonly occur together as both are caused by poor ventricular compliance, so S4 tends to be associated with conditions that cause pressure overload (see table 5.3).
| Common causes of abnormal S4 |
|---|
| Hypertensive heart disease |
| Aortic stenosis |
| Hypertrophic cardiomyopathy |
| Acute phase of myocardial infarction |
| Acute and severe mitral or aortic regurgitation |
Table 5.3: Common causes of abnormal S4.
Ejection Sounds (Clicks)
As S1 and S2 occur during closure of heart valves, pathological conditions can lead to the valves producing a high-frequency “clicking” sound when they open during chamber ejection—hence they can be referred to as ejection sounds and they are pathological.
Aortic ejection sounds usually occur 0.12–0.14 seconds after the Q-wave of the ECG (i.e., after ventricular pressure has risen to exceed aortic pressure). Because of its timing, the “click” produced can be misinterpreted as a split S1. The abnormal opening of the aortic valve is usually caused by a deformed but mobile valve leaflet or aortic root dilation that may be caused by the conditions listed in table 5.4.
Pulmonary ejection sounds occur a little earlier (0.09–0.11 seconds) after the Q-wave as the pulmonary valve opens a little earlier (figure 5.1). It can also be distinguished by the fact that its intensity is diminished during inspiration as increased venous return during inspiration augments the effect of atrial contraction and causes a “gentler” opening of the valve. As with the aortic ejection sounds, pulmonary ejection sounds are associated with deformed valves or pulmonary arterial dilation.
A click occurring in diastole is associated with abnormal opening of either the mitral or tricuspid valve. Similar to systolic clicks, a diastolic click can be misinterpreted as a split S2. The most common cause of diastolic clicks is valvular stenosis of an AV valve.
| Aortic | Pulmonary |
|---|---|
| - Aortic stenosis - Bicuspid aortic valve - Aortic regurgitation - Aneurysm in ascending aorta |
- Pulmonary stenosis - Pulmonary arterial dilation - Pulmonary hypertension |
Table 5.4: Common causes of ejection "clicks."
Heart Murmurs
A murmur is the sound of turbulence associated with abnormal blood flow through a valve or chamber. The turbulent flow produces low-frequency audible sounds that are distinct from heart sounds associated with valve closures. Murmurs can be divided into those caused by valvular defects and those caused by abnormal interchamber flow. Depending on the defect involved, the murmur may occur during diastole and systole, hence distinguishing whether a murmur is diastolic or systolic is a useful first diagnostic step.
Classification of a murmur includes the intensity (Grades 1–6, faintest to loudest), the pitch (high or low), configuration, location, and timing. The timing refers to the onset and duration of the murmur, and the classifications are shown in table 5.5 with some common causes listed there and below.
- Aortic stenosis produces a midsystolic murmur that has a crescendo–decrescendo pattern (intensity builds up, then fades). This pattern relates to the level of turbulent flow through the narrowed valve—slow at first as the resistance is overcome, then fading away as blood flow decreases.
- Mitral/tricuspid regurgitation produces a holosystolic murmur as the incompetent valve allows a constant turbulent (and reverse) flow from the ventricle back to the atria.
- Mitral valve prolapse produces a late-systolic murmur often proceeded by a midsystolic click. The click is caused by tensioning of the chordae tendineae as ventricular pressure increases and the murmur builds up as regurgitation is established.
- Ventricular septal defect produces a holosystolic murmur when severe. Turbulent flow through the defect is constant as the left ventricular pressure is higher than right ventricular pressure throughout systole—hence a continuous left–right shunt is established.
- Aortic regurgitation produces a “blowing” diastolic murmur that is usually decrescendo. This early diastolic murmur is short because rapidly rising ventricular pressure (due to atrial and aortic contributions) ends the reverse flow from the aorta. In cases when the aortic pressure is high, the regurgitation may be sustained and the murmur becomes pandiastolic.
- Mitral stenosis produces a diastolic murmur that starts late as the stenosed valve prevents atria-to-ventricular flow until high atrial pressures are established. The murmur may be preceded by a middiastolic click as the atrial pressure finally “flings” the valve open.
| Classification | Description | Possible cause | |
|---|---|---|---|
| Early-systolic | Obscures S1 and extends for a variable length in systole but does not extend up to S2 |  |
Small ventricular septal defect |
| Midsystolic | Begins after S1 and ends before A2 or P2. Both S1 and S2 are audible |  |
Aortic stenosis |
| Holosystolic
(a.k.a. pansystolic) |
Starts with S1 and extends up to A2 or P2, obscuring both S1 and S2 | 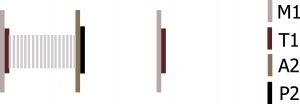 |
Ventricular septal defect or AV valve regurgitation |
| Late-systolic | Starts after S1 and obscures A2 or P2 | 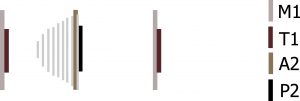 |
Mitral valve prolapse |
| Early-diastolic | Starts with A2 or P2 and extends into diastole for a variable duration | 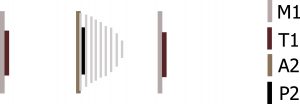 |
Aortic regurgitation |
| Middiastolic | Starts after S2 and terminates before S1 | 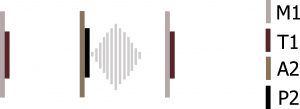 |
Atrial septal defect |
| Late-diastolic | Starts well after S2 and extends up to the mitral component or to the tricuspid component of S1 | 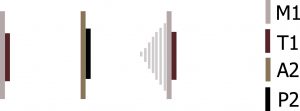 |
Mitral stenosis |
Table 5.5: Classifications of heart murmurs.
References, resources, and further reading
Text
Dornbush, Sean, and Andre E. Turnquest. Physiology, Heart Sounds. Treasure Island, FL: StatPearls Publishing, 2022. https://www.ncbi.nlm.nih.gov/books/NBK541010, CC BY 4.0.
Kulkarni, Vivek T., and Leonard S. Lilly. “The Cardiac Cycle: Mechanisms of Heart Sounds and Murmurs.” In Pathophysiology of Heart Disease: A Collaborative Project of Medical Students and Faculty, 5e edited by Leonard S. Lilly, Chapter 2. Philadelphia: Lippincott Williams & Wilkins, a Wolters Kluwer Business, 2010.
Thomas, Seth L., Joseph Heaton, and Amgad N. Makaryus. Physiology, Cardiovascular Murmurs. Treasure Island, FL: StatPearls Publishing, 2022. https://www.ncbi.nlm.nih.gov/books/NBK525958, CC BY 4.0.
Figures
Figure 5.1: Normal and abnormal differences in the components of S1 (M1 and T1). Grey, Kindred. 2022. CC BY 4.0. https://archive.org/details/5.1_20220113
Figure 5.2: Normal splitting of S2 with inspiration. Grey, Kindred. 2022. CC BY 4.0. https://archive.org/details/5.2_20220113
Table 5.5: Classifications of heart murmurs. Grey, Kindred. 2022. CC BY 4.0. https://archive.org/details/5.5_20220113
