1 Arrhythmias
Learning Objectives
- Distinguish between different forms of common arrhythmias.
- Describe the underlying pathophysiology of an arrhythmia.
This chapter will address the arrhythmias listed in the USMLE (United States Medical Licensing Exam) Step 1 content guide on a section-by-section basis. Learning the arrhythmias here will be substantially easier with a robust understanding of electrocardiogram (ECG) fundamentals and lead orientation, so going back to basics is likely to be very worthwhile.
Atrial Fibrillation
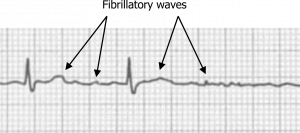
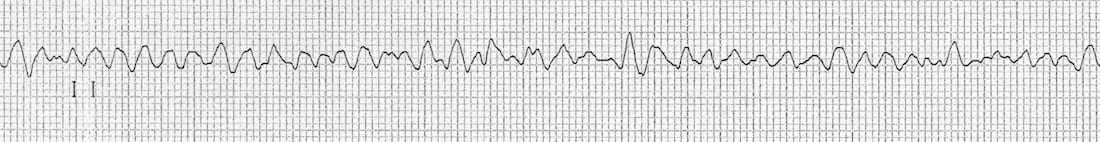
Atrial fibrillation is the most common cardiac arrhythmia and is caused by rapidly firing potentials in the atrial myocardium. These aberrant depolarizations are often the result of myocardial remodeling and frequently originate within the muscular sleeves that extend into the pulmonary veins from the atria. Causes include hypertension, valvular and ischemic heart disease, and genetics (e.g., mutation of 10q22–q24 on chromosome 10). The rapid depolarizations result in a very fast atrial rate from 400 to 600 bpm. Because the atrial rate is so fast, the ECG shows “coarse fibrillatory waves” (figure 1.1); the action potentials produced are low amplitude, and P-waves will not be seen.
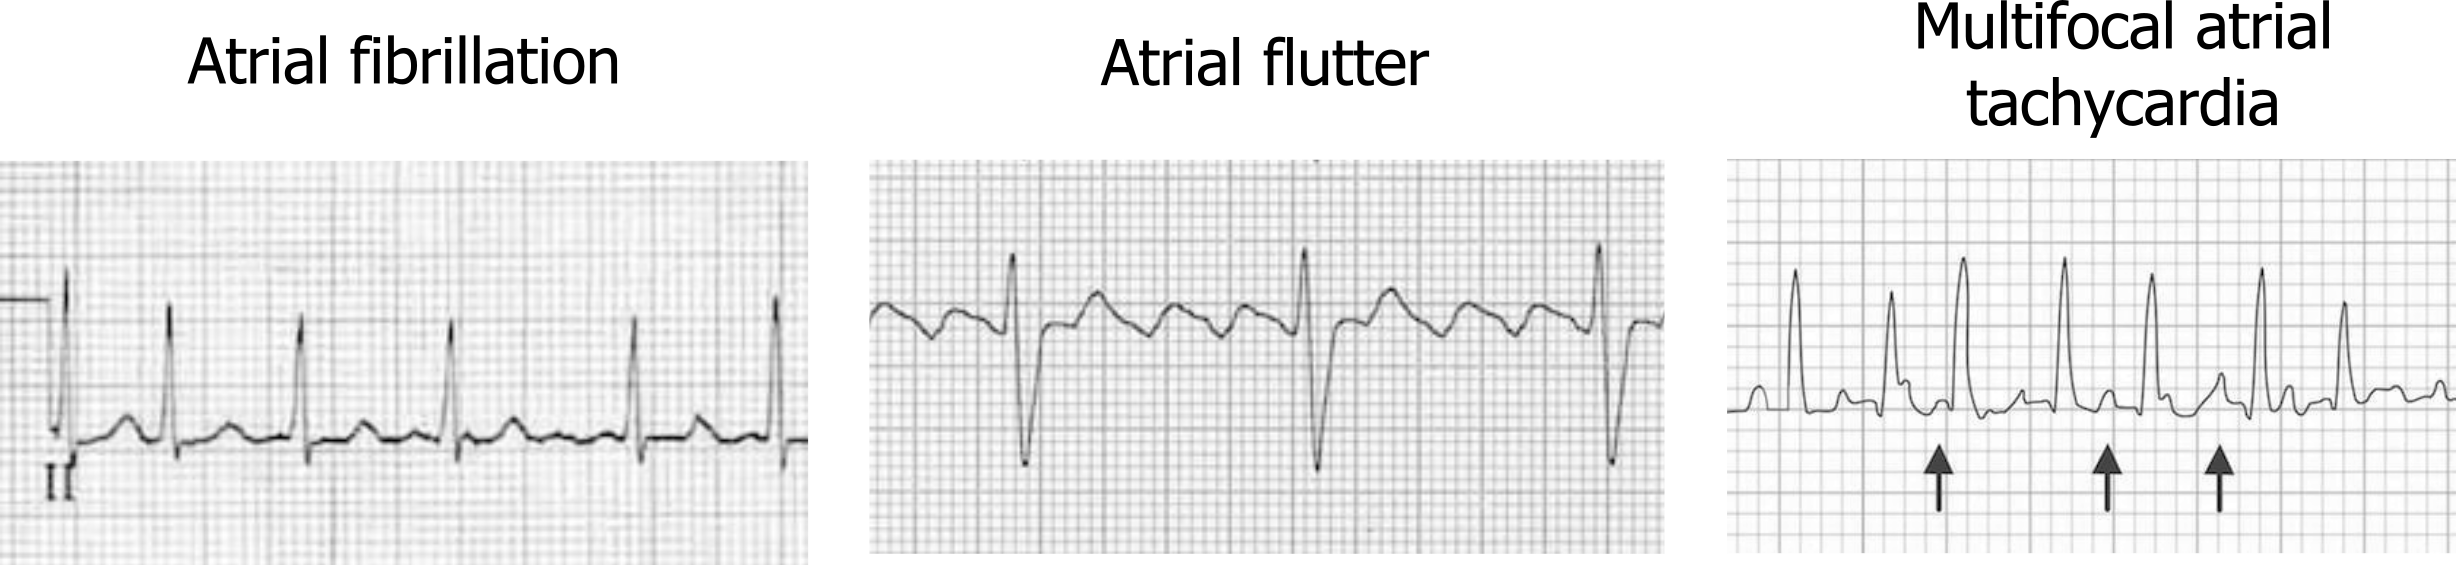
The rapid atrial depolarizations are transmitted to the atrioventricular (AV) node, but far from all are conducted through to the ventricle because of the node’s long refractory period. This means the ventricular rate does not rise to 400–600 bpm (which would be catastrophic), but some of the atrial fibrillation activity can be “lucky” and reach the AV node when it is not in a refractory period. When this occurs, the ventricular rate rises to 100–200 bpm, and QRS complexes can be “irregularly irregular” with a varying R-R interval (left panel, figure 1.2).
| Atrial fibrillation summary |
|---|
| No visible P-waves |
| Irregularly irregular QRS complexes |
| High ventricular rate |
| Atrial fibrillatory waves possible |
Table 1.1: Atrial fibrillation summary.
Atrial Flutter
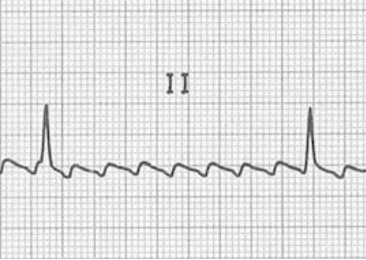
Atrial flutter is caused by a macroreentrant current, rather than the multiple sites of aberrant depolarization seen in fibrillation. The cavotricuspid isthmus (CTI) usually provides the circuit for the slower reentrant current to become established (typical atrial flutter), but other sites of reentry and slow conducting circuits are possible (atypical atrial flutter) and are usually associated with structural heart disease or sites of previous surgical or ablations procedures. The slower reentry current produces an atrial rate of 250–350 bpm (compared to the 400–600 of atrial flutter), and P-waves are present but have a characteristic “sawtooth” pattern (figure 1.3 and middle panel figure 1.2).
As with atrial fibrillation, the AV node’s refractory period prevents most of the P-waves from progressing to the ventricle, but commonly the AV conduction will be 2-to-1, so with an atrial rate of 300 bpm the ventricular rate will be 150 bpm. Parasympathetic stimulation or changes in AV node refractoriness can modify how many P-waves pass into the ventricle, but the the resultant rhythm is “regularly irregular.” When the heart rate is elevated, then distinguishing flutter from fibrillation becomes challenging and slowing ventricular rate pharmaceutically (adenosine) helps the flutter waves reemerge for a definitive diagnosis to be made.
| Atrial flutter summary |
|---|
| Sawtooth atrial pattern |
| Regularly irregular QRS complexes |
| High ventricular rate |
Table 1.2: Atrial flutter summary.
Multifocal Atrial Tachycardia
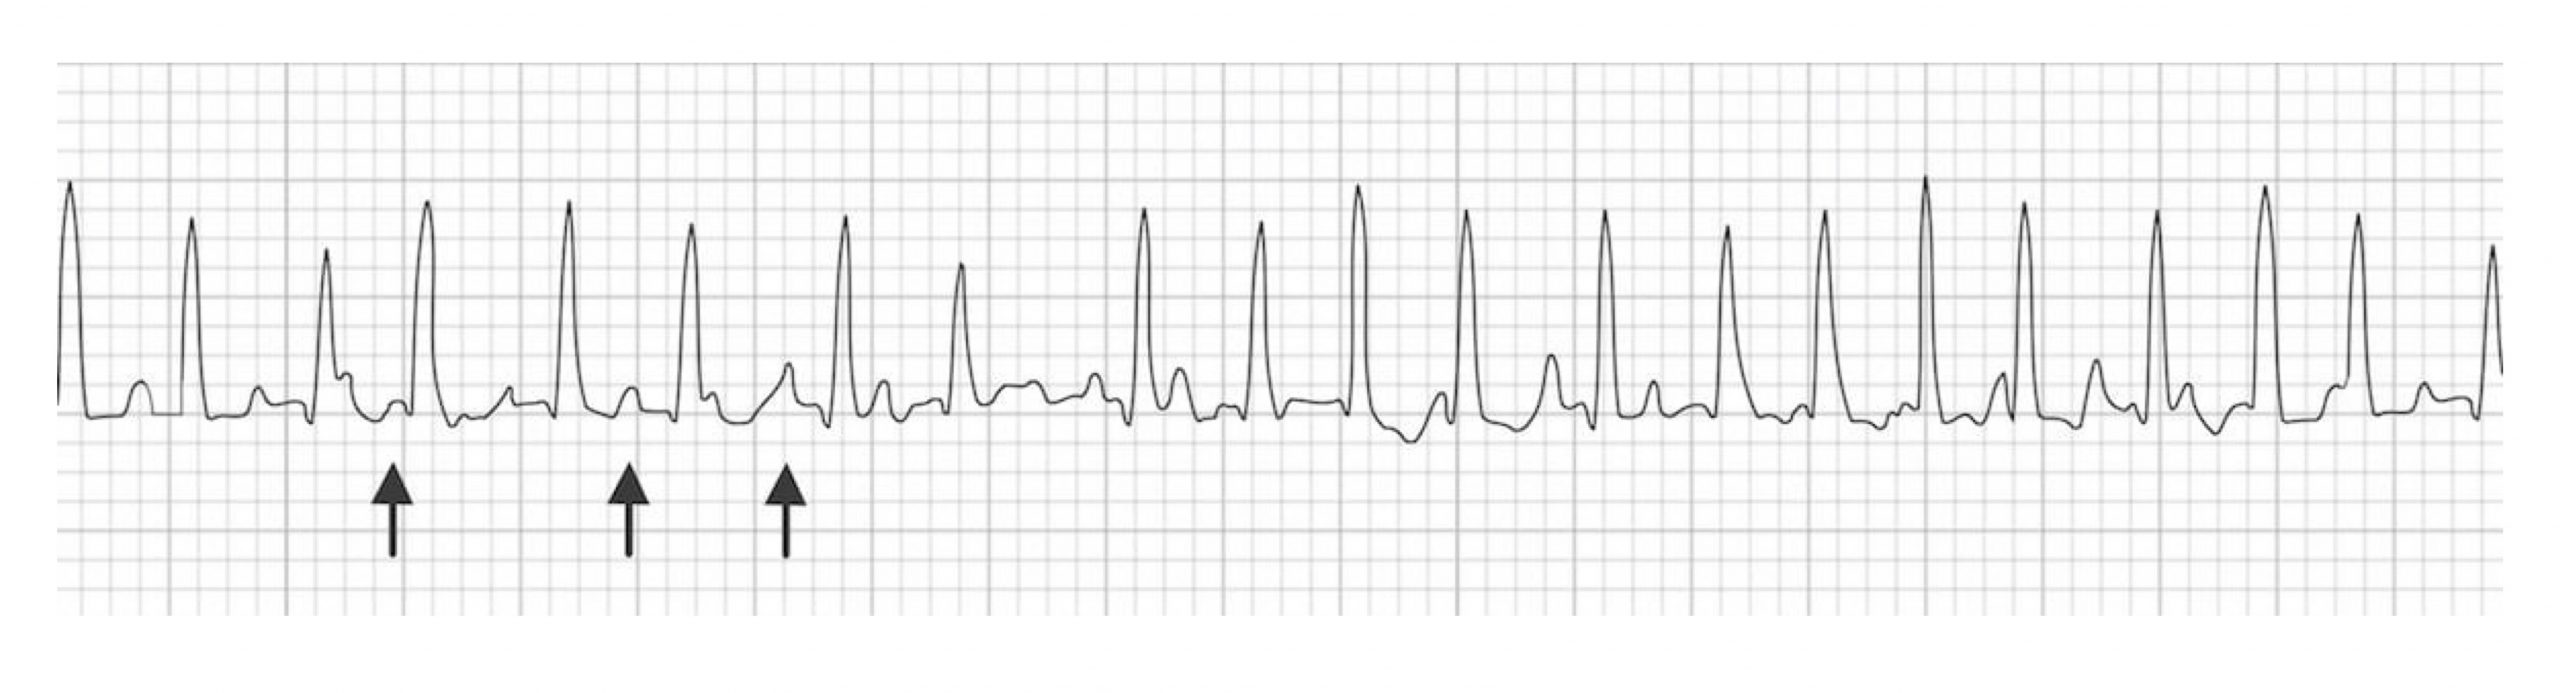
Multifocal atrial tachycardia (MAT) is caused by the presence of multiple ectopic foci. The multiple foci result in P-waves with multiple morphologies and irregular intervals (see figure 1.4). The pathophysiology of MAT is not clear, although several theories exists (e.g., triggered activity, reentry, or abnormal automaticity). The multiple foci within the atrium generate consecutive action potentials that are all conducted to the ventricles. Thus, each QRS complex will be preceded by a P-wave; however, each P-wave will have a different morphology because they originate from different areas. By definition, MAT must have at least three distinctly different P-wave morphologies (figure 1.4) and a ventricular rate of greater than 100 bpm.
MAT frequently occurs in the setting of severe lung disease and, more specifically, during an exacerbation of lung disease. This rhythm is benign, and once the underlying lung disease is treated, it should resolve.
| MAT summary |
|---|
| P-waves followed by QRS complexes |
| P-waves have different morphology (at least three) |
| High ventricular rate (100 bpm) |
Table 1.3: MAT summary.
Premature Atrial Contraction
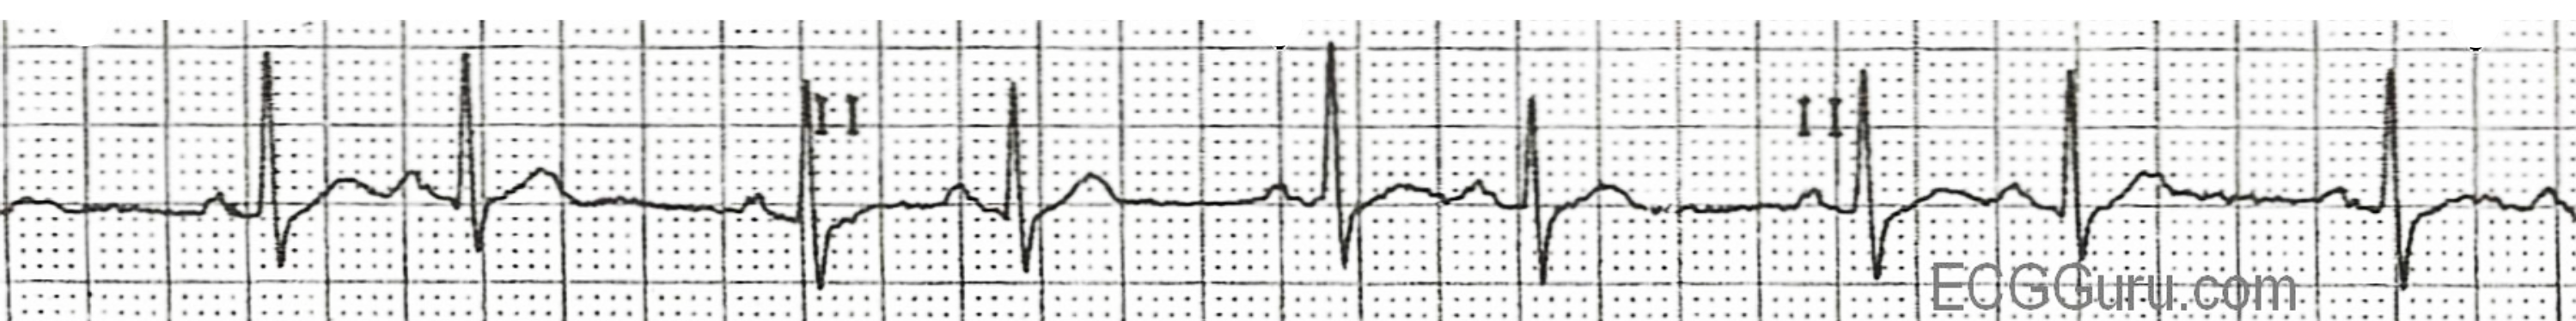
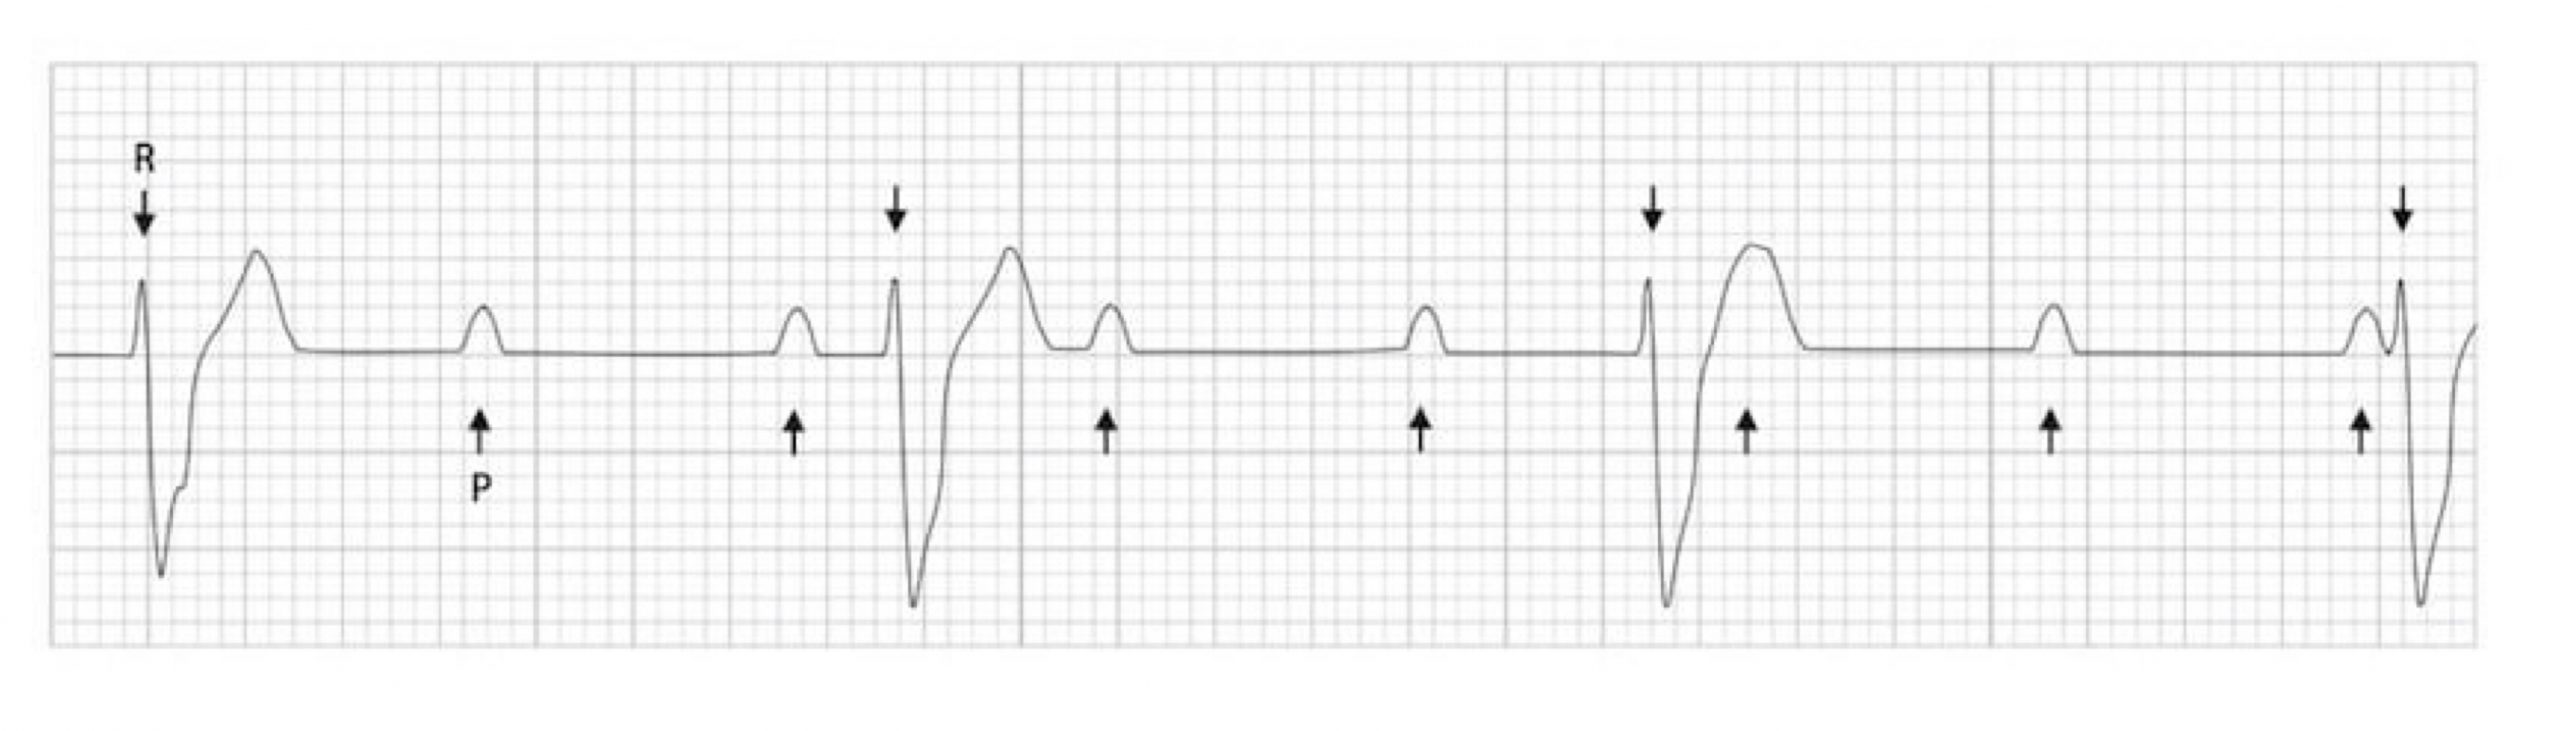
A premature atrial contraction (PAC) is generated by a depolarization instigated outside of the SA node. This produces an extra P-wave, and consequently a shortening from previous P-P intervals is seen. The aberrant P-wave also has a different morphology from a sinus P-wave because of its different anatomical origin.
The premature complex may also upset the timing of the SA node, placing it back into a refractory period when it should be depolarizing for its next scheduled beat. This means that a PAC may cause a “compensatory pause” as the SA node restarts its pacemaker depolarization. Consequently the ECG can show “atrial bigeminy” where complexes appear to be in pairs with a normal complex followed by a complex driven by the atrial ectopic activity, then a pause while the SA node begins its depolarization again (see figure 1.5).
If a PAC occurs when the AV node has not yet recovered from its refractory period, the PAC will fail to conduct to the ventricles; meaning the PAC will not be followed by a QRS complex or the ectopic P-R interval will be prolonged. The ECG will show a premature, ectopic P-wave and then no QRS complex afterward. When this occurs along with bigeminy, the ECG can appear as if there is sinus bradycardia.
| PAC summary |
|---|
| Extra P-wave with abnormal morphology |
| Compensatory pause leading to atrial bigeminy |
Table 1.4: PAC summary.
Sinus Bradycardia
Sinus bradycardia denotes a sinus rhythm below 60 bpm. Otherwise the ECG waveform is normal on an ECG with an upright P-wave in lead II preceding every QRS complex. There are many intrinsic causes associated with the heart itself, as well as extrinsic causes, some of which are listed table 1.5. Sinus bradycardia is usually asymptomatic as rates of 40–50 bpm can maintain hemodynamic stability. Rates below this can produce symptoms of fatigue, dizziness, and dyspnea on exertion.
| Intrinsic causes | Extrinsic causes |
|---|---|
| Chest trauma | Hypothyroidism |
| Ischemic heart disease | Carotid sinus sensitivity |
| Sick sinus syndrome | Calcium channel blockers |
| Myocarditis | Antiarrhythmic class I to IV |
| Familial disorder | Intracranial hypertension |
| Radiation therapy | Hypoglycemia |
| Lyme disease | Sleep apnea |
Table 1.5: Intrinsic and extrinsic causes associated with the heart.
| Sinus bradycardia summary |
|---|
| 60 bpm |
| Normal P-wave before every QRS complex |
Table 1.6: Sinus bradycardia summary.
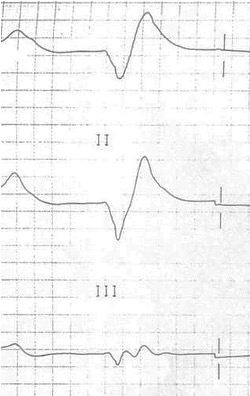
Premature Ventricular Contractions
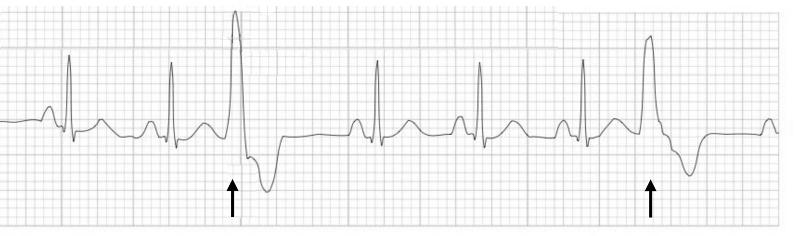
Similar to a PAC, a premature ventricular contraction (PVC) occurs when a focus in the ventricle generates an action potential before the pacemaker cells in the SA node depolarize. This early depolarization is out of rhythm with the normal R-R interval, and because it starts outside of the normal conduction pathways, it has a very different shape from a normal, scheduled QRS complex (figure 1.6). The PVC is wider as it has to travel from myocyte to myocyte, so it is much slower than a normal SA node–driven depolarization that travels through the faster conduction network fibers. There is also a compensatory pause following the PVC as the unscheduled depolarization puts the ventricular myocardium into refractory state, forcing it to “skip a beat” (figure 1.6).
| PVC summary |
|---|
| Put of step with normal R-R interval |
| Wider complex |
| Followed by compensatory pause |
Table 1.7: PVC summary.
Ventricular Tachycardia
Ventricular tachycardia (VT) is caused by reentry currents being established in the ventricular myocardium or groups of ventricular myocytes that have aberrant electrical behavior. As such, VT is usually caused by underlying cardiac disease.
Like a PVC, the aberrant depolarizations do not follow the normal conduction pathways so are wide (>120 msecs), but unlike a PVC, VT involves a ventricular rate >100 bpm. With disorganized contractility and reduced filling time, VT can lead to hemodynamic instability and severe hypotension—hence it is life threatening.
The QRS morphology in VT is highly variable between patients and depends on where the arrhythmia originates. Consequently there are several ways to classify VT based on duration, symptoms, QRS morphology, rate, and origin.
Sustained VT is any VT that lasts for more than 30 seconds or is symptomatic. Nonsustained VT lasts for less than 30 seconds and is asymptomatic.
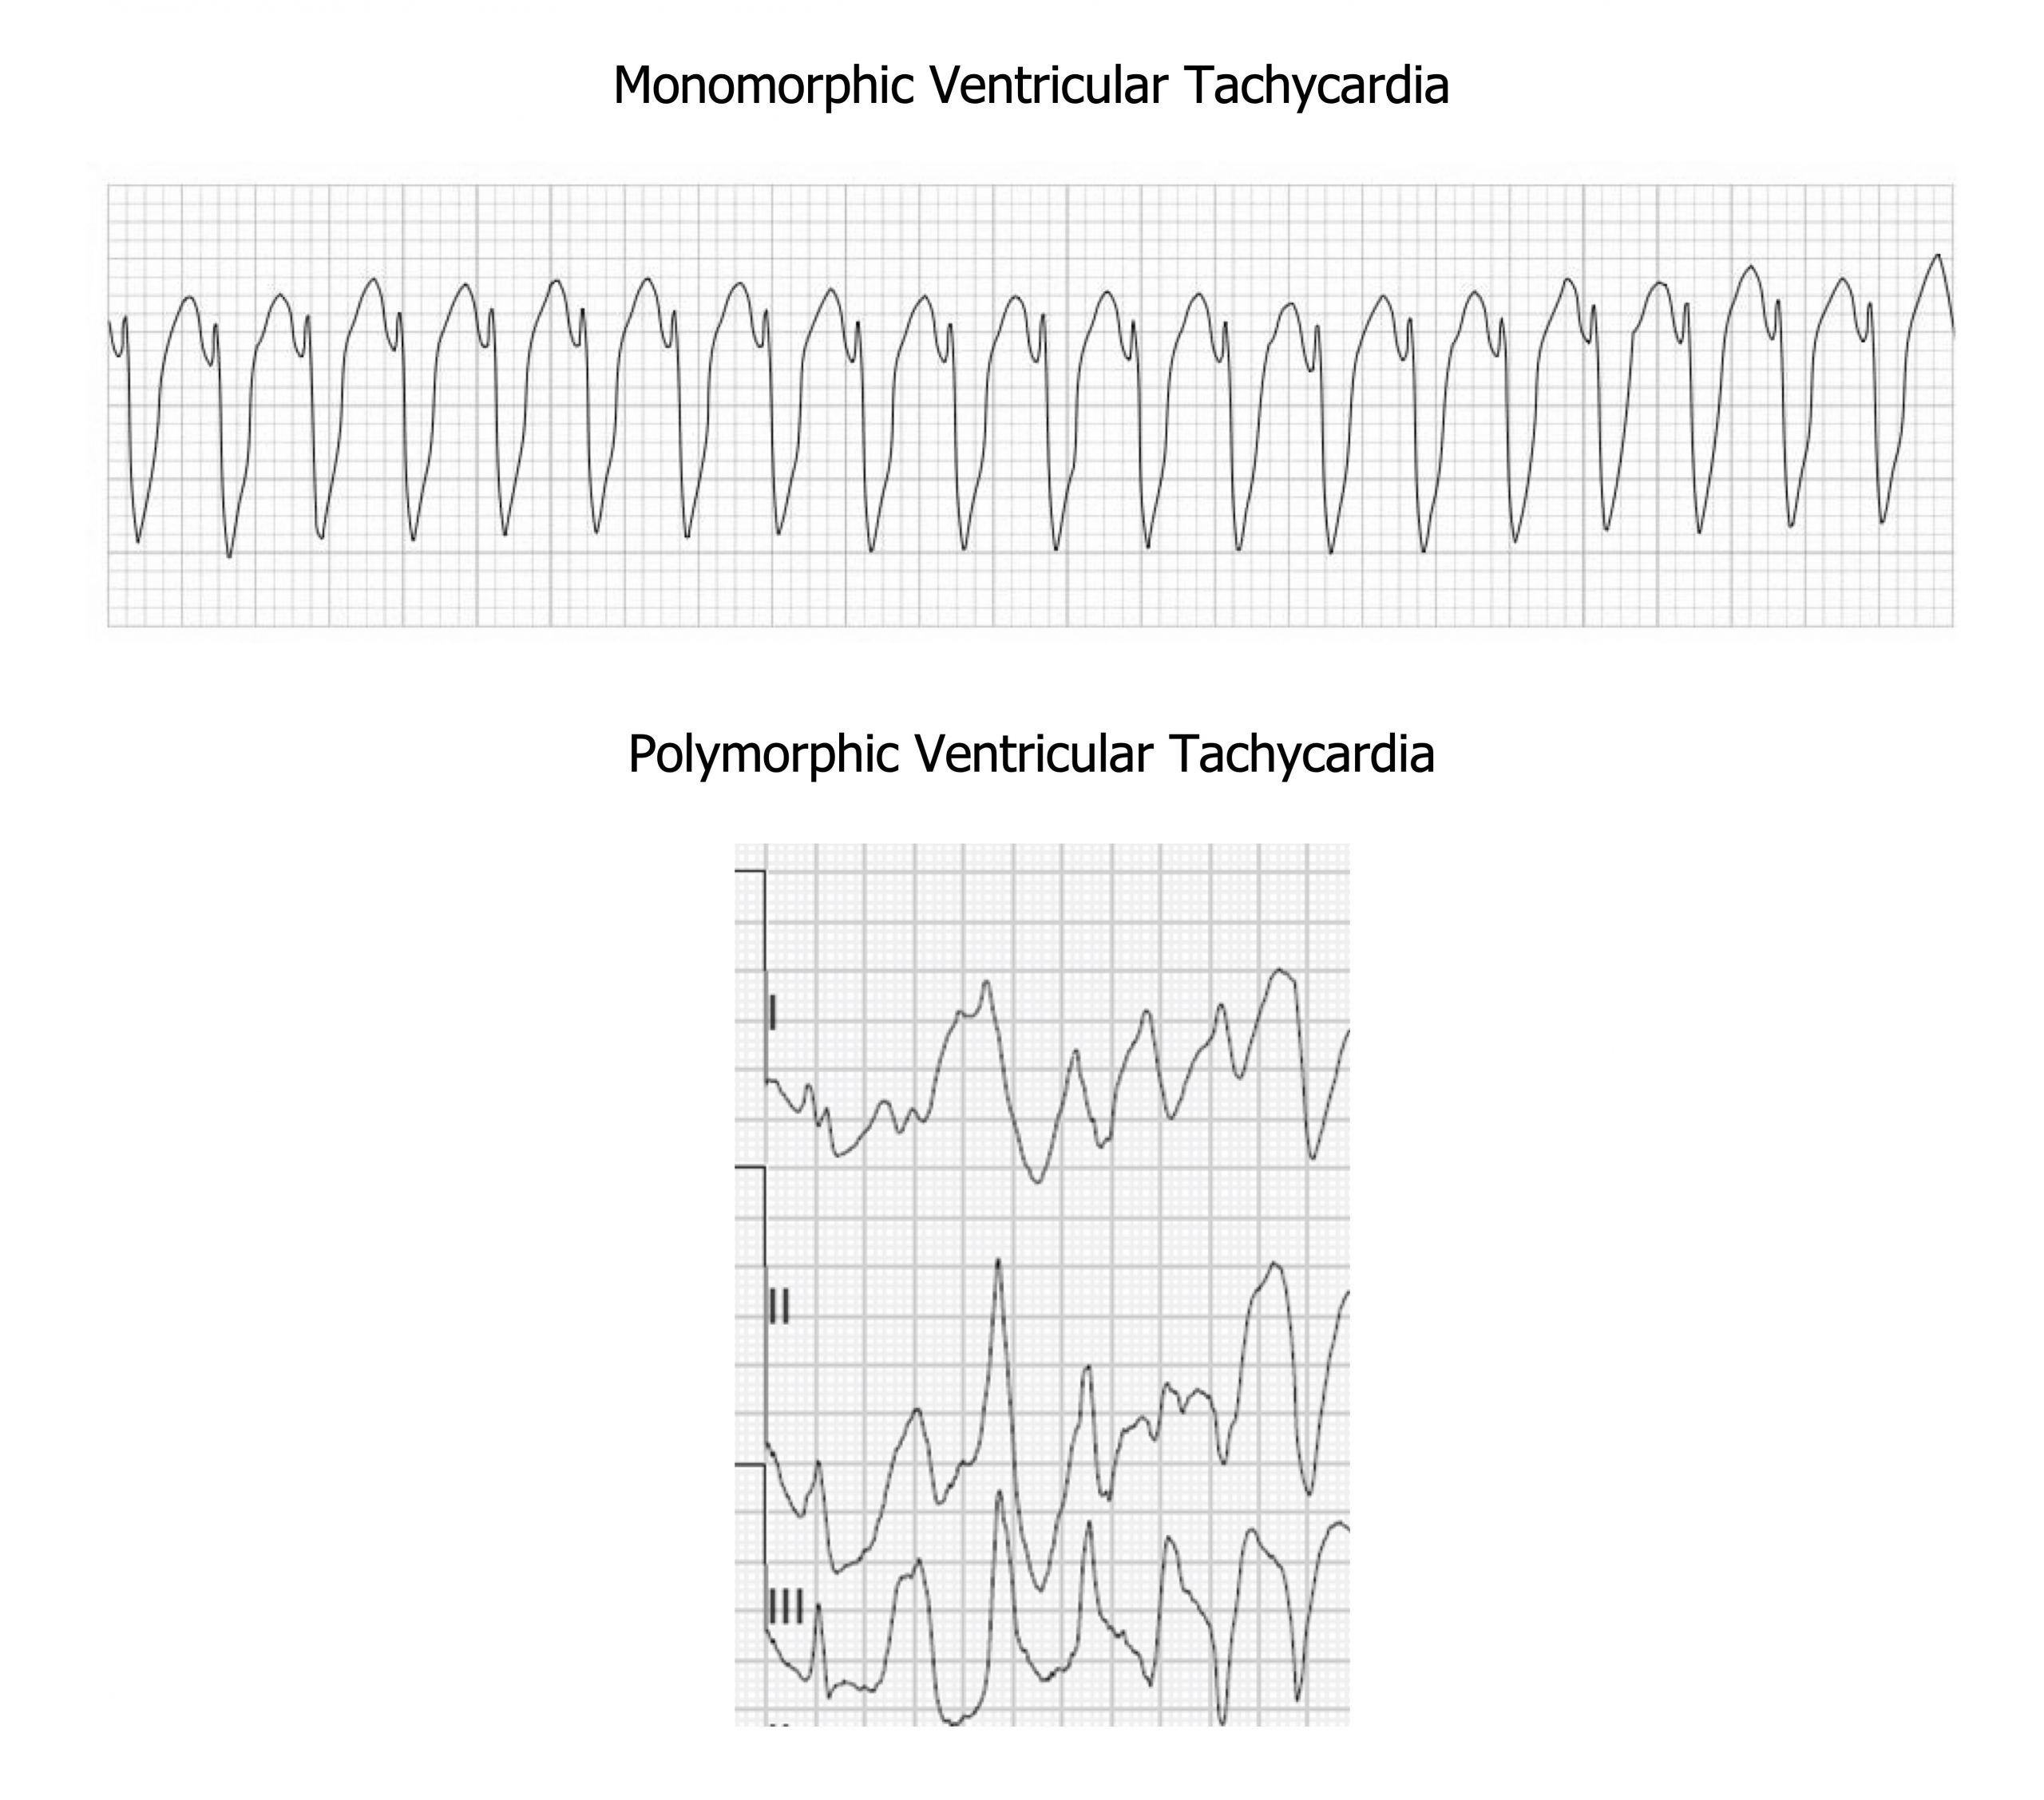
VT can be monomorphic or polymorphic (figure 1.7). The QRS complexes in monomorphic VT have the same shape and are symmetrical because they start in the same place in the myocardium. Polymorphic VT has a variable QRS shape because the depolarizations are instigated at multiple points. An electrophysiologist can describe the location(s) within the ventricles from where the VT originates using the shape(s) of the QRS complexes.
Torsades de pointes (twist of peaks) is a form of VT with multiple QRS morphologies. The twist references the undulating amplitude of the QRS complexes that twist around the isoelectric line, giving the ECG the appearance of a twisted ribbon (figure 1.8).
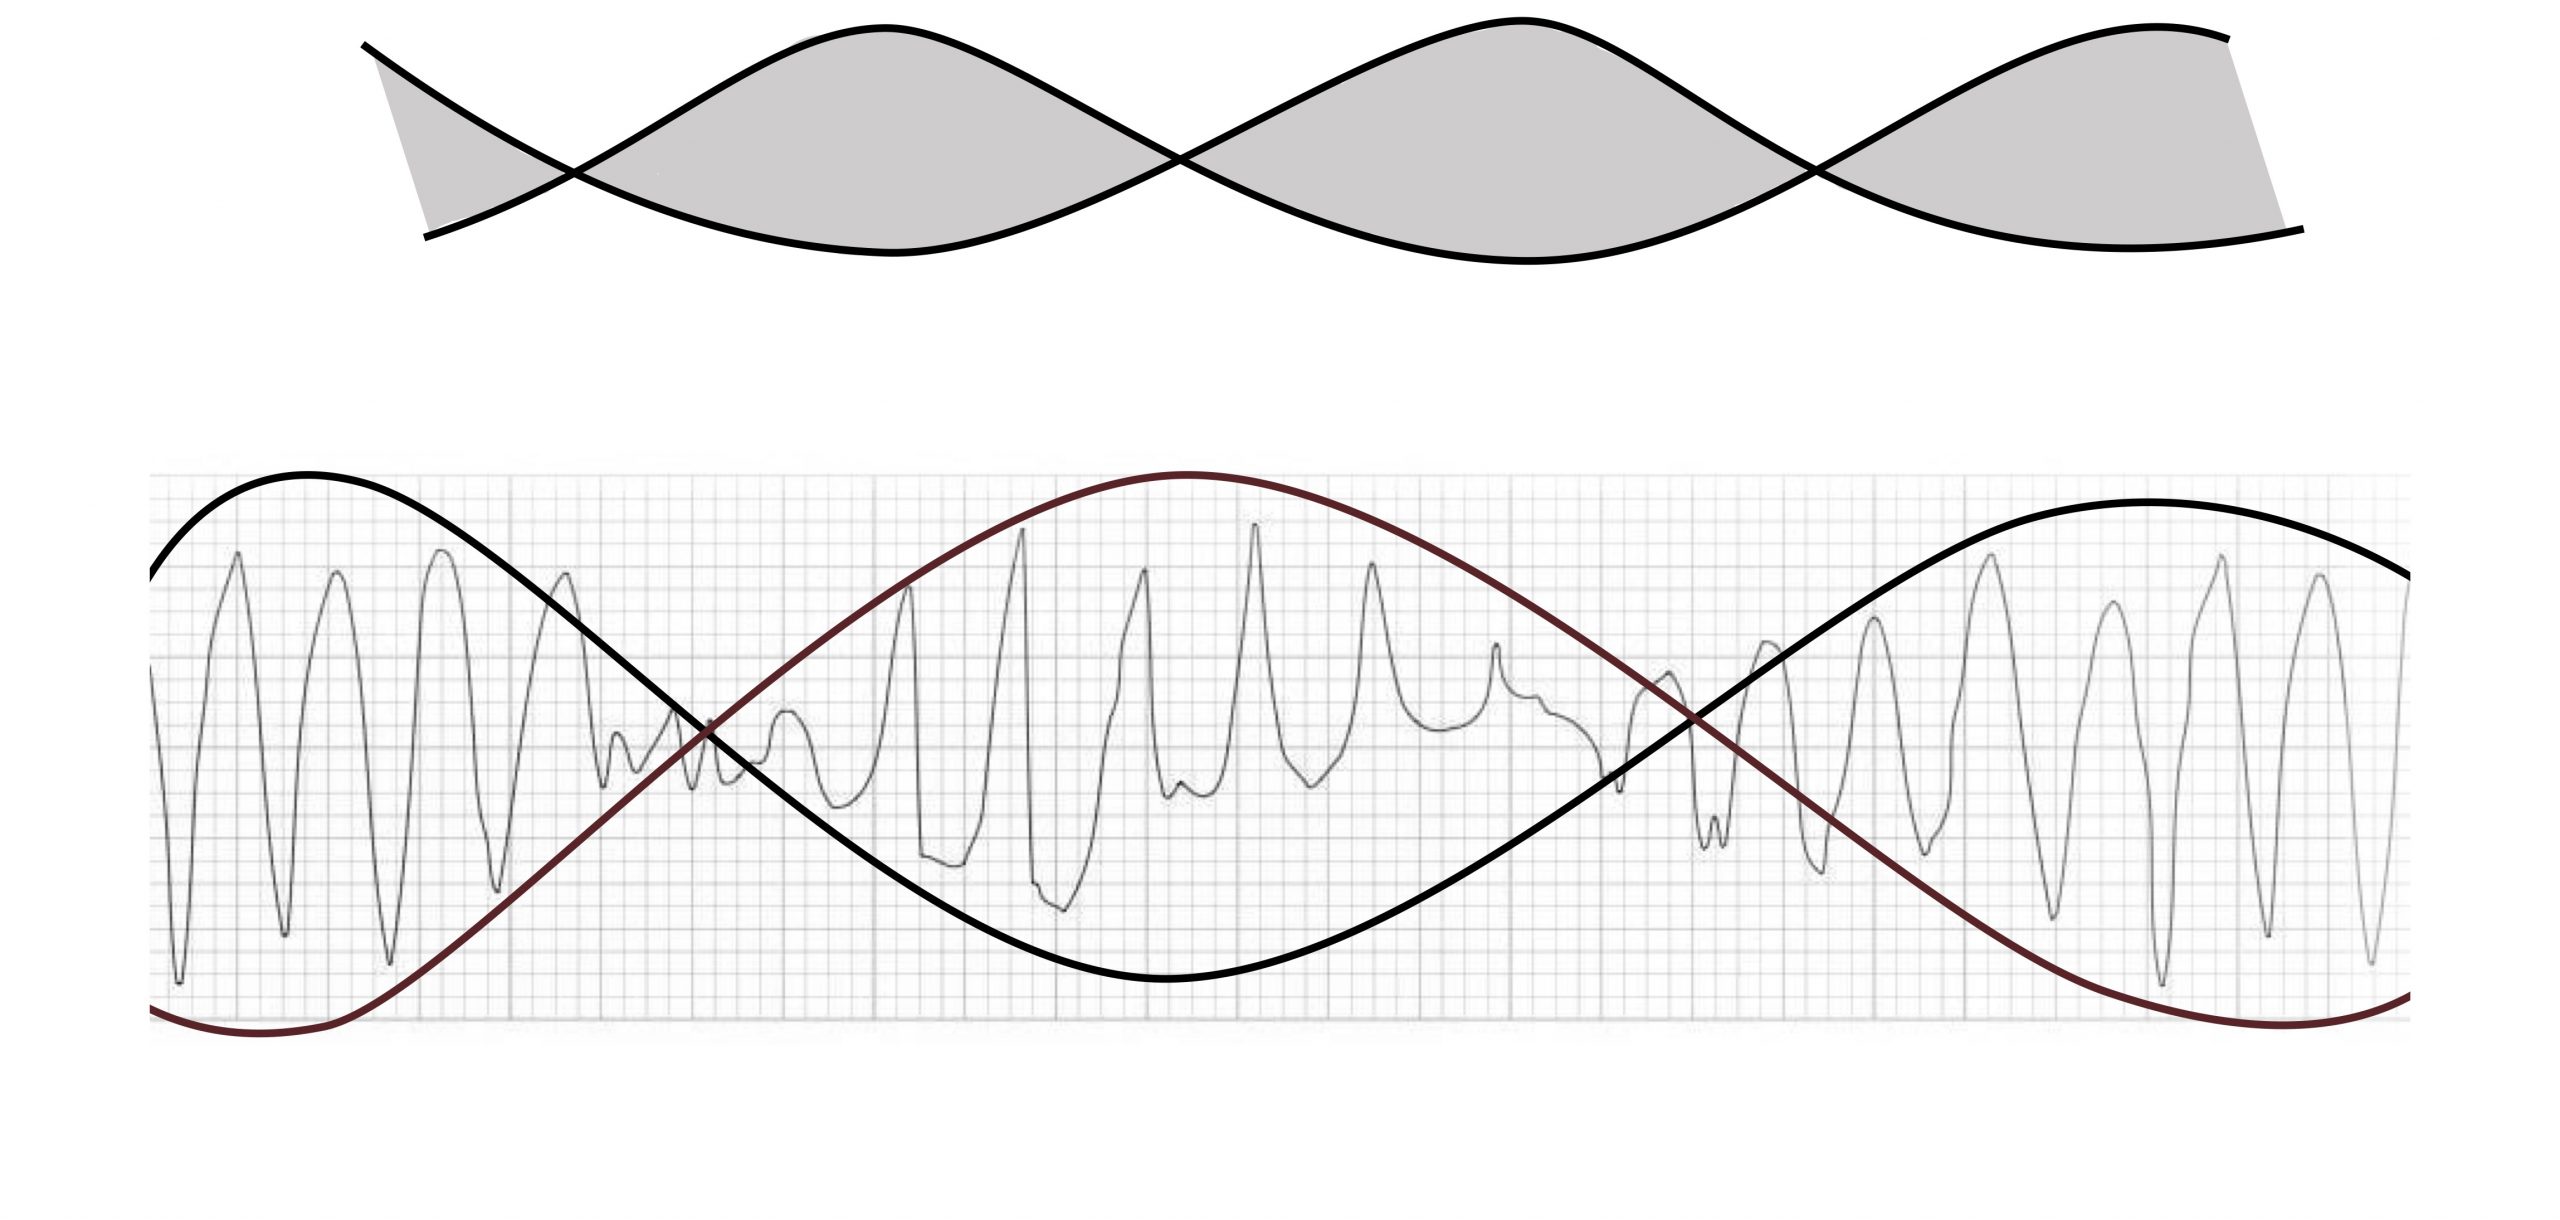
Torsades de pointes is associated with a prolonged QT interval (>600 msecs) that helps distinguish it from other forms of polymorphous VT. The longer QT interval can be caused by ionic abnormalities that reduce the repolarizing current of Phase 3 of the cardiac action potential. This makes the myocardium susceptible to early after-depolarizations—the trigger for torsades de pointes. These after-depolarizations do not happen uniformly across the myocardium and are more common in endocardial tissue where the repolarization currents are slower. So torsades de pointes arises from the after-depolarizations causing reentry currents in neighboring tissue.
Both common garden variety VTs and torsades de pointes can progress to ventricular fibrillation.
| VT summary |
|---|
| Ventricular rate >100 bpm |
| QRS complex not associated with P-wave |
| Wide QRS complex morphology |
Table 1.8: VT summary.
Ventricular Fibrillation
Ventricular fibrillation (VF) occurs when the ventricular rate exceeds 400 bpm. The disorganized and uncoordinated contraction of the myocardium causes cardiac output to fall to catastrophic levels. Rates of survival for out-of-hospital VF are low.
There are a number of instigating events, but coronary artery disease and resultant myocardial ischemia or tissue scarring are the most common. The onset of VF may be preceded by other changes in the myocardial rhythmicity, such as PVCs, ST changes, VT, or QT prolongation. The tissue damage allows formation of reentry patterns that cause the chaotic ventricular depolarization. These reentry patterns break up into multiple smaller wavelets that cause high-frequency activation of the myocytes. The result is an ECG that is chaotic (figure 1.9) and consequently a heart that has little output.
| VF summary |
|---|
| Chaotic, irregular, and varying intervals |
| No P-waves, QRS complexes, or T-waves |
| High rate |
Table 1.9: VF summary.
First-Degree Atrioventricular Block
A first-degree atrioventricular node block results from slow action potential conduction through the AV node conduction. The slowing can be due to changes in vagal tone or structural changes associated with damage or disease affecting the conductive tissue of the atria, AV node (most common), bundle of His or bundle branches, and Purkinje system. It takes longer for the action potential to reach the ventricles, so P and R appear further apart. The P-R interval is normally between 0.12 and 0.20 seconds, but in first-degree block it exceeds 0.20 seconds (>5 small boxes; figure 1.10).
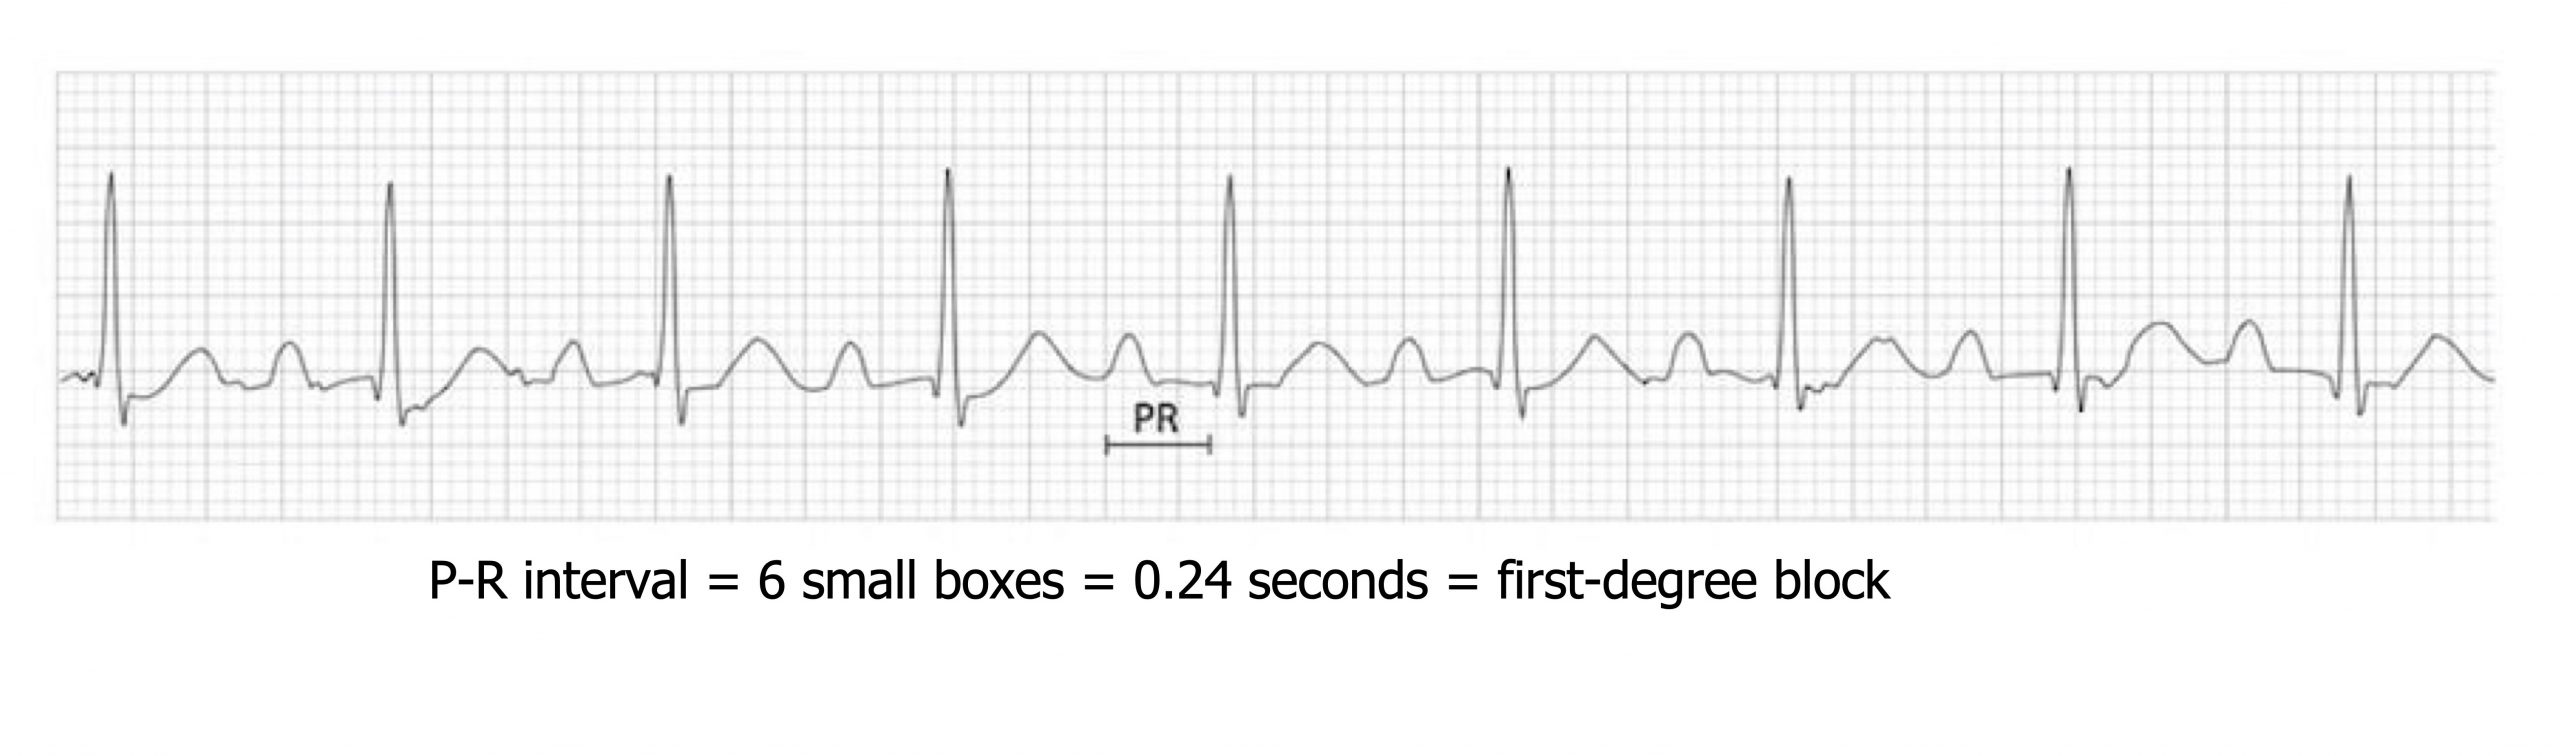
In first-degree block each P-wave is accompanied by a QRS complex (i.e., “they all get through”) (figure 1.10), which is not the case in second-degree and third-degree blocks (see below). Generally a first-degree block is asymptomatic and does not require any treatment, but long-term monitoring for worsening conduction is advisable.
| First-degree block summary |
|---|
| Prolonged P-R interval (>0.2 sec) |
Table 1.10: First-degree block summary.
Second-Degree Atrioventricular Block
A second-degree atrioventricular block also has changes in P-R interval, but it starts to show failure of the P-wave to propagate a QRS complex every time (i.e., intermittently the depolarization fails to reach the ventricles). The pattern of missed ventricular depolarizations, or blocked P-waves, is often very regular and described as a ratio of P-waves to QRS complex. The way in which the P-R interval changes in relation to the blocked P-waves produces subclassifications of second-degree blocks, Mobitz I and II.
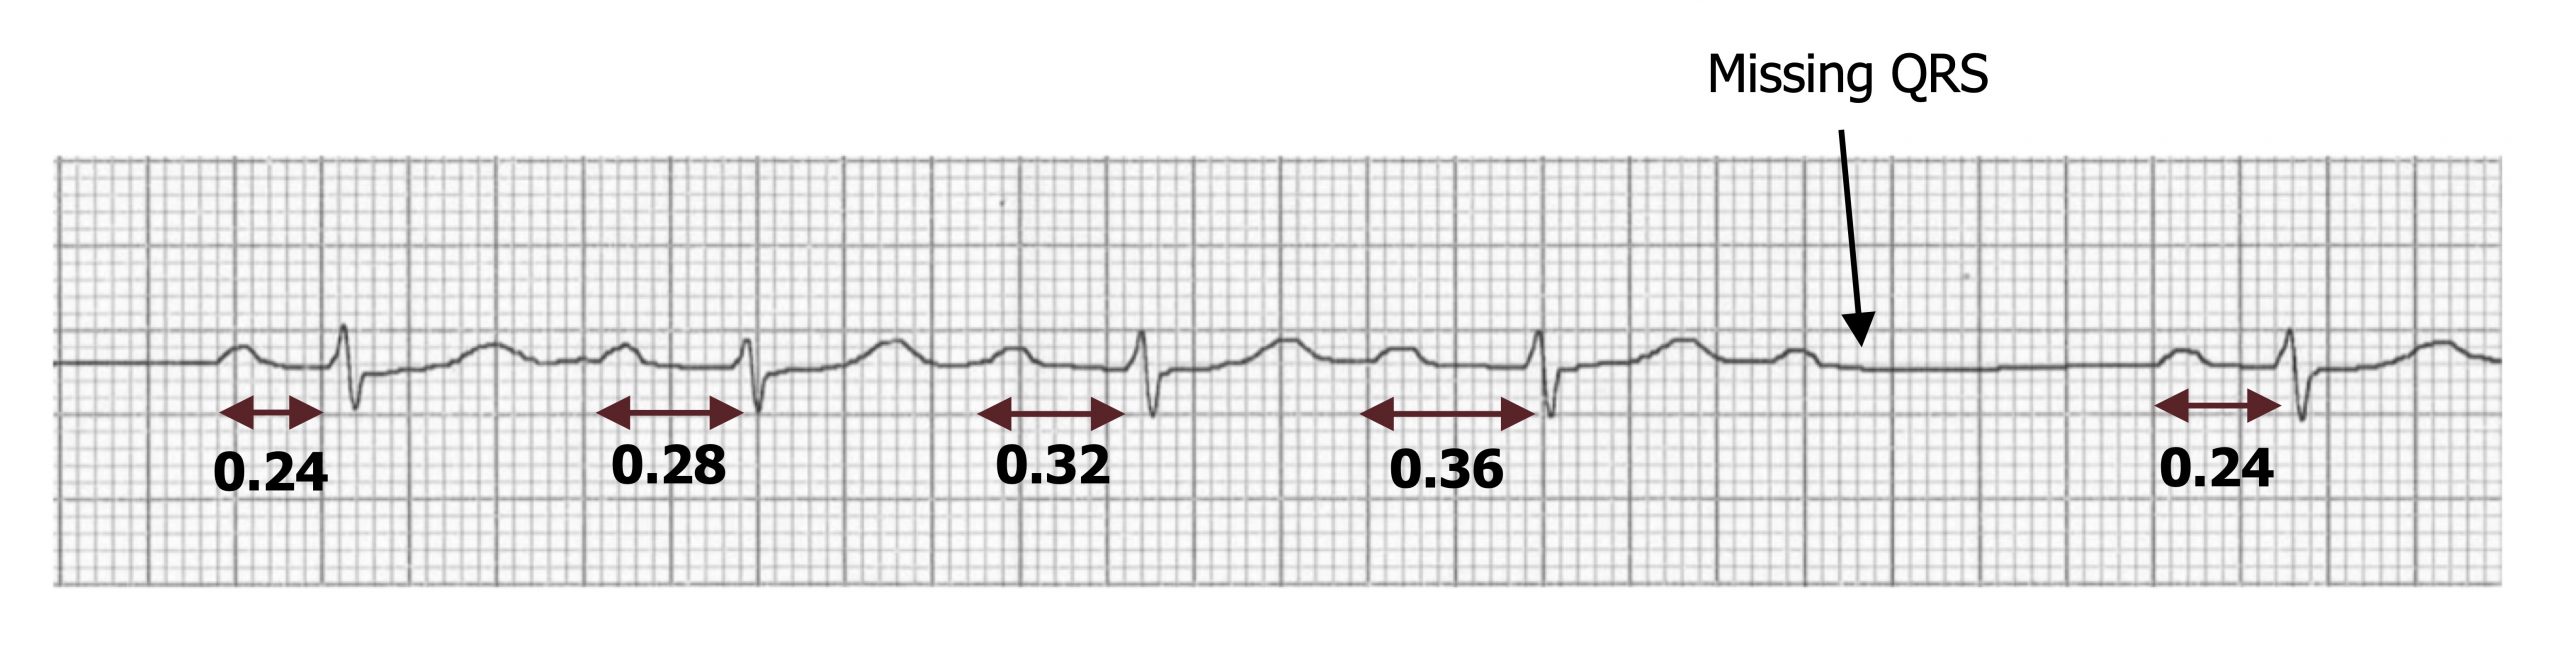
Mobitz I (or Wenckebach)—The P-R interval progressively lengthens until a P-wave is missed and then goes back to its original length (figure 1.11). So P-R is longest before the dropped QRS complex and shortest immediately after it. This progressive difficulty in traversing the AV node is reflective of the node becoming increasingly refractory.
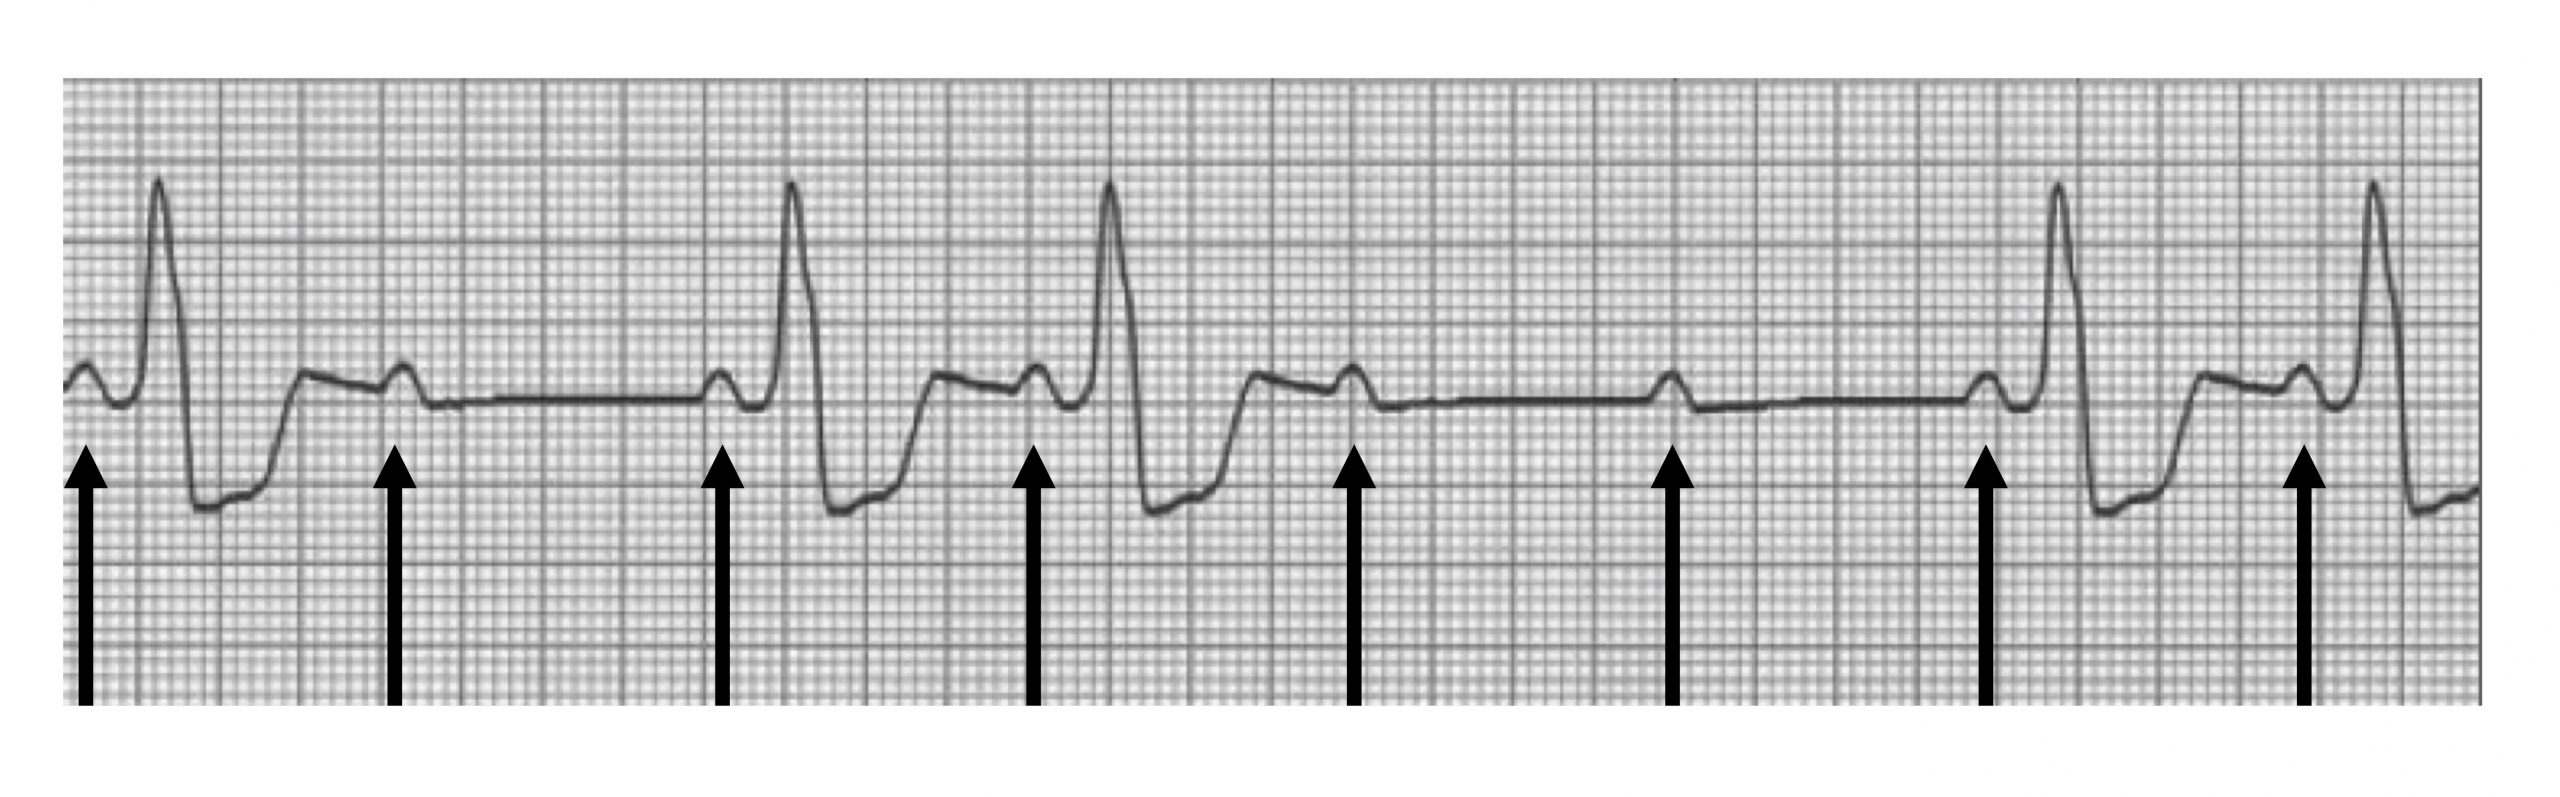
Mobitz II has blocked P-waves as well, but the P-R interval remains unchanged, and the P:QRS ratio appears in a fixed pattern (figure 1.12). This is a rarer and more serious condition and usually involves problems with the conduction system below the AV node, most commonly in the bundle branches. What can frequently been seen is a widening of the QRS complex that are generated.
| Second-degree block summary |
|---|
| Prolonged P-R interval (>0.2 sec) |
| Intermittently blocked P-waves |
| Variable (Mobitz I) or stable (Mobitz II) |
Table 1.11: Second-degree block summary.
Third-Degree Atrioventricular Block
A third-degree atrioventricular block is where no action potentials pass through the AV node, hence it is often called “complete heart block”. This is usually because of damage (e.g., ischemia) or disease (e.g., Lyme disease, sarcoidosis) affecting the AV node. In a third-degree atrioventricular block, no P-waves have associated QRS complexes. Without any descending control by the SA node pacemakers, the ventricular pacemaker cells are finally free to rule the ventricles (insert maniacal laughter). Consequently P-waves and QRS complexes are completely unrelated to each other, and this is termed “AV dissociation.” The ECG (figure 1.13) reflects this with P-waves occurring at an SA node rate (~75 bpm with parasympathetic tone) and the ventricles depolarizing at between thirty and fifty times per minute, depending on which ventricular tissue acts as pacemaker.
| Third-degree block summary |
|---|
| P-waves and QRS complexes dissociated |
Table 1.12: Third-degree block summary.
Left Bundle Branch Block
A left bundle branch block (LBBB) is generated when the conductivity of the His-Purkinje system in the left ventricle is compromised, either through damage or disease. The ECG changes, and criteria for LBBB relate to these changes in conductivity and the left-side location.
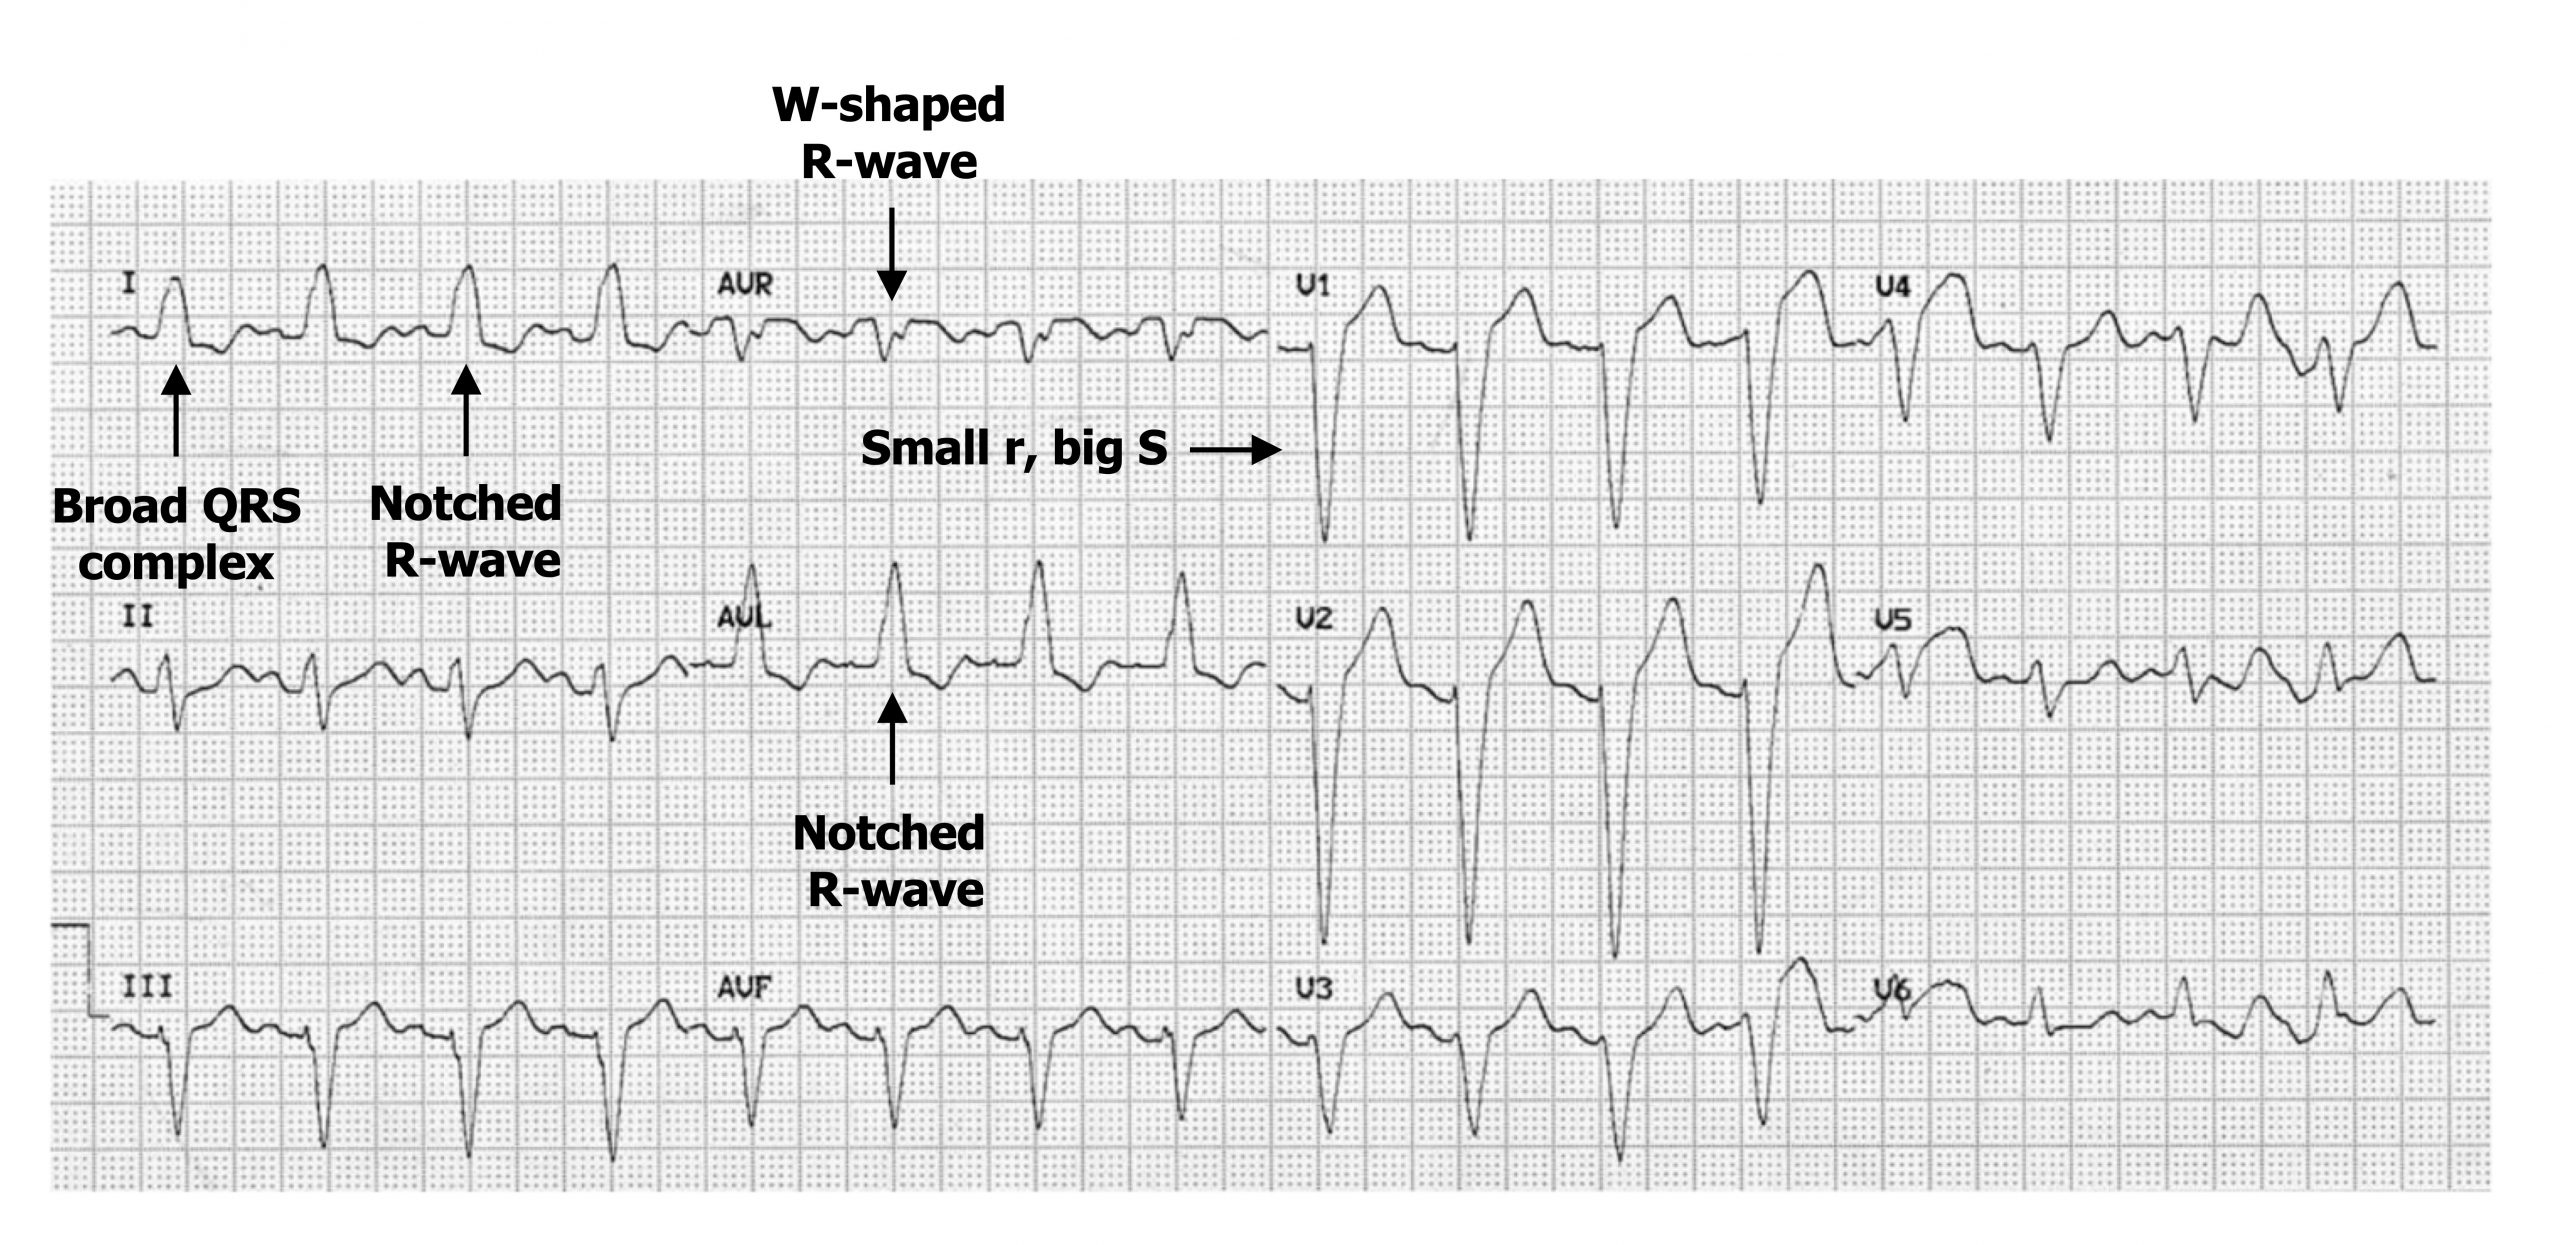
Because the normal route through conductive tissue is impaired or blocked, the depolarization has to travel through myocytes, which takes more time. Consequently, the QRS complex is wider (figure 1.14) (i.e., has a duration >120 msecs, with 80–100 msecs being normal). The slower conduction through the left ventricle means the right ventricle depolarizes first and the left last. This means the depolarization has a prominent right-then-left direction and will be moving away from lead V1, causing that lead to have a deep downward S-wave (figure 1.14).
The lateral leads (I, V5, and V6) normally show a downward deflecting Q-wave as normal septal deflection initially occurs left-to-right (i.e., away from the lateral leads). In LBBB the change in direction to right-to-left, plus the longer duration, eliminates the Q-wave from the lateral leads, and Q-waves will be small in aVL.
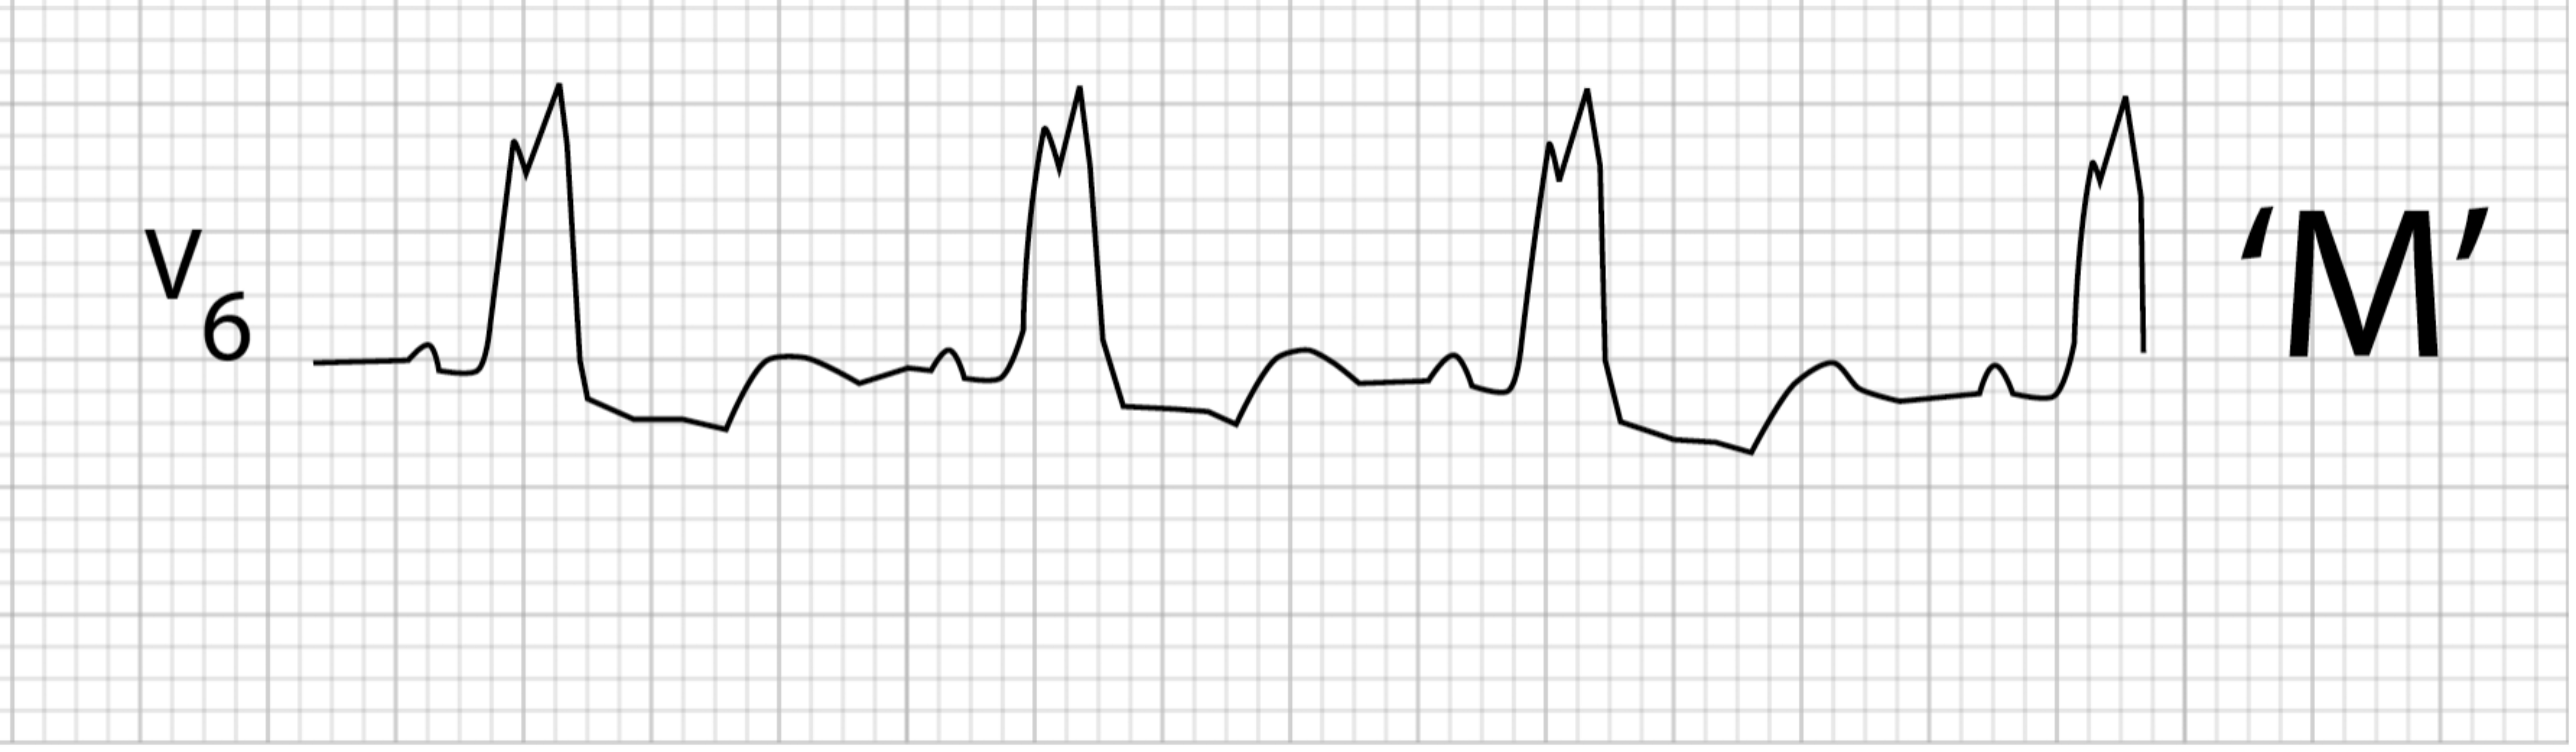
The R-wave in the lateral leads may also change morphology when there is a distinct separation of right and then left ventricular depolarization. This manifests as an M-shaped R-wave (figure 1.15) or a notched R-wave in the lateral leads (figure 1.14).
Conversely a W-shaped R-wave may occur in leads facing the opposite direction (e.g., aVR) (figure 1.14).
| LBBB summary (also see figure 1.14) |
|---|
| QRS complex >120 msecs |
| Dominant S-wave in V1 |
| Absence of Q-waves in lateral leads |
Table 1.13: LBBB summary.
Right Bundle Branch Block
The causes and manifestations of a right bundle branch block (RBBB) bear some similarities to those described for LBBB, but of course this time its depolarization of the right ventricle is delayed. Causes of RBBB include ischemic heart disease again as well as other myocardial diseases, but pulmonary issues such as pulmonary embolism and cor pulmonale can be added to the list.
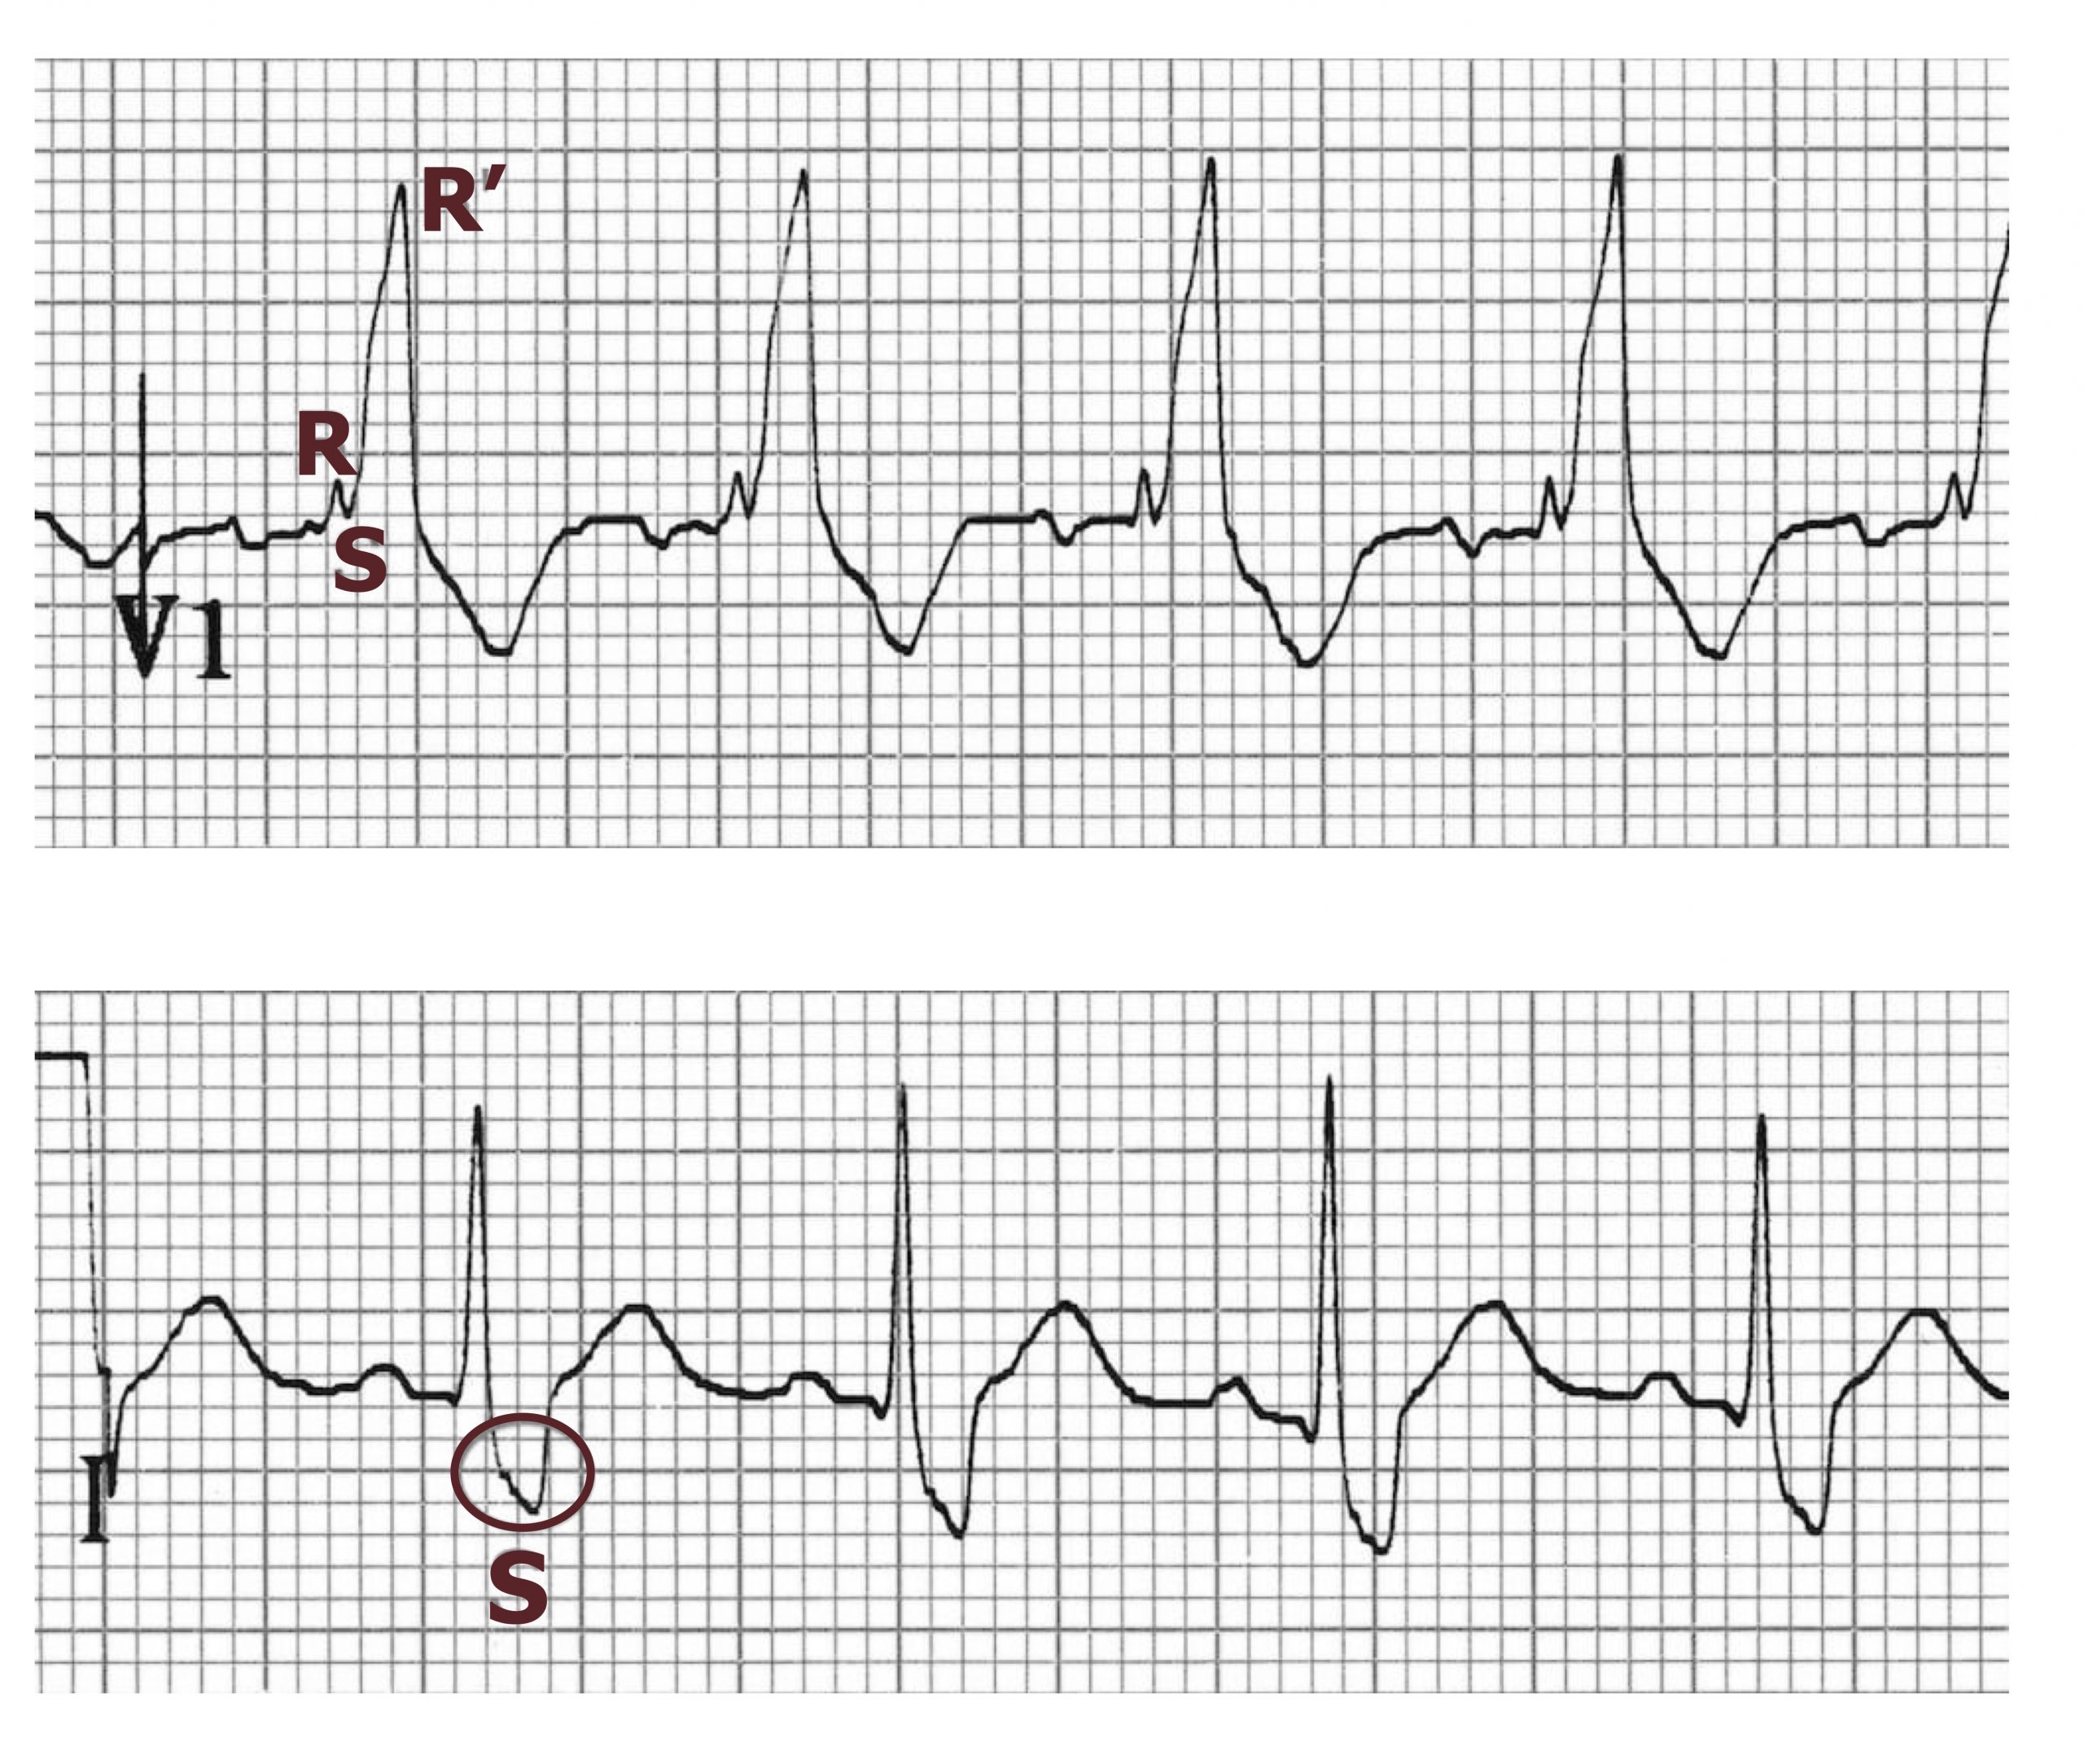
Again the QRS complex becomes broad (>120 msecs) because of the slower conduction through ventricular myocytes. However, the delayed activation of the right ventricle causes a secondary R-wave (RSR’) to occur in the right precordial leads (V1–V3) and a slurred S-wave in the lateral leads (I, aVL, and frequently V5 and V6) (figure 1.16).
| RBBB summary |
|---|
| QRS complex >120 msecs |
| RSR’ pattern in V1–V3 |
| Slurred S-wave in lateral leads |
Table 1.14: RBBB summary.
Wolff-Parkinson-White Syndrome
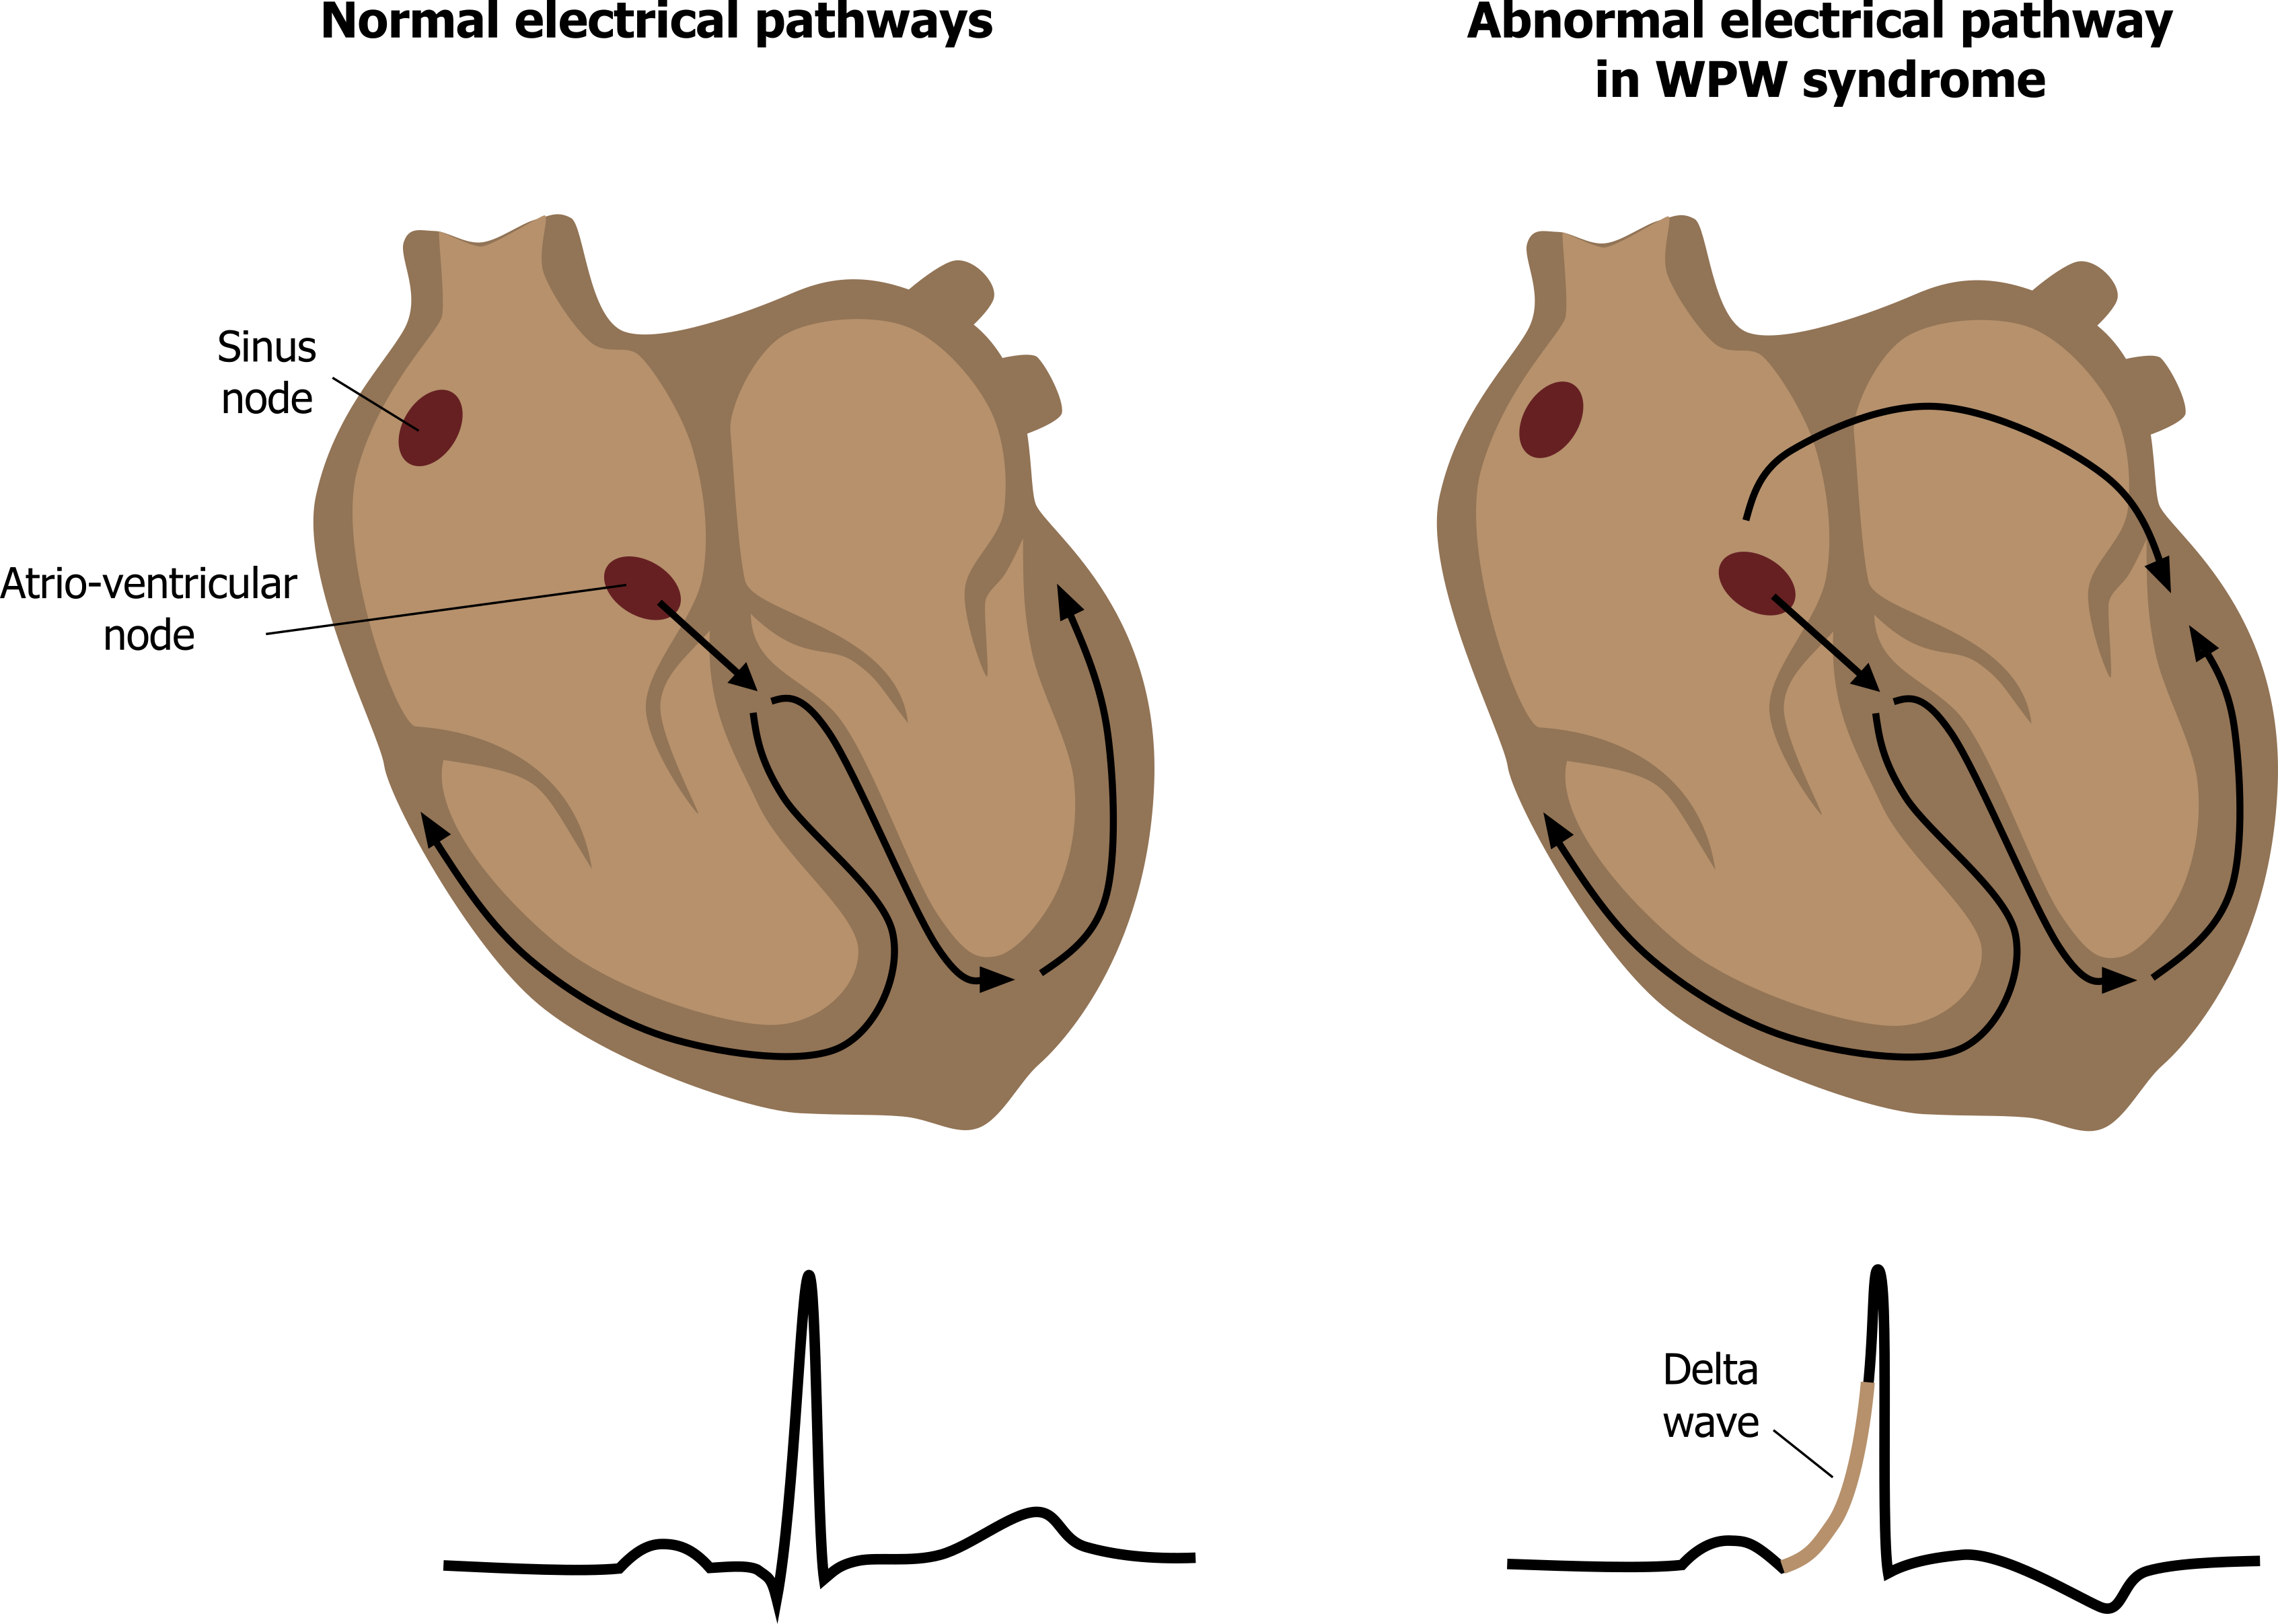
Normally the only electrical connection between the atria and the ventricles is the AV node. Otherwise the fibrous skeleton of the heart electrically insulates the atria from the ventricles. In Wolff-Parkinson-White (WPW) syndrome, that insulation is incomplete, and an “accessory pathway” connects the electrical system of the atria directly to the ventricles. If you think of the AV node as a bridge over the fibrous wall with regulated access, the accessory pathway is like a pathological tunnel under it with no regulation.
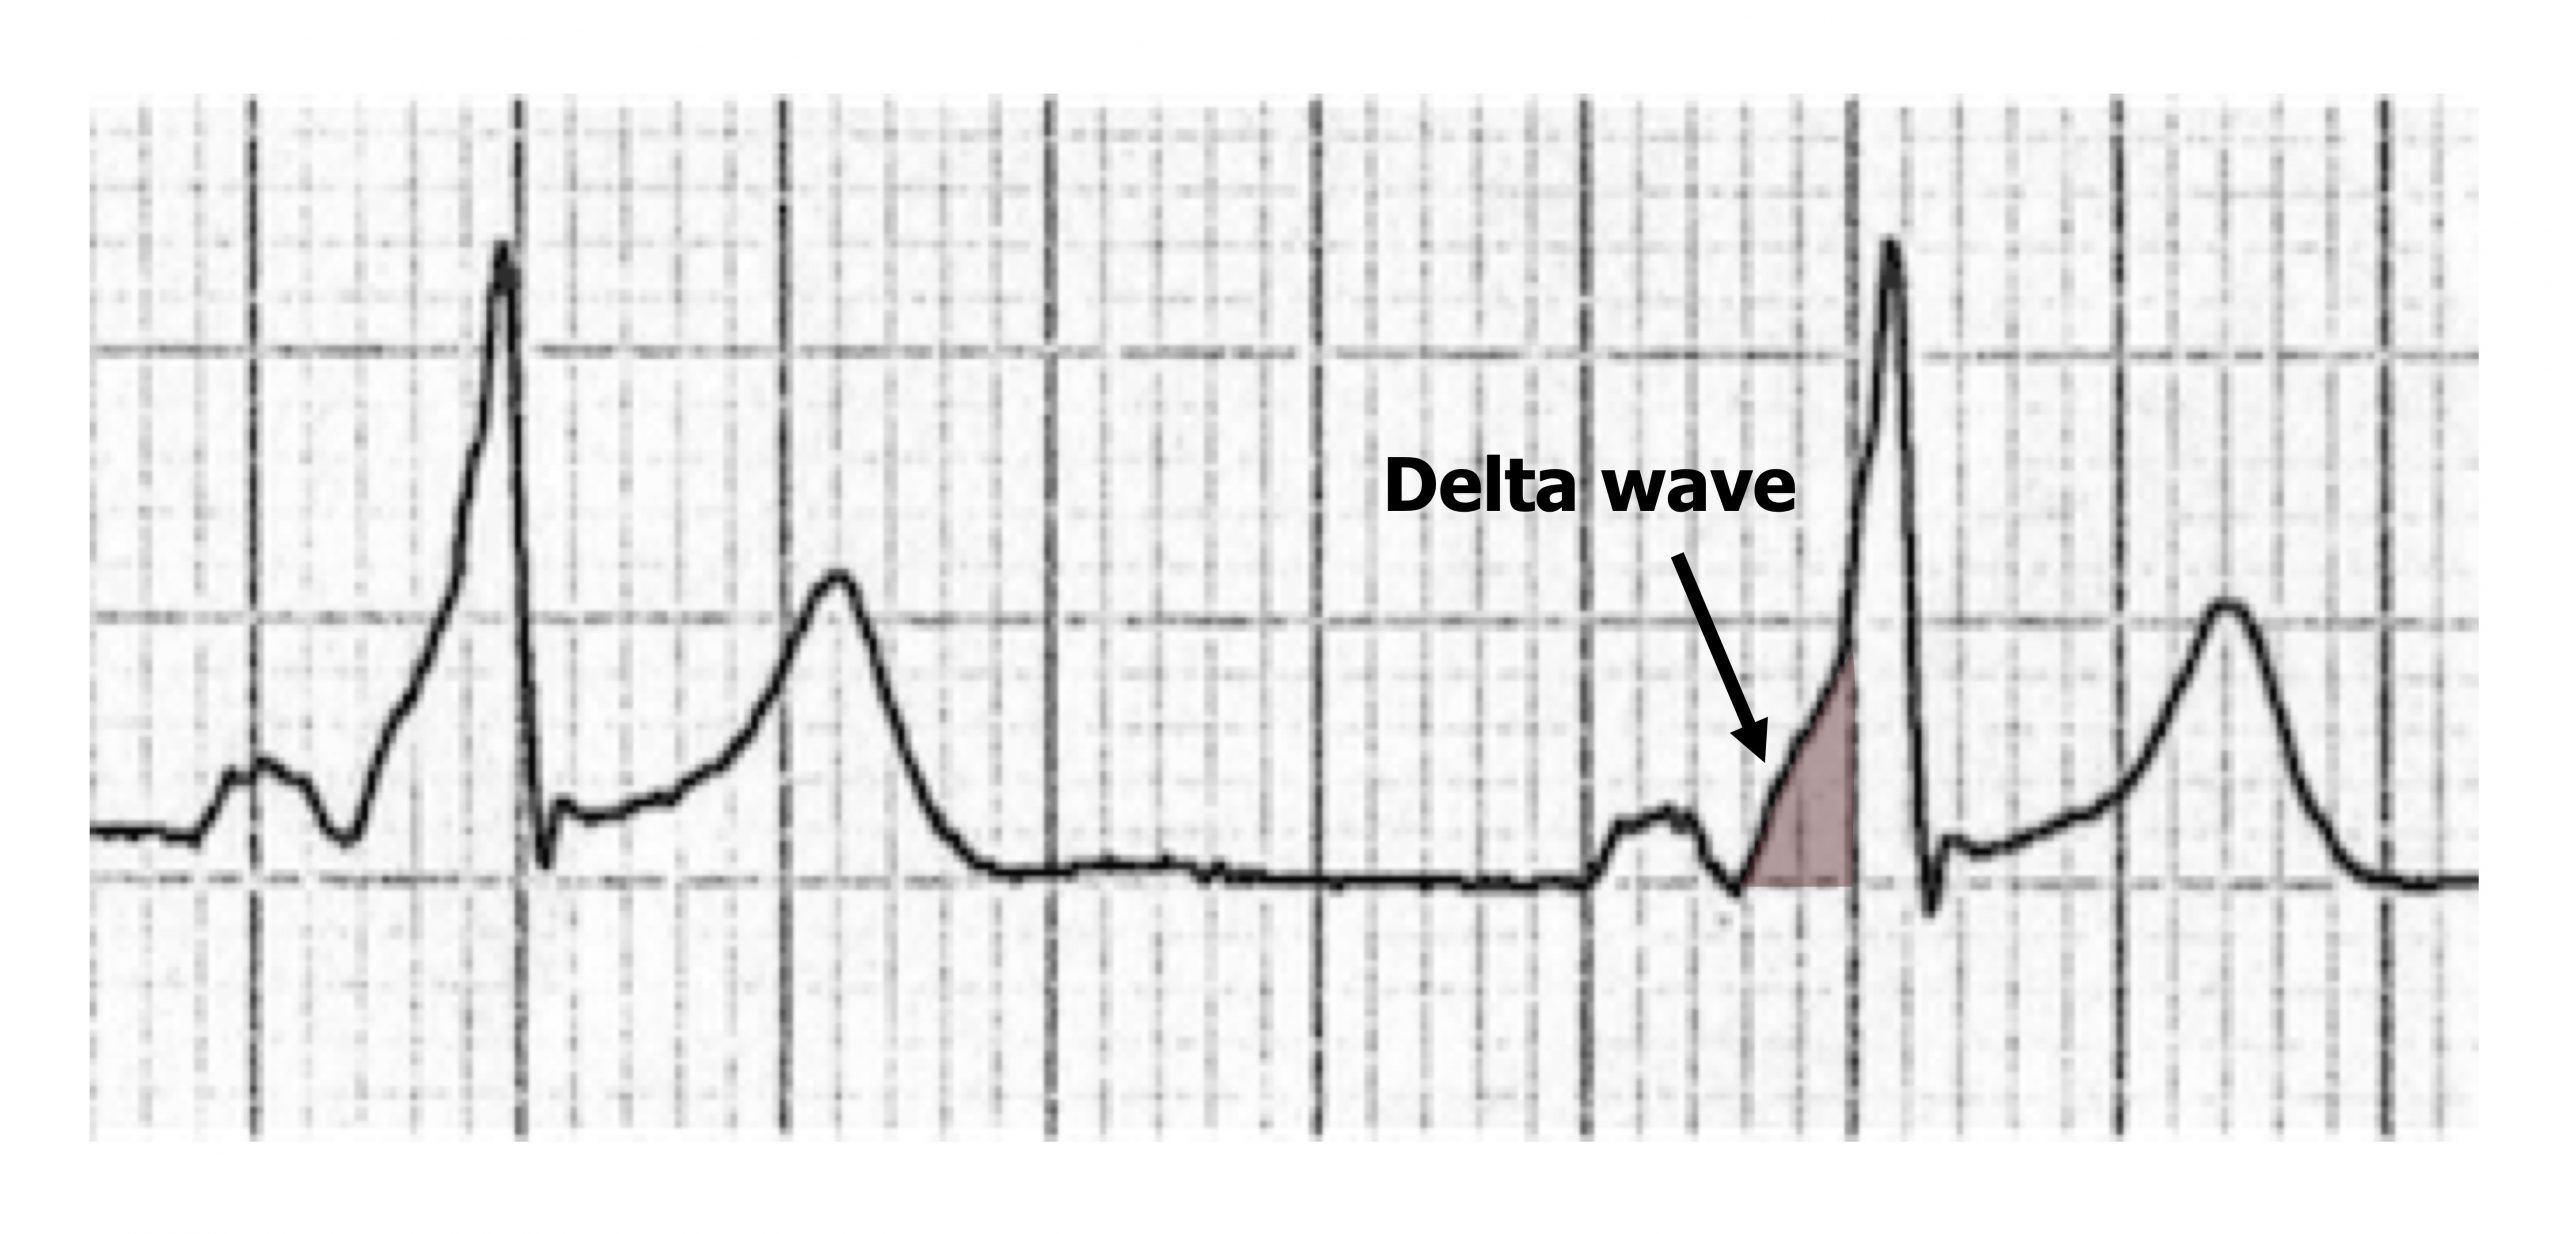
The accessory pathway provides a second route (figure 1.17) for normal sinus rhythm to pass from atrium to ventricle much more quickly (there is no AV node delay), thus the P-R interval is shortened. Because of this “preexcitation” through the accessory pathway, the ECG shows a slurring of the onset of the QRS complex, referred to as a delta wave because of its triangular shape (figure 1.18).
WPW syndrome is often asymptomatic, and patients do not require immediate treatment. However, if atrial fibrillation occurs in a WPW patient, the accessory pathway can allow the atrial fibrillation waves through to the ventricle (with no AV nodal refractory period to prevent them). Consequently a high ventricular rate is seen, and the risk of ventricular fibrillation being established means immediate clinical attention is required.
| WPW syndrome summary |
|---|
| Short P-R interval (120 msecs) |
| Delta wave slurring the onset of QRS complexes |
| Broad QRS complexes (>100 msecs) |
Figure 1.18: Delta wave of WPW syndrome.
Hyper- and Hypocalcemia
Moderate rises in extracellular levels of Ca++ (3.0–3.4 mmol/L, normal = 2.1–2.6 mmol/L) block the movement of sodium through voltage-gated sodium channels. This results in a reduced depolarization of myocytes, and consequently repolarization time is less. Raised extracellular Ca++ also changes the closing kinetics of the L-type Ca++ channels such that the plateau phase of the cardiac action potential is shortened and repolarization occurs earlier. These two effects manifest as the most common ECG finding of short QT intervals, mainly through shortening of the ST segment (figure 1.19).
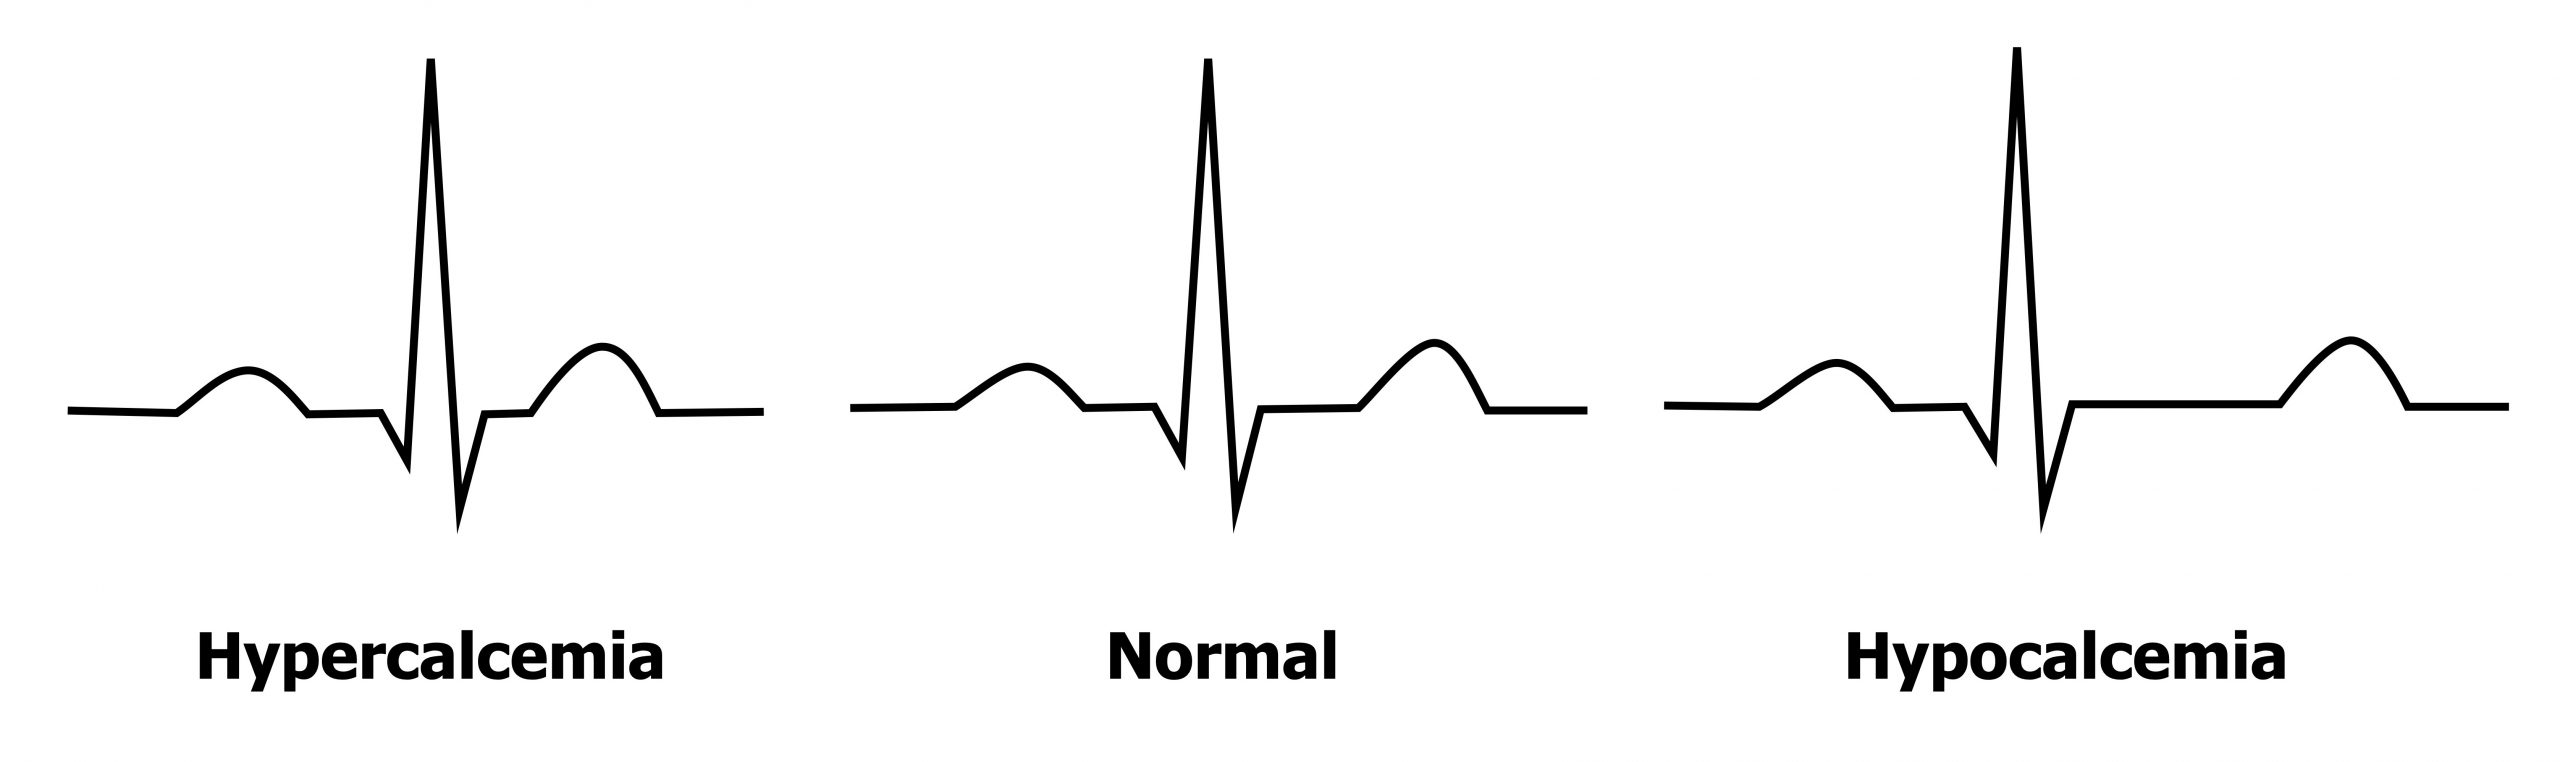
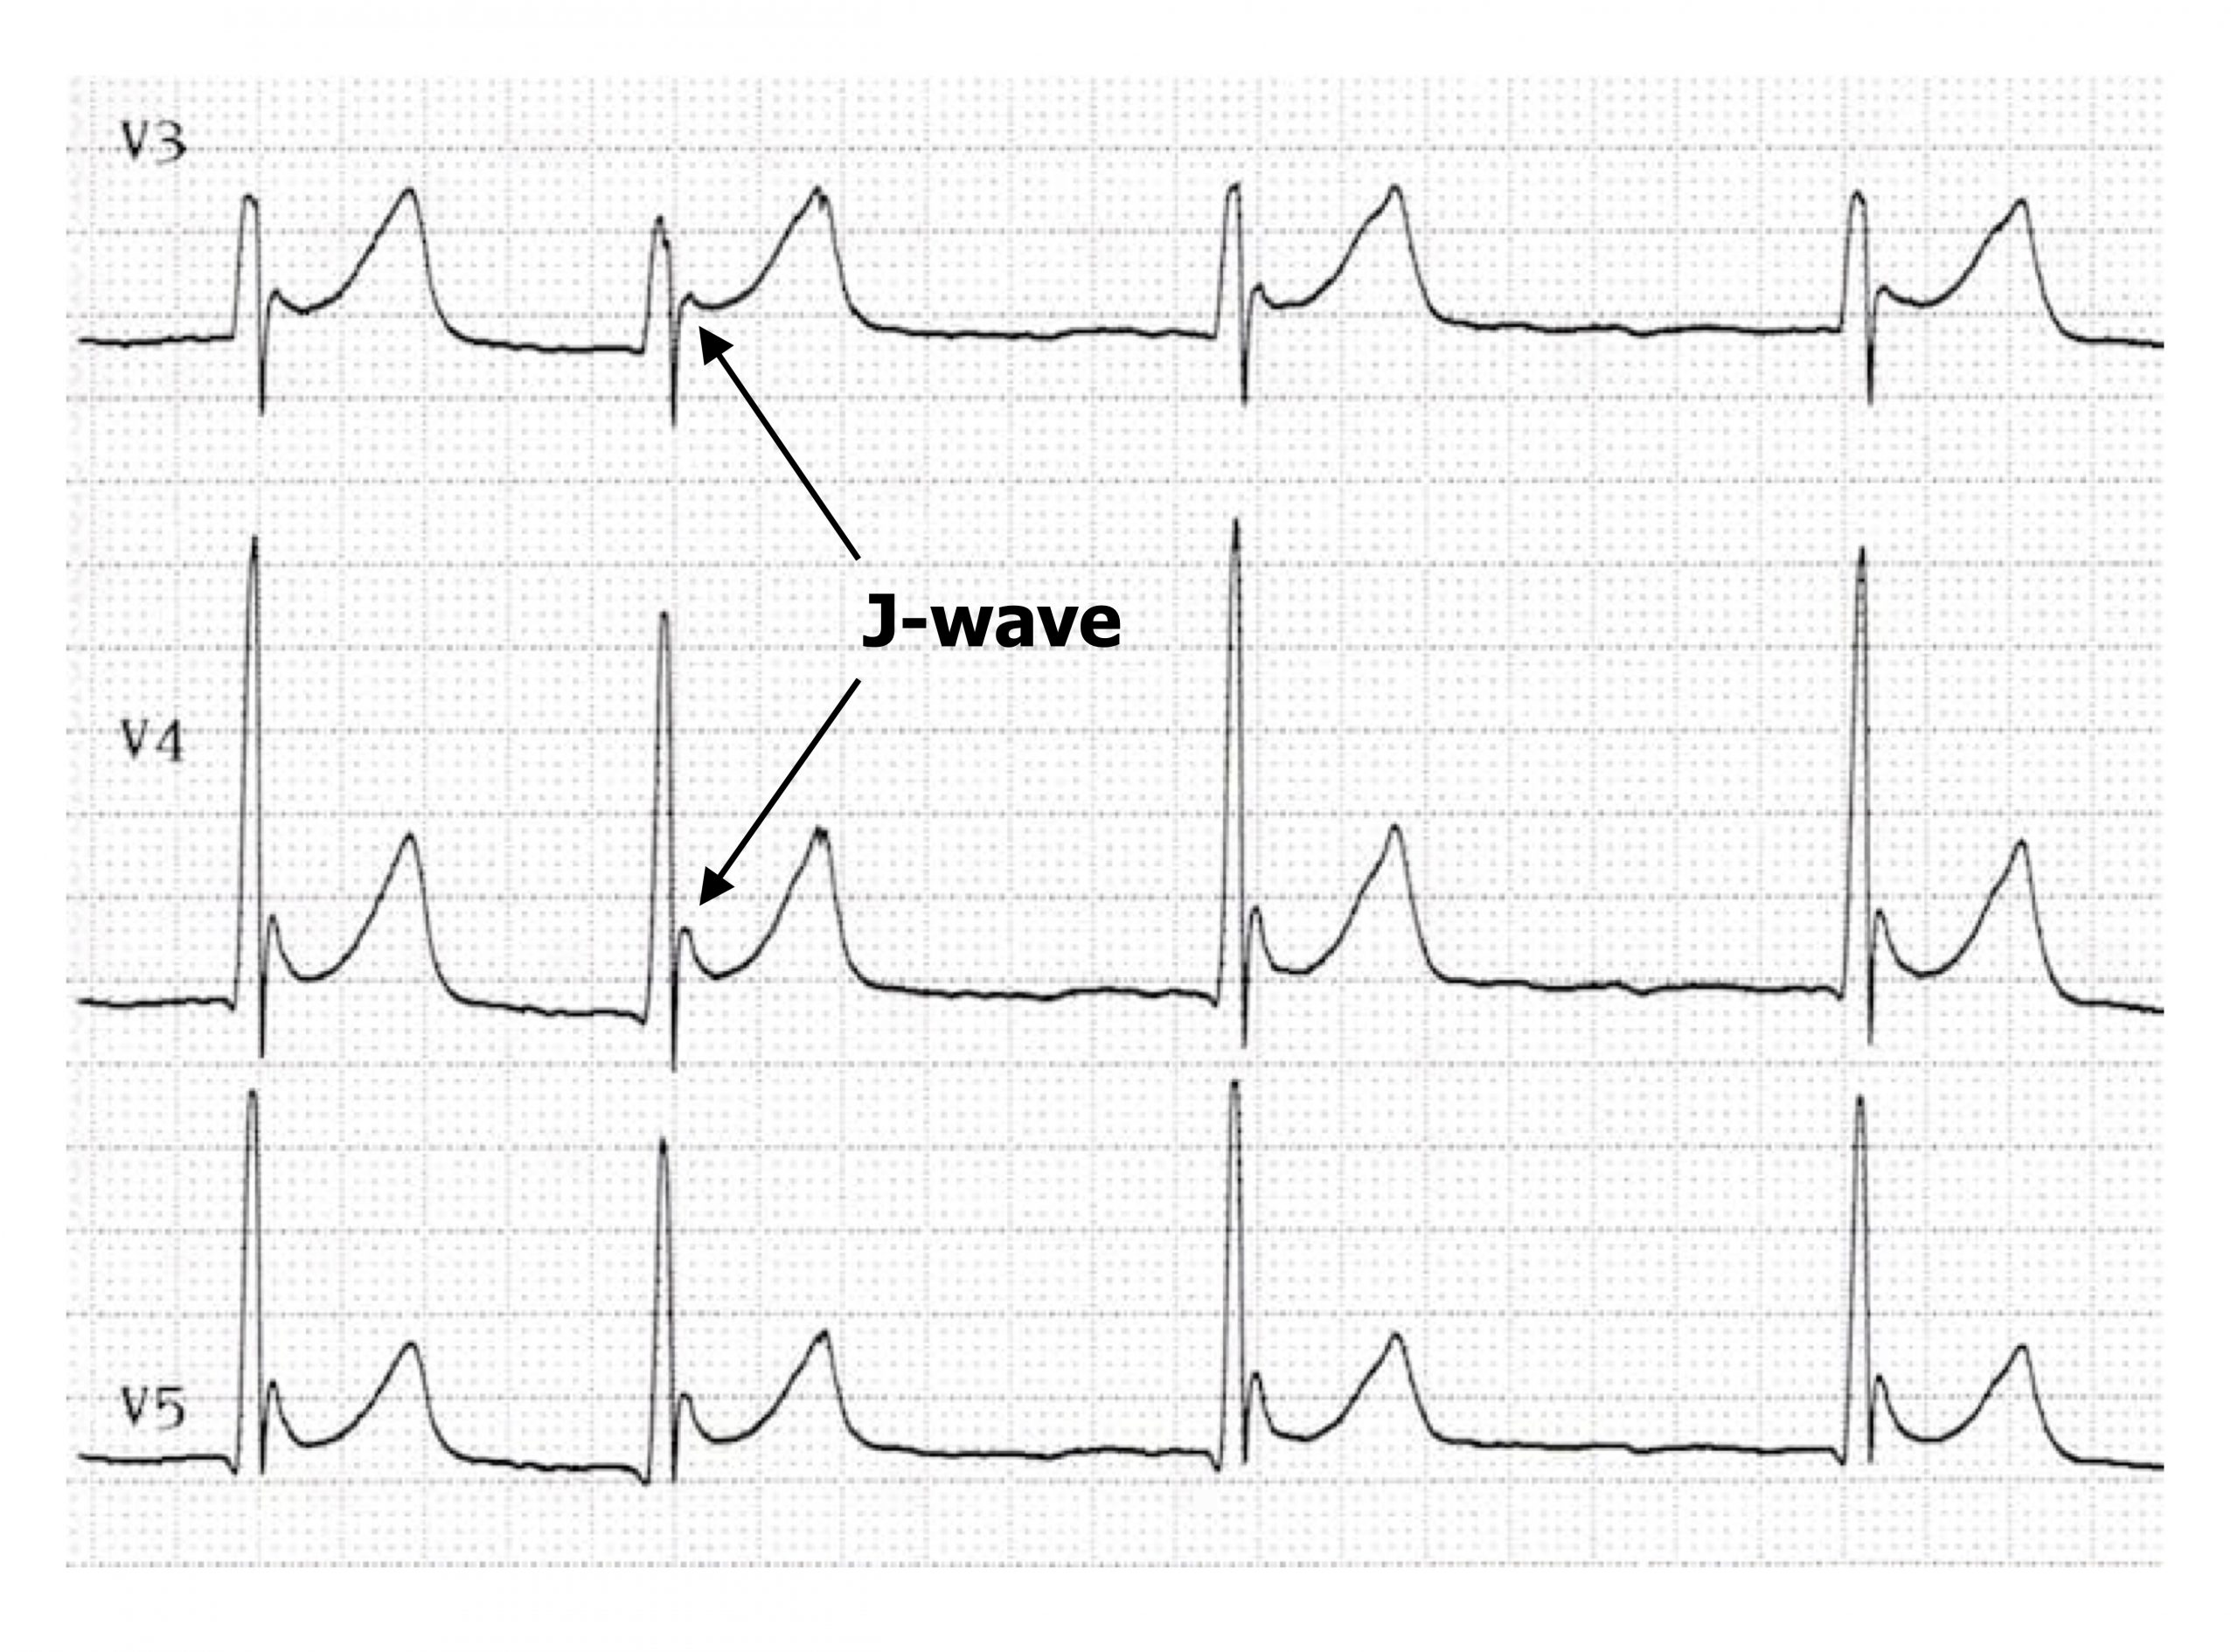
If hypercalcemia becomes severe (>3.4 mmol/L) then Osborne waves (or J-waves) may be seen—an extra wave seen at the J-point of the ECG (the R-ST junction). The pathophysiology of the J-wave (figure 1.20) is poorly understood, but it is likely caused by an early repolarization of the epicardium—think of it as a chunk of early T-wave. (The other common cause of J-waves is hypothermia.) During hypocalcemia (<2.2 mmol/L) the opposite changes are seen in the ECG—the QT interval is prolonged, primarily due to a lengthened ST segment (figure 1.19).
| Hypercalcemia summary | Hypocalcemia Summary |
|---|---|
| Reduced ST and QT intervals | Prolonged ST and QT intervals |
| J-waves in severe hypercalcemia |
Table 1.16: Hyper- and hypocalcemia summary.
Hyper- and Hypokalemia
The pathophysiology is not as simple as changes in extracellular K+ changing the electrochemical gradient for K+. Because of potassium’s role in maintaining the resting membrane potential, shifts in extracellular potassium can also influence the activity of Na+ and Ca++ channels.
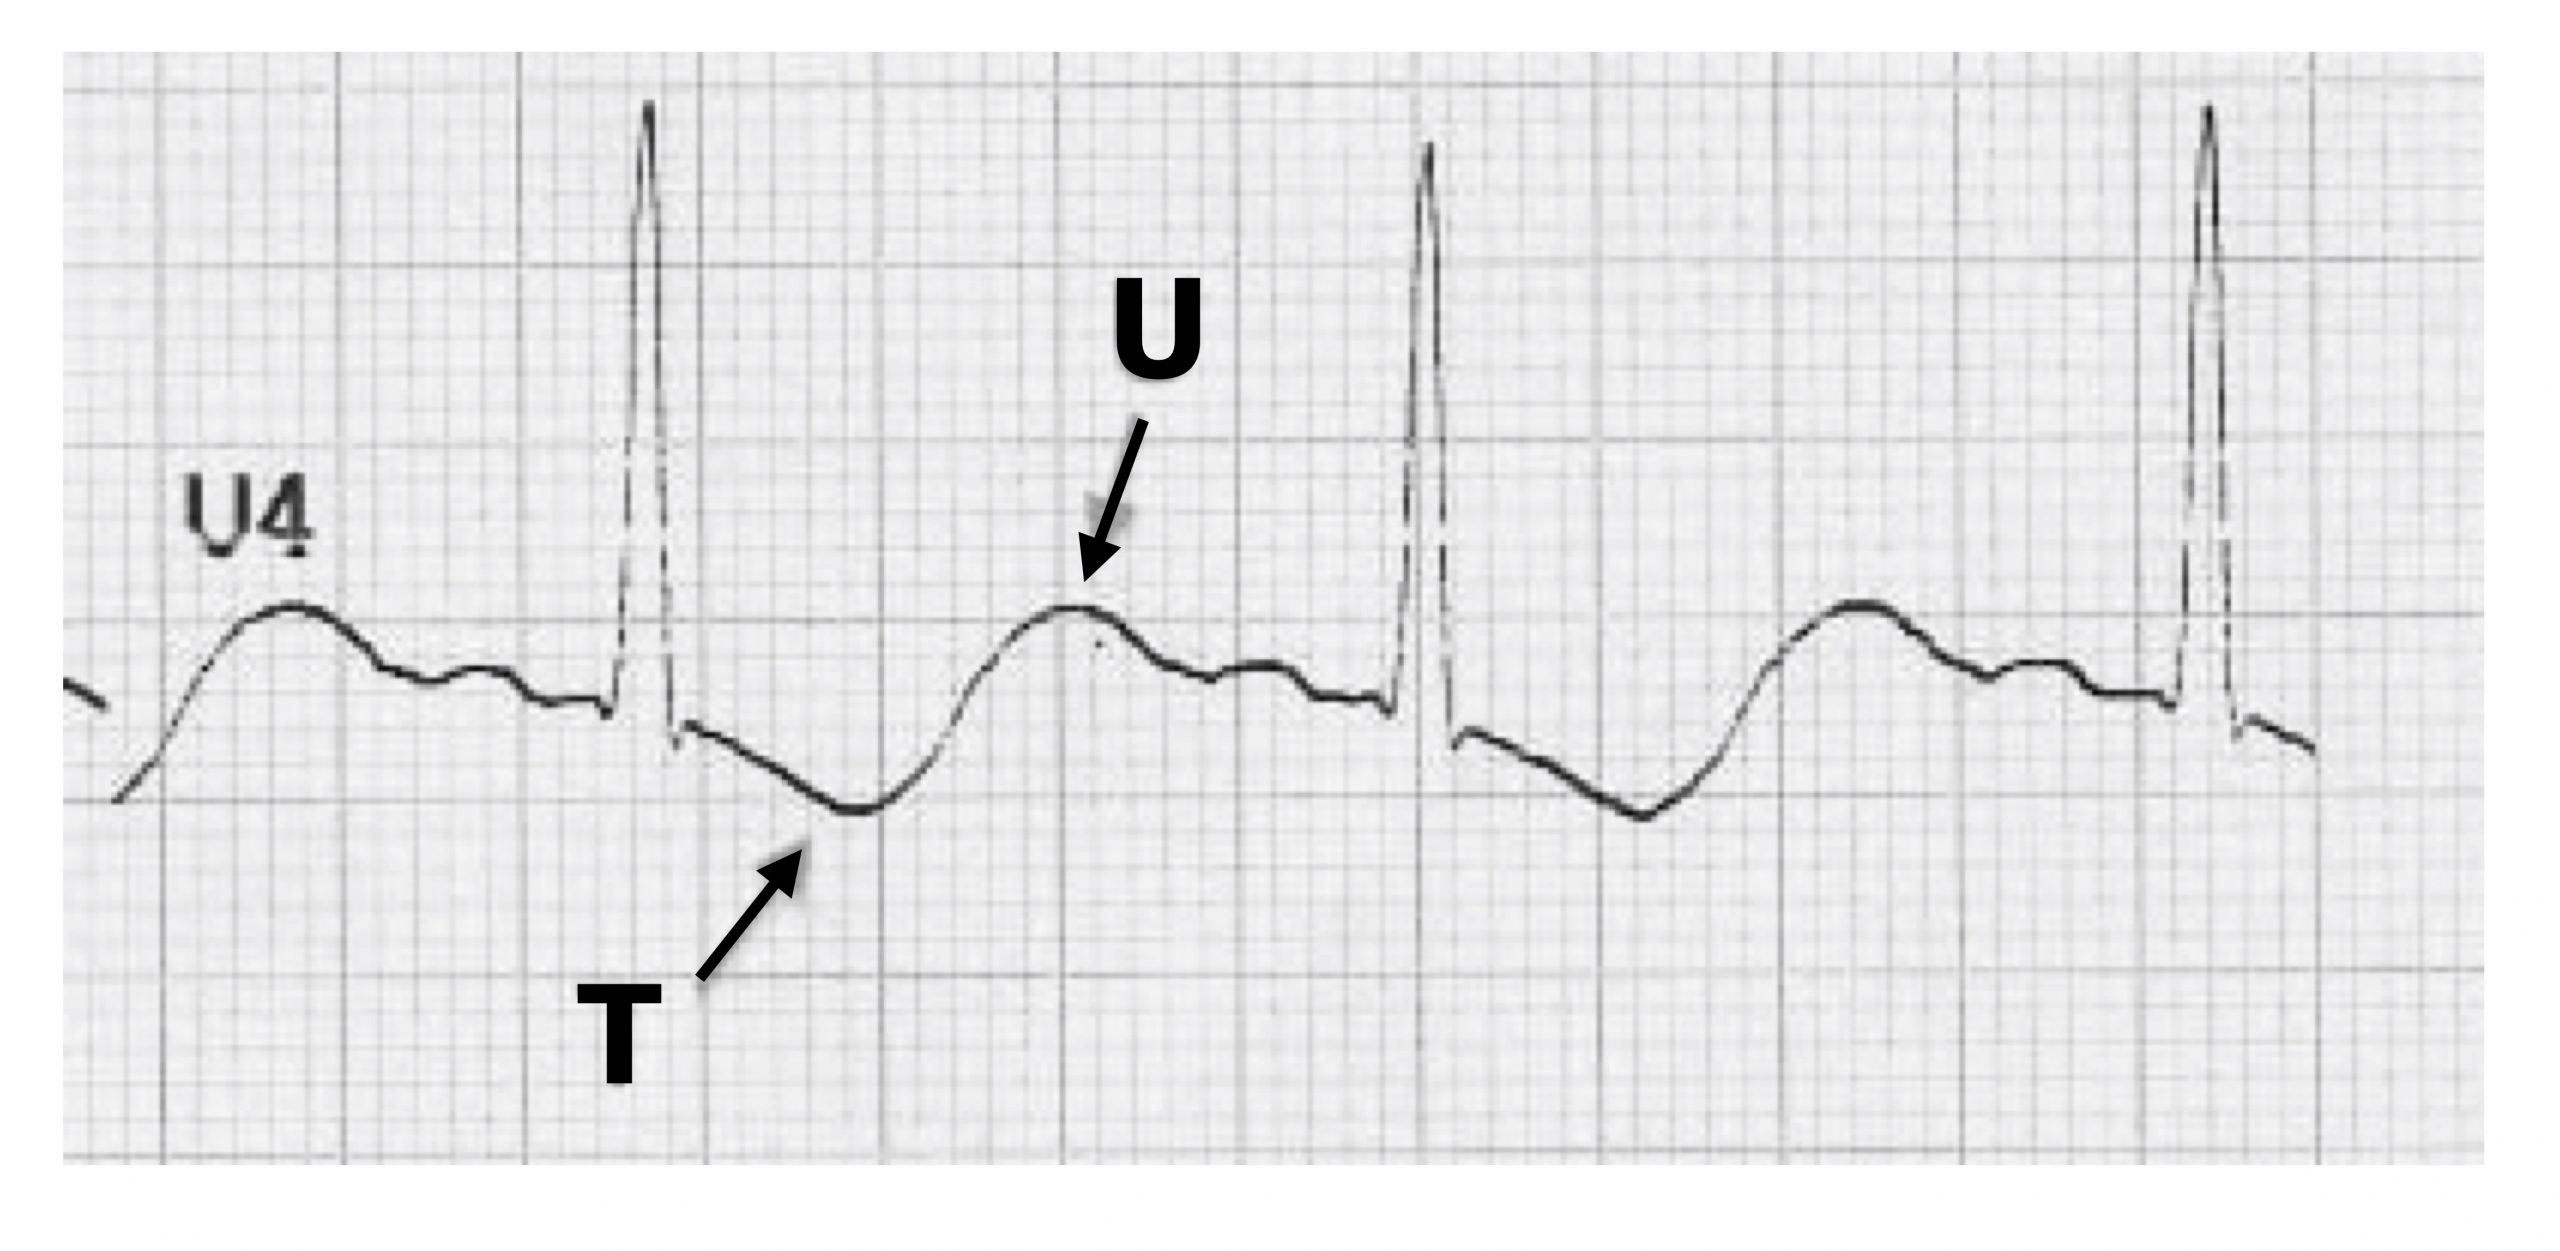
Your intuition may lead you to think that hypokalemia (<2.7 mmol/L) would increase K+ conductances because there is a greater gradient from inside to outside the cell, but that is not the case. Instead hypokalemia suppresses K+ channel conductances by destabilizing K+ channels. With low K+ conductance, the ECG changes reflect problems with repolarization. The T-wave is flattened and can be inverted, and a prominent U-wave may be seen in the precordial leads (figure 1.21). ST depression may also be apparent.
As hypokalemia also inhibits Na+-K+ ATPase, Na+ accumulates inside the cell. This in turn leads to an accumulation of Ca++ because of a subsequent failure of the Na+-Ca++ exchanger. Extended presence of these two positive ions inside the myocyte prolongs the action potential and may manifest as an increased width and amplitude of the P-wave.
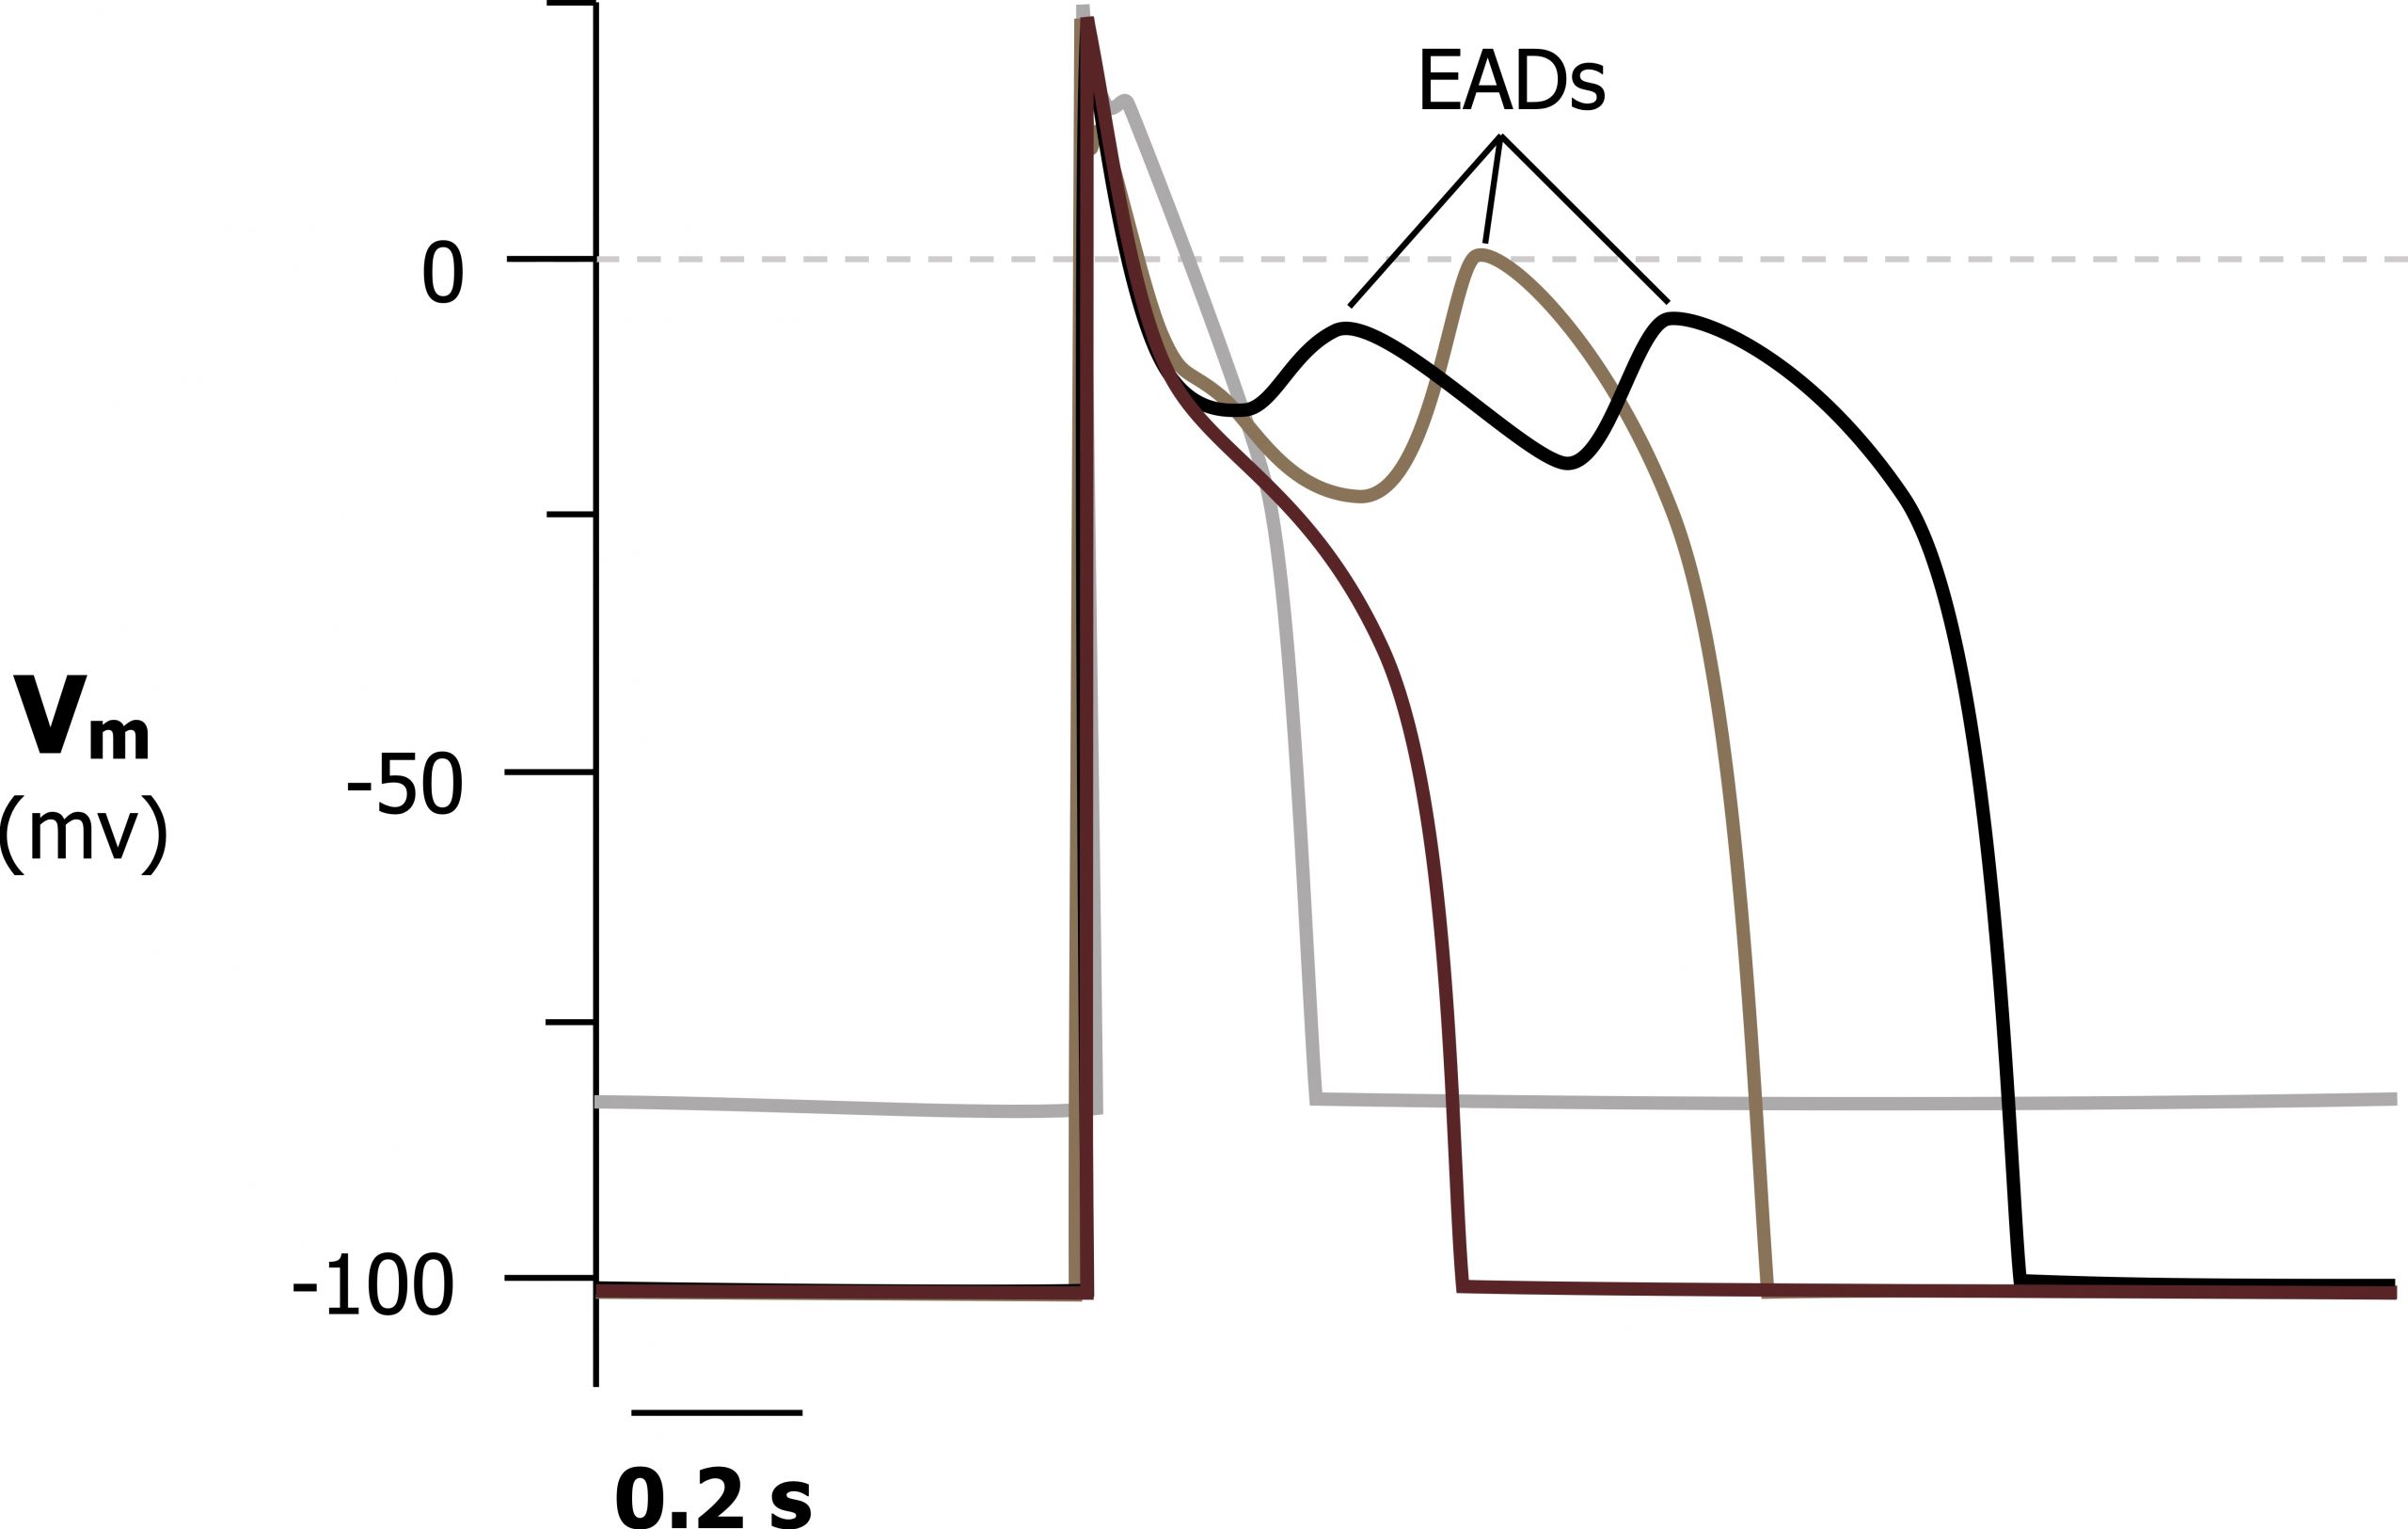
As hypokalemia worsens, the problems with K+ conductance and repolarization increase, and the myocardium becomes susceptible to early after-depolarization (EAD) arrhythmias.
As K+ is retained in the myocyte (due to the poor K+ conductance) and elevated intracellular Na+ and Ca++ results in the myocyte being more capable of depolarizing again. Because these after-depolarizations (figure 1.22) may not be uniform across the whole myocardium, an arrhythmia can be established. Potential arrhythmias include life-threatening forms, such as VT, VF, or torsades de pointes.
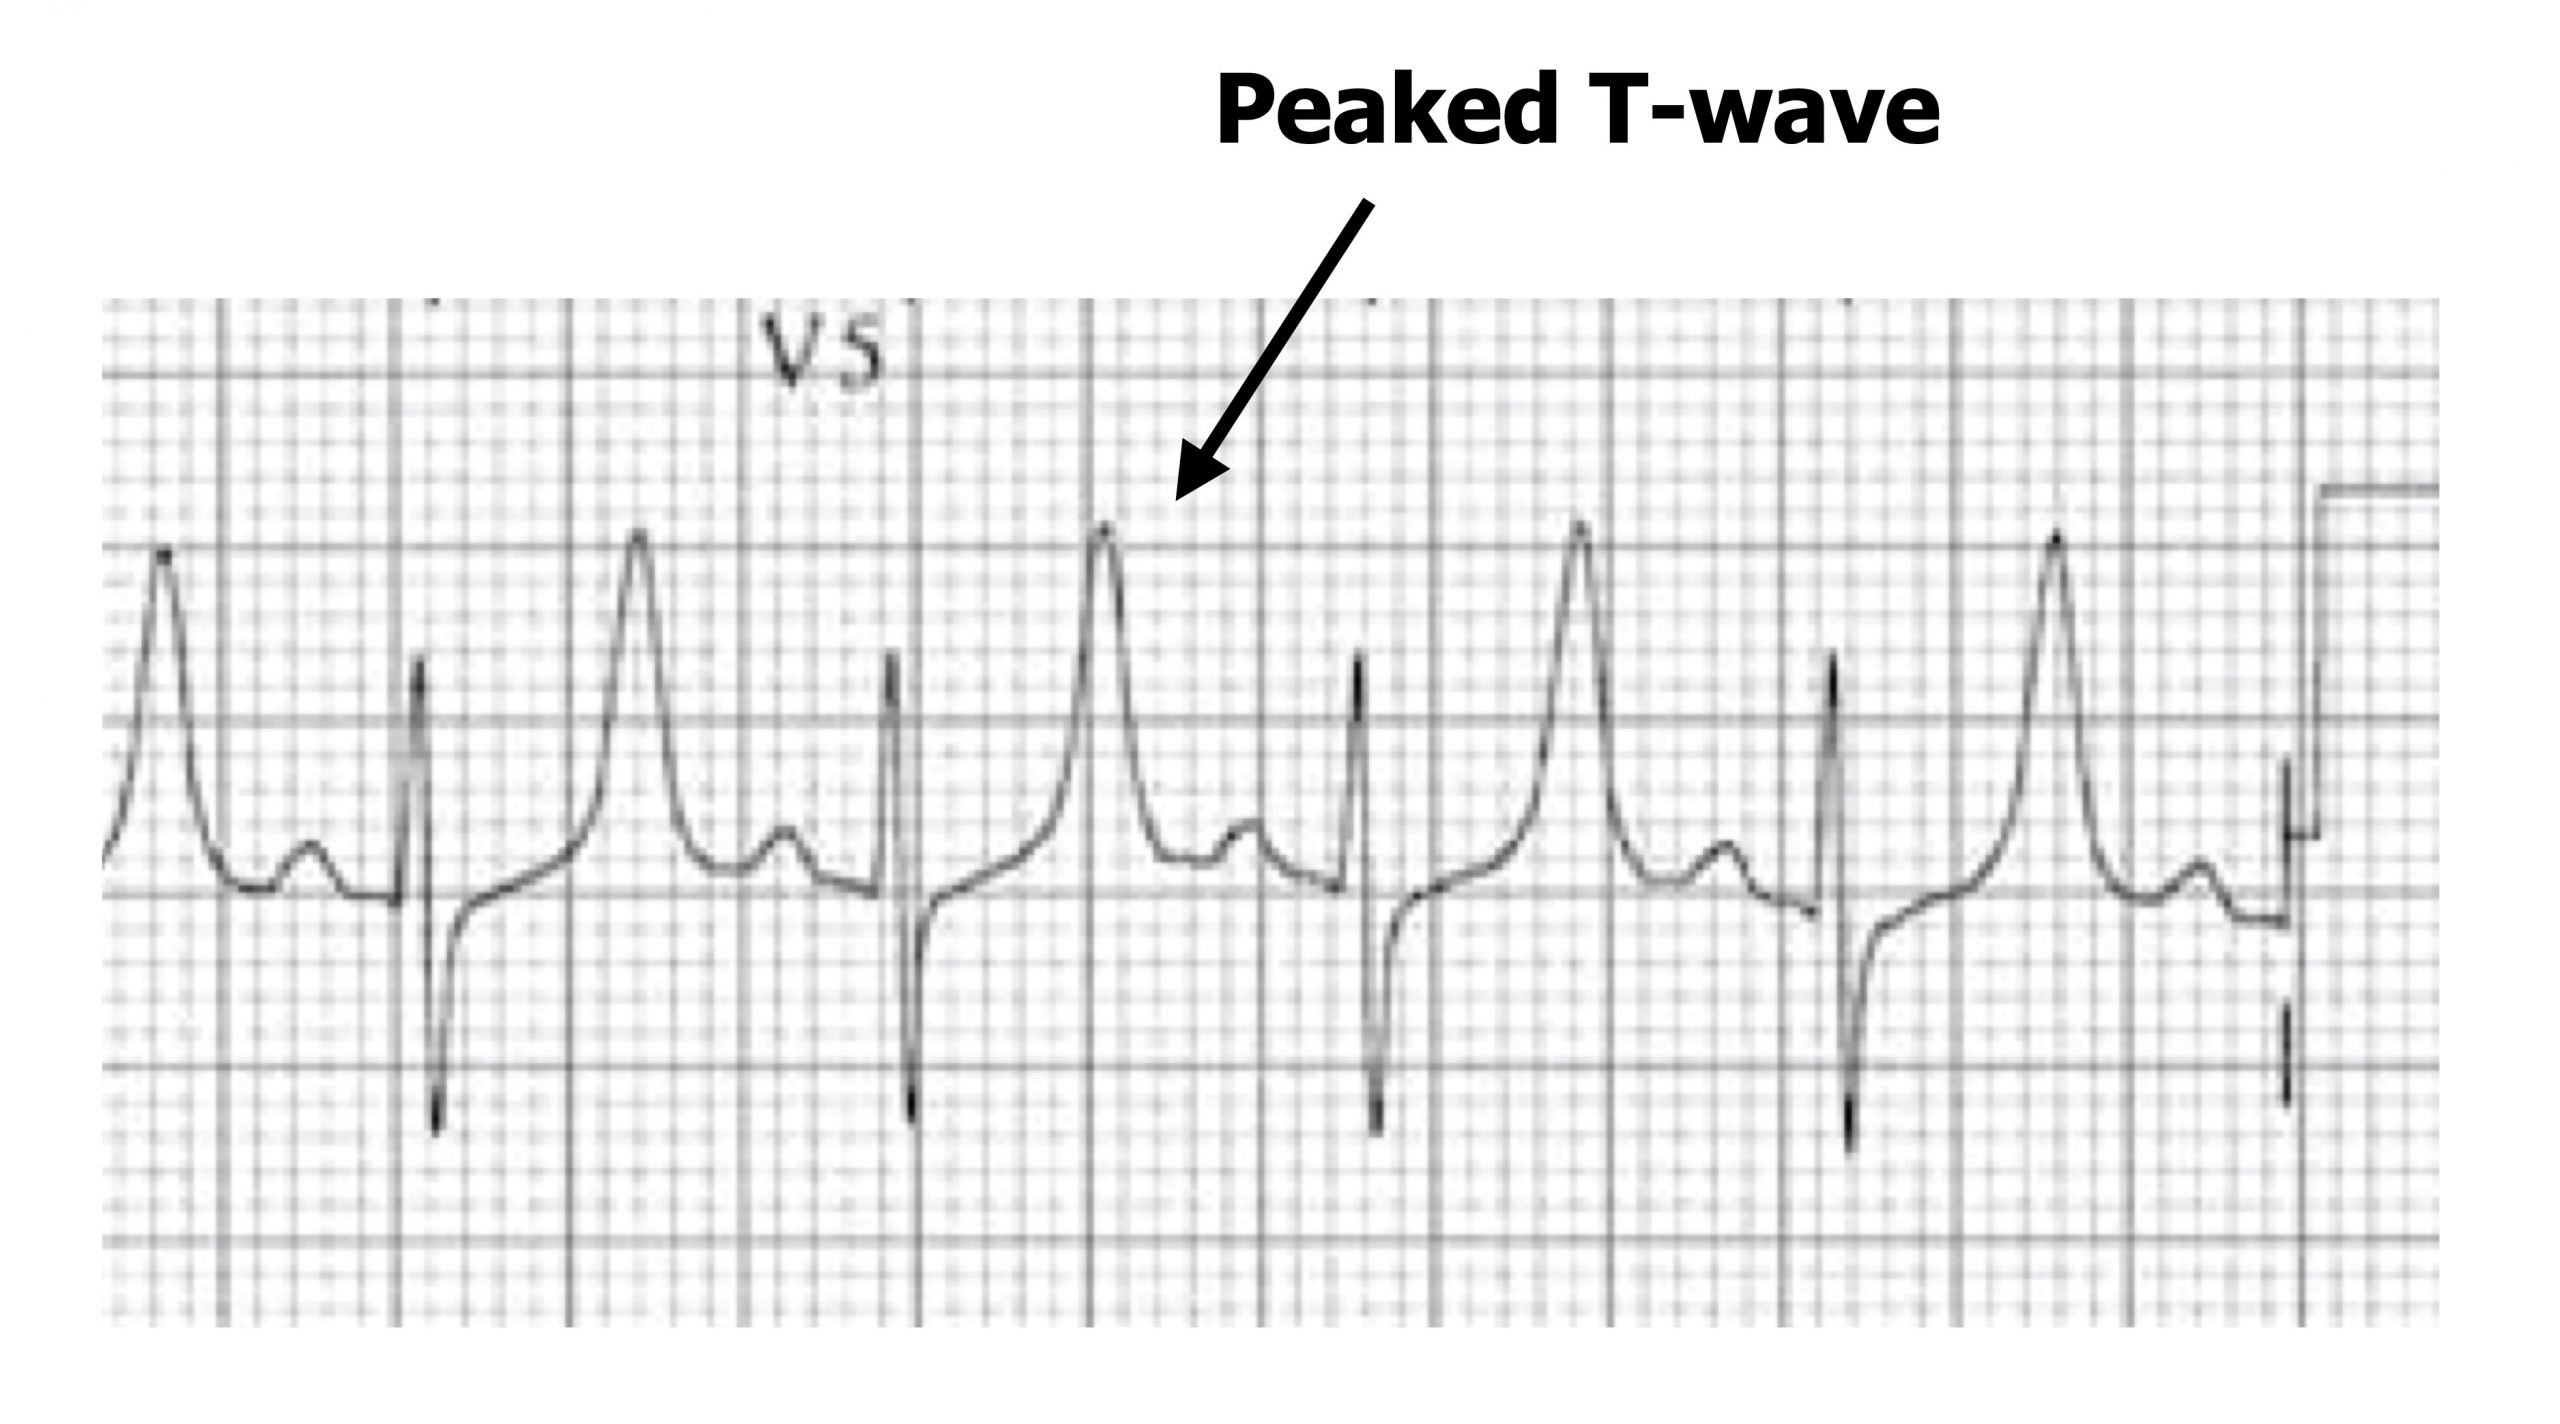
Hyperkalaemia produces different changes in myocardial excitability depending on the degree of excess potassium. Again the changes in excitability do not necessarily follow an intuitive logic of the change in the electrochemical gradient of K+. Mild hyperkalemia (5.5–6.5 mEq/L) causes peaked T-waves (figure 1.23)—the first sign of raised extracellular potassium. The excess potassium allosterically interferes with K+ channels and, inverse to hypokalemia, causes an increase in K+ conductance (despite the lower transmembrane gradient).
Moderate hyperkalemia (5.5–6.5 mEq/L) raises the membrane potential closer to the threshold of voltage-gated Na+ channels (-70 mV) and voltage-gated Ca++channels. Consequently these channels are more likely to fire and cause depolarization, hence the myocardium is initially more excitable. However, this persistent depolarization leaves the slow deactivation (h) gates on Na+ channels closed for longer, and the ECG manifestations soon reflect a decreased excitability. The P-wave is longer but has low amplitude (and may eventually disappear), the QT interval is prolonged, and there is a decreased R-wave amplitude (figure 1.24). In simpler terms, the overstimulation of Na+ channels causes them to “lock up.”
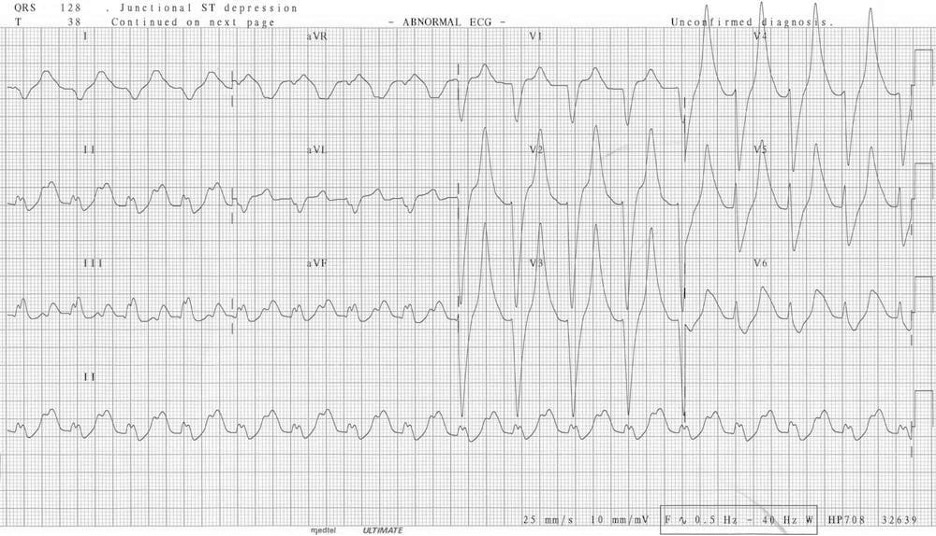
Severe hyperkalemia (>7.0 mEq/L) sees a worsening of the unresponsiveness of the myocardium, and the SA node rhythm is slowed, producing sinus bradycardia until there is no P-wave. Conductive issues arise, and a high-grade atrioventricular block is likely, allowing ventricular pacemakers to take over, but the ventricular myocardium is also unresponsive, so the QRS complex becomes broad and sine wave–like on the ECG (figure 1.25); this is a preterminal rhythm. At this point cardiovascular collapse and death are imminent, often through a VF finale.
| Hypokalemia summary | Hyperkalemia summary |
|---|---|
| Flattened or inverted T-wave | Mild: Peaked T-waves |
| Increased P-wave amplitude | Moderate: Long P-wave, prolonged QT interval, decreased amplitude R-wave |
| Induced arrhythmias in severe hypokalemia | Severe: Loss of P-wave, ventricular sine wave action potential |
Table 1.17: Hypo- and hyperkalemia summary.
References, resources, and further reading
Text
Burns, Ed, and Robert Buttner. Hypercalcaemia. Lift in the Fast Lane, 2021. https://litfl.com/hypercalcaemia-ecg-library/, CC BY 4.0.
Burns, Ed, and Robert Buttner. Hypocalcaemia. Life in the Fast Lane, 2021. https://litfl.com/hypocalcaemia-ecg-library/, CC BY 4.0.
Buttner, Robert, and Ed Burns. Hyperkalaemia. Life in the Fast Lane. https://litfl.com/hyperkalaemia-ecg-library/, CC BY 4.0.
Buttner, Robert, and Ed Burns. Hypokalaemia. Life in the Fast Lane, 2021. https://litfl.com/hypokalaemia-ecg-library/, CC BY 4.0.
Chhabra, Lovely, Amandeep Goyal, and Michael D. Benham. Wolff Parkinson White Syndrome. Treasure Island, FL: StatPearls Publishing, 2022. https://www.ncbi.nlm.nih.gov/books/NBK554437/, CC BY 4.0.
Custer, Adam M., Varun S. Yelamanchili, and Sarah L. Lappin. Multifocal Atrial Tachycardia. Treasure Island, FL: StatPearls Publishing, 2022. https://www.ncbi.nlm.nih.gov/books/NBK459152/, CC BY 4.0.
Farzam, Khashayar, and John R. Richards. Premature Ventricular Contraction. Treasure Island, FL: StatPearls Publishing, 2022. https://www.ncbi.nlm.nih.gov/books/NBK532991/, CC BY 4.0.
Foth, Christopher, Manesh Kumar Gangwani, and Heidi Alvey. Ventricular Tachycardia. Treasure Island, FL: StatPearls Publishing, 2022. https://www.ncbi.nlm.nih.gov/books/NBK532954/, CC BY 4.0.
Hafeez, Yamama, and Shamai A. Grossman. Sinus Bradycardia. Treasure Island, FL: StatPearls Publishing, 2022. https://www.ncbi.nlm.nih.gov/books/NBK493201/, CC BY 4.0.
Harkness, Weston T., and Mary Hicks. Right Bundle Branch Block. Treasure Island, FL: StatPearls Publishing, 2022. https://www.ncbi.nlm.nih.gov/books/NBK507872/, CC BY 4.0.
Heaton, Joseph, and Srikanth Yandrapalli. Premature Atrial Contractions. Treasure Island, FL: StatPearls Publishing, 2022. https://www.ncbi.nlm.nih.gov/books/NBK559204/, CC BY 4.0.
Kashou, Anthony H., Amandeep Goyal, Tran Nguyen, and Lovely Chhabra. Atrioventricular Block. Treasure Island, FL: StatPearls Publishing, 2022. https://www.ncbi.nlm.nih.gov/books/NBK459147/, CC BY 4.0.
“Learn the Heart.” Healio. https://www.healio.com/cardiology/learn-the-heart.
Ludhwani, Dipesh, Amandeep Goyal, and Mandar Jagtap. Ventricular Fibrillation. Treasure Island, FL: StatPearls Publishing, 2022. https://www.ncbi.nlm.nih.gov/books/NBK537120/, CC BY 4.0.
Nesheiwat, Zeid, Amandeep Goyal, and Mandar Jagtap. Atrial Fibrillation. Treasure Island, FL: StatPearls Publishing, 2022. https://www.ncbi.nlm.nih.gov/books/NBK526072/, CC BY 4.0.
Pipilas, Daniel C., Bruce A. Koplan, and Leonard S. Lilly. “The Electrocardiogram.” In Pathophysiology of Heart Disease: A Collaborative Project of Medical Students and Faculty, 5e edited by Leonard S. Lilly, Chapter 4. Philadelphia: Lippincott Williams & Wilkins, a Wolters Kluwer Business, 2010.
Rodriguez Ziccardi, Mary, Amandeep Goyal, and Christopher V. Maani. Atrial Flutter. Treasure Island, FL: StatPearls Publishing, 2022. https://www.ncbi.nlm.nih.gov/books/NBK540985/, CC BY 4.0.
Scherbak, Dmitriy, and Gregory J. Hicks. Left Bundle Branch Block. Treasure Island, FL: StatPearls Publishing, 2022. https://www.ncbi.nlm.nih.gov/books/NBK482167/, CC BY 4.0.
Figures
Figure 1.1: Atrial fibrillation. Grey, Kindred. 2022. CC BY-NC-SA 4.0. Added Burns, Ed, and Robert Buttner. Example 2 (image cropped), Atrial Fibrillation. Life in the Fast Lane, 2021. https://litfl.com/atrial-fibrillation-ecg-library/, CC BY-NC-SA 4.0. https://archive.org/details/1.1_20220113
Figure 1.2: Comparison of atrial arrhythmias, including atrial fibrillation, atrial flutter, and multifocal atrial tachycardia (MAT). Grey, Kindred. 2022. CC BY-NC-SA 4.0. Added Burns, Ed, and Robert Buttner. Example 1 (image cropped), Multifocal Atrial Tachycardia (MAT). Life in the Fast Lane, 2021. https://litfl.com/multifocal-atrial-tachycardia-mat-ecg-library, CC BY-NC-SA 4.0. Added Burns, Ed, and Robert Buttner. Example 4 (image cropped), Atrial Fibrillation (image cropped). Life in the Fast Lane, 2021. https://litfl.com/atrial-fibrillation-ecg-library/, CC BY-NC-SA 4.0. Added Buttner, Robert, and Ed Burns. Example 3 (image cropped), Atrial Flutter. Life in the Fast Lane, 2021. https://litfl.com/atrial-flutter-ecg-library/, CC BY-NC-SA 4.0. https://archive.org/details/1.2_20220113
Figure 1.3: Atrial flutter. Burns, Ed, and Robert Buttner. Example 5 (image cropped), Atrial Flutter. Life in the Fast Lane, 2021. https://litfl.com/atrial-flutter-ecg-library/, CC BY-NC-SA 4.0.
Figure 1.4: Three distinct P-wave morphologies in a case of MAT. Burns, Ed, and Robert Buttner. Example 1 (image cropped), Atrial Flutter. Life in the Fast Lane, 2021. https://litfl.com/atrial-flutter-ecg-library/, CC BY-NC-SA 4.0.
Figure 1.5: Atrial bigeminy in PAC. Dawn. “ECG Basics: Sinus Rhythm with Atrial Bigeminy” (image cropped). ECG Guru, 2012. https://www.ecgguru.com/ecg/ecg-basics-sinus-rhythm-atrial-bigeminy, CC BY-NC-SA 4.0.
Figure 1.6: PVCs have a wider complex and are followed by a compensatory pause. Burns, Ed, and Robert Buttner. Multifocal PVCs Example (image cropped, scale and arrows removed, and new arrows added), Premature Ventricular Complex (PVC). Life in the Fast Lane, 2021. https://litfl.com/premature-ventricular-complex-pvc-ecg-library, CC BY-NC-SA 4.0.
Figure 1.7: Monomorphic and polymorphic VT. Grey, Kindred. 2022. CC BY-NC-SA 4.0. Added Buttner, Robert, and Ed Burns. Monomorphic VT Figure, Ventricular Tachycardia—Monomorphic VT. Life in the Fast Lane, 2021. https://litfl.com/ventricular-tachycardia-monomorphic-ecg-library, CC BY-NC-SA 4.0. Added Smith, Stephen W. Polymorphic VT Figure (second image, cropped), “Polymorphic Ventricular Tachycardia.” Dr. Smith’s ECG Blog, October 12, 2013. http://hqmeded-ecg.blogspot.com/2013/10/polymorphic-ventricular-tachycardia.html, CC BY-NC-SA 4.0. https://archive.org/details/1.7_20220113
Figure 1.8: Torsades de Pointes. Grey, Kindred. 2022. CC BY-NC-SA 4.0. Added Burns, Ed, and Robert Buttner. Torsades de Pointes Figure (image superimposed), Polymorphic VT and Torsades de Pointes (TdP). Life in the Fast Lane, 2021. https://litfl.com/polymorphic-vt-and-torsades-de-pointes-tdp, CC BY-NC-SA 4.0. https://archive.org/details/1.8_20220113
Figure 1.9: Example of ventricular fibrillation with no recognizable P-waves or QRS complexes. Burns, Ed, and Robert Buttner. Example 2, Ventricular Fibrillation (VF). Life in the Fast Lane, 2021. https://litfl.com/ventricular-fibrillation-vf-ecg-library, CC BY-NC-SA 4.0.
Figure 1.10: Example of first-degree block with P-R interval >0.2 seconds. Larkin, John, and Robert Buttner. First Degree Heart Block Figure, First Degree Heart Block. Life in the Fast Lane, 2021. https://litfl.com/first-degree-heart-block-ecg-library, CC BY-NC-SA 4.0.
Figure 1.11: Mobitz I (second-degree block) with P-R intervals shown in seconds. Grey, Kindred. 2022. CC BY-NC-SA 4.0. Added Burns, Ed, and Robert Buttner. AV Block: 2nd Degree, Mobitz Type I Figure (image superimposed), AV Block: 2nd Degree, Mobitz I (Wenckebach Phenomenon). Life in the Fast Lane, 2021. https://litfl.com/av-block-2nd-degree-mobitz-i-wenckebach-phenomenon, CC BY-NC-SA 4.0. https://archive.org/details/1.11_20220113
Figure 1.12: Mobitz II (second degree block) with arrows showing P waves. P-R interval is stable and ratio is 3:1. Grey, Kindred. 2022. CC BY-NC-SA 4.0. Added Burns, Ed, and Robert Buttner. Mobitz Type II Rhythm Strip Figure (image superimposed), AV Block: 2nd Degree, Mobitz II (Hay Block). Life in the Fast Lane, 2021. https://litfl.com/av-block-2nd-degree-mobitz-ii-hay-block, CC BY-NC-SA 4.0. https://archive.org/details/1.12_20220113
Figure 1.13: Third-degree block with P-waves (black arrows) having an SA node rate of 100 bpm and the ventricles depolarizing (blue arrows) at 33 bpm. Larkin, John, and Robert Buttner. Complete Heart Block Figure, AV Block: 3rd Degree (Complete Heart Block). Life in the Fast Lane, 2021. https://litfl.com/av-block-3rd-degree-complete-heart-block, CC BY-NC-SA 4.0.
Figure 1.14: Example of LBBB with defining features labeled. Grey, Kindred. 2022. CC BY-NC-SA 4.0. Added Buttner, Robert, and Ed Burns. Example 1 (image superimposed), Left Bundle Branch Block (LBBB). Life in the Fast Lane, 2021. https://litfl.com/left-bundle-branch-block-lbbb-ecg-library, CC BY-NC-SA 4.0. https://archive.org/details/1.14_20220113
Figure 1.15: Changes in R-wave morphology as differences in left and right depolarization produce an M-shaped wave. Buttner, Robert, and Ed Burns. LBBB Figure (image cropped), Left Bundle Branch Block (LBBB). Life in the Fast Lane, 2021. https://litfl.com/left-bundle-branch-block-lbbb-ecg-library, CC BY-NC-SA 4.0.
Figure 1.16: Typical RSR’ pattern (upper) and slurred S (lower) of RBBB. Grey, Kindred. 2022. CC BY-NC-SA 4.0. Added Typical RSR’ Pattern (‘M’-Shaped) QRS in V1 Figure (image superimposed), Right Bundle Branch Block (RBBB). Life in the Fast Lane, 2021. https://litfl.com/right-bundle-branch-block-rbbb-ecg-library, CC BY-NC-SA 4.0. Added Wide Slurred S Wave in Lead I Figure (image superimposed), Right Bundle Branch Block (RBBB). Life in the Fast Lane, 2021. https://litfl.com/right-bundle-branch-block-rbbb-ecg-library, CC BY-NC-SA 4.0. https://archive.org/details/1.16_20220113
Figure 1.17: Schematics of normal WPW syndrome conductivity pathways. Grey, Kindred. 2022. CC BY 4.0. https://archive.org/details/1.17_20220113
Figure 1.18: Delta wave of WPW syndrome. Grey, Kindred. 2022. CC BY-NC-SA 4.0. Added Cadogan, Mike, and Robert Buttner. ECG Delta Wave 3 Figure (image superimposed), Delta Wave. Life in the Fast Lane, 2022. https://litfl.com/delta-wave-ecg-library, CC BY-NC-SA 4.0. https://archive.org/details/1.18_20220113
Figure 1.19: Changes in Q-T interval in moderate hypercalemia and hypocalcemia. Grey, Kindred. 2022. CC BY 4.0. https://archive.org/details/1.19_20220113
Figure 1.20: J-waves arising at the J-point during hypothermia but can also be caused by hypercalcemia. Grey, Kindred. 2022. CC BY-NC-SA 4.0. Added Example 3 (image superimposed), Osborn Wave (J Wave). Life in the Fast Lane, 2022. https://litfl.com/osborn-wave-j-wave-ecg-library, CC BY-NC-SA 4.0. https://archive.org/details/1.20_20220113
Figure 1.21: A prominent U-wave and inverted T-wave associated with hypokalemia. Buttner, Robert, and Ed Burns. Hypokalaemia Figure (image letters edited), Hypokalaemia. Life in the Fast Lane, 2021. https://litfl.com/hypokalaemia-ecg-library, CC BY-NC-SA 4.0.
Figure 1.22: Early after-depolarizations occurring in a cardiac action potential due to poor K+ conductance in hypokalemia. Grey, Kindred. 2022. CC BY 4.0. https://archive.org/details/1.22_20220113
Figure 1.23: Peaked T-waves with mild hyperkalemia. Grey, Kindred. 2022. CC BY-NC-SA 4.0. Added Buttner, Robert, and Ed Burns. Example 2 (image superimposed), Hyperkalaemia. Life in the Fast Lane, 2021. https://litfl.com/hyperkalaemia-ecg-library, CC BY-NC-SA 4.0. https://archive.org/details/1.23_20220113
Figure 1.24: Big T, little p and r of moderate hyperkalemia. Cadogan, Mike. Figure 4, Hyperkalaemia Clinical Case. Life in the Fast Lane, 2020. https://litfl.com/hyperkalaemia-clinical-case, CC BY-NC-SA 4.0.
Figure 1.25: Preterminal ECG of severe hyperkalemia. Buttner, Robert, and Ed burns. Figure 6 (image cropped), Hyperkalaemia. Life in the Fast Lane, 2021. https://litfl.com/hyperkalaemia-ecg-library, CC BY-NC-SA 4.0.
