3 Hypertension
Learning Objectives
- Distinguish between essential and secondary hypertension.
- Describe the consequences of unmanaged hypertension.
Over seventy million Americans are hypertensive, and the Framingham study suggests that 90 percent of those over fifty-five years old will develop hypertension. But two-thirds of hypertensive patients are unaware of their condition so are exposed to the long-term effects.
The current guidelines (JNC 8, 2017) list the following pressures and categories to define hypertension:
- Normal (<120/80 mm Hg)
- Elevated (120–129/<80 mm Hg)
- Stage 1 hypertension (130–139/80–89 mm Hg)
- Stage 2 hypertension (≥140/90 mm Hg)
Essential Hypertension
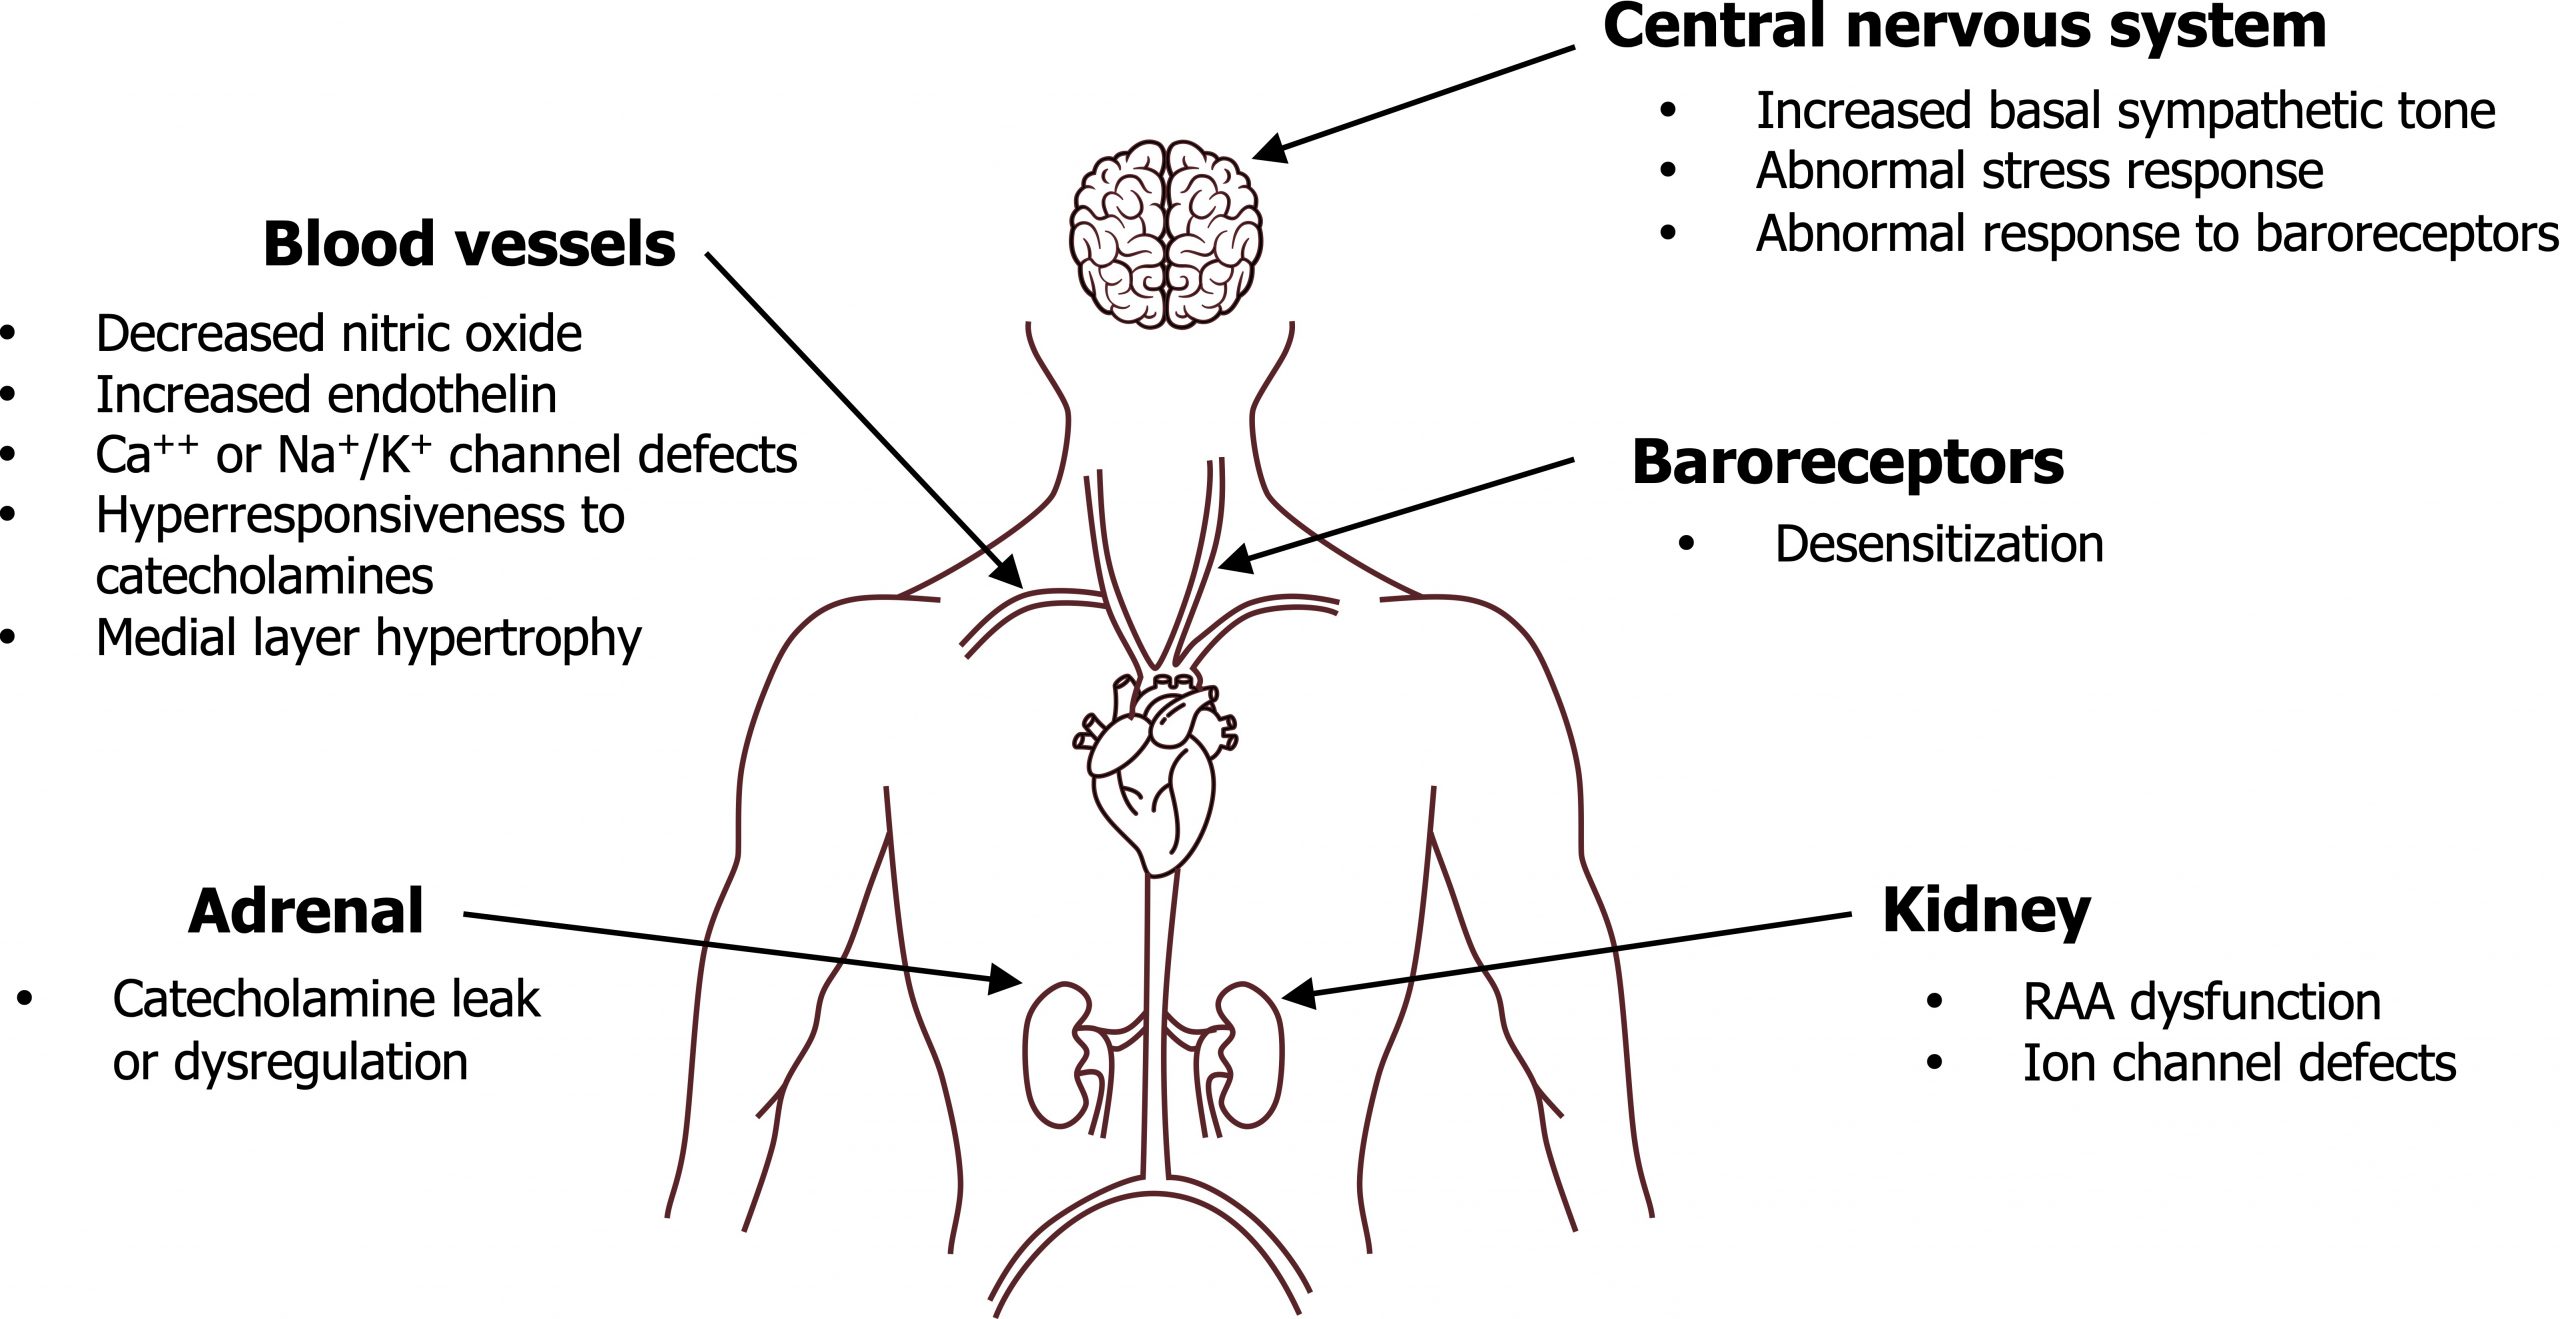
Hypertension can be categorized as either essential or secondary. Secondary is much less common and a consequence of another condition (e.g., renal or endocrine disease). Essential hypertension (EH), despite being the prevalent form, is poorly understood but can be attributed to a problem with either cardiac output or peripheral resistance (i.e., the components of blood pressure regulation). Because multiple factors contribute to these components AND there is evidence of some genetic component to hypertension AND due to the contribution from environmental factors, essential hypertension can be considered a “description” rather than a “diagnosis.” Primary abnormalities that may contribute to essential hypertension are shown in figure 3.1.
Genetic components of essential hypertension
No single loci has been identified as causing hypertension, but strong familial histories suggest polygenic causes (i.e., multiple loci are involved). Much attention has been paid to genes involved with enzymes and receptor production within the Renin-Angiotensin-Aldosterone (RAA) system because of its critical role in blood pressure control through sodium and volume regulation. Similarly genes involved with renal regulation of sodium have been studied. Our inability to demonstrate a genetic basis to hypertension is also consistent with significant environmental causes.
Systemic abnormalities and EH
Since Blood Pressure = Cardiac Output x Peripheral Resistance, it should be easy to imagine why aberrant rises in cardiac output (e.g., increased sympathetic tone) or peripheral resistance (e.g., low levels of vasodilators) would cause a rise in blood pressure (BP). Some of those aberrations of the acute BP control mechanisms are in figure 3.1, but this is clearly half the story as there are chronic control mechanisms that should surely compensation for loss of acute control. What this means is, for hypertension to be sustained, the kidney must be “in on the hypertension act.” While the kidney itself can be responsible for volume-based hypertension (dysregulated renal blood flow, ion channels defects, etc.), there are deficits in renal control in hypertension. Renin levels are normal or high in 70 to 75 percent of EH patients—and of course they should be low as elevated BP should suppress renin secretion. So while this begins a chicken-and-egg scenario, for hypertension to be sustained, both acute and chronic control mechanisms must fail.
Diabetes, obesity, and EH
The linkage between diabetes and EH, and obesity and EH, appears strong and direct. Because insulin is a dietary-induced mediator of sympathetic activity, the elevated insulin levels in insulin-resistant diabetes can directly promote hypertension. Insulin can also lead to an increase in peripheral resistance via its mitogenic effect on vascular smooth muscle that causes hypertrophy in the medial vascular layers and a decrease in lumen size.
Obesity can also induce hypertension through release of angiotensinogen from more abundant adipocytes, thus providing more substrate for the RAA system. The increase in body mass is also accompanied by an increase in blood volume, and that blood may be more viscous as the large population of adipocytes release coagulative proteins, including prothrombin.
Secondary Hypertension
Although not as common, there are numerous causes of secondary hypertension. There are some distinguishing features that are clinically useful to distinguish it from EH. Your first heads-up is if the patient is younger and not in the typical range for EH (> fifty years old). Secondary hypertension also tends to be more severe, and BP can rise dramatically; EH does not have a rapid onset. While EH often comes with family history, secondary hypertension is more sporadic.
Suspicion of secondary hypertension can usually be confirmed by urinalysis that reveals the underlying issue (see table 3.1 for some common causes and cues for diagnosis). Disturbances in electrolytes and creatinine accompany the renal and mineralocorticoid-based diseases. Pheochromocytoma is rare and accounts for 0.2 percent of secondary hypertension cases (however, it is much more common in exam questions than it is in the clinic!).
Drugs that disrupt the angiotensinogen pathways (e.g., estrogens), are sympathomimetic (e.g., over-the-counter cold remedies), or promote sodium and water retention (e.g., NSAIDS) can all produce secondary hypertension.
| Primary disorder | Clinical cues |
|---|---|
| Chronic renal disease | - Increased creatinine - Abnormal urinalysis |
| Primary aldosteronism | - Decreased serum potassium |
| Renovascular | - Abdominal bruit - Sudden onset - Decreased serum potassium |
| Pheochromocytoma | - Palpitations, diaphoresis, headache, weight loss - Episodic hypertension |
| Coarctation of the aorta | - Blood pressure in arms > legs - Blood pressure in right arm > left arm - Midsystolic click |
| Cushing syndrome | - Central obesity - Hirsutism |
Consequences of Hypertension
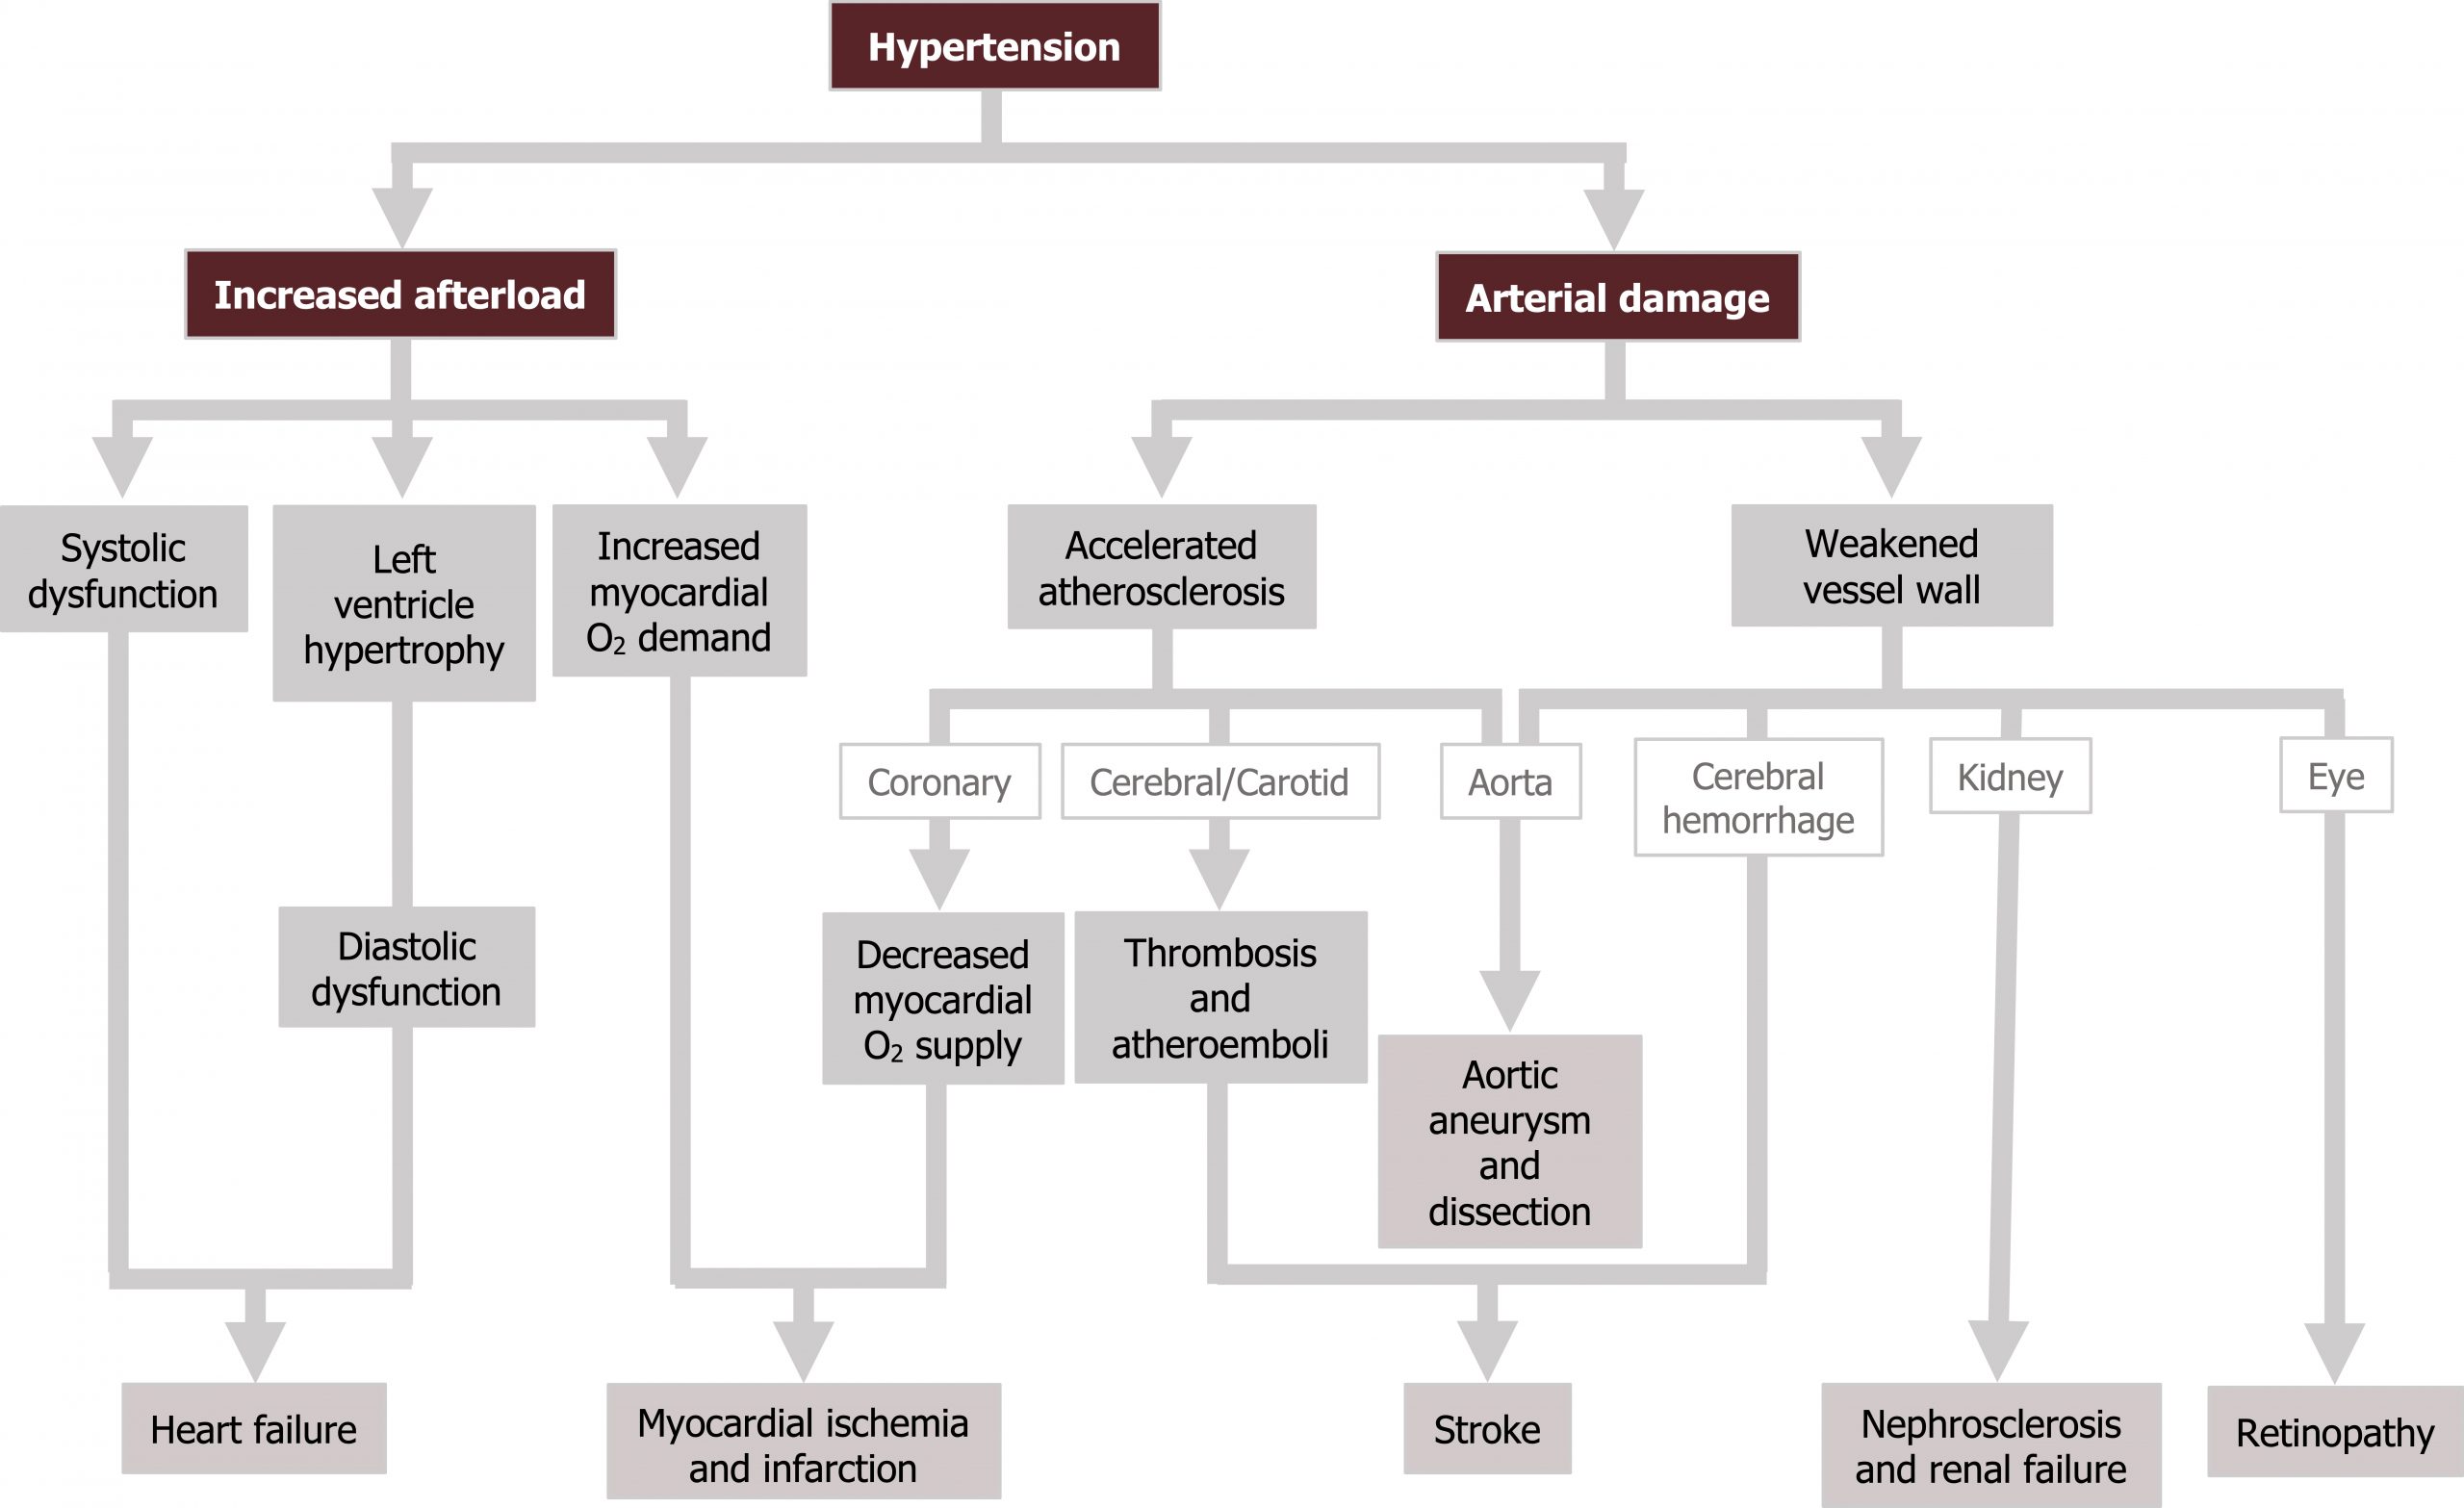
As most hypertensive patients are asymptomatic, the condition can be left unmanaged and allowed to produce significant chronic effects. Most of these effects are caused by the extra work placed on the heart with the increased afterload and the damage to the interior of the vasculature.
The excess afterload can lead to systolic dysfunction and eventually heart failure with reduced ejection fraction (HFREF). In response to the excessive afterload the left ventricle can hypertrophy, causing a loss of compliance diastolic dysfunction and eventually heart failure with normal ejection fraction (HFNEF). The increased workload and muscle mass also increase the myocardial oxygen demand. This increase in demand often occurs at the same time that blood supply is diminished by concurrent atherosclerosis that is accelerated by the hypertension-induced arterial damage. Consequently, with high demand and low supply, the patient is prone to ischemia and myocardial infarction.
The arterial damage will also promote thrombosis and atheroemboli, so risk of embolic stroke is raised. Risk of hemorrhagic stroke is also increased as the vessel ways become weak. The large vessels are also at risk of being unable to counteract raised pressure (remember Laplace’s law?), so aortic aneurysm and dissection can also occur.
High pressures entering the renal circulation can lead to nephrosclerosis. As renal function declines, a vicious cycle forms with renal failure exacerbating hypertension that exacerbates renal failure.
The retinal circulation provides a direct window into the state of the vasculature. Rapid onset and severe hypertension may burst small retinal vessels and produce local infarctions. In more chronic cases, arterial narrowing and medial hypertrophy of the retinal vessel can be seen. As the chronic hypertension worsens, arterial sclerosis is evident. While these chronic effects may not produce functional issues, they are at least an accessible indicator of the vascular status. The consequences of hypertension are summarized in figure 3.2.
Hypertensive Crisis
Most commonly caused by a hemodynamic insult overlaid on chronic hypertension, a hypertensive crisis is a severe elevation of blood pressure that can become life threatening through raising intracranial pressure. The rise in intracranial pressure produces severe headache, blurred vision, confusion, or even coma and is referred to as hypertensive encephalopathy. Funduscopy reveals retinal hemorrhages, exudates, and sometimes papilledema. The massive afterload on the left ventricle can precipitate angina. Therapy must be rapid to prevent permanent vascular consequences, and if administered in time the acute changes are usually reversed. However, the underlying cause of the crisis (usually renal failure) will persist.
References, resources, and further reading
Text
Brown, Jenifer M., Gordon H. Williams, and Leonard S. Lilly. “Hypertension.” In Pathophysiology of Heart Disease: A Collaborative Project of Medical Students and Faculty, 5e edited by Leonard S. Lilly, Chapter 13. Philadelphia: Lippincott Williams & Wilkins, a Wolters Kluwer Business, 2010.
Hajar, Rachel. “Framingham Contribution to Cardiovascular Disease.” Heart Views 17, no. 2 (April–June 2016): 78–81. https://www.ncbi.nlm.nih.gov/pmc/articles/PMC4966216.
Iqbal, Arshad Muhammad, and Syed F. Jaml. Essential Hypertension. Treasure Island, FL: StatPearls Publishing, 2022. https://www.ncbi.nlm.nih.gov/books/NBK539859/, CC BY 4.0.
Page, Michael R. “The JNC 8 Hypertension Guidelines: An In-Depth Guide.” Evidence-Based Diabetes Management 20, no. SP1 (January 2014). https://www.ajmc.com/view/the-jnc-8-hypertension-guidelines-an-in-depth-guide.
Figures
Figure 3.1: Potential sources of essential hypertension. Grey, Kindred. 2022. CC BY 4.0. Added Amethyst Studio. “Heart.” 2019, from Noun Project, CC BY 4.0. Added Knicky, Nicky. “Brain.” 2015, from Noun Project, CC BY 4.0. https://archive.org/details/3.1_20220113.
Figure 3.2: Consequences of hypertension. Grey, Kindred. 2022. CC BY 4.0. https://archive.org/details/3.3_20220113
