Chapter 15 Pricing Strategy
Learning Objectives
- Identify pricing strategies that are appropriate for new and existing products.
- Understand the stages of the product life cycle.
Pricing a Product
As introduced in a previous chapter, one of the four Ps in the marketing mix is price. Pricing is such an important aspect of marketing that it merits its own chapter. Pricing a product involves a certain amount of trial and error because there are so many factors to consider. If a product or service is priced too high, many people simply won’t buy it. Or your company might even find itself facing competition from some other supplier that thinks it can beat your price. On the other hand, if you price too low, you might not make enough profit to stay in business. Let’s look at several pricing options that were available to those marketers at Wow Wee who were responsible for pricing Robosapien, an example we introduced earlier. We’ll begin by discussing two strategies that are particularly applicable to products that are being newly introduced.
New Product Pricing Strategies
When Robosapien was introduced to the market, it had little direct competition in its product category. True, there were some “toy” robots available, but they were not nearly as sophisticated. Sony offered a pet dog robot called Aibo, but its price tag of $1,800 was really high. Even higher up the price-point scale was the $3,600 iRobi robot made by the Korean company Yujin Robotics to entertain kids and even teach them foreign languages. Parents could also monitor kids’ interactions with the robot through its video-camera eyes; in fact, they could even use the robot to relay video messages telling kids to shut it off and go to sleep.[1]

Skimming and Penetration Pricing
Because Wow Wee was introducing an innovative product in an emerging market with few direct competitors, it considered one of two pricing strategies:
- With a skimming strategy, Wow Wee would start off with the highest price that keenly interested customers would pay. This approach would generate early profits, but when competition enters—and it will, because at high prices, healthy profits can be made in the market—Wow Wee would have to lower its price. Even without competition, they would likely lower prices gradually to bring in another group of consumers not willing to pay the initial high price.
- Using penetration pricing, Wow Wee would initially charge a low price, both to discourage competition and to grab a sizable share of the market. This strategy might give the company some competitive breathing room (potential competitors won’t be attracted to low prices and modest profits). Over time, as its dominating market share discourages competition, Wow Wee could push up its prices.
Other Pricing Strategies
In their search for the best price level, Wow Wee’s marketing managers could consider a variety of other approaches, such as cost-based pricing, demand-based pricing, prestige pricing, and odd-even pricing. Any of these methods could be used not only to set an initial price but also to establish long-term pricing levels.
Before we examine these strategies, let’s pause for a moment to think about the pricing decisions that you have to make if you’re selling goods for resale by retailers. Most of us think of price as the amount that we—consumers—pay for a product. But when a manufacturer (such as Wow Wee) sells goods to retailers, the price it gets is not what we the consumers will pay for the product. In fact, it’s a lot less.
Here’s an example. Say you buy a shirt at the mall for $40 and that the shirt was sold to the retailer by the manufacturer for $20. In this case, the retailer would have applied a mark-up of 100 percent to this shirt, or in other words $20 mark-up is added to the $20 cost to arrive at its price (hence a 100 percent markup) resulting in a $40 sales price to the consumer. Mark-up allows the retailer to cover its costs and make a profit.
Cost-Based Pricing
Using cost-based pricing, Wow Wee’s accountants would figure out how much it costs to make Robosapien and then set a price by adding a profit to the cost. If, for example, it cost $40 to make the robot, Wow Wee could add on $10 for profit and charge retailers $50. Cost-based pricing has a fundamental flaw—it ignores the value that consumers would place on the product. As a result, it is typically only employed in cases where something new or customized is being developed where the cost and value cannot easily be determined before the product is developed. A defense contractor might use cost-based pricing for a new missile system, for example. The military might agree to pay costs plus some agreed amount of profit to create the needed incentives for the contractor to develop the system. Building contractors might also use cost-based pricing to protect themselves from unforeseen changes in a project: the client wanting a home addition would get an estimate of the cost and have an agreement for administrative fees or profit, but if the client changes what they want, or the contractor has unexpected complications in the project, the client will pay for the additional costs.
Demand-Based Pricing
Let’s say that Wow Wee learns through market research how much people are willing to pay for Robosapien. Following a demand-based pricing approach, it would use this information to set the price that it charges retailers. If consumers are willing to pay $120 retail, Wow Wee would charge retailers a price that would allow retailers to sell the product for $120. What would that price be? If the 100 percent mark-up example applied in this case, here’s how we would arrive at it: $120 consumer selling price minus a $60 markup by retailers means that Wow Wee could charge retailers $60. Retailer markup varies by product category and by retailer, so this example is just to illustrate the concept.
Dynamic Pricing
In the hospitality industry, the supply of available rooms or seats is fixed; it cannot be changed easily. Moreover, once the night is over or the flight has departed, you can no longer sell that room or seat. This fact combined with the variation in demand for rooms or flights on certain days or times (think holidays or special events), has led to dynamic pricing. Revenue management, and the growth of online travel agencies (OTA’s) like Hotwire, Expedia, and Priceline are methods of maximizing revenue for a given night or flight. Hotels and airlines use sophisticated revenue management tools to forecast demand and adjust the availability of various price points. Online travel agents like Hotwire publicize last-minute availability with special rates so that unsold rooms or flights can attract customers and still earn revenue. This approach allows hotels and airlines to maximize revenue opportunities for high demand times such as university graduations and holidays, and also for special events like the Super Bowl or the Olympics. Losses are minimized during low-demand times because unused capacity is offered at a discount, attracting customers who might not have considered traveling at off peak times.
Prestige Pricing
Some people associate a high price with high quality—and, in fact, there generally is a correlation. Thus, some companies adopt a prestige-pricing approach—setting prices artificially high to foster the impression that they’re offering a high-quality product.
Competitors are reluctant to lower their prices because it would suggest that they’re lower-quality products. Let’s say that Wow Wee finds some amazing production method that allows it to produce Robosapien at a fraction of its current cost. It could pass the savings on by cutting the price, but it might be reluctant to do so: what if consumers equate low cost with poor quality?
Odd-Even Pricing
Do you think $9.99 sounds cheaper than $10? If you do, you’re part of the reason that companies sometimes use odd-even pricing—pricing products a few cents (or dollars) under an even number. Retailers, for example, might price Robosapien at $99 (or even $99.99) if they thought consumers would perceive it as less than $100.

Loss Leaders
Have you ever seen items in stores that were priced so low that you wondered how the store could make any money? There’s a good chance they weren’t—the store may have been using a loss leader strategy—pricing an item at a loss to draw customers into the store. Once there, store managers hope that the customer will either buy accessories to go along with the new purchase or actually select a different item not priced at a loss. You might have visited the store to buy a specially-priced laptop and ended up leaving with a more expensive one that had a faster processor. Or perhaps you bought the HDTV that was advertised, but then also bought a new surge protector and a streaming player. In either case, you did exactly what the store hoped when they priced the advertised item at a loss.
Bundling
Perhaps you are one of the many customers of a cable television provider that also buys their high-speed internet and/or their phone service. Or when you stop by your favorite fast-food outlet for lunch, maybe you sometimes buy the combo of burger, fries, and a drink. If you do, you’ve experienced the common practice of a bundling strategy—pricing items as a group, or bundle, at a discount to the cost of buying the items separately. Bundling has significant advantages to both buyers and sellers. Obviously, buyers receive the discount. Sellers, on the other hand, can sell more goods and services with this approach. Perhaps you would have settled for a water instead of a soft drink, but the combo price made the soft drink just a few cents more. Without bundling, that soft drink might not have been sold.
If the sale involves some kind of recurring service—like the previously-mentioned example of cable—bundling can also result in higher levels of customer retention. If you decided one day that you wanted to replace your cable with satellite TV, for example, you might well find that the discount from moving to satellite was far less than you expected, because unbundled from cable TV, the price for your internet service could take a substantial jump. If so, like many others who have likely considered making this move, you might find it in your best interests to stick with the original bundled package, no matter how trapped or frustrated you might feel as a result.
The Concept of Mark-Up
Inherent in any pricing strategy is the need to make money—no business would last long selling items or services below cost. A mark-up is simply the amount added to the cost of a product in order to cover indirect costs and provide a profit. For example, if a producer of packaged cookies sold them to convenience stores for 40 cents a unit, and the convenience store resold them for 60 cents, the store would have taken a 20 cent mark-up on the cookies. Mark-up can also be calculated in percentage terms, in which case the percentage is determined from the original cost. In our cookie example, the mark-up is 50 percent—20 cents of mark-up divided by the 40 cents that the convenience store paid for them. While the concept of mark-up is most commonly used in a retail setting, it can be applied in any case in which an item is resold by an intermediary that links the producer to the ultimate consumer.
The Product Life Cycle

Sport utility vehicles (SUVs) are among the most popular categories of passenger car on US roads. Offering an elevated view of the road, the safety that comes with size, spacious interior and cargo areas, and often superior handling performance in bad weather—especially 4-wheel-drive SUVs—it is no wonder that American consumers have bought tens of millions of these vehicles. For a long time, SUV sales followed close to the classical pattern of what is known as the product life cycle:
Yet in 2009, when the economy faltered due to the financial crisis and oil prices surged from about $40 a barrel to nearly $80,[2] many pundits declared the SUV to be in permanent decline. In fact, the data appeared to support this contention:
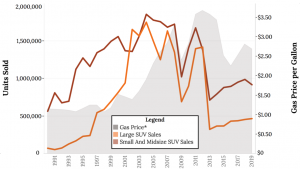
As you can see from the figure, SUV sales did in fact decline, rather dramatically. But SUV sales are too critical to the profitability of the major automakers for them to just watch their cash flows disappear.[3] Instead, the automakers redesigned their products, including an increased emphasis on smaller SUVs. In fact, the Honda CR-V and the Toyota RAV4, two of the smaller SUV’s on the market, now battle each other for the crown of top-selling SUV in the United States.[4] Many consumers adapted their budgets to compensate for higher oil prices. Sales, particularly of mid-sized SUVs, roared back in 2010, with sales of large SUV’s showing a similar, but smaller, upward trend too.
While their new designs certainly helped to reinvigorate sales, more recently automakers have gotten a somewhat unexpected additional boost from declining oil prices. For all their benefits, SUVs are not the most fuel efficient cars on the market. But as consumers began to pay less at the pump, the cost of operating SUVs declined, and SUV sales have continued to be strong. Automakers continue to invest in new models—for example, German automaker Volkswagen introduced a new 5-seat, mid-sized SUV at the Detroit auto show in January, 2015. The company is assembling a group of about 200 experts, including representatives of its dealer network, to help it better cater its offerings to the American market.[5]
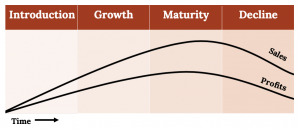
Many products tend to follow the classical product life cycle pattern of Figure 15.4. Let’s take a closer look at the product life cycle and see what we can learn from it. The graph is a simplified depiction of the product life cycle concept. Many products never make it past the introduction stage. Some products avoid or reverse decline by reinventing themselves. In part, reinvention is what the SUV market has experienced, in addition to the boost it has received from lower gas prices.
The Life Cycle and the Changing Marketing Mix
As a product or brand moves through its life cycle, the company that markets it will shift its marketing-mix strategies. Figure 15.6 summarizes the market and industry features of each stage. Let’s see how the mix might be changed to address the differences from one stage to the next.
| Stage | Introduction | Growth | Maturity | Decline |
|---|---|---|---|---|
| Price Levels | Depends on choice of introductory strategy | Converges as competitors enter market | Initially high but tend to decline as growth disappears | Initially declines but may rise as competitors exit |
| Number of Competitors | Few | Rapidly Rising | Begins to decline through consolidation | Few or one |
| Industry Profits | Negative | Rising | Highest | Declining |
| Customers | Few—Innovators Only | Rising—Early Adopters | High/Stable, begins to drop late in cycle | Declining |
| Objectives | Awareness and Adoption | Gain Market Share | Defend Share and Maximize Profits | Milk Remaining Value, Minimize Investment |
Introduction Stage
At the start of the introduction stage, people—other than those who work in the industry—are likely to be completely unaware that a product even exists. Building awareness is a key to adoption of the product. Companies invest in advertising to make consumers aware of their offerings and the benefits of becoming a customer. For many products, the early adopters are people who value newness and innovation. If a company faces only limited competition, it might use a skimming approach to pricing because people who want to be among the first to have the product will generally be willing to pay a higher price (recall that “skimming” means that the company will set initial prices high, and only those consumers who feel especially excited about the product will buy it). The company will then lower prices to appeal to the next layer of consumers—those who wanted the product but were unwilling to pay the high introductory price. The company will continue to gradually lower prices, in effect taking off layer after layer of potential customers until the product is priced low enough to be afforded by the mass market.

If the company has or expects a lot of competition, though, it may decide to use penetration pricing and capture a lot of market share, which may discourage some potential competitors from entering the market at all. The higher the price levels in a market, the more likely it is that new competitors will want to enter.
During the introductory stage, the industry as whole will sell only a relatively small quantity of the product, so competitors will distribute the product through just a few channels. Most retailers charge what is called a “slotting fee”—a payment the manufacturer makes to persuade the retailer to stock the item. If the product fails, they do not offer refunds on these charges, so producers will want to be confident that a product will draw enough customers before they pay these fees and so may limit its initial distribution. Because sales at this stage are low while advertising and other costs are high, all competitors tend to lose money during this stage.
Growth Stage
As the competitors in an industry focus on building sales, successful products will enter a stage of rapid customer adoption, which is not surprisingly called the growth stage in the product life cycle. Depending on how innovative and attractive a product is, the industry might reach the growth stage relatively quickly—or it could take many months or even longer for that point to arrive, if it happens at all. In order for industry sales to increase rapidly, advertising costs will generally be very high during the growth stage. If competition appears, companies may respond by lowering prices to retain their market shares. Competitors will also be looking for channels in which to distribute their products. Where possible, they will try to establish exclusive arrangements with distributors, at least for a period of time, so that their product may be the only one available in a product category at a particular retail outlet. During the growth stage, it is also important for companies to invest in making improvements to their products so as to maintain any advantage they may have established over their competitors. Since sales are rising rapidly during the growth stage, many products begin to turn a profit here, even though they are still investing heavily in advertising, establishing distribution, and refining the product itself.

Maturity Stage
If a product survives the growth stage, it will probably remain in the maturity stage for a long time. Sales still grow in the initial part of this stage, though at a decreasing rate. Later in the maturity stage, sales will plateau and eventually begin to move in a slightly downward direction. By this stage, if not sooner, competitors will have settled on a strategy intended to deliver them a sustainable competitive advantage—either by being the low cost producer of a product, or by successfully differentiating their product from the competition. Since at least one competitor will generally move towards a low-cost strategy, after initially peaking, price levels begin to decline during the maturity stage. Price wars may even occur, but profits still tend to be strong because sales volume remains high.

As the product becomes outdated, the company may make changes in keeping with changing consumer preferences, but usually not as rapidly as in the earlier stages of the life of a product. Branding becomes a key aspect of success in the maturity stage, particularly for those companies seeking to differentiate their products as their source of competitive advantage. Also during the maturity stage, industry consolidation is high; in other words, larger competitors will buy up smaller competitors in order to find synergies and build share and scale economies. Some models of the product life cycle reflect a stage called “shakeout,” which occurs towards the end of the growth and the beginning of the maturity stages. The term shakeout reflects this trend towards industry consolidation. Some competitors survive and others get “shaken out,” either by going out of business or by being acquired by a stronger competitor.
Decline Stage
At some point, virtually every product will reach the decline stage, the point at which sales drop significantly. New innovations, changes in consumer tastes, regulations, and other forces from the macro-level business environment can change the outlook for a product almost overnight. Products with a very short life cycle are known as “fads.” They may move through the entire product life cycle in a matter of months. Many products, particularly those which have experienced a long period in maturity, may stay in the decline phase for years. Ironically, price levels during the decline stage may actually increase, which occurs because the number of competitors is few—in fact, there may be only one remaining, giving that company great pricing power over the few consumers who still want or need the product. New product development is usually very limited, unless a company believes that innovation can restart growth in the category, as we saw with new SUV models. Also, advertising is typically limited or non-existent—those who need the product are likely to know about it already. So while it may seem counter-intuitive, many companies make a lot of money while they are riding the downward shape of the product life cycle curve during the decline stage.

Key Takeaways
- There are several pricing strategies appropriate for different product and market situations:
- A new product can be introduced with a skimming strategy—starting off with a high price that keenly interested customers are willing to pay. The alternative is a penetration strategy, charging a low price, both to keep out competition and to grab as much market share as possible.
- With cost-based pricing, a company determines the cost of making a product and then sets a price by adding a profit to the cost.
- With demand-based pricing, marketers set the price that they think consumers will pay.
- Companies use prestige pricing to capitalize on the common association of high price and quality, setting an artificially high price to substantiate the impression of high quality.
- Finally, with odd-even pricing, companies set prices at such figures as $9.99 (an odd amount), counting on the common impression that it sounds cheaper than $10 (an even amount).
- The stages of development and decline that products go through over their lives is called the product life cycle.
- The stages a product goes through are introduction, growth, maturity, and decline. A process called shakeout occurs during the transition between growth and maturity, resulting in fewer competitors remaining in the market.
- As a product moves through its life cycle, the company that markets it will shift its marketing-mix strategies.
Image Credits: Chapter 15
Figure 15.2: BrokenSphere (2010). “FF XIII Xbox 360 Version Price Tag With Gift Card Offer at Target.” Wikimedia Commons. CC BY-SA 3.0. Retrieved from: https://commons.wikimedia.org/wiki/ File:FF_XIII_Xbox_360_version_price_tag_with_gift_card_offer_at_Target,_Tanforan.JPG
Figure 15.3: Tabea Damm (2018). Unsplash. Public Domain. Retrieved from: https://unsplash.com/photos/O7WzqmeYoqc
Figure 15.5: United States Department of Transportation (n.d.). “SUV sales by category (1990-2019).” 1990-2012 Sales Data Retrieved from: https://www.bts.gov/archive/publications/national_transportation_statistics/table_01_21; 2013-2019 Sales Data Retrieved from: Wards Automotive Yearbook ; 1990-1993 Gas Prices Retrieved from: https://www.energy.gov/eere/vehicles/fact-915-march-7-2016-average-historical-annual-gasoline-pump-price-1929-2015; 1994-2019 Gas Prices Retrieved from: https://www.eia.gov/dnav/pet/hist/LeafHandler.ashx?n=PET&s=EMM_EPM0_PTE_NUS_DPG&f=A
Figure 15.7: Moody Man (2013). “Google glasses.” Flickr. CC BY NC 2.0. Retrieved from: https://flic.kr/p/emikyH
Figure 15.8: Lloyd Dirks (2017). “Apple Watch.” Unsplash. Public Domain. Retrieved from: https://unsplash.com/photos/0vsk2_9dkqo
Figure 15.9: Daniel Romero (2019). “Space Gray iPhone XS, Black iPhone 11, & Space Gray iPhone 11 Pro.” Unsplash. Public Domain. Retrieved from: https://unsplash.com/photos/wMTBGjh314M
Figure 15.10: Open Grid Scheduler / Grid Engine (2011). “Cisco IP Phone.” Flickr. Public Domain. Retrieved from: https://flic.kr/p/zSMih1. Picture edited to remove background.
- Cliff Edward (2004). “Ready to Buy a Home Robot?” Business Week. Retrieved from: http://www.bloomberg.com/news/articles/2004-07-18/ready-to-buy-a-home-robot ↵
- Ron Scherer (2009). “Oil Prices Top a Barrel - Double the Cost of a Year Ago.” Christian Science Monitor. Retrieved from: http://www.csmonitor.com/USA/2009/1224/Oil-prices-top-78-a-barrel-double-the-cost-of-a-year-ago ↵
- Eric Mayne (2005). “Big 3 SUV Blitz Could Backfire.” Detroit News. ↵
- Kelsey Mays (2016). “Top 10 Best-Selling Cars: February 2016.” Cars.com. Retrieved from: https://www.cars.com/articles/top-10-best-selling-cars-february-2016-1420683940927/ ↵
- Andreas Cremer (2015). “VW Aims to Tune in to Local Tastes in Latest U.S. Turnaround Plan.” Reuters. Retrieved from: http://www.reuters.com/article/autoshow-volkswagen-idUSL6N0UR0NR20150112 ↵
