Chapter 5. Altitude Change: Climb and Glide
Introduction
Through the basic power and thrust performance curves considered in the last chapter we have been able to investigate the straight and level flight performance of an aircraft. We must now add another dimension to our study of performance, that of changes in altitude. We know that from the straight and level data we can determine the theoretical maximum altitude, or ceiling, for a given aircraft. The question to be answered now is how do we get the aircraft from one altitude to the other? This discussion must include the investigation of possible rates of climb and descent, the distance over the ground needed to climb a given altitude and the range of the aircraft in a glide. How fast can I get from altitude A to altitude B? How far can I glide after my engine fails? If I take off 600 feet from the end of the runway, can I clear the trees ahead?
To look at altitude changes we need to think in terms of energy changes. In climb we are turning kinetic and internal (engine) energy into an increase in potential energy. In a glide we are converting potential energy into velocity (kinetic energy) which will give us needed lift for flight.
One of the questions above involved the rate of climb. In climbing, the aircraft is increasing its potential energy. Rate of climb then involves the change of potential energy in a given time. The engine provides the needed energy for climb and the engine energy output per unit time is power (work per unit time). We are aware that a certain amount of power is required for straight and level flight at a given speed. To climb at that same speed then requires extra power and the amount of that extra power will determine the rate at which climb will occur. The maximum rate of climb at a given speed will then depend on the difference between the power available from the engine at that speed and the power required for straight and level flight. This can be determined from the power performance information studied in the last chapter.
The concept of adding power to increase altitude (climb) is usually not intuitive. Most of us are conditioned by experience with cars, boats and bicycles to think of speed increase as a consequence of adding power. These, of course, are vehicles limited to the altitude of the road or water surface. If we think about a car going over a hill, however, the process is not hard to understand. If a car is traveling at, say, 55 mph (since none of us would think of driving at speeds over the limit!) and we start up a hill holding the accelerator (throttle) steady, the car will decelerate as it climbs the hill, trading kinetic energy for potential energy. To maintain our 55 mph (keeping kinetic energy constant) as we move up the hill we must add power. The same is true in an aircraft.
One of the most difficult things for a flight instructor to teach a new pilot is that the throttle controls the altitude and the control stick or yoke controls the speed. This is, of course, not entirely true since the two controls are used simultaneously; however, this is the analogy that will best serve the pilot in a difficult situation. For example, on an approach to landing the pilot is attempting to hold a steady descent toward the runway. If a sudden downdraft causes a loss of altitude the pilot must take immediate action to regain the lost altitude or run the risk of an unplanned encounter with the ground short of the runway! Pulling back on the control to bring the nose of the aircraft up is the most common instinctive response since the aircraft is descending with the nose down. This will, however, merely increase the angle of attack and result in a reduction in speed, possibly leading to stall and certainly leading to further loss of lift and altitude. The proper response, adding power, will result in a climb to recover from the altitude loss. The ultimate control of the aircraft in such a circumstance will require the coordinated use of both controls to regulate both speed and altitude during this most difficult phase of flight.
The pilot in the above situation is not going to stop think about her or his aircraft's power available or power required performance curves. This is the job of the engineer who designs the airplane to be able to meet the pilot's needs in such a situation. This is our job in the sections that follow. In this study we must add an angle to our previous illustration of the balance of forces on the airplane. This will be the angle of climb, θ, which will be considered positive in a climb and negative in a glide or descent.
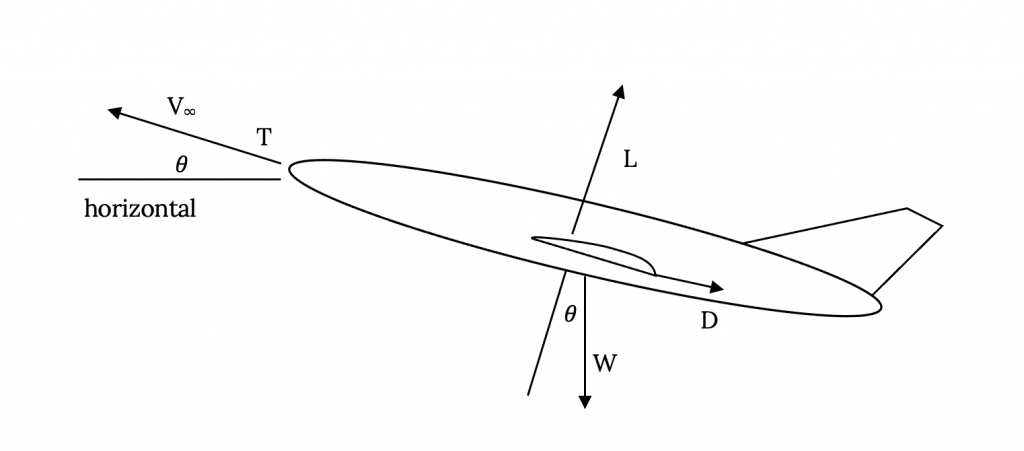
Summing the forces in the above figure along the thrust axis we find:
But this equation is a static relationship which does not allow acceleration; i.e., does not allow a change in kinetic energy. To consider all the forces which may be involved in climb we must also consider acceleration, so the above equation becomes:
If we rearrange this equation and divide by weight (mg) we get:
Then, multiplying by velocity, we have:
or
Now, V sinθ turns out to be the vertical velocity or the rate of climb as shown in Figure 5.2.
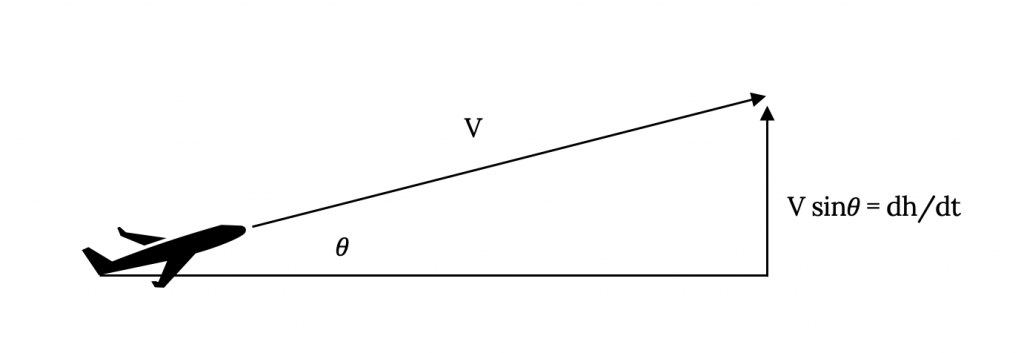
So we have (Pav - Preq) / W = dh/dt + (V/g)(dV/dt).
And, we can rearrange this to give
dh/dt = (Pav - Preq) / W - (V/g)(dV/dt).
It is common to refer to the first term in parentheses on the right in this equation as the excess power. When the excess power is divided by the weight as in the above equation it becomes the specific excess power, Ps.
Ps = (Pav - Preq) / W .
Now, going back to an earlier form of the equation, we can write
Ps = dh/dt + (V/g)(dV/dt)
This is a very important relationship which tells us that we can use our excess power (the power over and above that needed for straight and level flight) to either climb (dh/dt) or to change our speed (accelerate or decelerate) or to do both at the same time. We can also convert speed to altitude or altitude into speed.
In real situations a pilot will initiate a climb by both increasing the throttle (adding engine power) and slowing down, meaning that both engine power and kinetic energy are being converted into rate of climb. In descent the pilot will often reduce the plane’s power setting (throttle) so that not all of the decrease in potential energy goes into increasing the speed but some goes into the energy needed to maintain lifting flight.
In reality, how much gain can be realized by converting kinetic energy to potential energy without changing the engine power setting? We can find this fairly easily if we look directly at such an exchange
or
giving
Using this we can find that for an aircraft flying 200 mph and slowing to 160 mph during an initial climb, the altitude gain from swapping kinetic energy for potential energy comes to 483 feet. This is pretty small if one is thinking of making a 5000 ft climb but it may be useful in terms of emergency avoidance maneuvers. On the other hand, the same equation will show that an airplane flying 500 mph can gain over 5000 feet in altitude by slowing to 300 mph and if one is looking at a supersonic speed aircraft this kinetic for potential energy swap becomes very significant in accounting for climb and descent capabilities. Note that the mass of the aircraft is not in the equation above.
In a later chapter we will return to the concepts of specific excess energy and of trading speed for altitude or visa-versa. For the present we will look at the simpler case of un-accelerated flight and assume that all climbs and descents are done at constant speed and that the rate of change of altitude is only a function of the use of excess power. This will essentially assume that the altitude to be gained or lost by changing our airspeed is negligible.
We will start our “static” look at altitude change by looking at gliding flight with zero power available.
5.1 Gliding Flight
The first case we will consider will be the simple case of non-powered descent, or glide. This is a very important performance situation for an aircraft since all aircraft are susceptible to engine failure. One of the first things a student pilot is taught to do is to properly handle an "engine-out" in his or her aircraft; how to set up the best speed to optimize the rate of descent in order to allow maximum time to call for help, restart the engine, prepare for an emergency landing, etc. For some aircraft of course, the unpowered glide is normal. Sailplanes and hang gliders come to mind immediately but one should also consider that the Space Shuttle is nothing but an airplane with an "engine-out" in its descent from orbit to landing!
In an unpowered glide there are only three forces acting on the aircraft, lift, drag and weight. These forces must reach an equilibrium state in the glide. It is up to the pilot to make sure that the equilibrium reached is optimum for survival and, in most aircraft, it is up to the aircraft designer to make the airplane so that it will seek a reasonable equilibrium position on its own. The airplane which stalls and goes into a spin upon loss of an engine will not be very popular with most pilots! We must now determine what those optimum conditions are.
Using Figure 5.1 and using a thrust of zero we can write the following two simple force balance relations in the lift and drag directions:
Dividing the second equation by the first gives
There's that term again, L/D!
This tells us a very simple and very important fact: the glide angle depends only on the lift-to-drag ratio.
The glide angle is:
and
Something seems wrong here. Does this mean that glide angle has nothing to do with the weight of the aircraft? It sure seems like a heavy airplane wouldn't glide like a light one. Will a Boeing 747 glide just like a Cessna 152? What about the Space Shuttle?
Yes, the equation doesn't contain the weight of the aircraft even though it was in the original force balance equations. The glide angle depends only on the lift-to-drag ratio and that ratio depends on parameters such as CD0, K and e as discussed in the last chapter.
But doesn't the fact that there must be sufficient lift to support the weight (or at least most of it) mean that weight really is a factor? Not really, since drag is also seen to be a function of weight and in the ratio of lift-to-drag, the weight "divides out" of the relationship. A Boeing 747 can indeed glide as well as a Cessna 152.
So, what are our concerns in a glide? Essentially we want to know how far the aircraft can glide (range) and how long will it take to reach the ground (endurance).
5.1.1 Range in a Glide
We will look at the range assuming an absence of any natural wind. This is, of course, rarely the case in real life but is the easiest case for us to examine. We will also assume a steady glide, meaning that the pilot has set (or trimmed) the aircraft such that it will hold the selected indicated airspeed and angle of glide during the entire descent. The geometry of the situation is rather simple as shown below.
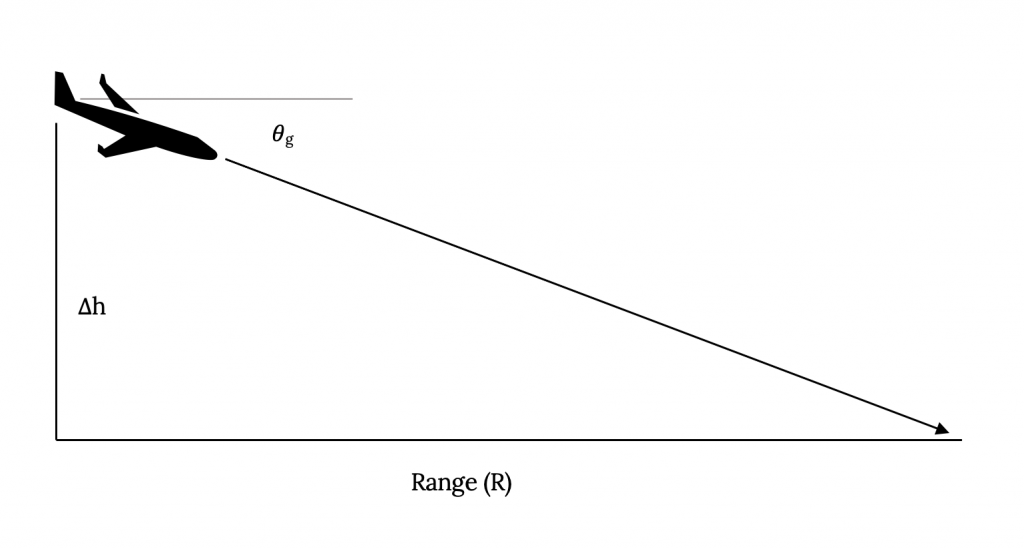
From the figure it is clear that the glide angle is the arc-tangent of the change in altitude divided by the range.
This gives a range of:
and since the tangent of the glide angle is simply the lift‑to‑drag ratio we have
Maximum range in a glide occurs at the maximum-to-drag ratio; i.e., at minimum drag conditions! We already know how to find anything we may wish to know about minimum drag conditions so we know how to determine conditions for maximum range in an un-powered glide.
To the pilot this means that he or she must, upon loss of engine power, trim the aircraft to glide at the indicated (sea level equivalent) airspeed for minimum drag, a speed which the engineer has provided in the aircraft owner's handbook, if maximum range is desired. The pilot would then fly the aircraft to hold the desired speed in the glide.
Usually, maximum range is not the most desirable goal in an "engine-out" situation. The best solution is usually to optimize the time before "ground encounter" (hopefully a landing!). This means going for minimum rate of descent rather than maximum range. This is, again, one of those things which may not be intuitive to most people, even to pilots, and there are many cases where planes have crashed as pilots tried unsuccessfully to stretch their range after an engine fails. Wind, which wasn't included in the above calculations, can cut range to zero or can enhance it. Distances are hard to judge from the air. Student pilots are taught that in an "engine-out" situation it is time that should be optimized rather than range. The pilot needs to know the airspeed for minimum rate of descent rather than for maximum range in order to trim the aircraft for a descent which will allow the maximum time to try to restart the engine, to prepare for an emergency landing, to radio for help, etc. This means we are interested in the rate of descent.
Looking at rate of descent is a little more complicated than looking at range. We will consider two cases, the small glide angle case where we can make some simplifying assumptions and the general or large angle case. In looking at the small angle case we will use the usual mathematical assumption that the cosine of an angle is close enough to unity that we can approximate it as one. The usual limit of this assumption is about 5 degrees since a check on our calculator will show that cos 5º = 0.99619. However, our angle of interest is the glide angle which we already know is equal to the arc‑tangent of D/L. We would also like to assume that the sine of that angle is approximately equal to its tangent. Because of this we will stretch the applicability of the small angle rationalization to include glide angles up to about 15 degrees.
(At fifteen degrees the cosine is 0.9659, so we are still within 5% to of our goal of cosine = 1.0. This is usually pretty good in the real world. Also the tangent of fifteen degrees is 0.2679 while the sine is 0.2588, making our sine = tangent assumption good with less than 4% error.)
A useful result of the small angle assumption is that it will allow us to further assume that lift is approximately equal to weight. Since we had
and if
then
This might be referred to as "quasi‑level" flight. The main advantage of this assumption is that it allows us to continue to relate velocity to weight through
even though flight isn't really straight and level.
Now we want to begin to look at rate of change of altitude, dh/dt or h. This is the rate of climb when defined in terms of a positive change of altitude as was shown in Figure 5.2.
From Figure 5.2 we see that the rate of climb is equal to the plane’s airspeed multiplied by the sine of the angle of climb. Referring to our earlier force balance equations for the glide case (no thrust) we can write
or
and using the small angle assumption that weight is approximately equal to lift gives
Changing to a form which uses the force coefficients
Now use the other small angle assumption for velocity
we have
or finally
Note that this is a negative rate of climb since we are looking at the case of glide or descent (we assumed no thrust).
From the above it is obvious that for the minimum rate of descent for a given aircraft and altitude will occur when CD/CL3/2 is at a minimum. Looking back at our study of power in the previous chapter we find that this is the same condition found for minimum power required.
In review, we have found the conditions needed for flight in an un-powered glide for two optimum cases, minimum rate of descent and maximum range with no wind. These are found to occur when the descending aircraft is trimmed to hold an indicated airspeed for minimum power required conditions and for minimum drag, respectively. We know everything about both of these conditions from the previous chapter's discussion.
We have found that for any glide, the range with no wind is
and for glide angles of fifteen degrees or less the rate of descent is
These can be used to find the range and rate of descent for any glide condition where we know the appropriate lift and drag coefficients (angle of attack) and are not limited to the optimum cases. In addition, we know that to optimize range we need to fly at minimum drag conditions while for a minimum rate of descent, we need to fly at the conditions for minimum power required.
Most aircraft in a glide will satisfy the fifteen degree small angle assumption used in the above. A few, such as the Space Shuttle, will not. It is therefore worthwhile to back up and briefly consider the case of steep glide angles. This is, of course, the general case without the small angle assumption. We must use the force balance equations as developed without the approximations. These become
and
The velocity equation cannot assume straight and level flight and the first of the above two equations must be used to insert aircraft weight into the relationship.
or
The glide angle definition is unchanged

and we can use this relation with some simple trigonometry to find a relationship between the cosine of the glide or climb angle and the lift and drag coefficients.
The rate of climb (rate of descent) equation now becomes
or
This is a relation which will determine the rate of descent for any glide angle. It is noted that this equation is not really any more complicated mathematically than that found using the small glide angle approximation. The difference is that there is now no correlation between the minimum rate of descent and the condition for minimum power required.
5.2 Time to Descend
Using the rate of descent and the altitude change
it is possible to determine the time required for that descent.
dt = dh / (dh/dt)
If the rate of descent is constant this can become
In reality we have already shown that for both the general and the small angle cases the rate of descent is not constant but depends on altitude since it is a function of density. The complete equation would therefore be
and by using the equations for density variation in the standard atmosphere one could insert density as a function of h to give a general equation for time of descent. However, to get a simpler picture of the time to descend problem we will assume that an incremental approach can be used where the density, and thus rate of descent, can be assumed constant over reasonably small increments of altitude during descent. For example, over an increment of altitude of 1000 feet we can base our calculations on the density (rate of descent) half-way between the upper and lower altitude without introducing much error. This can be repeated incrementally to find the time of descent over larger altitude changes. A few simple examples might help illustrate this process.
EXAMPLE 5.1
A sailplane weighs one-thousand pounds and has a wing loading (W/S) of 12.5 pounds per square foot with a drag polar given by
Find the time to glide from 1000 feet to sea level at minimum rate of descent (minimum sink rate).
Solution: Minimum sink rate occurs at conditions for minimum power required
We can check the resulting lift-to-drag ratio to determine if the small angle approximations are valid
Thus we can find the velocity from the "quasi-level" equation
and using the density for a 500 foot altitude we have
and the rate of descent becomes
giving a time to descend the 1000 feet
EXAMPLE 5.2
Consider descent of the same sailplane from a much higher altitude. We can use a descent from 20,000 feet to investigate the inaccuracies of using the incremental approach to the time to descend problem. Suppose that in order to get a first guess for the time to descend we assumed a single increment using the density at 10,000 feet. We will first find an airspeed
then a rate of descent
giving a time for descent of
We should expect improved accuracy if we use four increments of 5000 feet each, calculating velocities and rates of descent at 17,500; 12,500; 7,500; and 2,500 foot altitudes as shown in the following table.
Table 5.1: Example 2
| h(ft) | σ | V(fps) | ||
|---|---|---|---|---|
| 20,000-15,000 | 17,500 | 0.5793 | 124.49 | 4.258 |
| 15,000-10,000 | 12,500 | 0.6820 | 114.74 | 3.924 |
| 10,000-5,000 | 7,500 | 0.7982 | 106.05 | 33.627 |
| 5,000-SEA LEVEL | 2,500 | 0.9288 | 98.32 | 3.363 |
VsL = 94.752f |
||||
The total time to descend is found by summing the incremental times from each of the 5000 foot descents.
giving t = 5313.8 sec = 88.6 min
This gives a time to descend from 20,000 feet of 88.6 minutes, a difference of only 0.2 minutes or 10.8 seconds from the gross, single increment solution.
Does the above show that there is little point in breaking the glide into increments to find the time of descent or simply that the increments chosen were too large to make much difference? A solution of the "exact" integral equation for the 20,000 foot descent will result in a time of descent of 5426.5 seconds or 90.4 minutes. There is only a two minute difference between the "exact" solution and the worst possible approximation; a 2% error!
5.3 Climbing Flight
As discussed earlier, the addition of power above that required for straight and level flight at a given speed will make possible either an increase in altitude or a change in speed or both. If speed is held constant while power (or thrust) is added the result will be a climb. Since climb is best thought of as an increase in potential energy we can best analyse it on an energy usage basis as reflected in power or energy addition per unit time. To begin our look at climb we can return to the figure used earlier and again write force balance equations in the lift and drag directions, this time adding the thrust vector.
It should be emphasized that we are assuming that climb occurs at constant speed. This means physically that climb is a straight exchange of energy from the engine for a gain in potential energy. It also means that our force balance equations sum to zero; ie, are static equations with no acceleration. We will not, however, restrict ourselves too much. As every good engineer should we will fudge a little by saying that we are flying at "quasi-steady: conditions and tolerate very small accelerations which are inevitable in real flight.
The rate of climb relation is still
From the Thrust/Drag force balance above we can write the angle of climb
The rate of climb is then
Note from the above that the angle of climb depends on the amount of excess thrust while the rate of climb depends on the amount of excess power. Not surprisingly, this is the same kind of dependence we found in the gliding case except there we spoke of drag instead of thrust.
Since the angle of climb and rate of climb both can be directly related to previously discussed performance curves for an aircraft, we can take a look at these parameters as they relate to these graphs. A typical plot of thrust and drag (thrust required) is shown below. At any given velocity the difference between the thrust and drag curves can be divided by the aircraft weight to determine the maximum possible angle of climb at that speed using the relationship defined earlier. Of course, at any given speed, not all of the excess available thrust need be used for climb if a lower angle of climb is desired. As the thrust and drag curves move together to the left and right, the possible angle of climb narrows toward zero at the velocities where thrust equals drag.
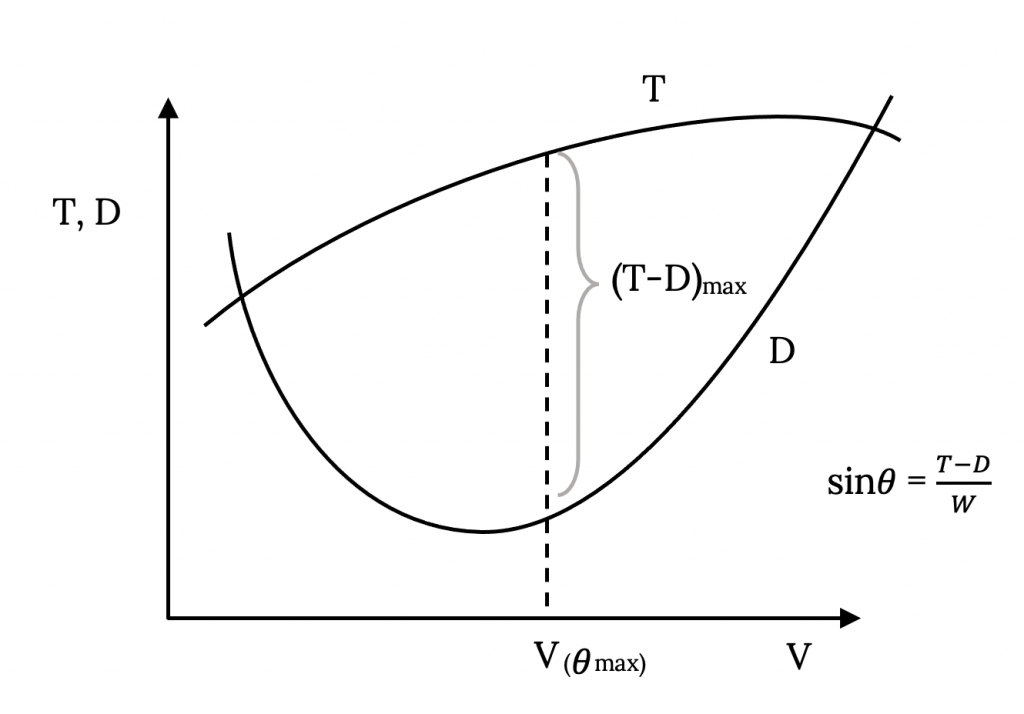
The velocity where the maximum possible angle of climb occurs is that for which the vertical distance between the thrust and drag curves is maximum. This could be found from an actual data plot by simply using a ruler or a pair of dividers to find this maximum. It could also be found analytically if functional relationships are known for the thrust and drag curves by taking the derivative of the difference in thrust and drag with respect to the velocity and setting that equal to zero to determine the maximum.
5.3.1 Case when Thrust is Constant
A simple case occurs when it can be assumed that the thrust available from an engine is constant, an assumption often made for jet engines. If the thrust is constant the maximum difference between thrust and drag and, hence, the maximum angle of climb, must occur when the drag is minimum. Once again minimum drag conditions become the optimum for a performance parameter. It should also be obvious that when thrust is not a constant, minimum drag is probably not the condition needed for maximum angle of climb.
The reader should note that no reference has been made in the above to a parabolic drag polar and the conclusions reached are not restricted to such a case. In the case of the parabolic drag polar we know how to determine the lift and drag coefficients and the speed for minimum drag from our previous study.
A typical plot of power versus velocity is shown below. We know from above that the rate of climb is equal to the difference in the power available and that required, at a given speed, divided by the aircraft weight. Thus the power available / power required graph can be used to graphically determine the rate of climb at any speed in the same manner as the thrust curves were used above. In cases where the power available is assumed constant, as is often the case in a simple representation of a propeller powered aircraft, the maximum rate of climb will occur at the speed where power required is a minimum. We know from the previous chapter how to determine the conditions for minimum power required. If power available is not constant, maximum rate of climb will not necessarily occur at the speed for minimum power required.
Note that the graph shown below plots P√σ versus Ve since this allows the power required data at all altitudes to collapse to a single curve as derived in Chapter 4.
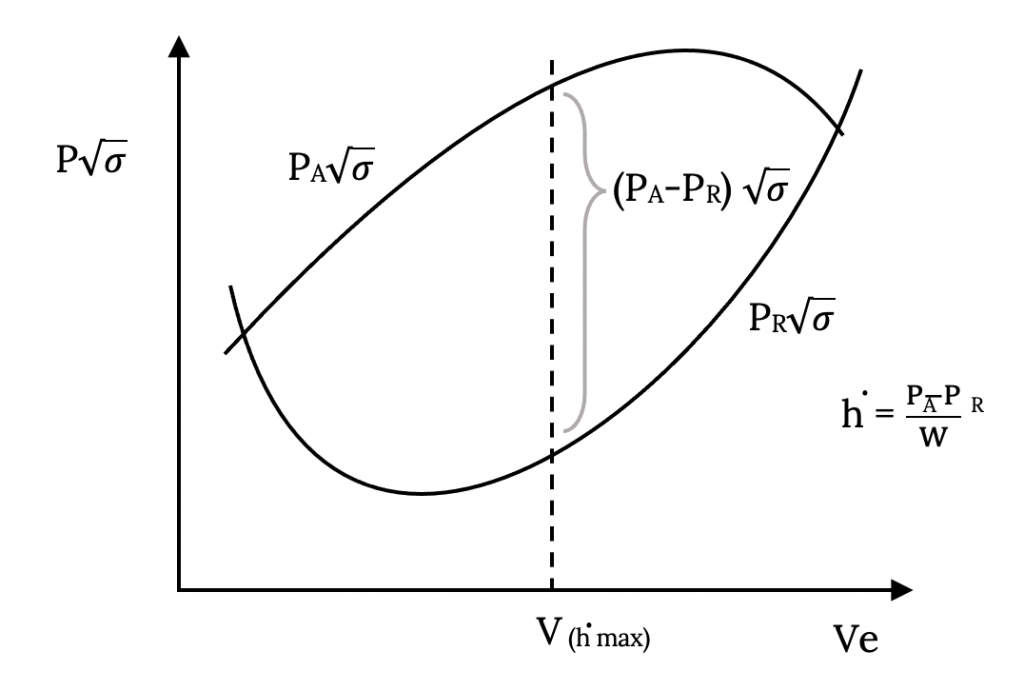
It should also be noted that maximum rate of climb and maximum angle of climb do not occur at the same speed.
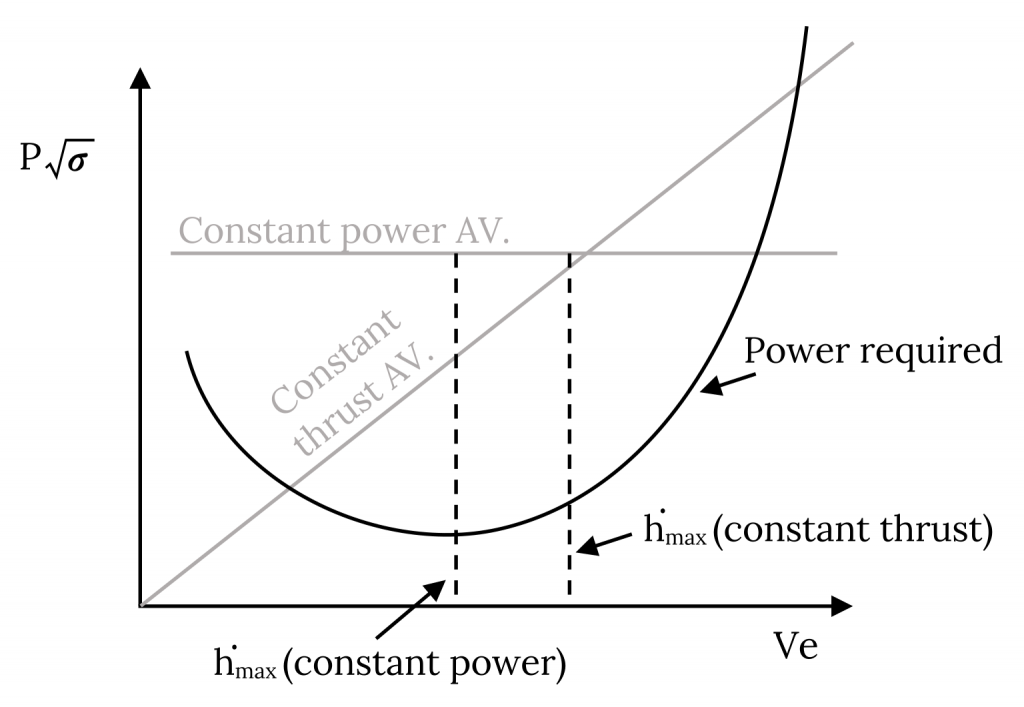
It is interesting to compare the power performance curves, and hence the rate of climb, for the two simple models we have chosen for jet and prop aircraft. In the plot which follows, the prop aircraft is assumed to have constant power available and the jet to have constant thrust. Since power available equals thrust multiplied by velocity, the jet power available data lies in a diagonal line starting at the origin. The power required curve assumes a common aircraft. In other words this is a comparison of the same airplane with two different types of engine. It is obvious that at lower speeds the rate of climb for the prop exceeds that for the jet while at higher speeds the jet can outclimb the prop. This comparison, while fictional, is typical of the differences between similar jet and prop aircraft. It shows one reason why one would not design a jet powered crop duster since such an aircraft needs a high rate of climb at very low speeds.
5.3.1.1 Special Case: Constant Thrust
In the case mentioned above as a simple model for a jet aircraft, finding the maximum angle of climb is easy since it must occur at the speed for minimum drag or maximum lift-to-drag ratio. The conditions for maximum rate of climb are not as simple. Looking at rate of climb again we recall
and assuming quasi-level flight we can write
Thus, we have a relationship which has the lift coefficient as the variable.
Again rising the quasi-level assumption which assumes that lift is essentially equal to weight
We now have a relation which includes both lift and drag coefficients as variables.
However, we know that drag coefficient depends on the lift coefficient in the drag polar.
This gives
or
The above equation is for the constant thrust case and shows the rate of climb as a function of only one variable, the lift coefficient. To determine the optimum rate of climb it is then necessary to take the derivative of this equation with respect to the lift coefficient. Only the terms in the brackets need be included in the derivative since it will be set equal to zero.
This gives
which can be solved via the quadratic equation to find the value of the lift coefficient which will give the highest rate of climb for this special case of constant thrust.
EXAMPLE 5.3
A given aircraft has CD0=0.013, K = 0.157, W = 35,000 lb, S = 530 sqft, T/W = 0.429 and thrust is constant with speed. Find the best rate of climb and the associated angle of climb.
Before starting our solution we should make sure we understand what is being asked. Note that the best angle of climb was not requested. The angle of climb sought was that for the best rate of climb case. Students sometimes assume that the answer sought is always for some optimum case.
To find the maximum rate of climb we use the relation found above to solve for the lift coefficient.
This can then be used to find the associated speed of flight for maximum rate of climb.
The angle of climb for maximum rate of climb (not maximum angle of climb) can then be found as follows:
Finally, these are used together to find the rate of climb itself.
Note: units of feet per minute are traditional.
Now let's look at the other optimum, that of maximum angle of climb for this same aircraft. Maximum angle of climb occurs at conditions for minimum drag or maximum L/D .
We can then find the lift coefficient associated with maximum angle of climb and the airspeed at which that occurs.
Finally, the rate of climb for the maximum angle of climb
Lets look at the answers above and make sure they are logical.
- The maximum rate of climb should be higher than the rate of climb for maximum angle of climb. Is that true?
- The climb angle for the maximum rate of climb case should be less than the maximum angle of climb. Is that true?
- Maximum angle of climb should occur at a lower airspeed than that for maximum rate of climb. Is that the case?
In all cases the above questions are satisfied. These are some of the questions that the student should ask in reviewing the solutions to a problem. Often asking questions such as these can catch errors which might otherwise be ignored.
One situation in which all pilots are interested in both rate of climb and angle of climb is on takeoff. In a normal takeoff the pilot wants to initially climb at the speed which will give the maximum rate of climb. This will allow the aircraft to gain altitude in as short a time as possible, an important goal as a precaution against engine or other problems in takeoff. Should an engine fail on takeoff, maximum altitude is desired to allow time to recover and make an emergency landing. There are, however, some situations in which it is in the pilot's best interest to forgo best rate of climb and go for best angle of climb. An obvious case is when the aircraft must clear an obstacle at the end of the runway such as a tree or tower. The figure below illustrates both cases.
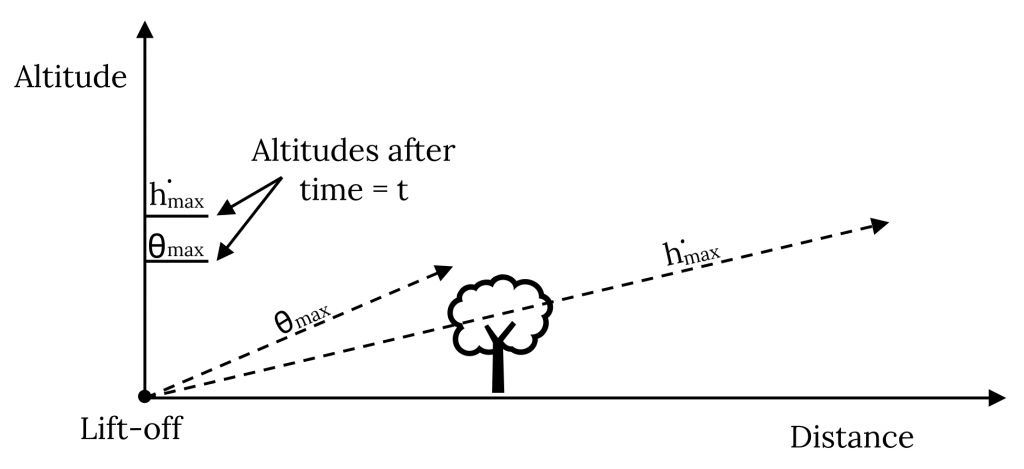
The airplane which flew at maximum rate of climb would have reached the desired altitude faster than the plane which flew at maximum angle of climb if that darn tree hadn't been in the way!
5.4 Time to Climb
To find the time to climb from one altitude to another we must integrate over the time differential
To integrate this expression we must know how V sin θ varies as a function of altitude. We are usually going to be interested in the minimum time to climb as a limiting case. This will, of course, occur at the speed for maximum rate of climb. This speed will be a function of altitude.
If we can find the rate of climb at each altitude we can plot rate of climb versus altitude as shown below. The area under the curve between the two desired altitudes represents the time to climb between those two altitudes.
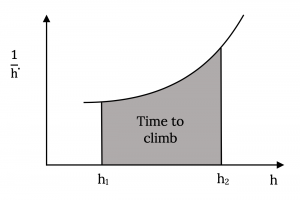
Either of the above methods can be used to find the time to climb. In reality they are the same. The analytical method may not be as simple as it appears at first since the equations must account for the velocity and climb angle variation with altitude, necessitating the incorporation of the standard altitude density equations into the integral. The equations could be simplified by the assumption of a constant velocity climb or a constant angle climb.
5.5 Power Variation with Altitude
We dealt earlier with the variation of power required (to overcome drag) with altitude and how the power required curves could be merged into one by plotting power multiplied by the square root of the density ratio. The power available must also be multiplied by the square root of the density ratio to be included on the same performance plot. In addition to this we must be aware of how the power available actually varies with altitude.
For both jet engines (turbojet, fan-jet and turbo-prop) and piston engines the power produced by the engine drops in proportion to the decrease in density with increased altitude.
For a turbocharged piston engine the turbocharger is designed to maintain sea level intake conditions up to some design altitude. A simple model of power variation with altitude for a turbocharged engine will have power constant at its sea level value up to about 20,000 feet and dropping in direct proportion to decreasing density at higher altitudes.
More complicated situations are possible with multiple stages of turbocharging.
It must be remembered that in plotting power data versus the sea level equivalent velocity we must both account for the real variation in power available as just discussed and multiply that result by the square root of the density ratio to make the power available curves compatible with the power required curves. This is not redundant. The first change is made to account for the real altitude effects and the second for a plotting scheme needed to collapse all power required data to a single curve.
5.6 Ceiling Altitudes
In earlier discussion we spoke of the ceiling altitude as that at which climb was no longer possible. This would be the altitude where the power available curve just touches the power required curve, indicating that the aircraft can fly straight and level at only one speed at that altitude. Here the maximum rate of climb is zero. We define this altitude as the absolute ceiling. This definition is, however, somewhat misleading.
Theoretically, based on our previous study, it would take an infinite amount of time to reach the ceiling altitude. One could look at the rate of climb possible for an aircraft which is, say, 500 feet below its absolute ceiling. A very low rate of climb would be found, resulting in a very large amount of time required to climb that last 500 feet to reach the absolute ceiling. Because of this we define a more practical ceiling called the service ceiling. The definition of the service ceiling is based on the rate of climb; ie, at what altitude is the maximum rate of climb so low as to make further climb impractical. This is different for jet and piston powered aircraft. For the piston aircraft, the service ceiling is the altitude at which the rate of climb is 100 feet per minute (or 0.5 meters per second). For the jet aircraft, the service ceiling is the altitude at which the rate of climb is 500 feet per minute (or 2.5 meters per second).
It should be noted that many fighter and high performance aircraft may, in reality, be able to exceed even their absolute ceiling through the use of energy management approaches. An aircraft may climb to its service ceiling, for example, and then go into a dive, building up excess kinetic energy, and then resume a climb, using both the excess power and the excess kinetic energy to climb to altitudes higher than that found as "absolute". Also, at very high altitude it may be necessary to include orbital dynamics in the consideration for climb and ceiling capabilities.
Homework 5
1. An aircraft weighs 3000 lb and has a 175 ft2 wing area, an aspect ratio of 7, and an Oswald Efficiency Factor, e, of 0.95. If CD0 is 0.028, plot drag versus velocity for sea level and 10,000 feet altitudes, plotting drag in 20 fps intervals. Also calculate the values of minimum drag and the velocity for minimum drag at both altitudes and compare them with the results on your graph. Use the graph paper provided; do not plot by computer.
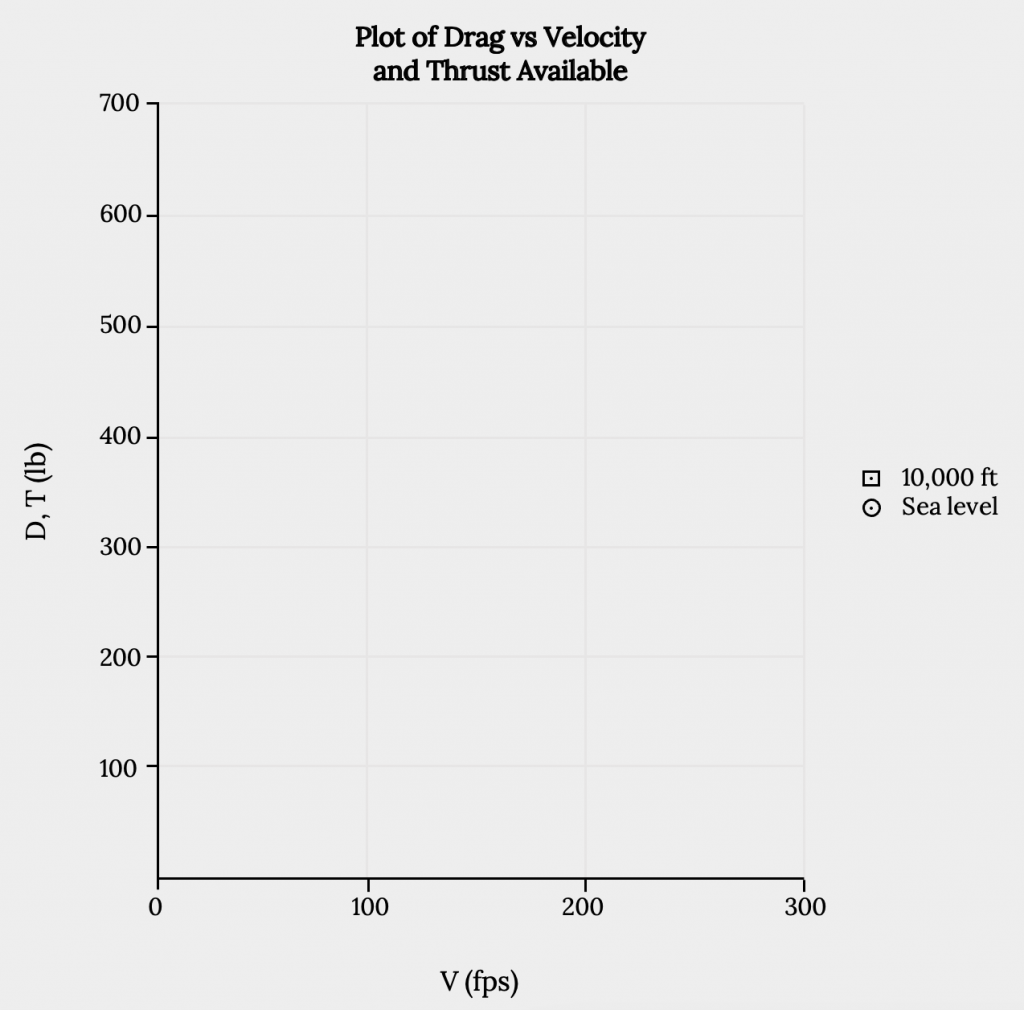
2. Using a sea level value of thrust of 400 lb and assuming that thrust is constant with velocity but varies with density (altitude), calculate the maximum and minimum true airspeeds at sea level and at 10,000 ft altitudes and confirm these answers graphically.
References
Figure 5.1: Kindred Grey (2021). "Forces in Climb." CC BY 4.0. Adapted from James F. Marchman (2004). CC BY 4.0. Available from https://archive.org/details/5.1_20210805
Figure 5.2: Kindred Grey (2021). "Velocity/Rate of Climb Angular Relationship." CC BY 4.0. Plane by Bayu Ardhy from the Noun Project. Public domain. Adapted from James F. Marchman (2004). CC BY 4.0. Available from https://archive.org/details/5.2_20210805
Figure 5.3: Kindred Grey (2021). "Range in a Glide." CC BY 4.0. Plane by Bayu Ardhy from the Noun Project. Public domain. Adapted from James F. Marchman (2004). CC BY 4.0. Available from https://archive.org/details/5.3_20210805
Figure 5.4: James F. Marchman (2004). "Decomposition of Lift and Drag Coefficients." CC BY 4.0.
Figure 5.5: Kindred Grey (2021). "Thrust and Drag Influence on Climb." CC BY 4.0. Adapted from James F. Marchman (2004). CC BY 4.0. Available from https://archive.org/details/5.5-new
Figure 5.6: Kindred Grey (2021). "Climb Capability on Power Graphs." CC BY 4.0. Adapted from James F. Marchman (2004). CC BY 4.0. Available from https://archive.org/details/5.6-new
Figure 5.7: Kindred Grey (2021). "Comparison of Constant Power and Constant Thrust Available Cases." CC BY 4.0. Adapted from James F. Marchman (2004). CC BY 4.0. Available from https://archive.org/details/5.7_20210805
Figure 5.8: Kindred Grey (2021). "Climb Maxima on Take-Off." CC BY 4.0. Tree by Richard from the Noun Project. Public domain. Adapted from James F. Marchman (2004). CC BY 4.0. Available from https://archive.org/details/5.8_20210805
Figure 5.9: Kindred Grey (2021). "Integrating to Get Time to Climb." CC BY 4.0. Adapted from James F. Marchman (2004). CC BY 4.0. Available from https://archive.org/details/5.9_20210805
Figure 5.10: Kindred Grey (2021). "Plot of Drag vs Velocity and Thrust Available." CC BY 4.0. Adapted from James F. Marchman (2004). CC BY 4.0. Available from https://archive.org/details/hw-5_20210805

