Appendix A: Airfoil Data

In Chapter 3 of this text we discussed many of the aspects of airfoil design as well as the NACA designations for several series of airfoils. Lift, drag, and pitching moment data for hundreds of such airfoil shapes was determined in wind tunnel tests by the National Advisory Committee for Aeronautics (NACA) and later by NASA, the National Aeronautics and Space Administration. This data is most conveniently presented in plots of lift coefficient versus angle of attack, pitching moment coefficient versus angle of attack, drag coefficient versus lift coefficient, and pitching moment coefficient versus lift coefficient and is found in literally hundreds of NACA and NASA Reports, Notes, and Memoranda published since the 1920s.

Many of the more important airfoil shapes have their test results summarized in the Theory of Wing Sections, a Dover paperback publication authored by Ira Abbott and Albert Von Doenhoff and first published in 1949. While the date of original publication might lead one to think this material must be out of date, that is simply not true and the Theory of Wing Sections is one of the most valuable references in any aerospace engineer’s personal library.

In the following appendix material a selection of airfoil graphical data is presented which can be found in the Theory of Wing Sections and in the non-copyrighted NACA publications which are the source of the Dover publication’s data. The airfoils presented represent a cross section of airfoil shapes selected to illustrate why one would select one airfoil over another for any given aircraft design or performance requirement.

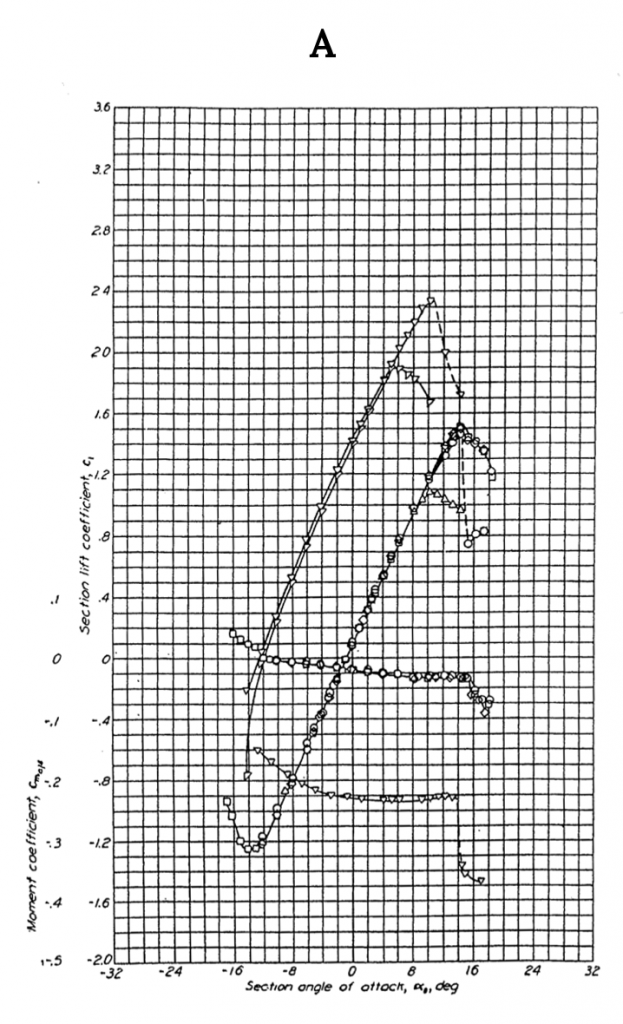
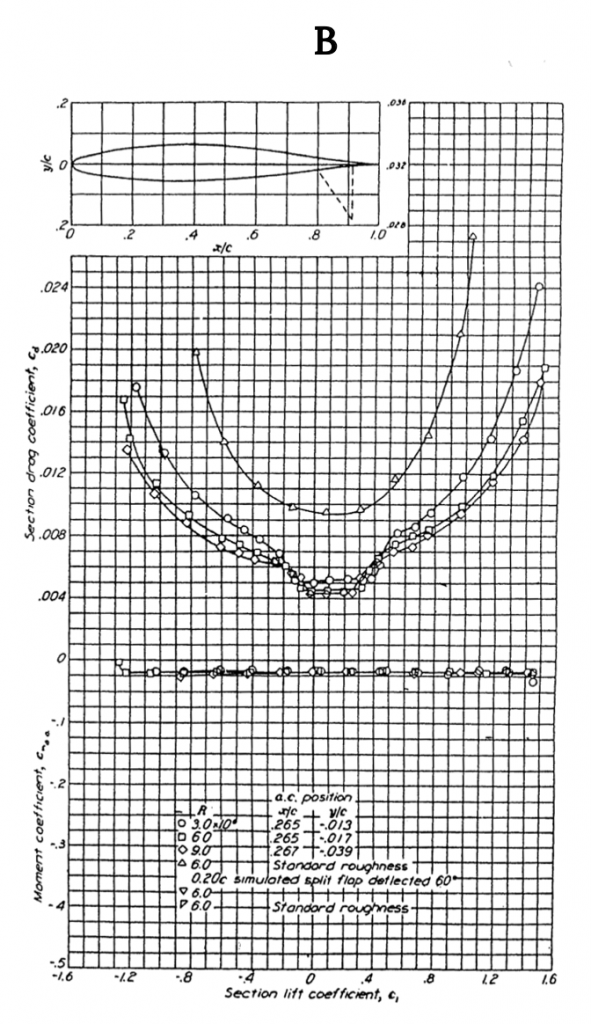
Figure A-1 shows data for the NACA 0012 airfoil, a classic symmetrical shape that is used for everything from airplane stabilizers and canards to helicopter rotors to submarine “sails”. Note that for the symmetrical shape the lift coefficient is zero at zero angle of attack. These graphs show test results for several different Reynolds numbers and for “standard roughness” on the surface. They also show what happens when a 20% chord flap is deflected 40 degrees. Note that the flap deflection shifts the lift curve far to the left giving a zero lift angle of attack of roughly minus 12 degrees while it increases the maximum lift coefficient (Re= 6 x 10⁶) from just under 1.6 to 2.4, a huge increase in lifting capability that can contribute to large decreases in takeoff and landing distances. Also note that the pitching moment coefficient at c/4 (in the left hand graph) is essentially zero from -12 degrees to+ 14 degrees angle of attack and then goes negative in stall at positive angle of attack. In the right hand graph the moment curve shown is for the moment at the “aerodynamic center” rather than the quarter chord but since it is also zero in this plot it confirms the theoretical prediction that for a symmetrical airfoil the center of pressure (where the moment is zero) coincides with the aerodynamic center.

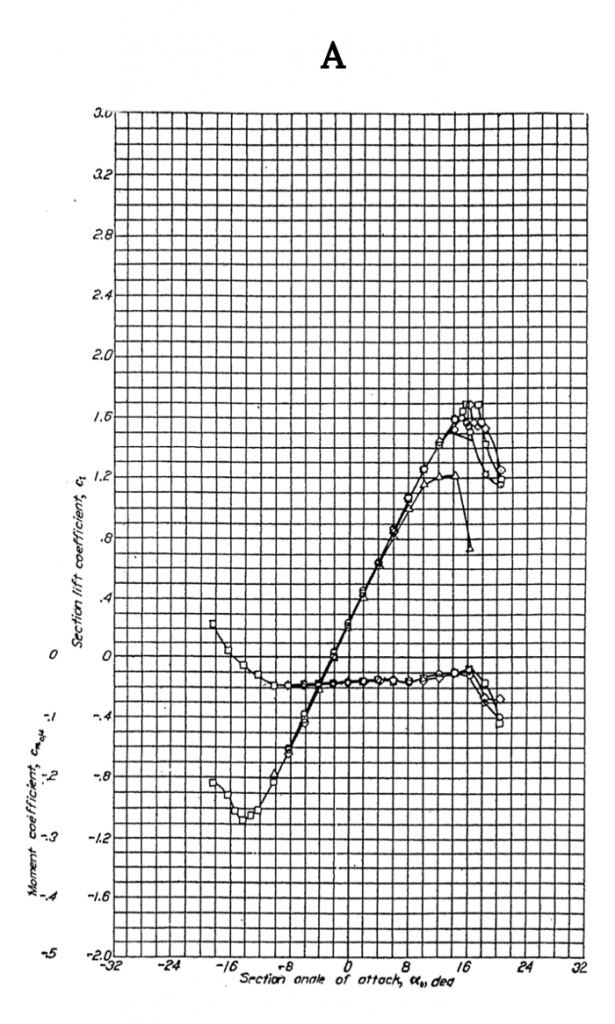
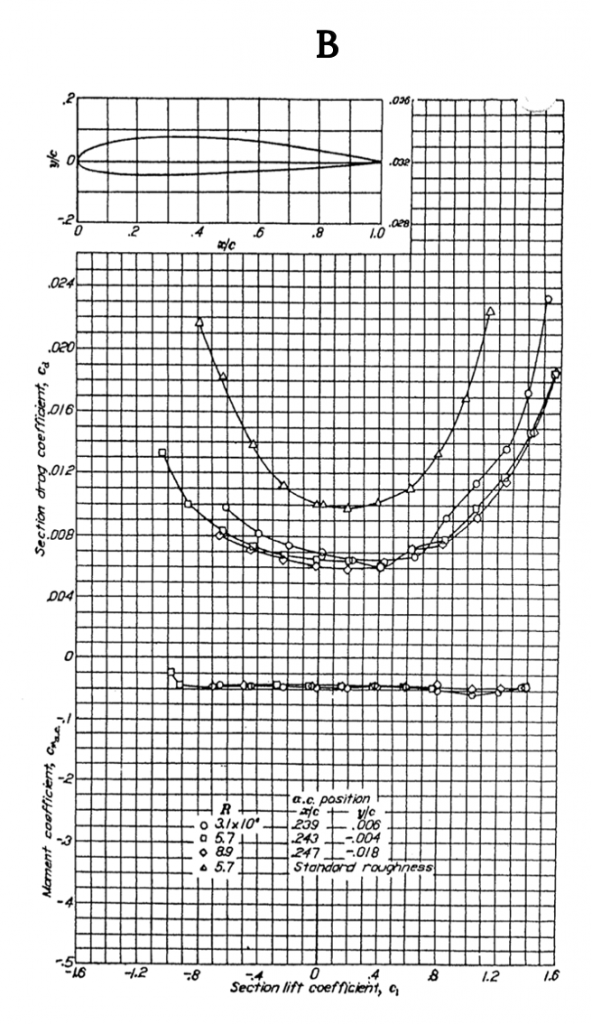
Figure A-2 gives similar data for the NACA 2412 airfoil, another 12% thick shape but one with camber. Note that the lift coefficient at zero angle of attack is no longer zero but is approximately 0.25 and the zero lift angle of attack is now minus two degrees, showing the effects of adding 2% camber to a 12% thick airfoil. Also note that the moment coefficient at the quarter chord is no longer zero but is still relatively constant between the onset of positive and negative stall. The moment coefficient is negative over most of the range of angle of attack indicating a nose down pitching moment and positive stability. Adding 2% camber has also resulted in a slight increase in CLmax from about 1.6 to 1.7 when compared to the 0012 airfoil.

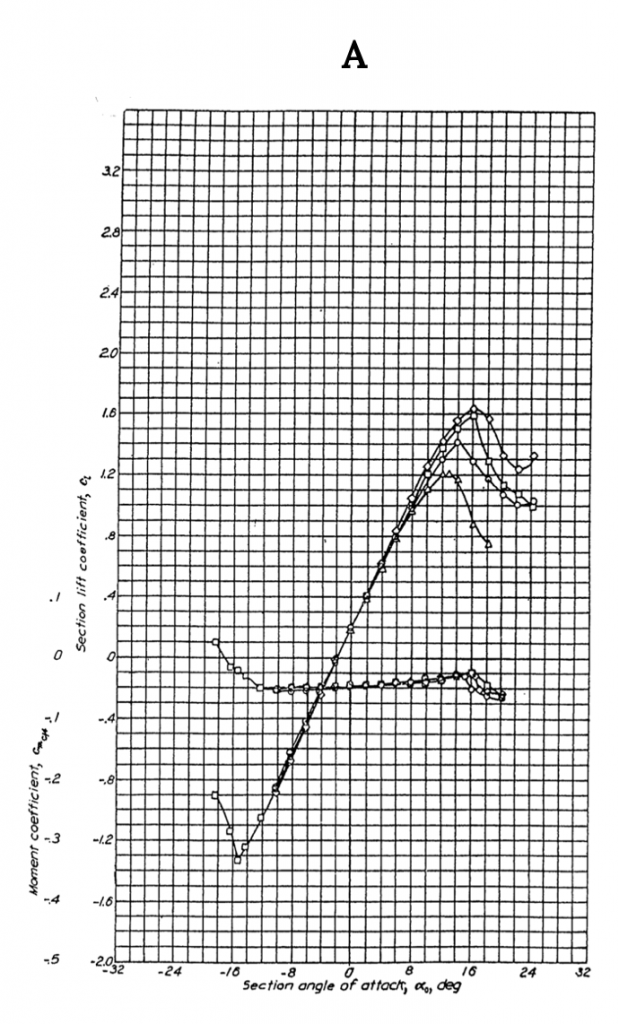
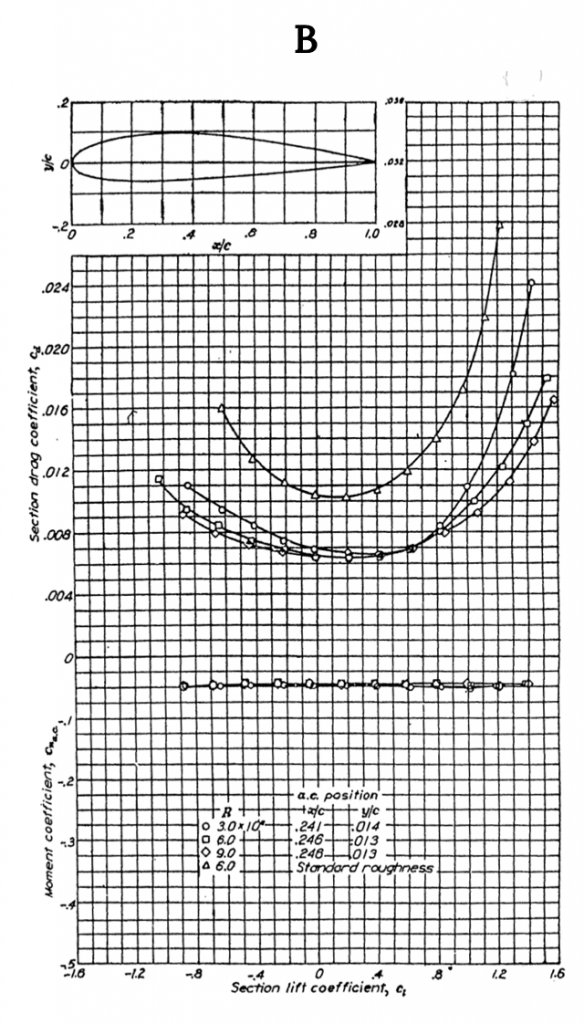
When Figure A-3 is compared with A-I and A-2 one can see the effect of added thickness as the percent thickness increases from 12 to 15 percent. This shows up primarily as a slight increase in drag coefficient and a slight reduction in CLmax compared to the 12% thick equally cambered airfoil in A-2.

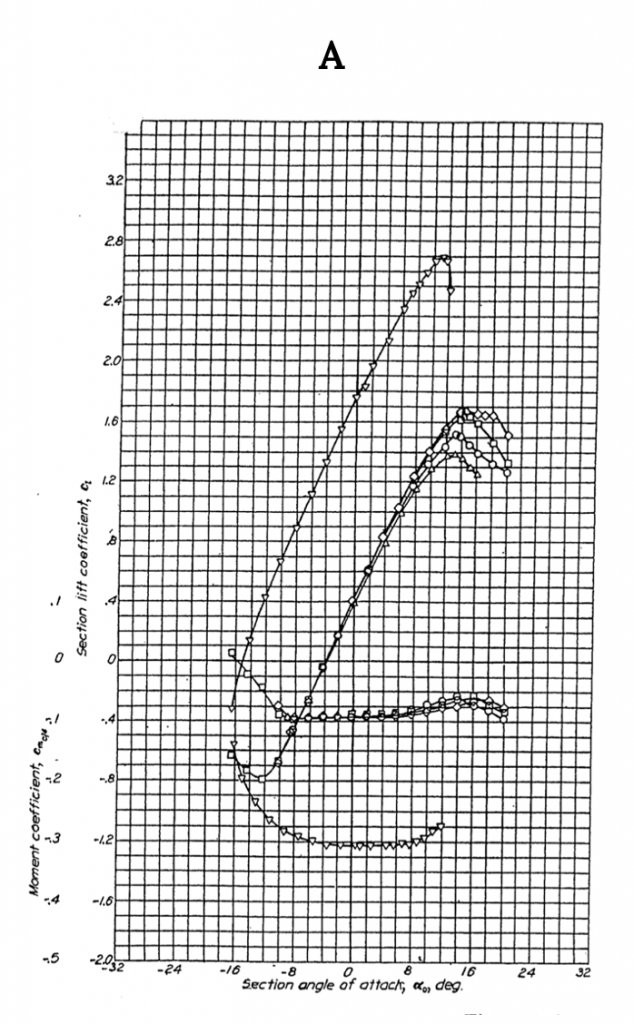
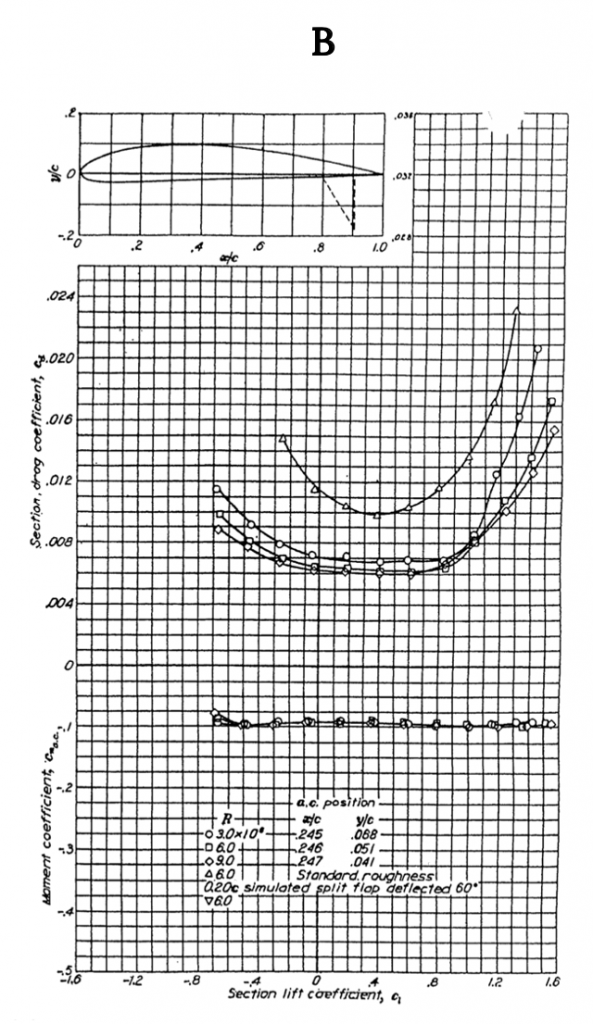
Figure A-4 returns to a 12% thick airfoil but one with 4% camber and a comparison with the previous figures will show how the increase in camber increases the lift at zero angle of attack, takes the zero lift angle of attack down to minus four degrees and increases the nose down pitching moment which is still constant between stall angles when measured at the quarter chord (aerodynamic center).

Figures A-5 and A-6 are for “6-series” airfoils, the so-called “laminar flow” airfoil series developed in the 1930s and used extensively in wing designs well into the late 1900s. Both figures show 12% thick airfoils. The distinguishing features of these graphs are the pronounced “drag buckets” in the right hand plots. Note that the first number to the right of the hyphen in the airfoil designation tells the location of the center of the drag bucket; i.e., the center of the bucket is at a CL of 0.1 for the 641-112 and at 0.4 for the 641-412. In this manner the airfoil designation in the “6-series” is a handy tool for the designer, allowing easy selection of an airfoil that has its “drag bucket” centered at perhaps the cruise lift coefficient for a transport aircraft or at the lift coefficient which is best for climb or maneuver in a fighter. Also note that the difference in camber produces the same kind of shifts in the lift curve as noted in the 4 digit series airfoils in the earlier plots.

These 6 plots are just the tip of the iceberg when exploring the many airfoil shapes which have been investigated by the NACA, NASA, and others over the years but the general features noted above will hold true for almost any variations in airfoil shape.
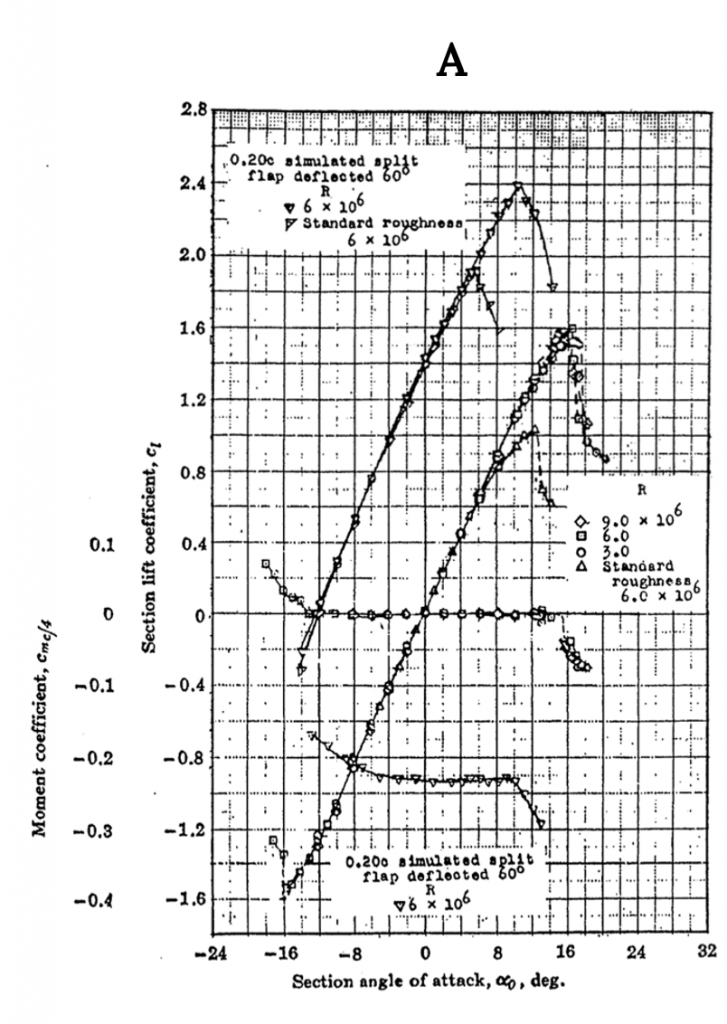
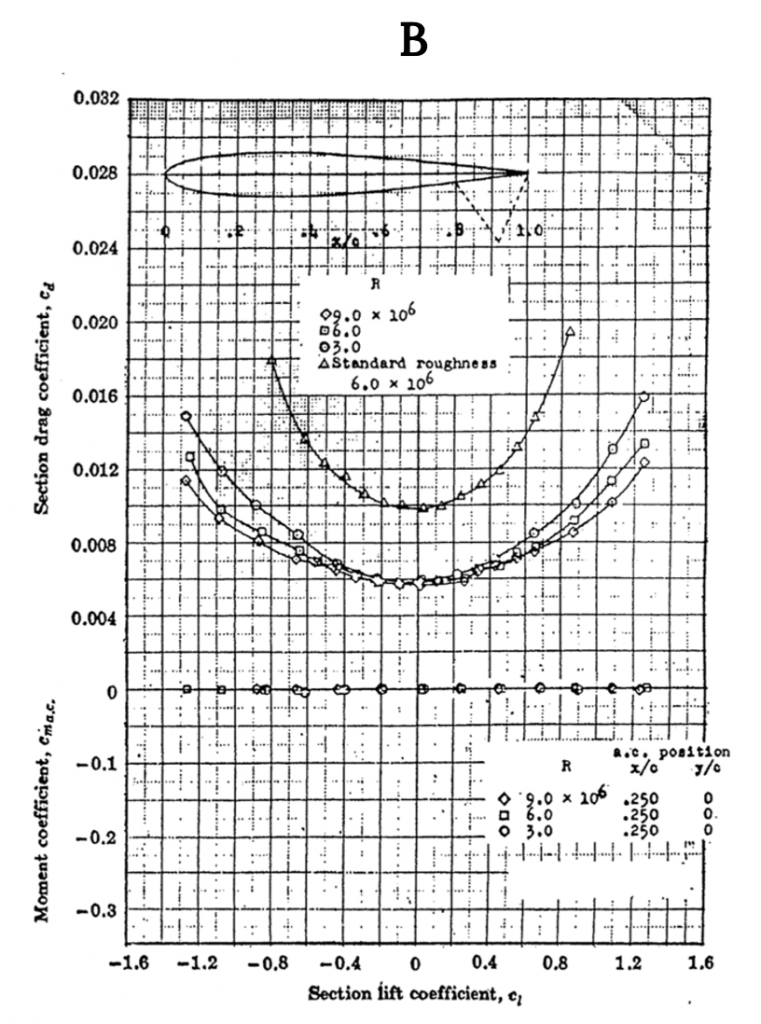
 

The airfoil is shown to have a linear section lift coefficient, c sub l, between section angle of attacks, alpha knot, between negative 16 and 16 degrees for Reynolds numbers of 9, 6, and 3 times 10 to the 6, with hooks on each end fo the linear portion as stall sets in. For a standard roughness at a Reynolds number of 6 times 10 to the 6, the linear portion is between negative 16 and positive 8 degrees before shifting down slightly and turning at 12 degrees. Two additional curves are shown when a 0.2 times c simulated split flap is added with a deflection fo 60 degrees, which shifts this final curve upward by 1.4 c sub l. The moment coefficient for each aforementioned line is shown to be roughly 0 in the linear portions, only deviating as stall sets in. The moment coefficients for the airfoil with flap defection follow the same shape, but are centered on negative 0.24, rather than 0. B) Section drag coefficient, c sub d, is shown as a function of section lift coefficient, c sub l. For Reynolds Numbers of 9, 6, and 3 times 10 to the 6, c sub d follows a parabolic shape, growing from a y-intercept of roughly 0.006 as c sub l moves away from 0. The same parabolic shape is present for the standard roughness line, but with the parabolic shape much steeper, and now centered off of a c sub d value of 0.010. The moment coefficient, c sub m a c, is 0 for all values shown. The aerodynamic center is at x over c of 0.25 and y over c of 0 for all cases.
Figure A-1 (A): NACA 0012 Airfoil Data


Section drag coefficient, c sub d, is shown as a function of section lift coefficient, c sub l. For Reynolds Numbers of 9, 6, and 3 times 10 to the 6, c sub d follows a parabolic shape, growing from a y-intercept of roughly 0.006 as c sub l moves away from 0. The same parabolic shape is present for the standard roughness line, but with the parabolic shape much steeper, and now centered off of a c sub d value of 0.010. The moment coefficient, c sub m a c, is 0 for all values shown. The aerodynamic center is at x over c of 0.25 and y over c of 0 for all cases.
Figure A-1 (B): NACA 0012 Airfoil Data
Lift curve slopes are shown for Reynolds numbers of 3.1, 5.7, and 8.9 times 10 to the 6. The curves are linear between angles of attack, alpha knot, of negative 14 and 14 degrees, with stall resulting in curves back towards 0 past these values and a y-intercept of 0.2. The lower end of the lines stop within the linear portion for all but the 5.7 times 10 ^6 case. A final case at 5.7 times 10^6 is shown with standard roughness, which follows the same linear path until alpha knot of 8, after which is begins to turn back down. Moment coefficient c sub m c over 4 is approximately negative 0.2 within the linear portion, growing more positive at the negative stall angles, and more negative at the positive stall angles.
Figure A-2 (A): NACA 2412 Airfoil Data
Section drag coefficient, c sub d, is shown as a function of section lift coefficient, c sub l. The curves follow the same parabolic shapes as before, centered now at c sub l of 0.2 and c sub d of 0.006. The standard roughness curve is shifed up to a c sub d of 0.010. The moment coefficients are all approximately negative 0.5 for all Reynolds numbers.
Figure A-2 (B): NACA 2412 Airfoil Data
Lift curve slopes are shown for Reynolds numbers of 3.0, 6.0, and 9.0 times 10 to the 6. The curves are linear between angles of attack, alpha knot, of negative 15 and 16 degrees, with stall resulting in curves back towards 0 past these values and a y-intercept of 0.2. The lower end of the lines stop within the linear portion for all but the 6.0 times 10 ^6 case. A final case at 6.0 times 10^6 is shown with standard roughness, which follows the same linear path until alpha knot of 12, after which is begins to turn back down. Moment coefficient c sub m c over 4 is approximately negative 0.2 within the linear portion, growing more positive at the negative stall angles, and more negative at the positive stall angles.
Figure A-3 (A): NACA 2415 Airfoil Data
Section drag coefficient, c sub d, is shown as a function of section lift coefficient, c sub l. The curves follow the same parabolic shapes as before, centered now at c sub l of 0.2 and c sub d of 0.0065. The standard roughness curve is shifed up to a c sub d of 0.010. The moment coefficients are all approximately negative 0.5 for all Reynolds numbers.
Figure A-3 (B): NACA 2415 Airfoil Data
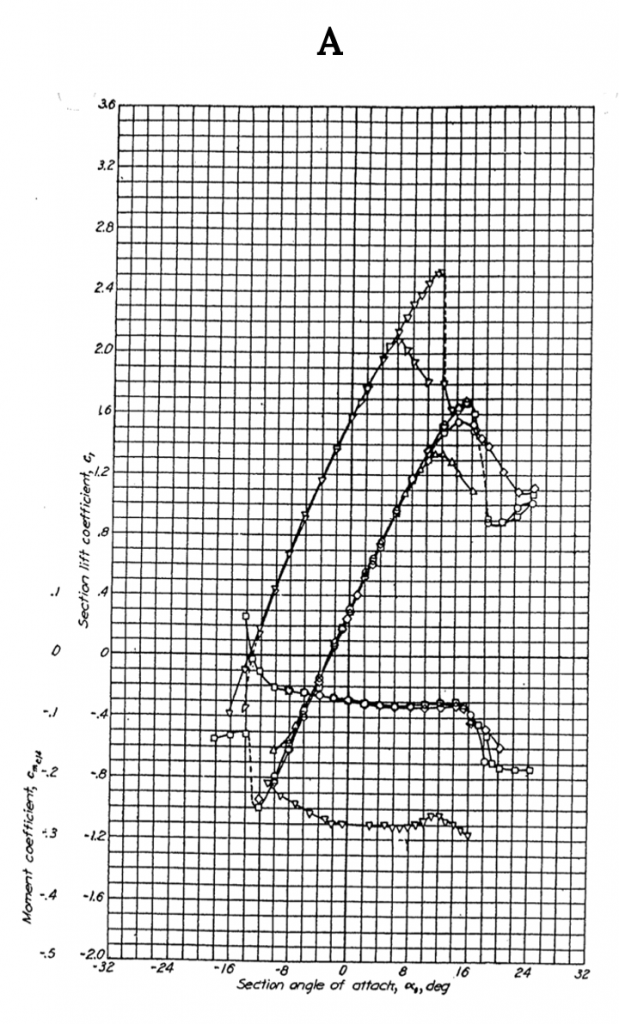
Lift curve slopes are shown for Reynolds numbers of 3.0, 6.0, and 9.0 times 10 to the 6. The curves are linear between angles of attack, alpha knot, of negative 12 and 12 degrees, with stall resulting in curves back towards 0 past these values and a y-intercept of 0.4. The lower end of the lines stop within the linear portion for all but the 6.0 times 10 ^6 case. An additional case at 6.0 times 10^6 is shown with standard roughness, which follows the same linear path until alpha knot of 10, after which it turns down slightly before the other cases. A final case is also shown with a 0.2 times c length flap deflected by 60 degrees, which results in the curve being shifted upward to a new y-intercept of approximately 1.8 c sub l, and the linear portion shifted to be between alpha knots of negative 16 and 10 degrees. The moment coefficients for the deflected follow a linearly decaying curve from negative 0.6 at alpha knot of negative 16, to level out near negative 1.2 by alpha knot of negative 6 degrees. The moment coefficients for the other curves are relatively constant near negative 0.4 within the linear portions of the lift curves, only deviating upwards after stal begins to set in.
Figure A-4 (A): NACA 4412 Airfoil Data
Section drag coefficient, c sub d, is shown as a function of section lift coefficient, c sub l. The curves follow the same parabolic shapes as before, centered now at c sub l of 0.4 and c sub d of 0.006 to 0.007 as the Reynolds number decreases. The standard roughness curve is shifed up to a c sub d of 0.010. The moment coefficients are all approximately negative 0.1 for all Reynolds numbers. The a c positions for reynolds numbers of 3, 6, and 9 times 10 to the 6 are shown to be x over c of 0.245, 0.246, and 0.247, respectively, while the y over c positions are 0.068, 0.051, and 0.041, respectively.
Figure A-4 (B): NACA 4412 Airfoil Data
Lift curve slopes are shown for Reynolds numbers of 3.0, 6.0, and 9.0 times 10 to the 6. The curves are linear between angles of attack, alpha knot, of negative 14 and 14 degrees, with stall resulting in curves back towards 0 past these values and a y-intercept of 0.1. The lower end of the lines stop within the linear portion for all but the 6.0 times 10 ^6 case. An additional case at 6.0 times 10^6 is shown with standard roughness, which follows the same linear path until alpha knot of 10, after which it turns down slightly before the other cases. A final two cases are also shown with a 0.2 times c length flap deflected by 60 degrees, which results in the curve being shifted upward to a new y-intercept of approximately 1.4 c sub l, and the linear portion shifted to be between alpha knots of negative 14 and 6 to 10 degrees, for when standard roughness is or is not applied, respecitvely. The moment coefficients for the standard airfoils slowly decay across the linear portions from 0.05 to negative 0.025, wiht the moments corresponding to the two cases with flap deflection following similar shapes, but now between moment coefficient values of negative 0.15 and negative 0.225.
Figure A-5 (A): NACA 64 (sub 1)-112 Airfoil Data
Section drag coefficient, c sub d, is shown as a function of section lift coefficient, c sub l. The curves follow a roughly parabolic shapes, but now with an additional trough between the c sub l values of negative 0.1 and 0.3, centered around c sub l of 0.1 and c sub d of 0.004 to 0.005 as the Reynolds number decreases. The standard roughness curve is shifed up to a c sub d of 0.095, and loses the trough present in the earlier cases. The moment coefficients are all approximately negative 0.025 for all Reynolds numbers. The a c positions for reynolds numbers of 3, 6, and 9 times 10 to the 6 are shown to be x over c of 0.265, 0.265, and 0.267, respectively, while the y over c positions are negative 0.013, negative 0.017, and negative 0.039, respectively.
Figure A-5 (B): NACA 64 (sub 1)-112 Airfoil Data
Lift curve slopes are shown for Reynolds numbers of 3.0, 6.0, and 9.0 times 10 to the 6. The curves are linear between angles of attack, alpha knot, of negative 14 and 14 degrees, with stall resulting in curves back towards 0 past these values and a y-intercept of 0.25. The lower end of the lines stop within the linear portion for all but the 6.0 times 10 ^6 case. An additional case at 6.0 times 10^6 is shown with standard roughness, which follows the same linear path until alpha knot of 10, after which it turns down slightly before the other cases. A final two cases are also shown with a 0.2 times c length flap deflected by 60 degrees, which results in the curve being shifted upward to a new y-intercept of approximately 1.6 c sub l, and the linear portion shifted to be between alpha knots of negative 16 and 6 to 12 degrees, for when standard roughness is or is not applied, respecitvely. The moment coefficients for the standard airfoils slowly decay exponentially outside of the linear alpha knot values, with it decaying from negative 0.05 to negative 0.075 within it. The moment coefficients for the airfoils with flap deflections follow a more parabolic shape, but remain relatively close to negative 0.275 within the central alpha knot values.
Figure A-6 (A): NACA 64 (sub 1)-412 Airfoil Data
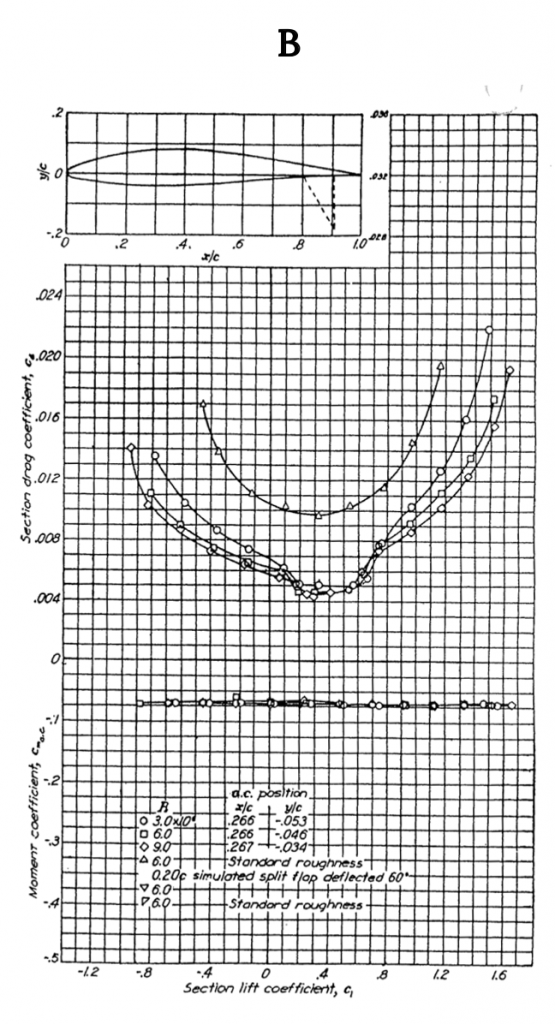
Section drag coefficient, c sub d, is shown as a function of section lift coefficient, c sub l. The curves follow a roughly parabolic shapes, but now with an additional trough between the c sub l values of 0.2 and 0.6, centered around c sub l of 0.4 and c sub d of 0.0055. The standard roughness curve is shifed up to a c sub d of 0.010, and loses the trough present in the earlier cases. The moment coefficients are all approximately negative 0.075 for all Reynolds numbers. The a c positions for reynolds numbers of 3, 6, and 9 times 10 to the 6 are shown to be x over c of 0.266, 0.266, and 0.267, respectively, while the y over c positions are negative 0.053, negative 0.046, and negative 0.034, respectively.
Figure A-6 (B): NACA 64 (sub 1)-412 Airfoil Data

References

Figure A1.1: Kindred Grey (2021). “NACA 0012 Airfoil Data.” CC BY 4.0. Adapted from NACA. Public domain. Available from https://archive.org/details/0012_20210805

Figure A1.2: Kindred Grey (2021). “NACA 2412 Airfoil Data.” CC BY 4.0. Adapted from NACA. Public domain. Available from https://archive.org/details/2412_20210805

Figure A1.3: Kindred Grey (2021). “NACA 2415 Airfoil Data.” CC BY 4.0. Adapted from NACA. Public domain. Available from https://archive.org/details/2415_20210805

Figure A1.4: Kindred Grey (2021). “NACA 4412 Airfoil Data.” CC BY 4.0. Adapted from NACA. Public domain. Available from https://archive.org/details/4412_20210805

Figure A1.5: Kindred Grey (2021). “NACA 64_1-112 Airfoil Data.” CC BY 4.0. Adapted from NACA. Public domain. Available from https://archive.org/details/64-112

Figure A1.6: Kindred Grey (2021). “NACA 64_1-412 Airfoil Data.” CC BY 4.0. Adapted from NACA. Public domain. Available from https://archive.org/details/64-412

License

Icon for the Creative Commons Attribution 4.0 International License

Aerodynamics and Aircraft Performance, 3rd edition Copyright © 2004, 2021 by James F. Marchman III is licensed under a Creative Commons Attribution 4.0 International License, except where otherwise noted.

Share This Book