Study Guide: Study Designs

A two-by-two table can be used to quantify exposure and disease. Row headings: E+ indicates the number of people who are exposed, E- indicates the number of people who are unexposed. Column headings: D+ indicate the number of people with disease and D- the number of people without disease. E+ with D+ is A in top left cell of the table; for example, where A is a number that is both exposed and with disease. E- with D+ is C in bottom left cell. E+ with D- is B in top right cell. E- with D- is notated as D in bottom right cell. These numbers as represented by A, B, C, and D. Incidence is the risk of disease and is calculated by dividing the number of cases by the number of people at risk at a point in time multiplied by 100, 1,000, or 100,000. The number of people at risk could be the average population or person-time (among other options). Incidence can be used to calculate: 1a. Relative Risk (Risk Ratio/RR), which is equal to [A/(A+B)]/[C(C+D)], and 1b. Relative Risk Reduction (RRR), which is equal to 1 minus Relative Risk.

1c. Risk Difference (RD) is equal to Attributable Risk (AR). RD is equal to AR is equal to A/(A+B) minus C/(C+D). 1d. Attributable Risk % (AR%) is equal to [A/(A+B) - C/(C+D)]/[(A/(A+B)], multiplied by 100. 1e. Absolute Risk Reduction (ARR) is equal to C/C+D minus A(A+B), or (RR-1)/RR. 1f. Number needed to treat (NNT) is equal to 1/ARR. 1g. Number needed to harm (NNH) is equal to 1/AR. 2. An alternative to the Incidence rate is the Attack rate, which equals the number that ate the food and got sick divided by the total that ate the food, multiplied by 100. 3. Left: Graph with declining step on x- and y-axis. Kaplan-Meier is one way to calculate cumulative incidence and cumulative survival.

Prevalence is the burden of disease. Prevalence is the number with disease divided by the total population (the entire population of interest). Can be shown as a percentage. Prevalence can be used to calculate: 3a. Prevalence Rate Ratio (PRR), which is equal to [A/(A+B)]/[C/(C+D)]. 3b. Population Attributable Risk (PAR, which is equal to AR/[Total exposed/Total population] or more simply, the absolute value of AR% multiplied by prevalence. 3c. Population Attributable Risk %, which is equal to AR/[(A+B)*((A+C)/N)] multiplied by 100.

Measures of Association. Incidence can be used to calculate relative risk (risk ratio). From the two-by-two table as found in Chapter 2 Part 1 Summary, the incidence of disease in the exposed, represented as A/(A+B) from the table, is divided by the incidence of disease in the unexposed, represented as C/(C+D) from the table. This means the relative risk is the risk of disease in the exposed relative to the risk of disease in the unexposed. We use the relative risk as our first choice in a cohort study.

Cohort with both O's highlighted. The O and O are alike so they are relatives! If you imagine the O's in COHORT as eyes. Bottom left: Prospective cohort. Look forward to see what happens. Bottom right: Retrospective cohort: Look back to see what happens. Bottom: Our goal is to start with knowledge of exposure and find the occurrence of disease.

The odds ratio is also a choice to calculate in a cohort study. The reason and method is different than how we use it in a case control study. In a cohort study, we use the odds ratio to find the odds (or chance or probability) of an exposed person developing the disease compared to the odds of a non-exposed person developing disease. In a cohort, randomized control trial (RCT), cross sectional, etc: Two-by-two table as found in Chapter 2 Part 1 Summary. A/(A+B) equals chance of disease in the exposed. B/(A+B) equals chance of no disease in the exposed. The ratio of the chance of disease in the exposed to the chance of no disease in the exposed causes (A+B) to cancel out, leaving A/B, which equals the odds of disease in the exposed.

Two-by-two table as found in Chapter 2 Part 1 Summary. C/(C+D) equals chance of disease in the unexposed. D/(C+D) equals chance of no disease in the unexposed. The ratio of the chance of disease in the unexposed to the chance of no disease in the unexposed causes (C+D) to cancel out, leaving C/D, which equals the odds of disease in the unexposed. (A/B)/(C/D) equals the ratio of the odds of disease in the exposed to the odds of disease in the unexposed. OR equals (A/B)/(C/D), which equals (A/B)*(D/C), which equals AD/BC, also equal to the cross product ratio. As you can see, this equation is a ratio of odds. In particular this is called the odds ratio of disease and is used instead of the relative risk when the outcome (disease) is ~10% of the population or less (rare). If we are using a case-control study, we calculate the OR differently.

Case-Control where the A in 'case' and the O in 'control' are highlighted. A is retrospective. The first vowels are at odds with each other (odds ratio). A comes before O. Cases come before controls. Pick cases (diseased) people then pick controls (non-diseased) people. Our goal is to start with knowledge of disease and find the most likely exposure that caused disease. When we calculate the odds ratio in a case-control study, we are calculating the odds ratio of exposure. What is the chance that a particular exposure is associated with the disease?

A/(A+C) equals chance of exposure in the diseased. C/(A+C) equals chance of no exposure in the diseased. The ratio of the chance of exposure in the diseased to the chance of no exposure in the diseased causes (A+C) to cancel out, leaving A/C, which equals the odds of exposure in the diseased. Similarly, B/(B+D) equals chance of exposure in the non-diseased. D/(B+D) equals chance of no exposure in the non-diseased. The ratio of the chance of exposure in the non-diseased to the chance of no exposure in the non-diseased causes (B+D) to cancel out, leaving B/D, which equals the odds of exposure in the non diseased. (A/C)/(B/D) is equal to the ratio of the odds of exposure in the diseased to the odds of exposure in the non-diseased. OR equals (A/C)/(B/D), which equals (A/C)*(D/B), which equals AD/BC, also equal to the cross product ratio. The OR is the only measure we can calculate with the case-control because of how we identify the study population.

License

Icon for the Creative Commons Attribution-NonCommercial-ShareAlike 4.0 International License

Epidemiology Copyright © 2023 by Charlotte Baker is licensed under a Creative Commons Attribution-NonCommercial-ShareAlike 4.0 International License, except where otherwise noted.
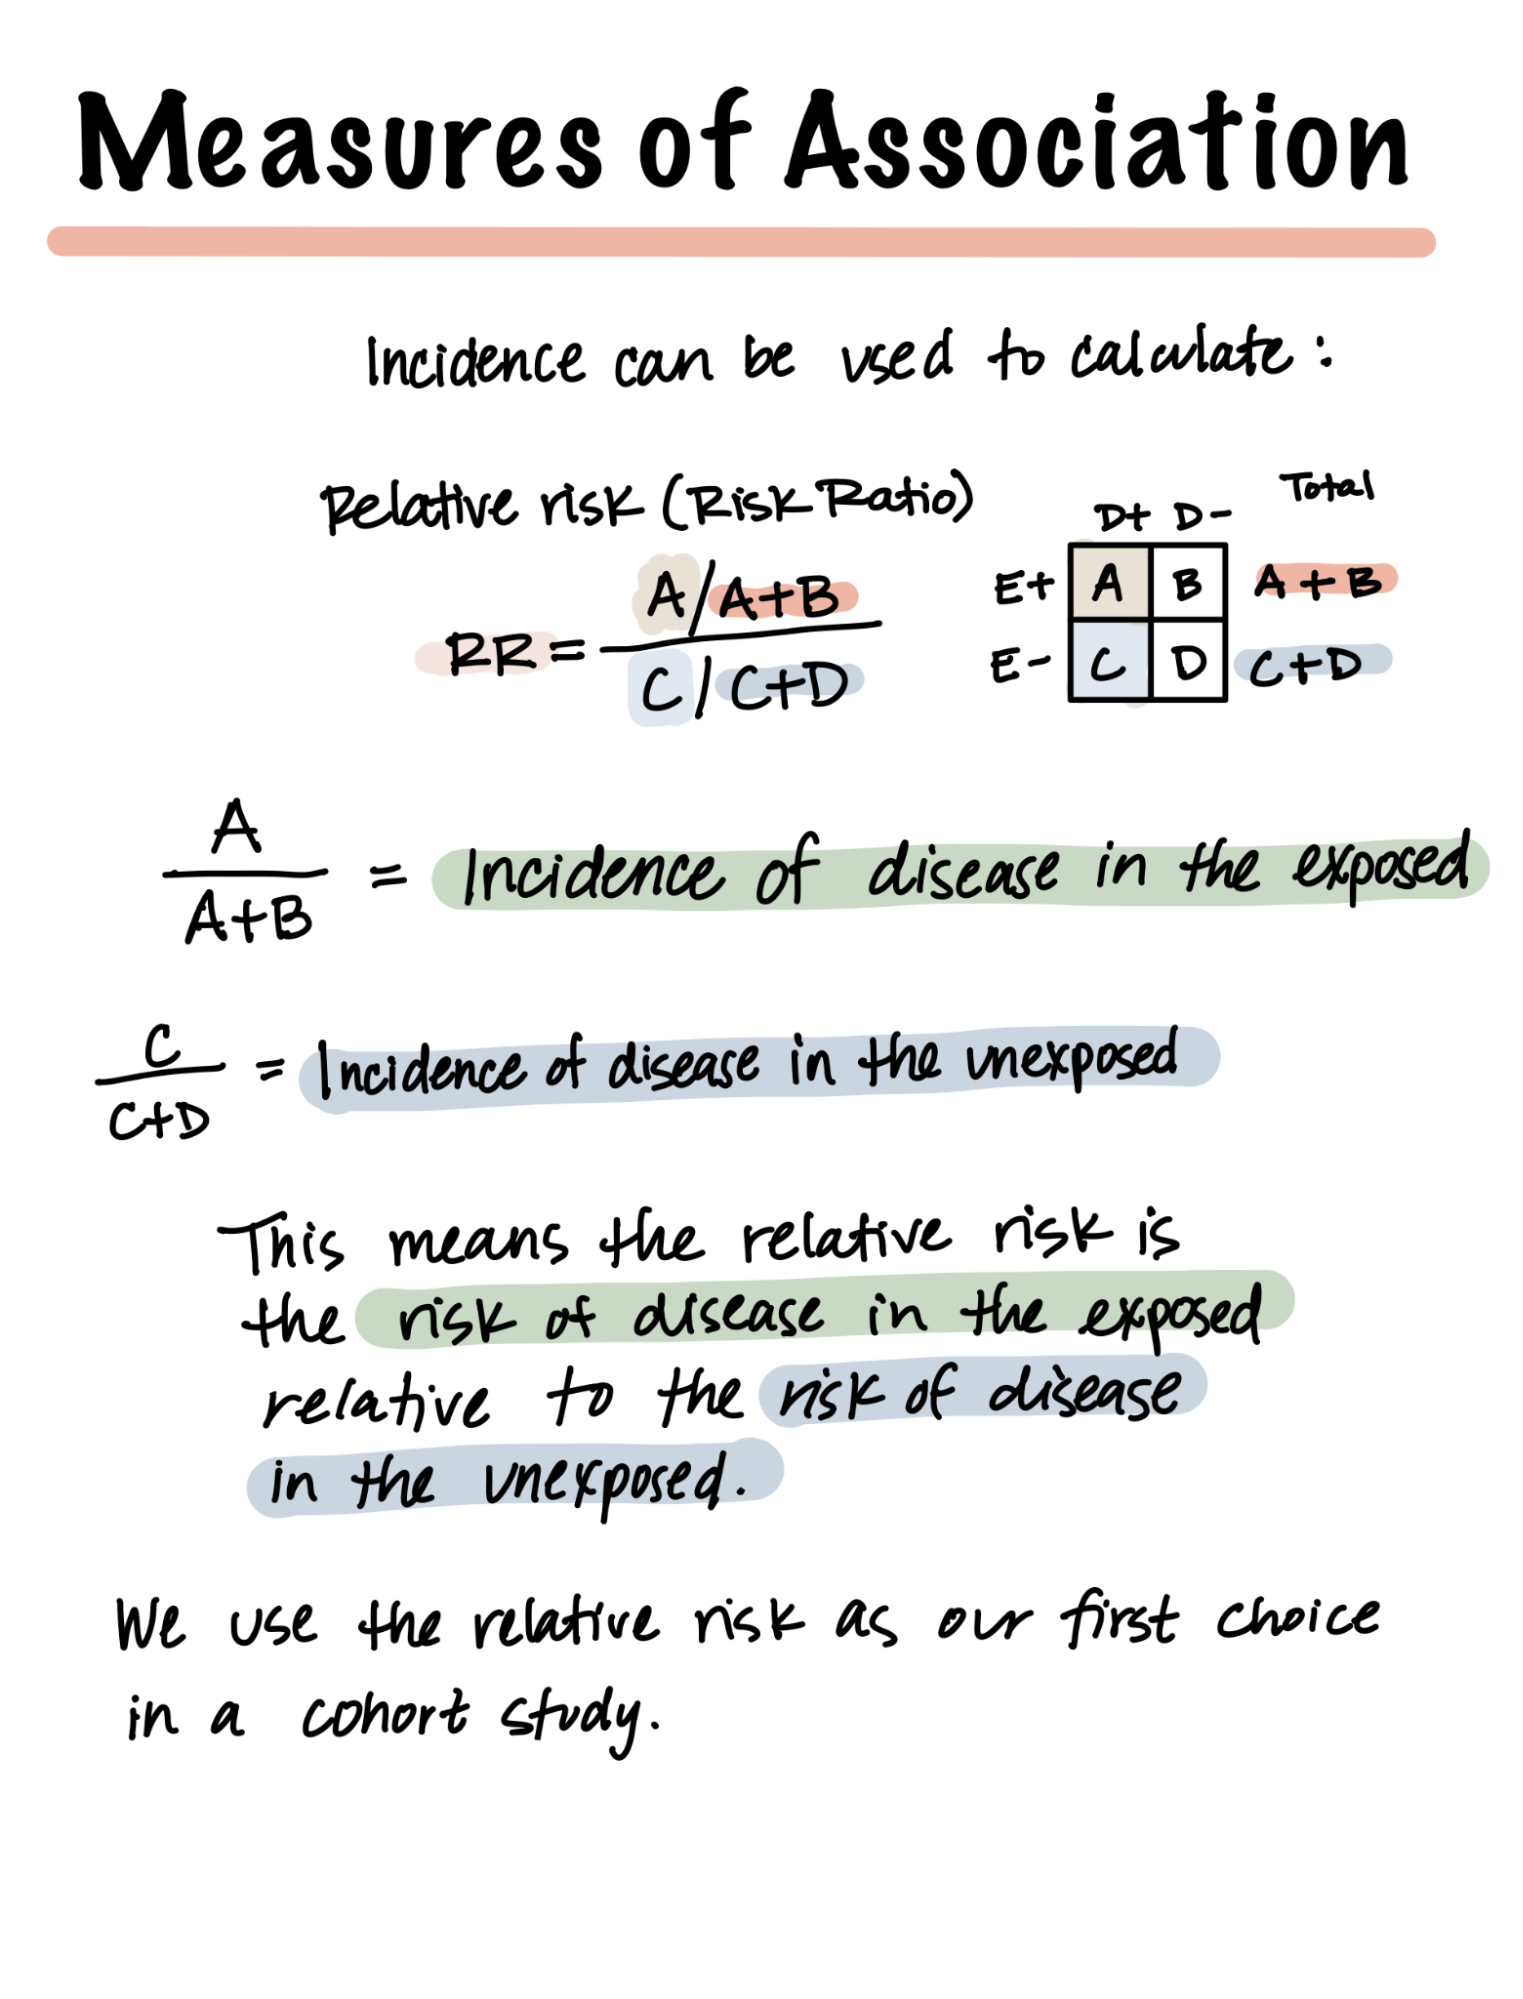
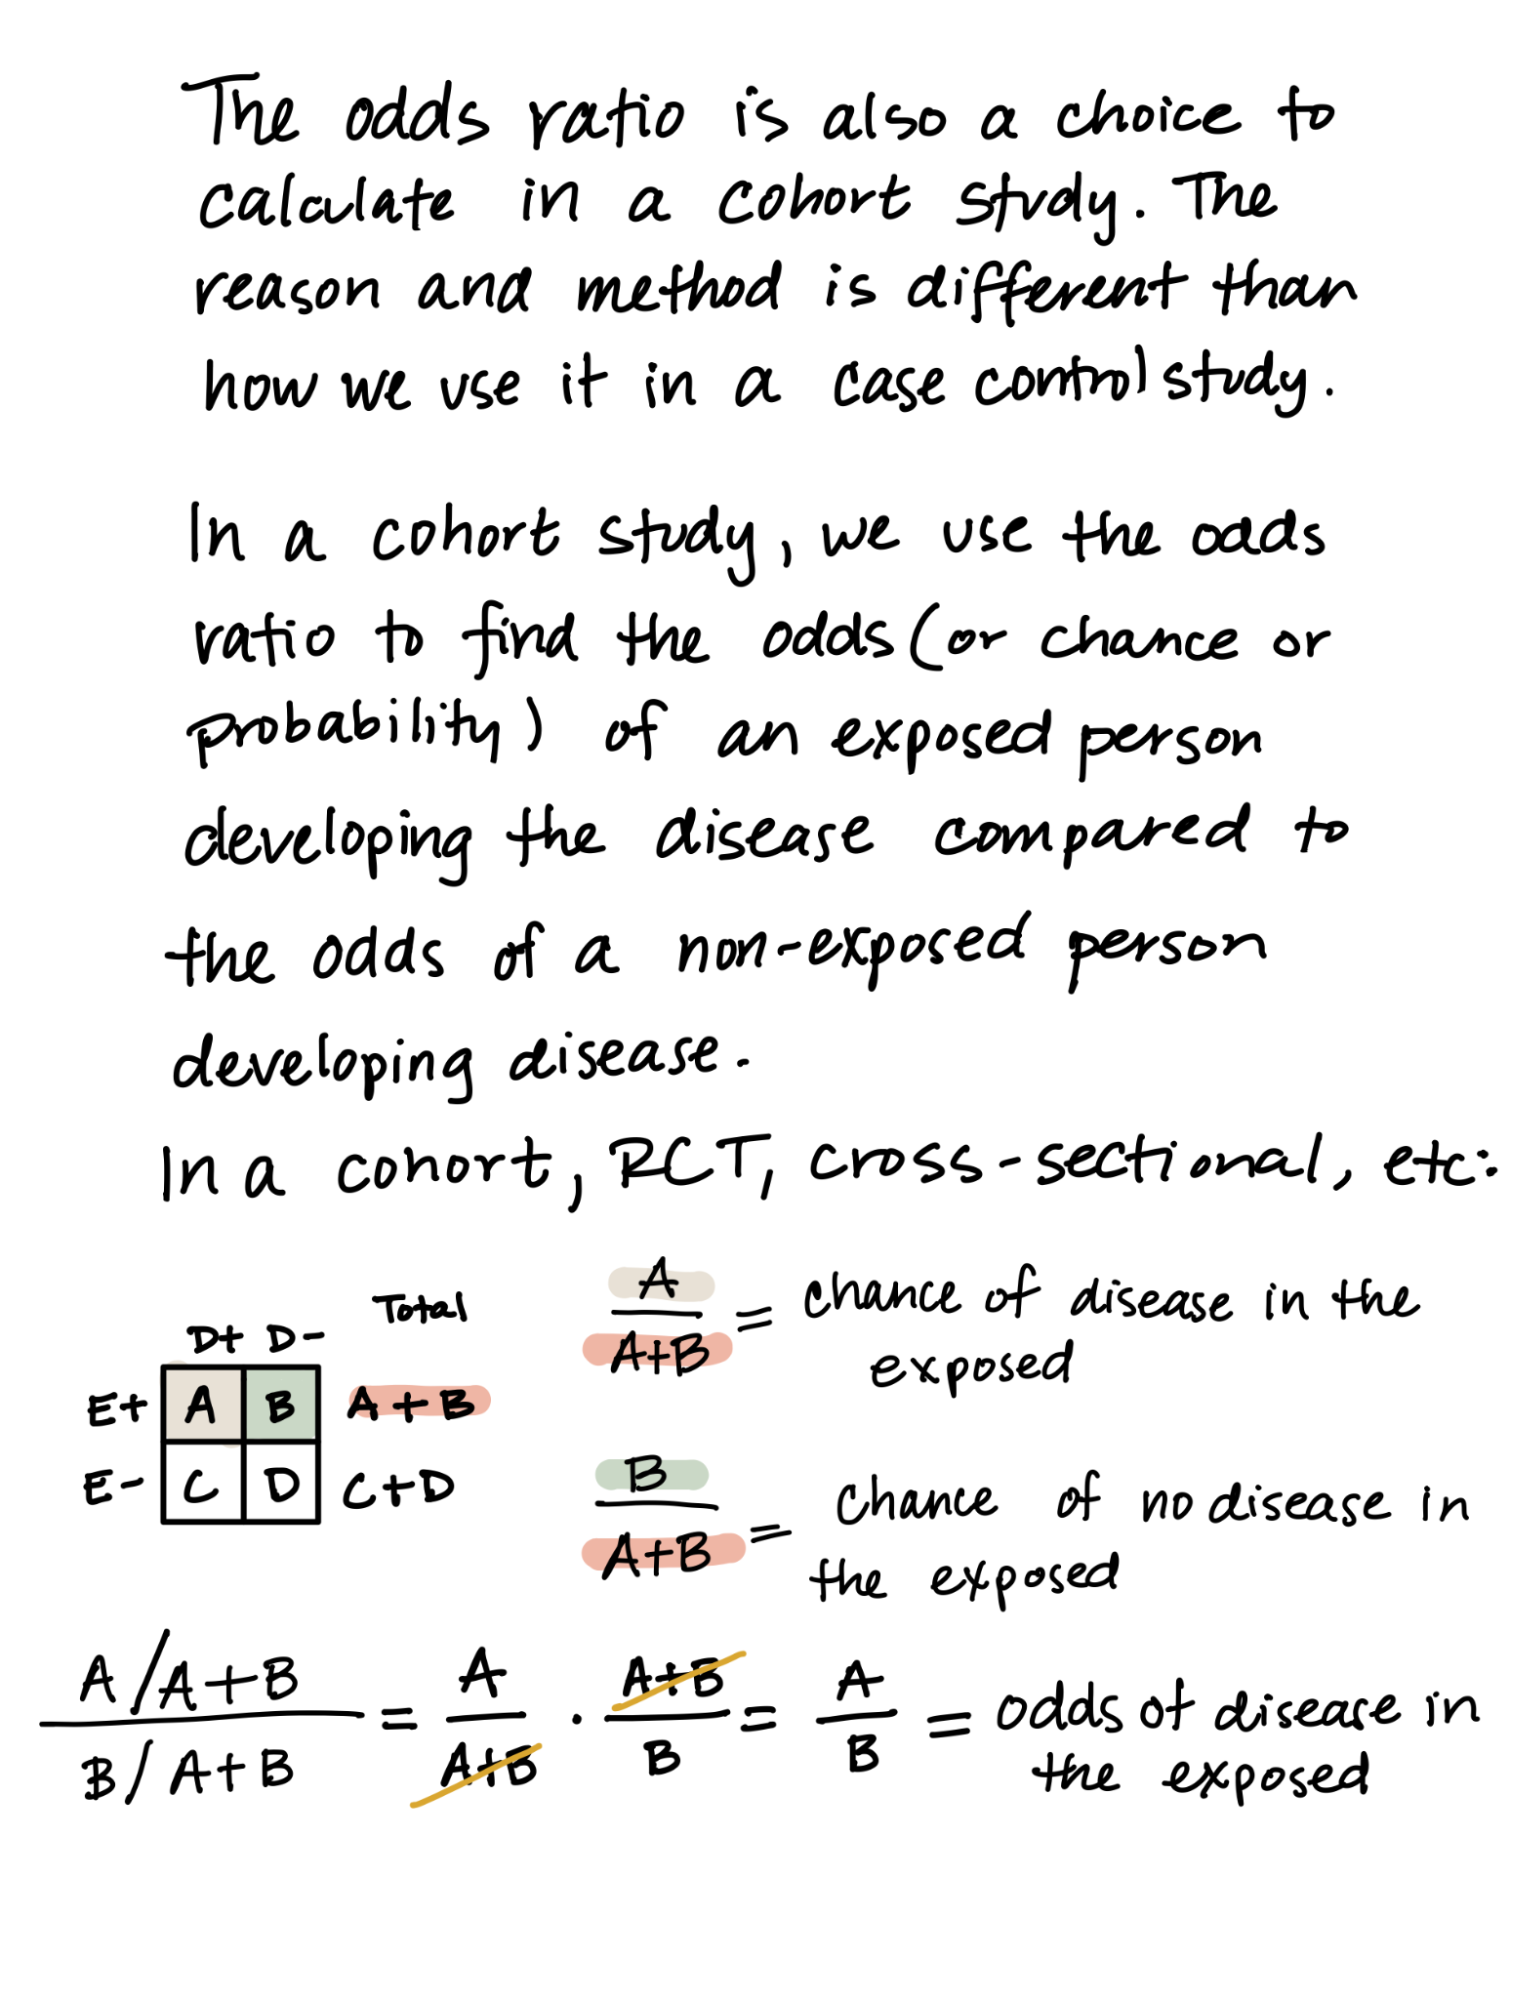
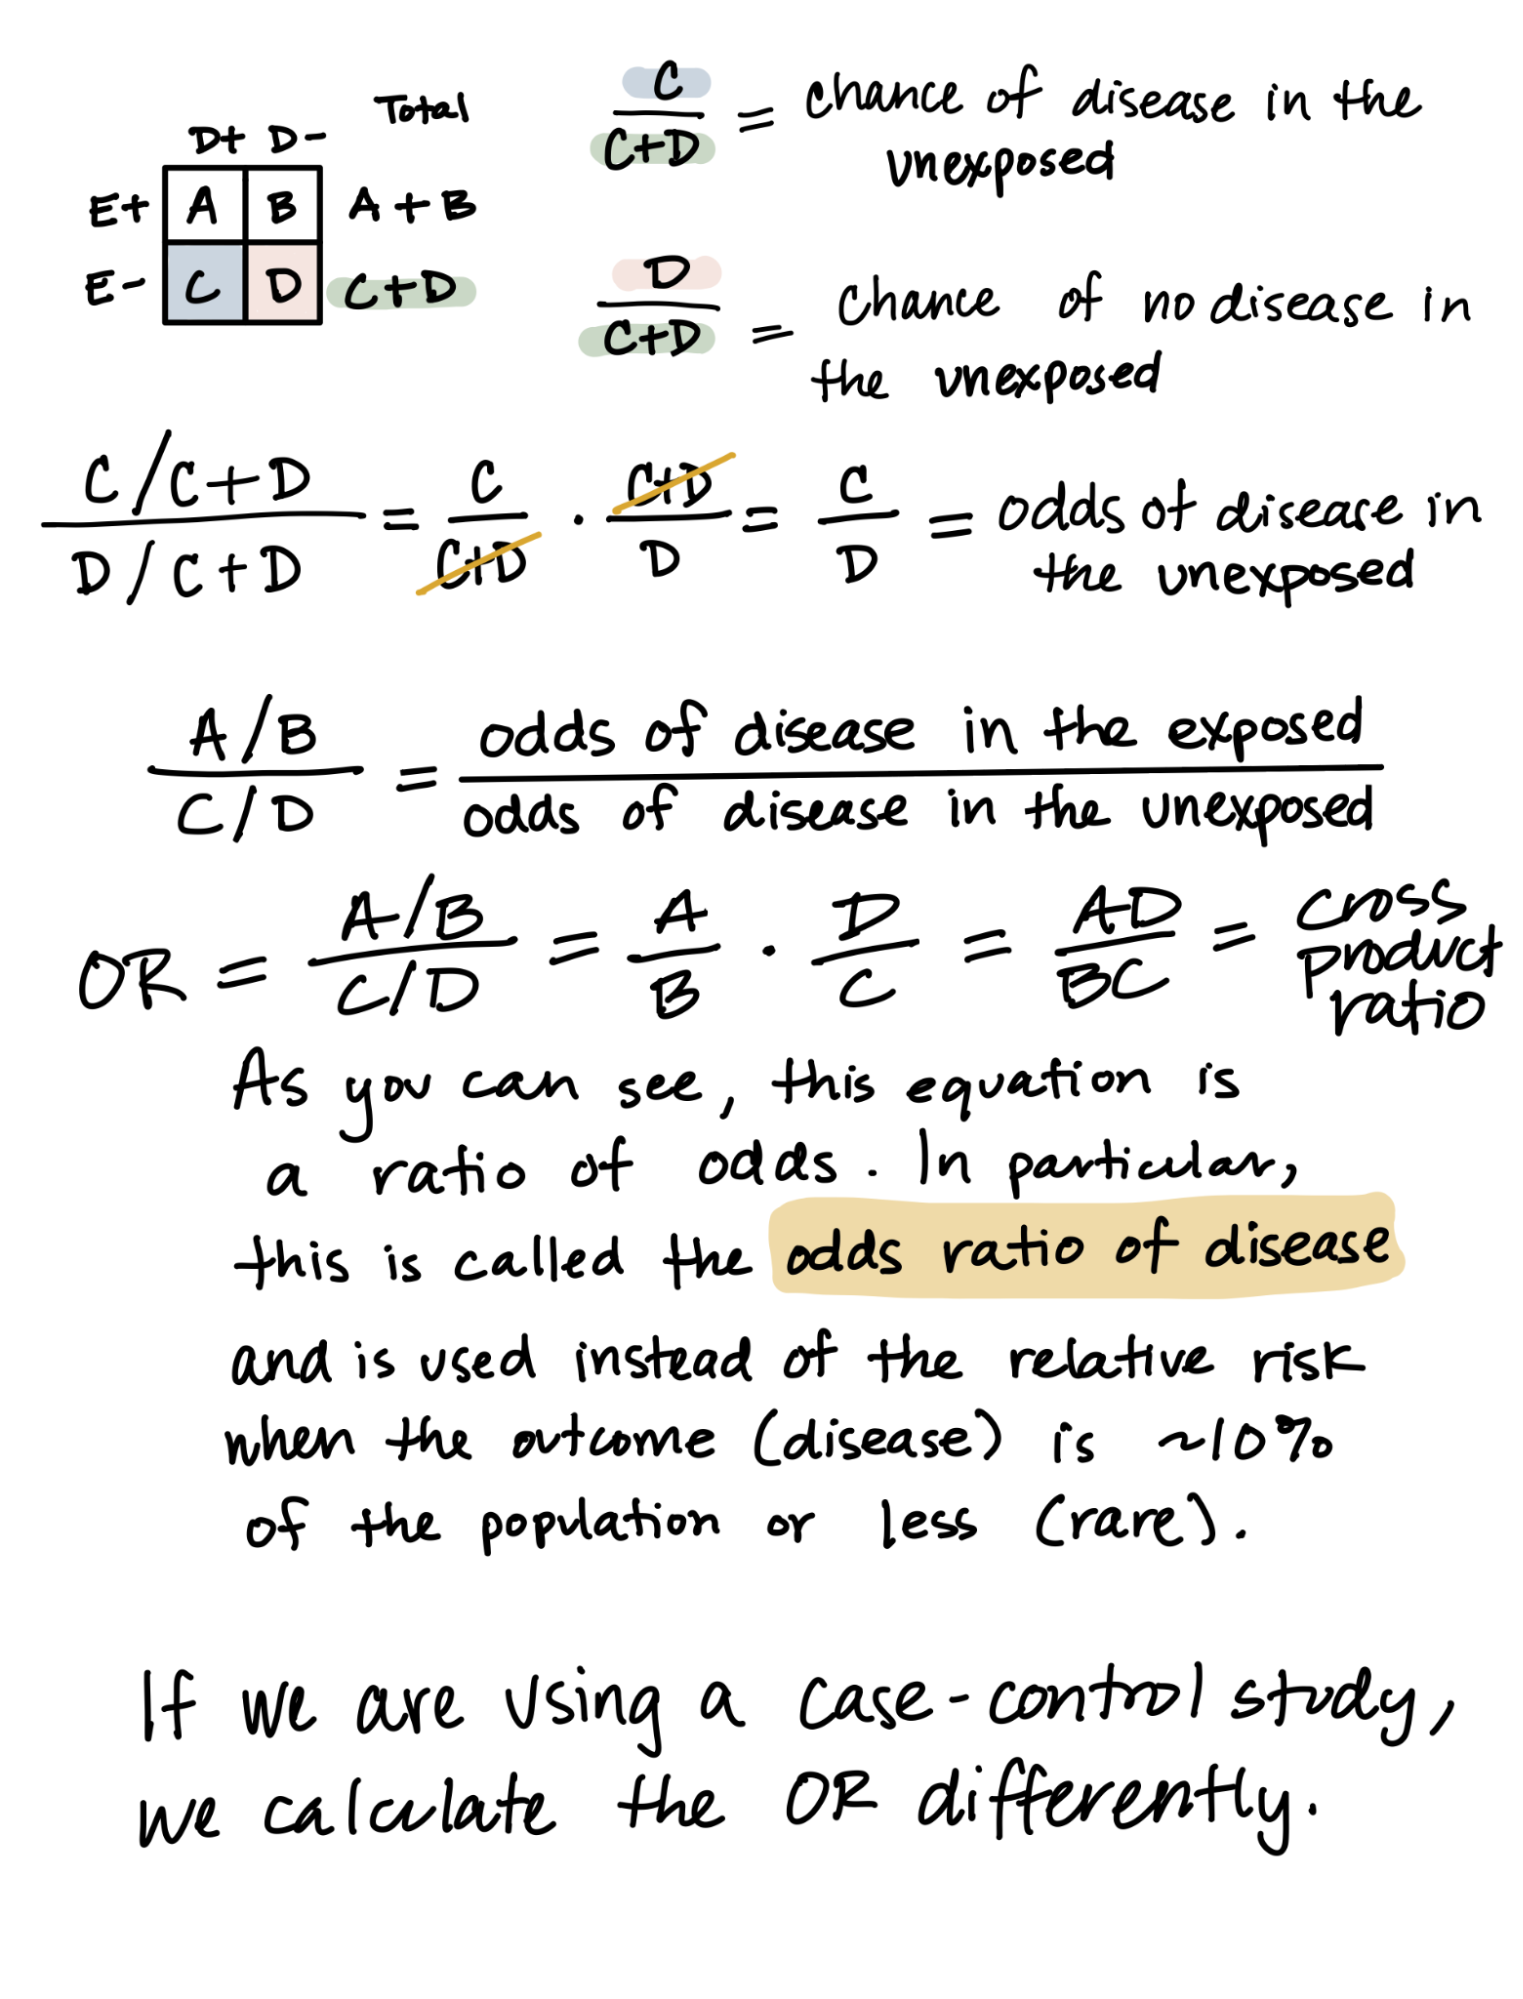
Share This Book