Primary Navigation
Want to create or adapt books like this? Learn more about how Pressbooks supports open publishing practices.
Book Contents Navigation
Introduction
About the Author
Acknowledgments
Instructor Resources
1. Epidemiology in Sum
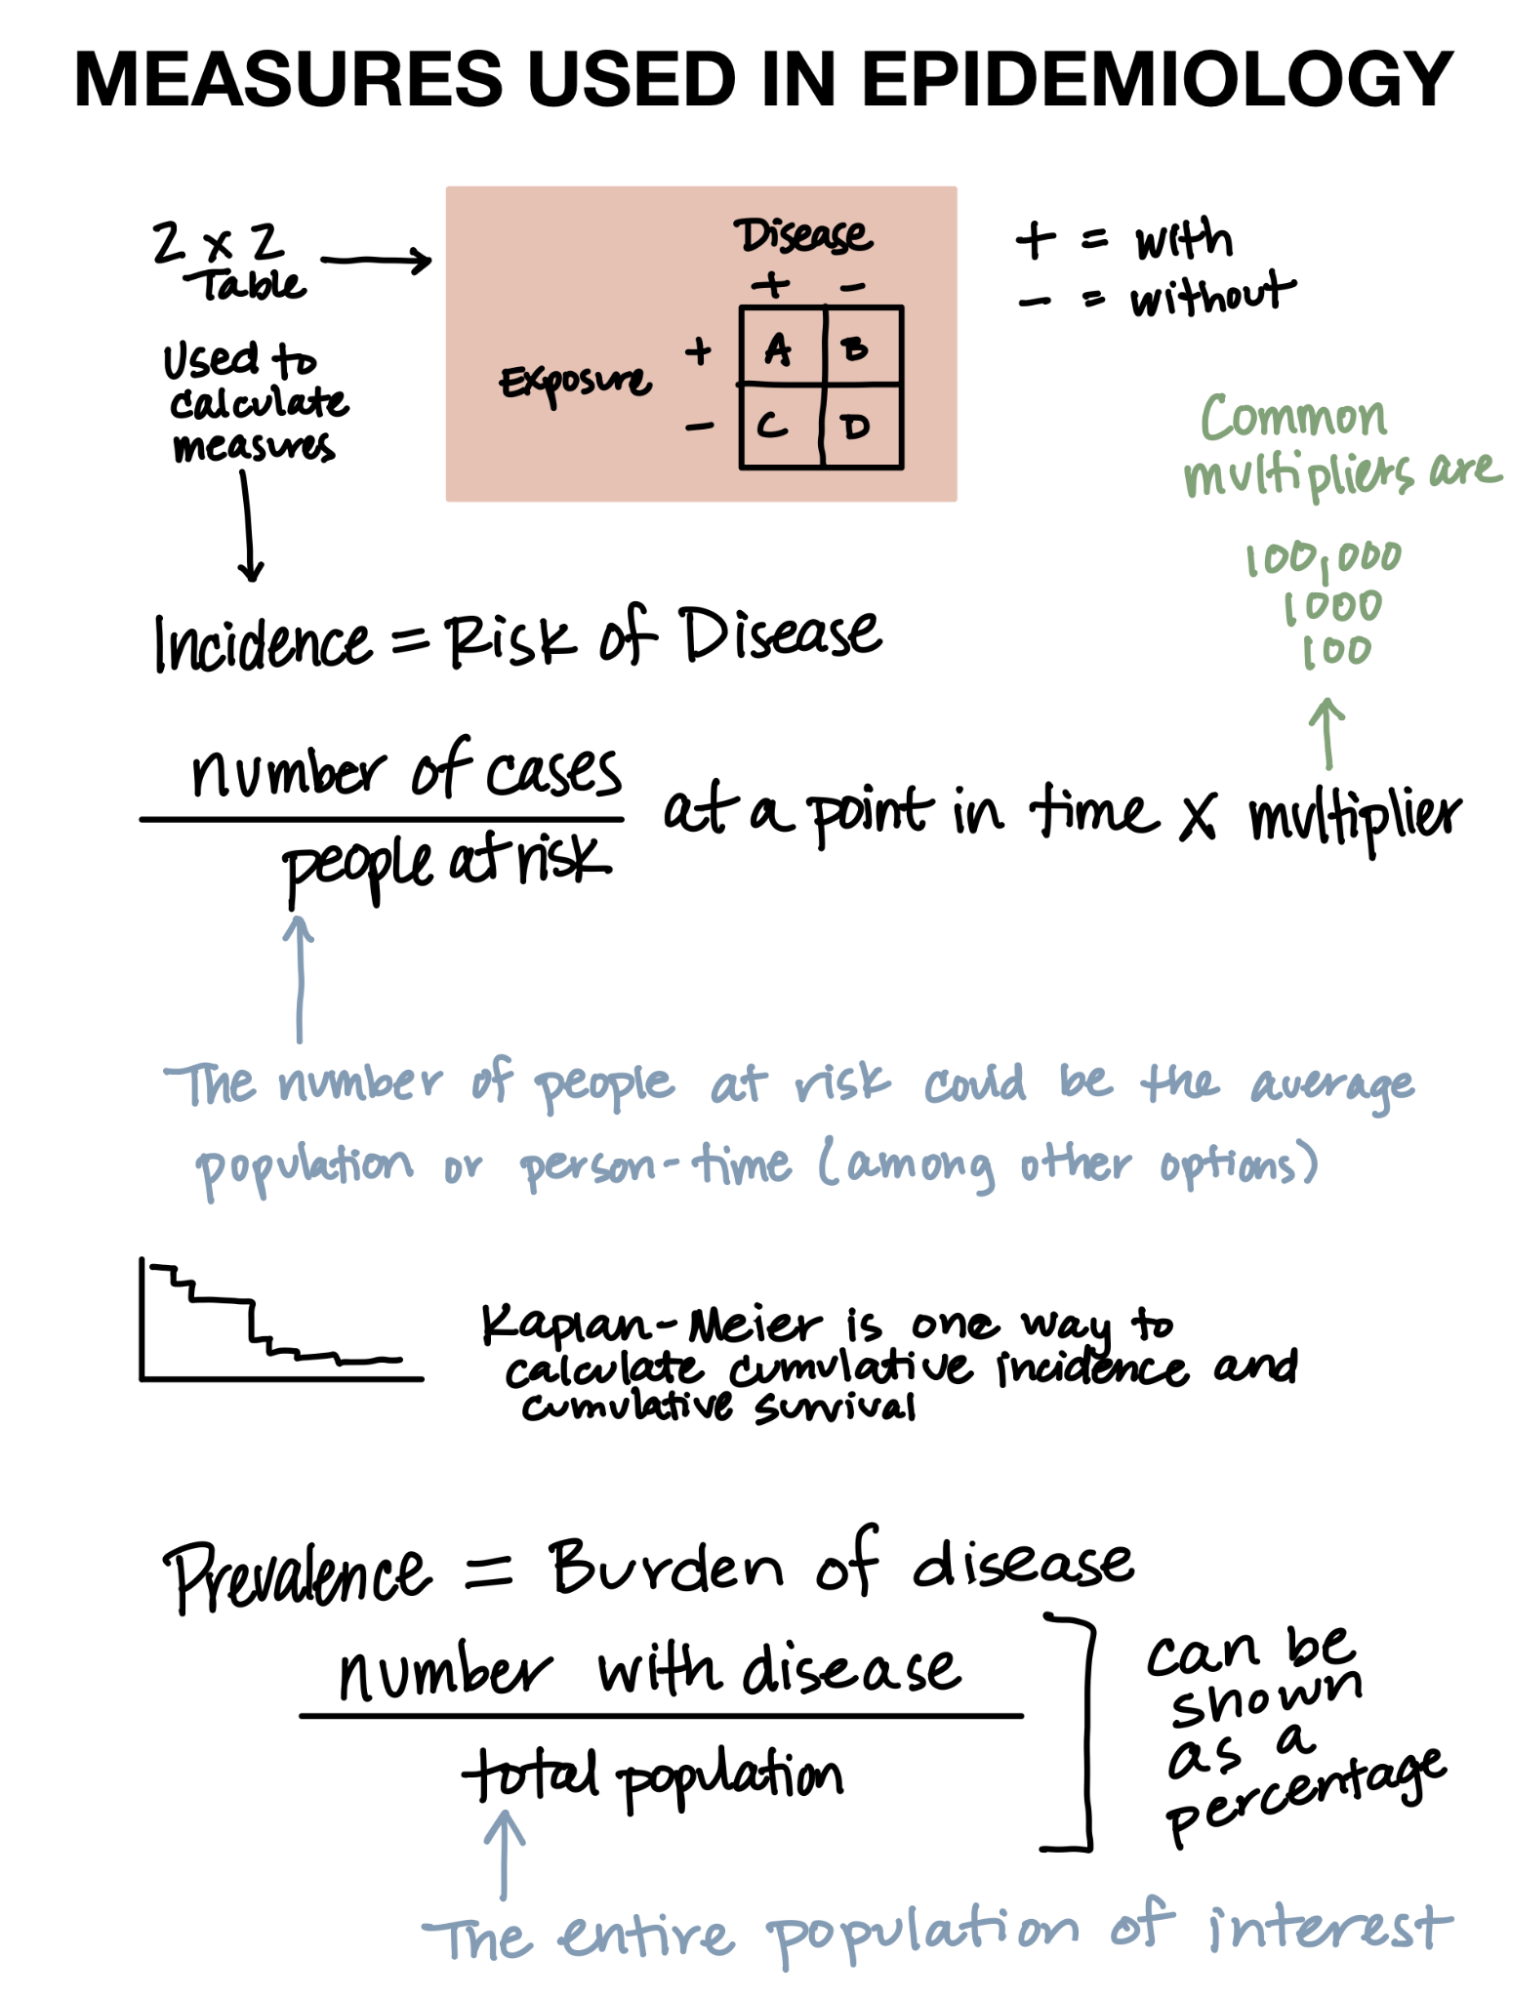
2. Measuring Things in Epidemiology
3. Study Designs
4. Diagnostics and Screening
5. The Wrecking Ball: Bias, Confounding, Interaction and Effect Modification
Study Guide: Measuring Things in Epidemiology
Study Guide: Study Designs
Study Guide: Diagnostics and Screening
Accessibility
Previous/next navigation
Epidemiology Copyright © 2023 by Charlotte Baker is licensed under a Creative Commons Attribution-NonCommercial-ShareAlike 4.0 International License, except where otherwise noted.