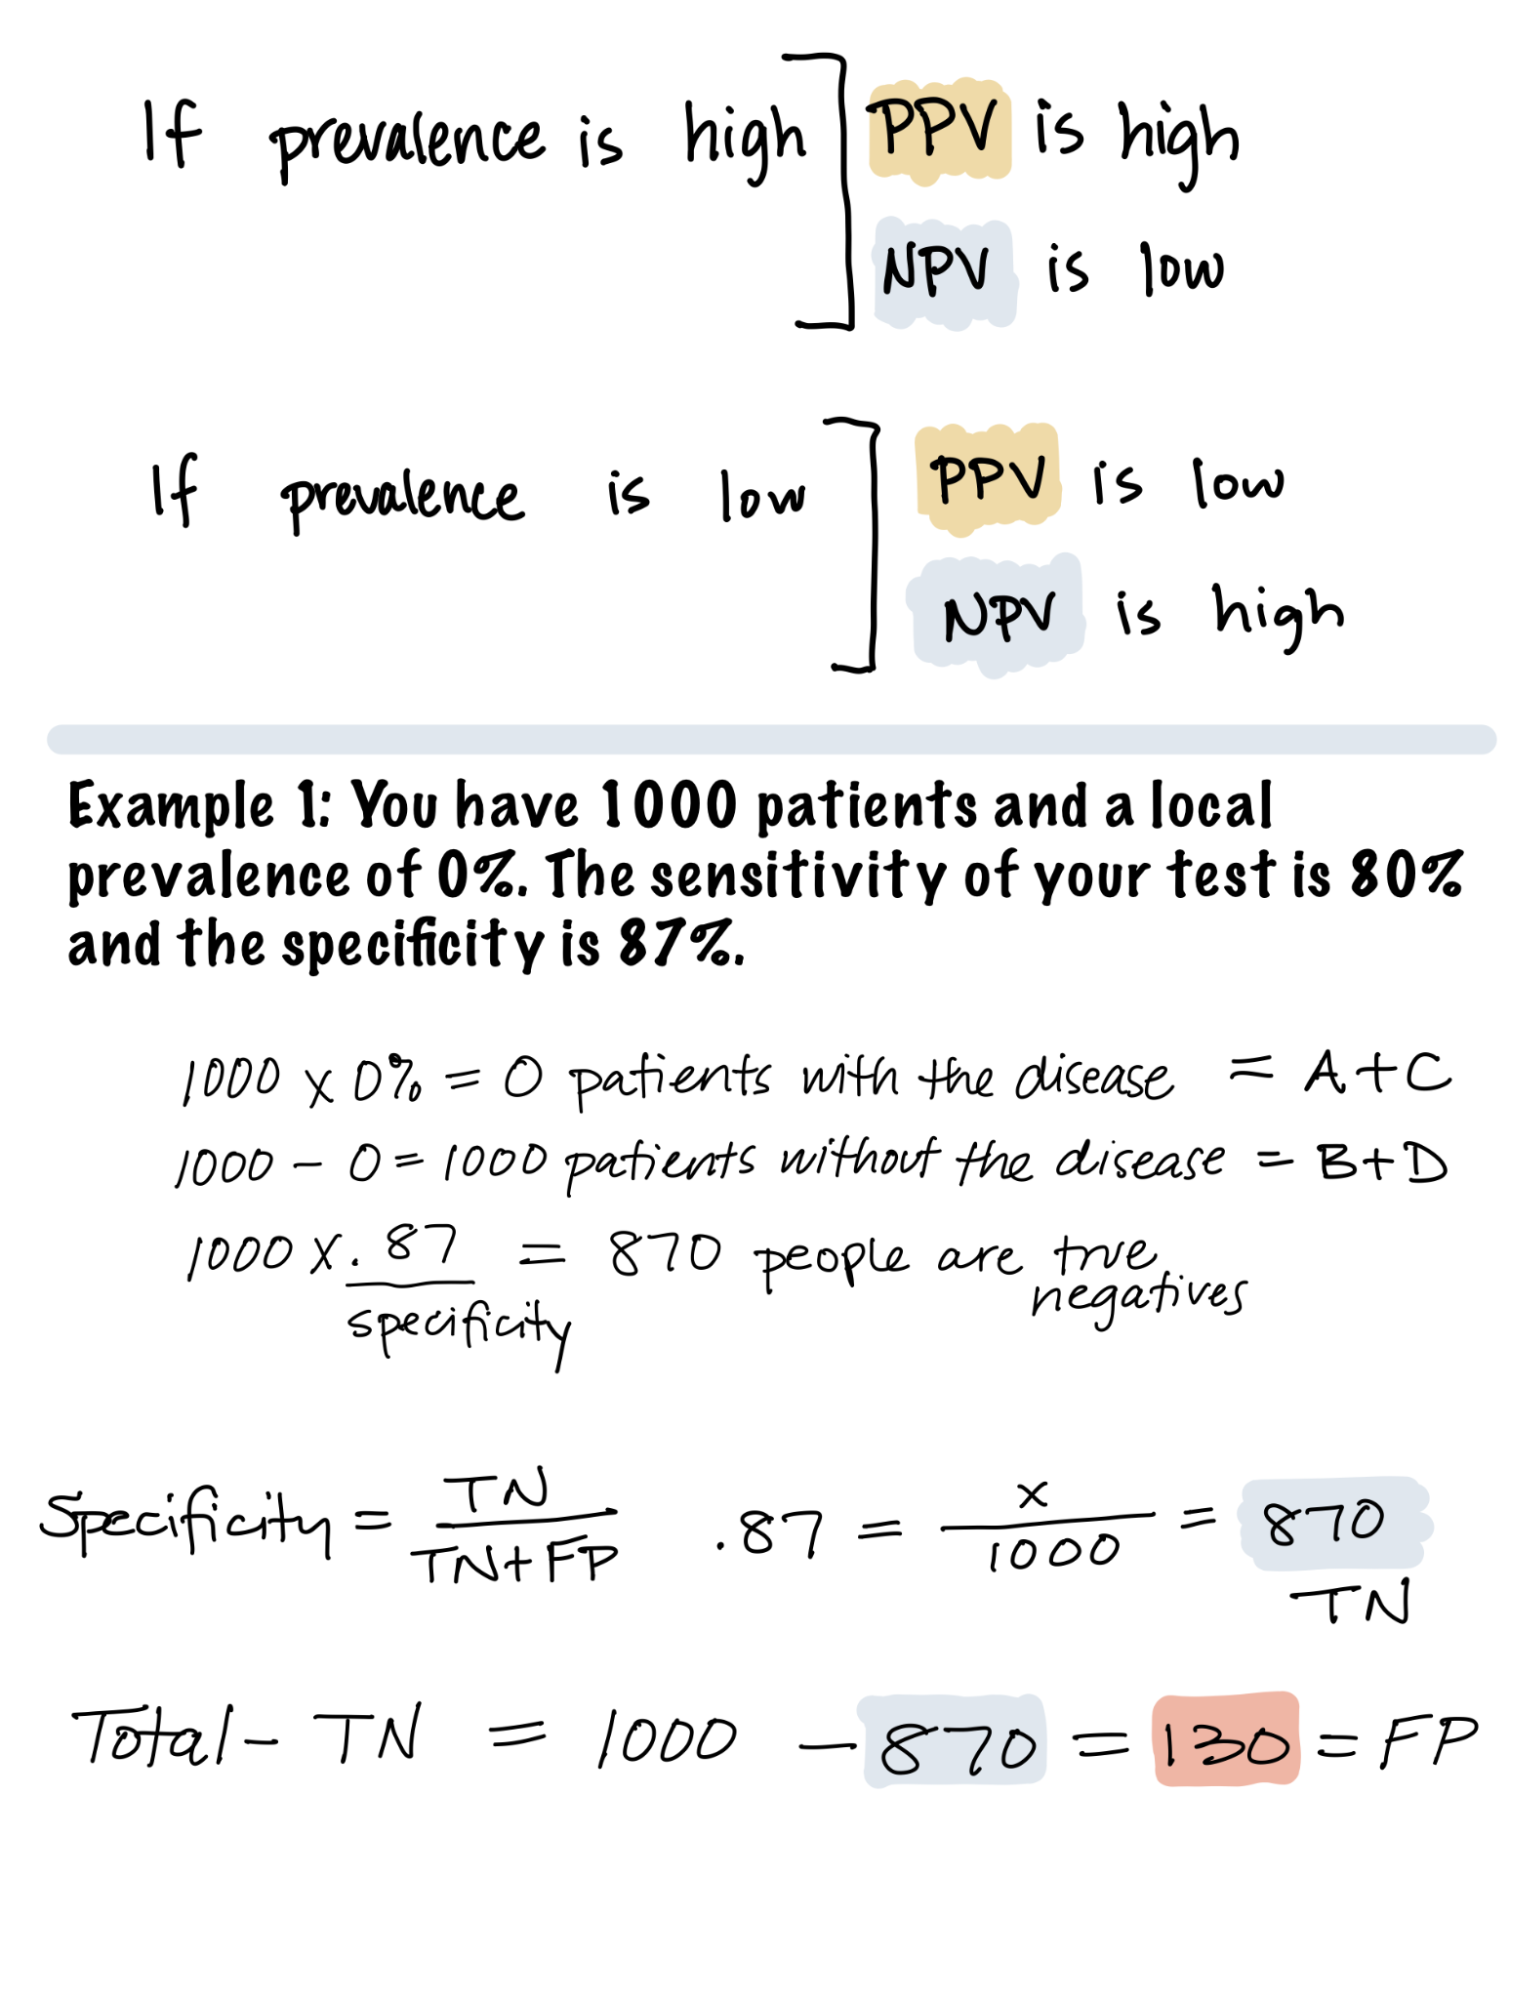
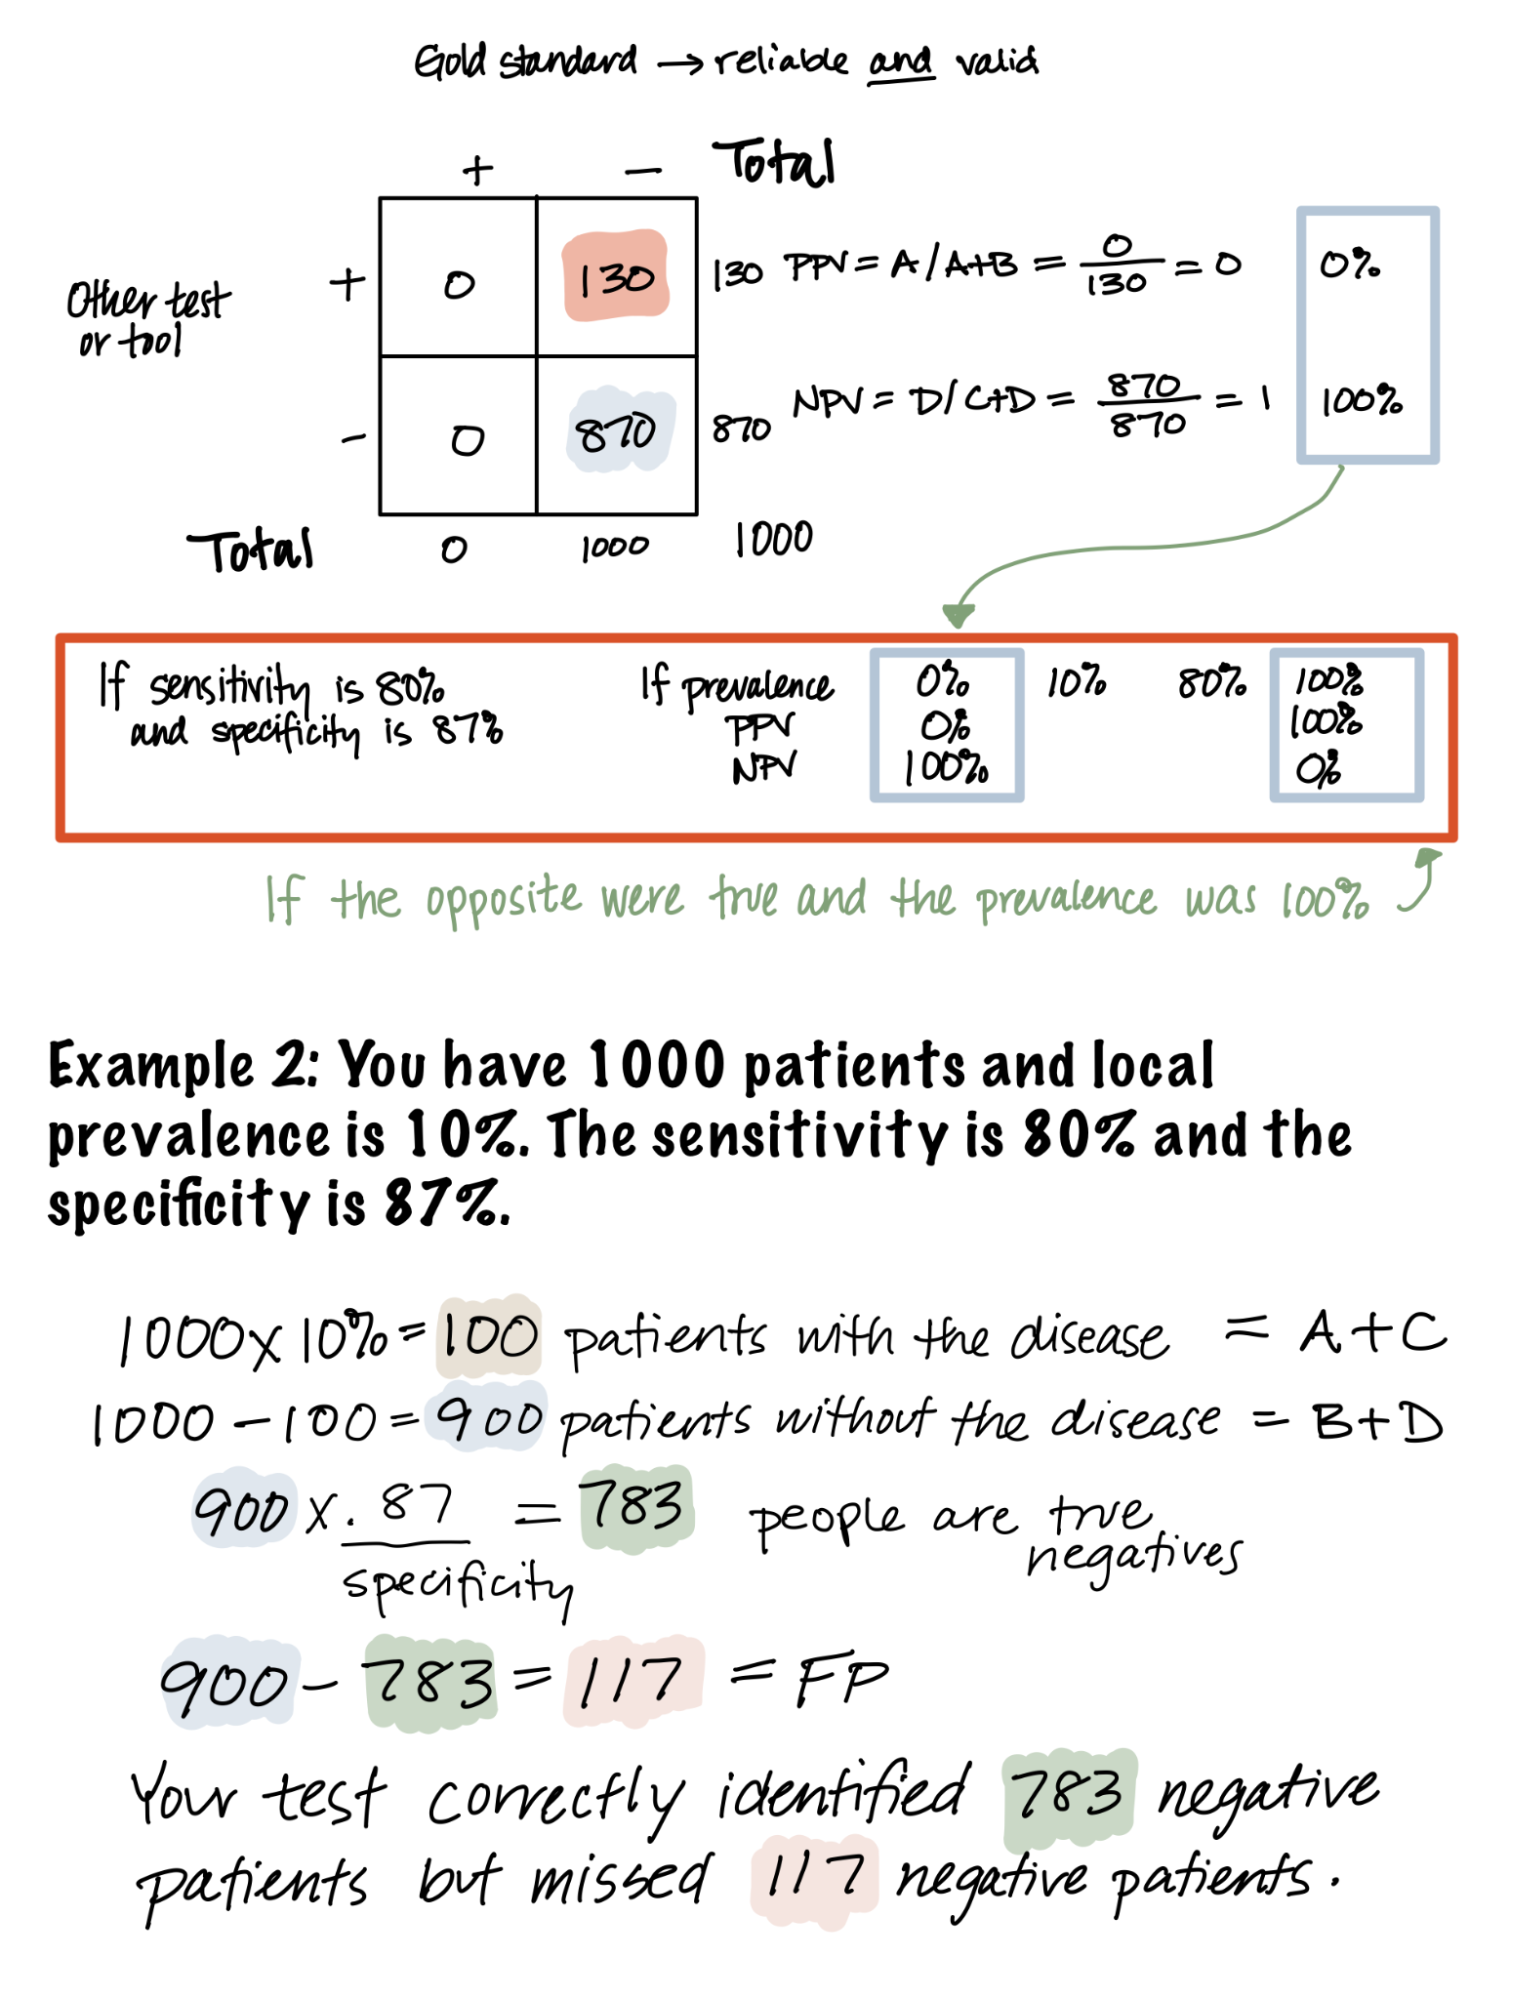
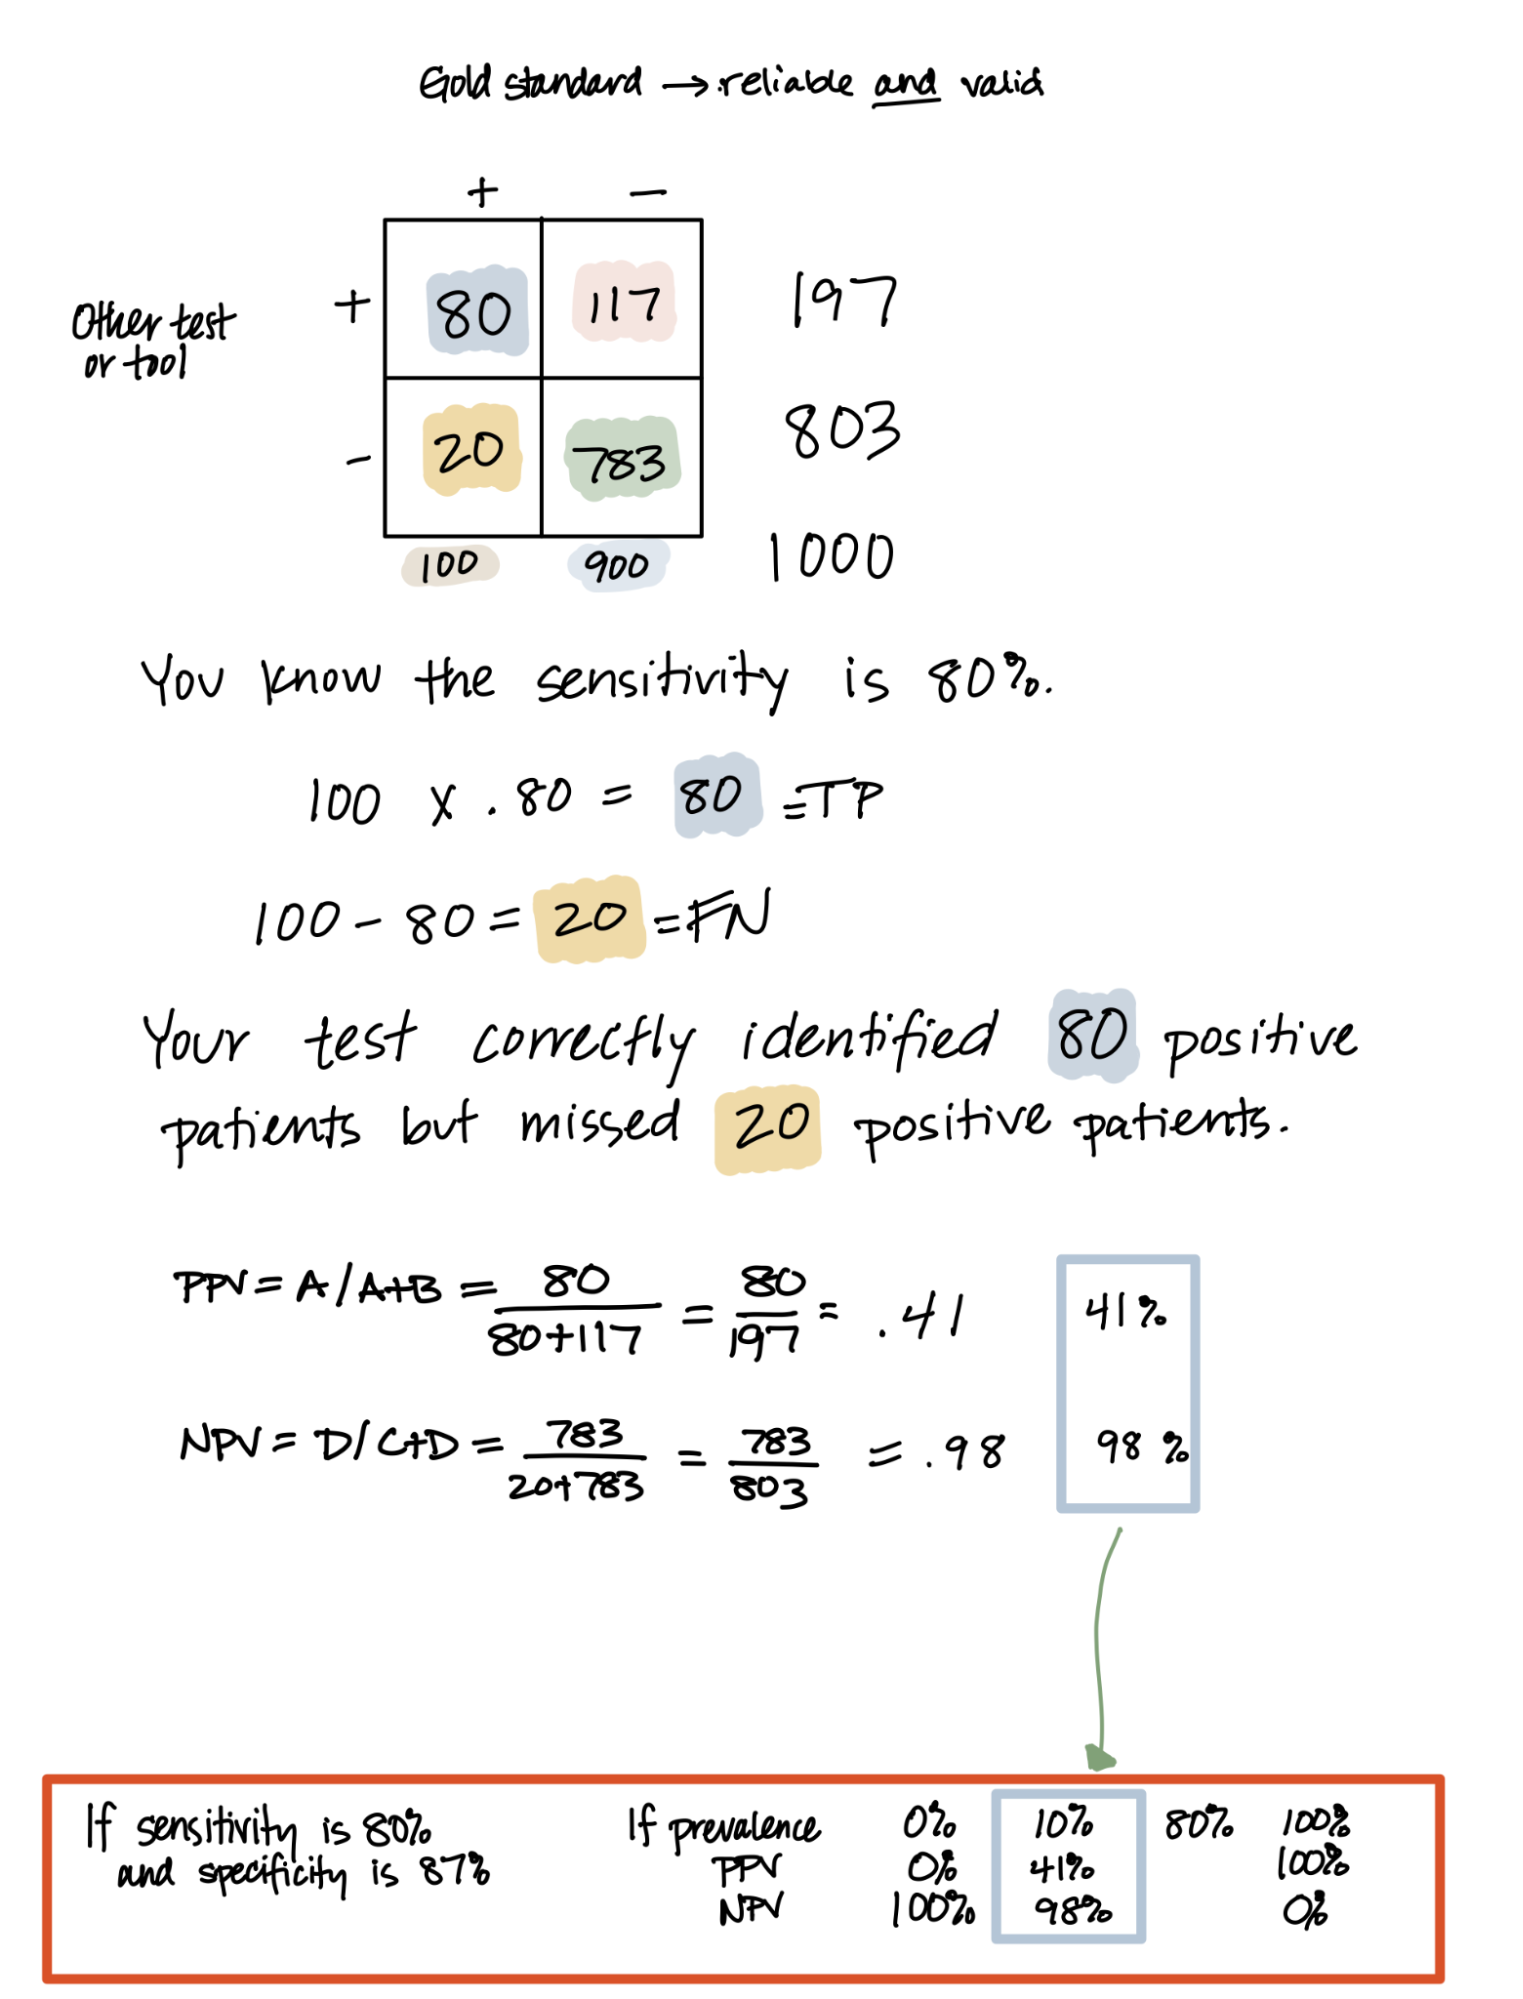
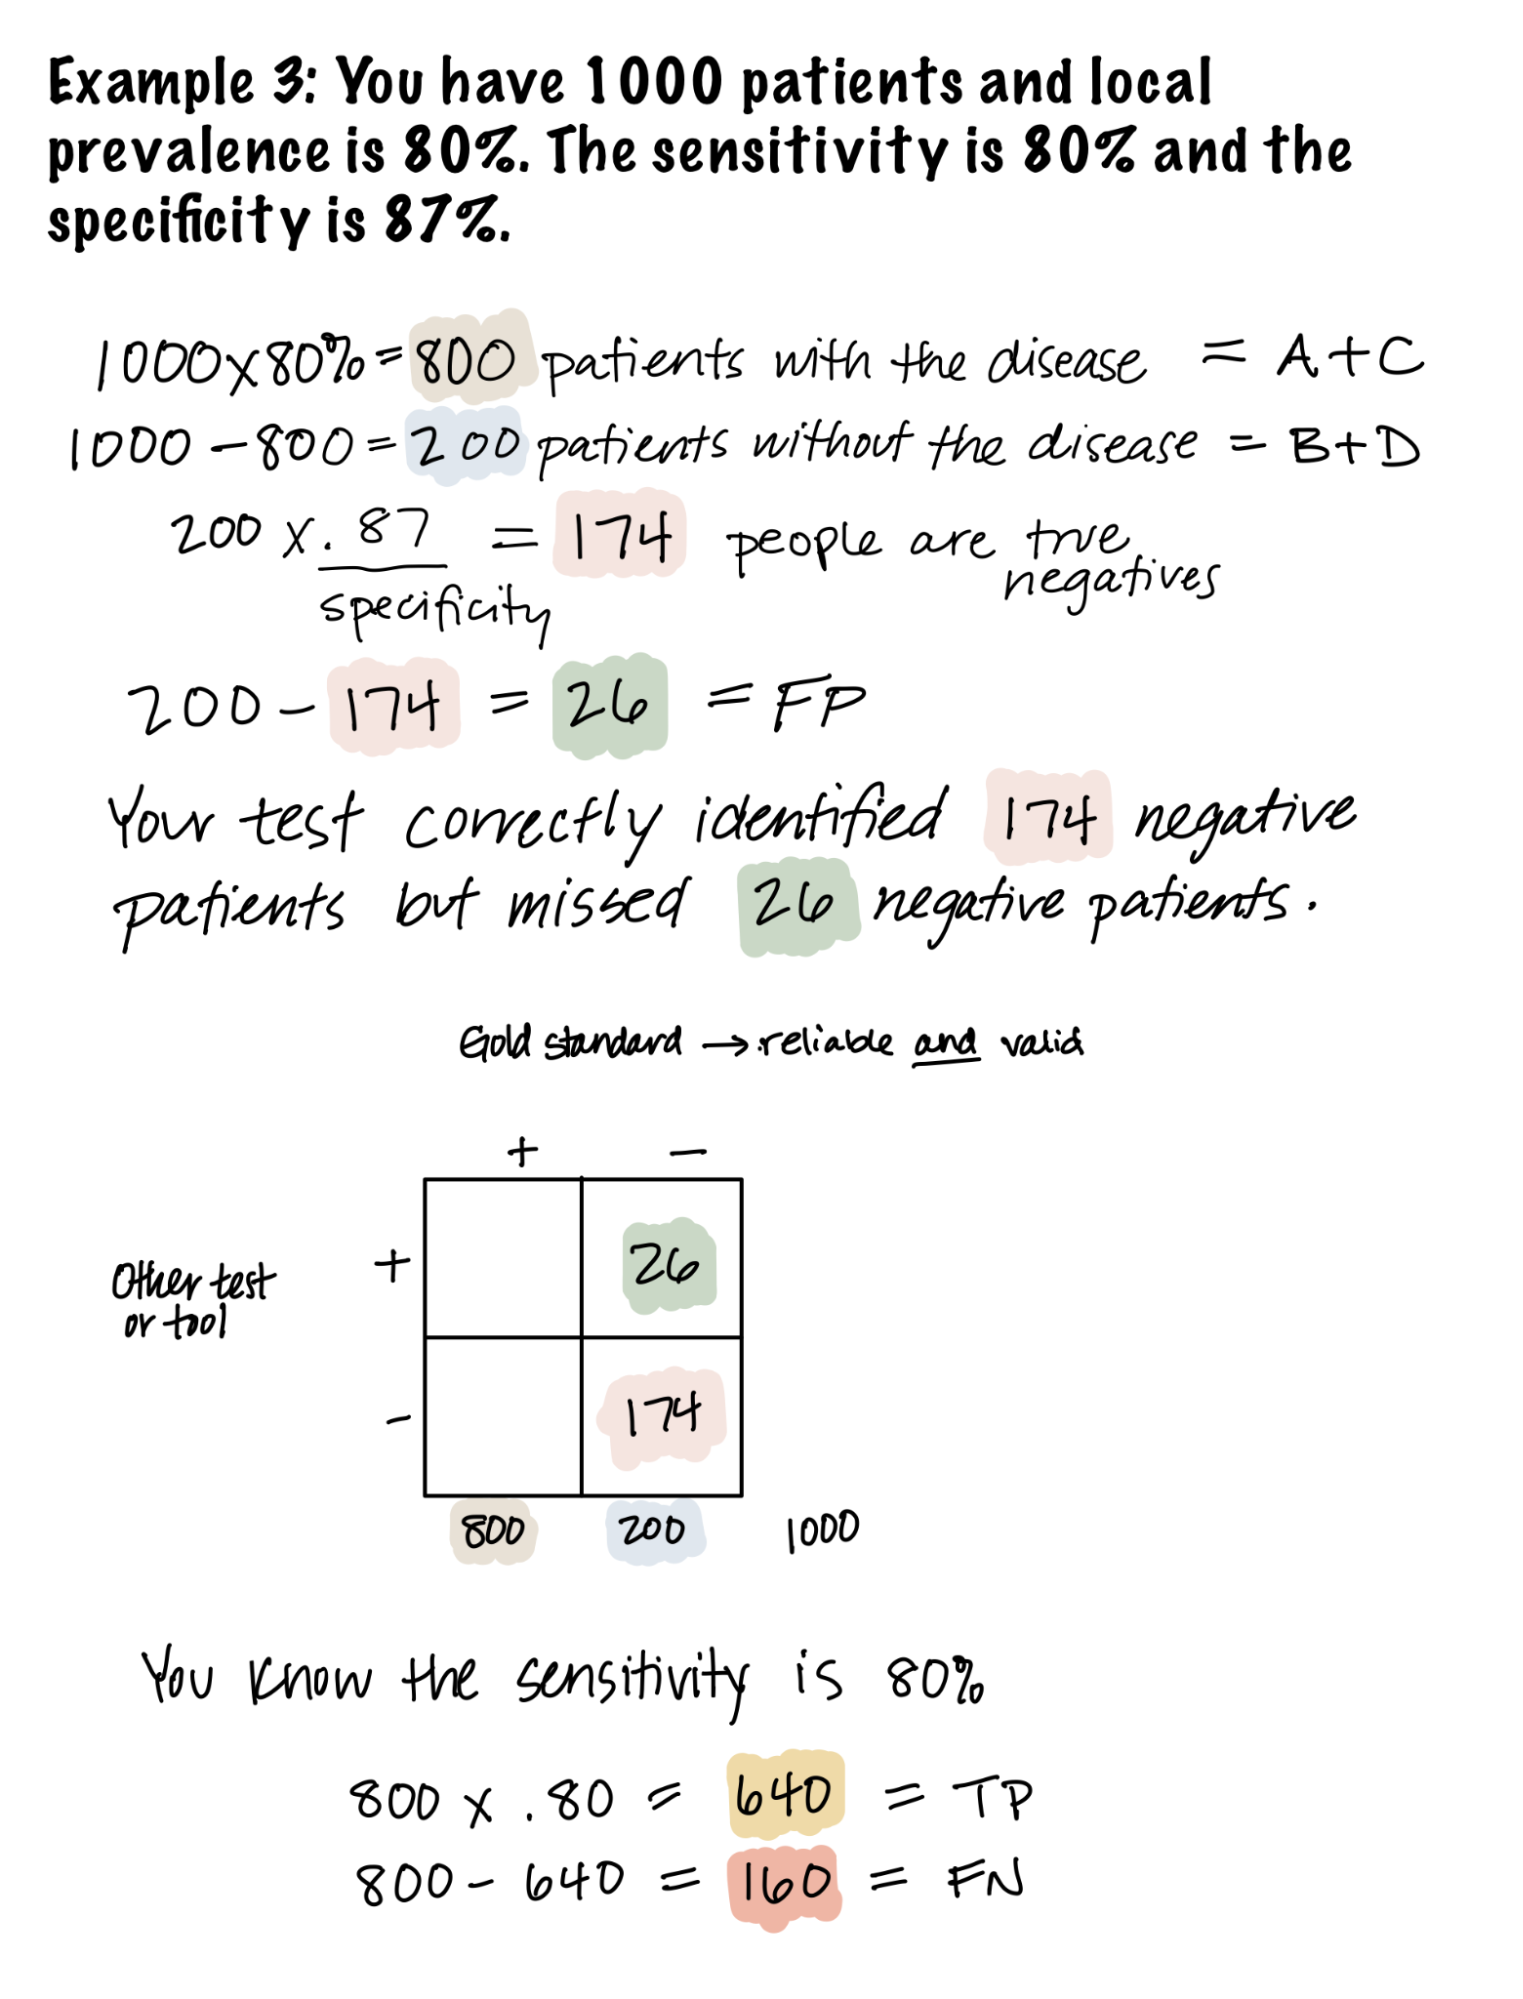
Study Guide: Diagnostics and Screening

Screening Tests. Two-by two table. New Test on y-axis, Gold standard on x-axis. Top left cell: both new test and gold standard are positive, A or True Positive (TP). Top right cell: positive new test with negative gold standard is B, or False Positive (FP). Bottom left cell: positive gold standard with negative new test is C, or False Negative (FN). Bottom right cell: both new test and gold standard are negative, D or True Negative (TN). True positive (TP) equals actually positive and your test agrees. False positive (FP) equals actually negative and your test disagrees. False negative (FN) is actually positive and your test disagrees. True negative (TN) is actually negative and your test agrees. How good is the test? Sensitivity and Specificity. 1. Sensitivity: Is the test good at detecting disease? Very important if you need to rule disease out! Memory tool: in the word Sensitivity, S and N are highlighted, next to the word Snout. S and N are highlighted in red and 'out' is highlighted in blue. If sensitivity is high, you are confident that your test accurately captures all the positives so a negative isn't likely to be really positive. Rule it OUT! Below: Two-by-two table as found in Chapter 3 Part 1 Summary. Sensitivity equals TP/(TP+FN). Also seen as A/(A+C). Specificity: Is the test good at detecting when there is no disease? Very important when you need to rule disease IN! Memory tool: in the word Specificity, S and P are highlighted, next to the word Spin. S and P are highlighted in red and 'in' is highlighted in blue. If specificity is high, you are confident that your test accurately captures all the negatives so a positive isn't likely to be really negative. Rule it IN! Below: Two-by two table as found in Chapter 3 Part 1 Summary. Specificity equals TN/(TN+FP). Also seen as D/(B+D). Box 3. The relationship between sensitivity and specificity. Balance Between the Two: Left is distribution curve labelled TN (healthy), negative test result. Right is another distribution curve labelled TP (diseased), positive test result. The tails of both distributions overlap with each other, with red dotted line (cutoff) indicating the intersection of their curves. The area to the left of the cutoff in which the TP curve overlaps with TN represents FN. The area to the right of the cutoff in which the TN curve overlaps with TP represents FP. TN curve (left) overlaps with TP (right) curve. Red dotted line (cutoff) intersects with both curves, equals happy medium. Left: ruled out (actually negative). Right: ruled in (actually positive). Ex: More important to identify those with a concussion but not at the expense of having people overdiagnosed. You have false positives and false negatives. If positive, there is a chance you are negative. If negative, there is a chance you are positive. Test is mostly valid and reliable. If incorrect diagnosis (dx) harms people, balance is key (ex: test in utero for birth defect) Optimally, you want 100% sensitivity and 100% specificity but often it is a balance. Above, neither is 100% but they are balanced (some FP and an equal amount of FN). IF we want to capture all cases, we have to more the cutoff value of the test to the left. This will result in more false positives. Maximize Sensitivity: TN curve (left, negative test result) overlaps with TP (right, positive test result). The area where both overlap represents FP when cutoff (red dotted line) intersects the TN curve, but not really the TP curve. When might we want this? We know some tests (Ex: rapid HIV) are going to have false positives. They are intended to help catch as many positives as possible so we back it up with a more accurate blood test on all positive from rapid testing to better rule OUT the diagnosis. If initial does minimal/no harm, maximize: pregnancy test, flu screen, UTI screen. Overlap of TN and TP curves as found in Chapter 3 Part 4 Summary. Cutoff to left of tail of TP curve, another line to right of tail end of TN curve. In between these lines, these will test positive. Some are, some are not. Left cutoff line is 100% sensitivity. More important to correctly identify those with a concussion than determine they do not. In this example, you only have false positives. If positive, there is a chance you are negative. If negative, you are definitely negative (remember: Snout) Maximize Specificity: TN curve (left) overlaps with TP (right). The area where both overlap represents FN when cutoff (red dotted line) intersects the TP curve, but not really the TN curve. When might we want this? Sometimes it is very important to be definitive that someone does have a disease or outcome, for example a fatal disease or Syphilis when pregnant. In these cases, a false positive test could cause more harm than good so we maximize our ability to rule disease IN. Cutoff to right of tail end of TN curve, another line to left of TP curve. In between these lines, these will test negative. Some are, some are not. Right cutoff line is 100% specificity. In this example, you only have false negatives. If negative, there is a chance you are positive. If positive, you are definitely positive (remember: Spin). The higher the sensitivity, the lower the specificity. The higher the specificity, the lower the sensitivity. If both are low, the test is neither valid nor reliable, so do not use. B) How good is this test in my population? Predictive value positive and negative. Requires local prevalence information! 1) Predictive value positive (PPV): Does my patient with a positive test really have the disease? Two-by-two table with new test and gold standard (as found in Chapter 3 Part 1 Summary). PPV equals TP/(TP+FP). Also seen as A/(A+B). If specificity increases, so does PPV because TN increases. 2) Negative predictive value (NPV): Does my patient with a negative test really not have the disease? Two-by-two table with new test and gold standard. NPV equals TN/(TN+FN). Also seen as D/(C+D). If prevalence is high, PPV is high and NPV is low. If prevalence is low, PPV is low and NPV is high. Example 1: You have 1000 patients and a local prevalence of 0%. The sensitivity of your test is 80% and the specificity if 87%. 1000*0% equals 0 patients with the disease (A+C). 1000-0 equals 1000 patients without the disease (B+D). 1000*0.87 equals 870 people who are true negatives. Specificity equals TN/(TN+FP). 0.87 equals x/1000, so there are 870 TN. Total minus TN equals 1000 minus 870, so there are 130 FP. Gold standard is reliable and valid (x-axis of 2 by 2 table). Other test or tool (y-axis of table). Table: 0 in A, 0 in C, 130 in B, 870 in D. PPV equals A/(A+B) or 0/130, so PPV is 0%. NPV equals D/(C+D) or 870/870, so NPV is 1 or 100%. If sensitivity is 80%, specificity is 87%, and prevalence is 0%, PPV is 0% and NPV is 100%. Example 2: You have 1000 patients and local prevalence is 10%. The sensitivity is 80% and the specificity is 87%. 1000*10% equals 100 patients with the disease (A+C). 1000-100 equals 900 patients without the disease (B+D). 900*0.87 equals 783 people who are true negatives. 900 minus 783 equals 117, which is the number of FP. Your test correctly identified 783 negative patients but missed 117 negative patients. Gold standard is reliable and valid (x-axis of 2 by 2 table). Other test or tool (y-axis of table). Two-by-two table with new test and gold standard. A is 80, C is 20, B is 117, D is 783. You know the sensitivity is 80%. 100*0.80 equals 80 TP. 100 minus 80 equals 20 FN. Your test correctly identified 80 positive patients but missed 20 positive patients. If sensitivity is 80%, specificity 87%, and prevalence is 10%, then: PPV equals A/(A+B), which is 80/197, equal to 0.41 or 41%. NPV equals D/(C+D), which is 783/803, equal to 0.98 or 98%. Example 3: You have 1000 patients and local prevalence is 80%. The sensitivity is 80% and the specificity is 87%. 1000*80% equals 800 patients with the disease (A+C). 1000-8000 equals 200 patients without the disease (B+C). 200*0.87 equals 174 people who are true negatives. 200-174 equals 26 FP. Your test correctly identified 174 negative patients but missed 26 negative patients. Two-by-two table with new test and gold standard. B is 26, D is 174, and you know A+C is 800 and B+D is 200. You know the sensitivity is 80%. To find true positives, take 800*0.80, which equals 640 TP. To find false negatives, take 800 minus 640, which equals 160 FN. Your test correctly identified 640 positive patients but missed 160 positive patients. Two-by-two table: A is 640, C is 160, B is 26, and D is 174. PPV equals A/(A+B), which is 640/666, or 0.96). NPV equals D/(C+D), which is 174/334, or 0.52. When sensitivity is 80% and specificity is 87%, with a prevalence of 80%, PPV is 96% and NPV is 52%.

License

Icon for the Creative Commons Attribution-NonCommercial-ShareAlike 4.0 International License

Epidemiology Copyright © 2023 by Charlotte Baker is licensed under a Creative Commons Attribution-NonCommercial-ShareAlike 4.0 International License, except where otherwise noted.

Share This Book