Chapter 14. Adding Tiles to an Existing .lasd Dataset
Chapter 13. Combining Tiles into One .lasd Dataset provided instructions on combining multiples tiles into one .lasd file or LAS dataset. This chapter will provide instructions on adding additional tiles to an already established LAS dataset, updating statistics, and removing a tile from a LAS dataset.
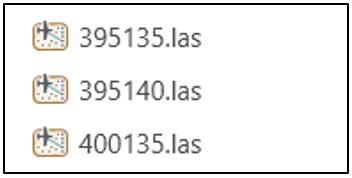
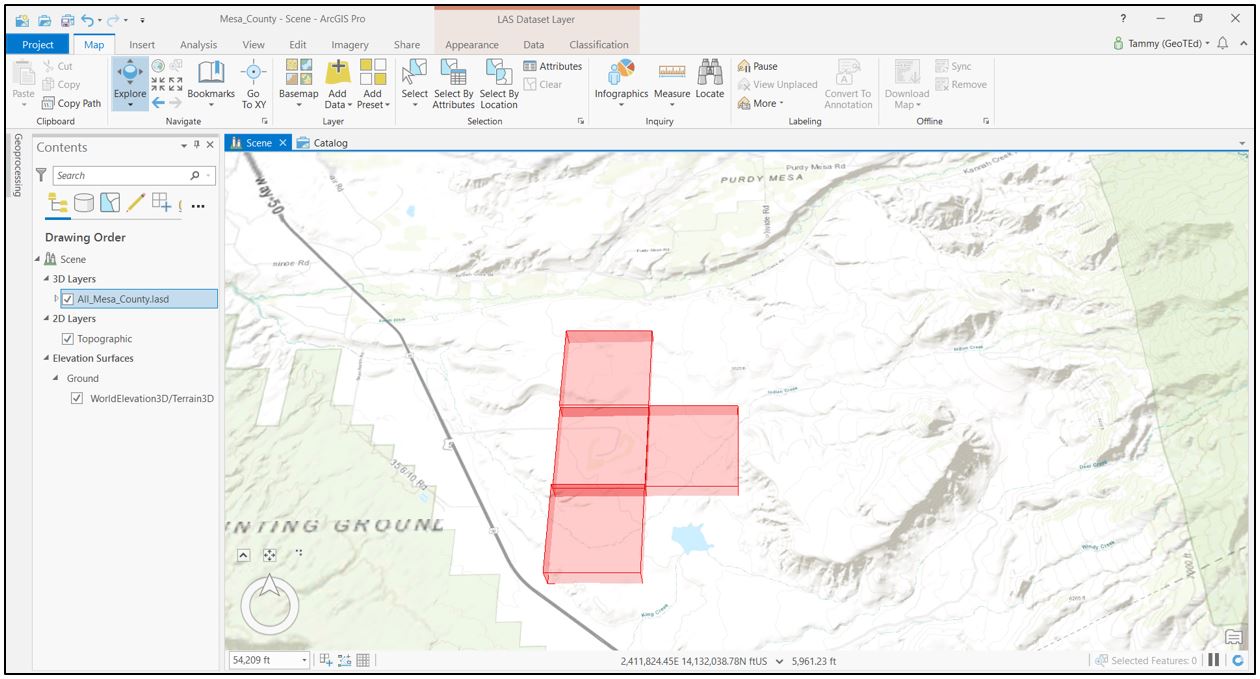
Create a new local scene for Mesa County lidar data. Add the three separate tiles downloaded in Chapter 7. Locating Lidar Data (Figure 14.1).
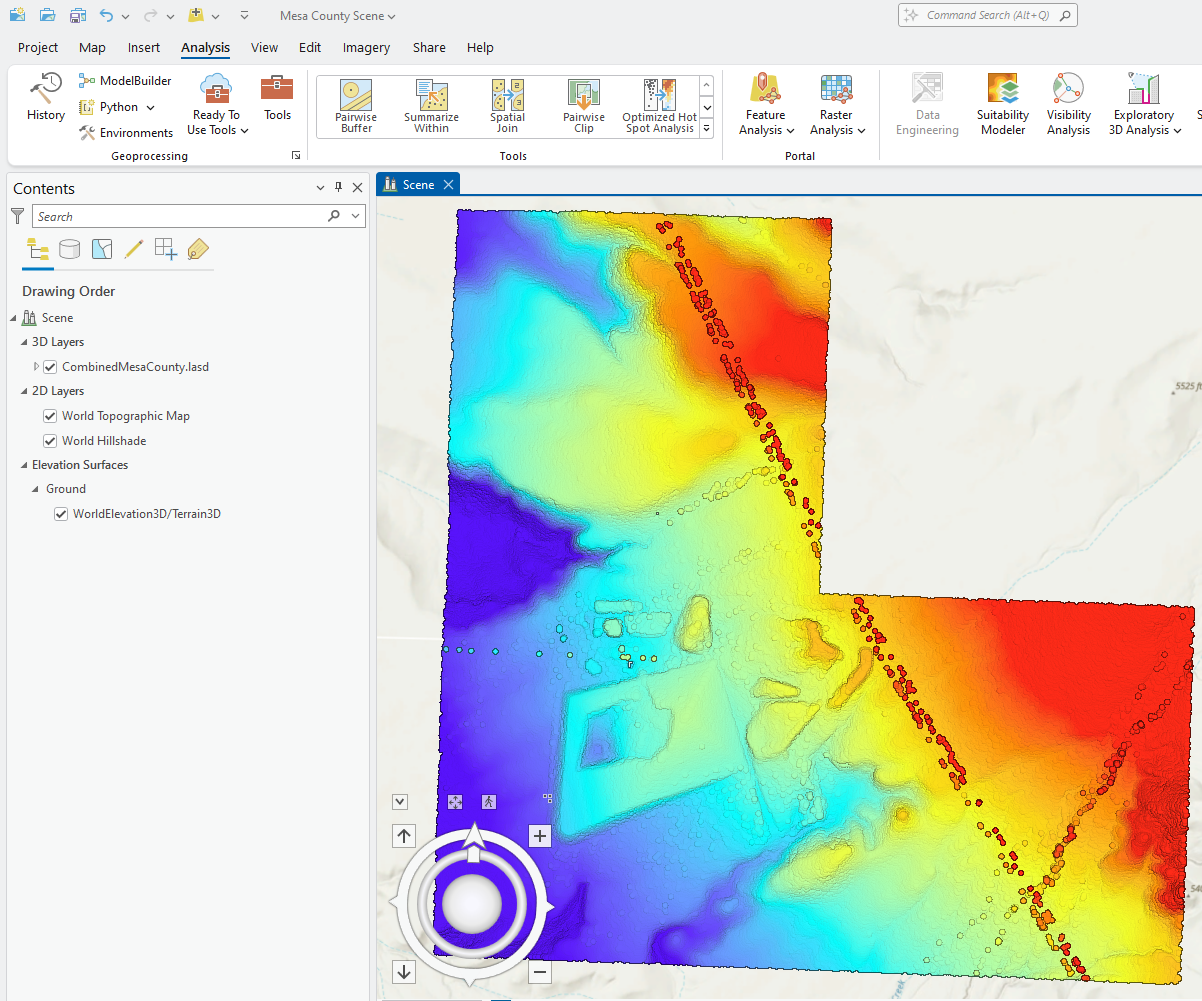
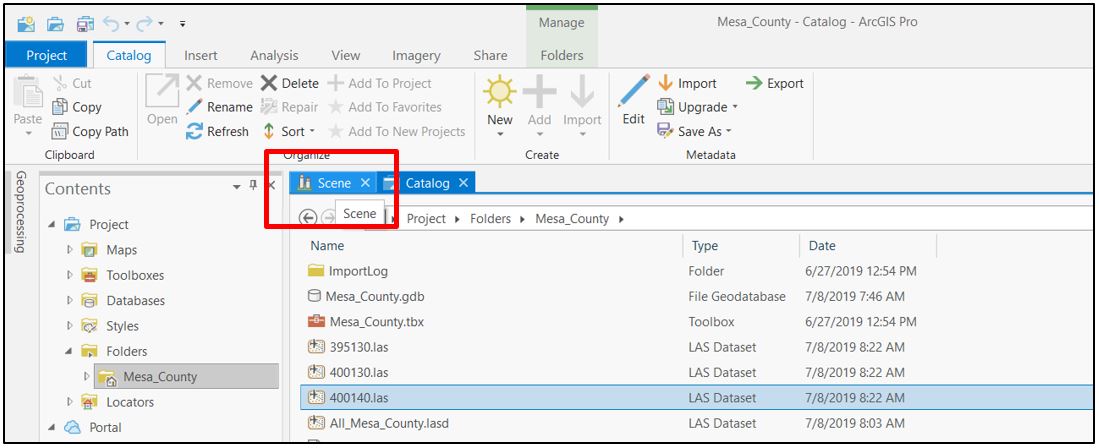
Create a combined LAS dataset for these three tiles and remove the individual datasets (Figure 14.2).
Go back to the Mesa County Colorado GIS website (https://emap.mesacounty.us/DownloadData/) to obtain additional lidar tiles. If you don’t recall how to navigate the site, review Chapter 7. Locating Lidar Data. Recall the location of the original three tiles selected in Chapter 7 and choose three additional adjacent tiles (indicated by the red dots in Figure 14.3).
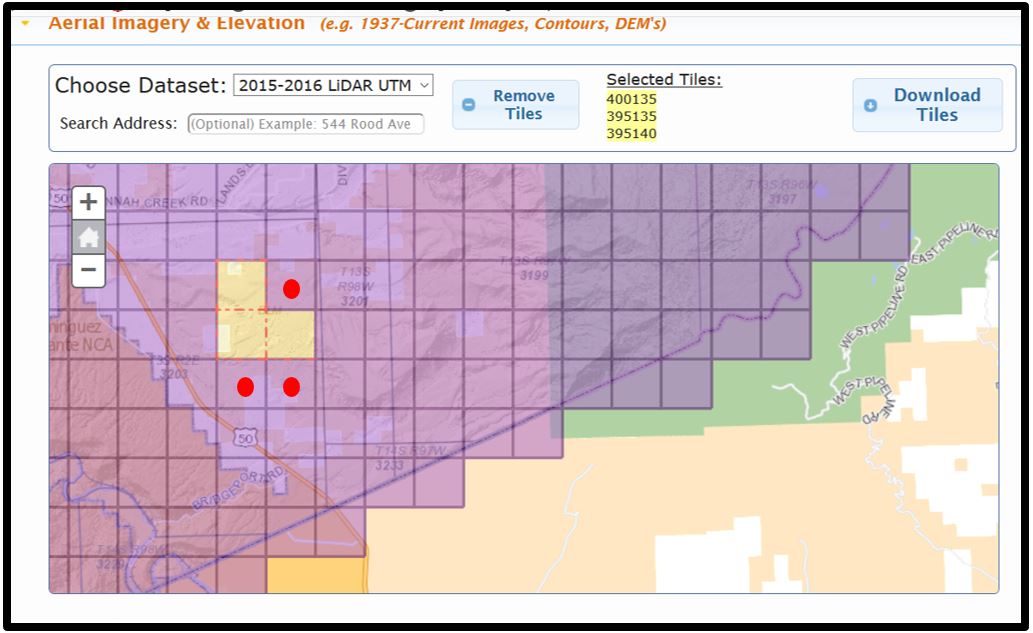
When selected, the tiles are highlighted (yellowish) (Figure 14.4).
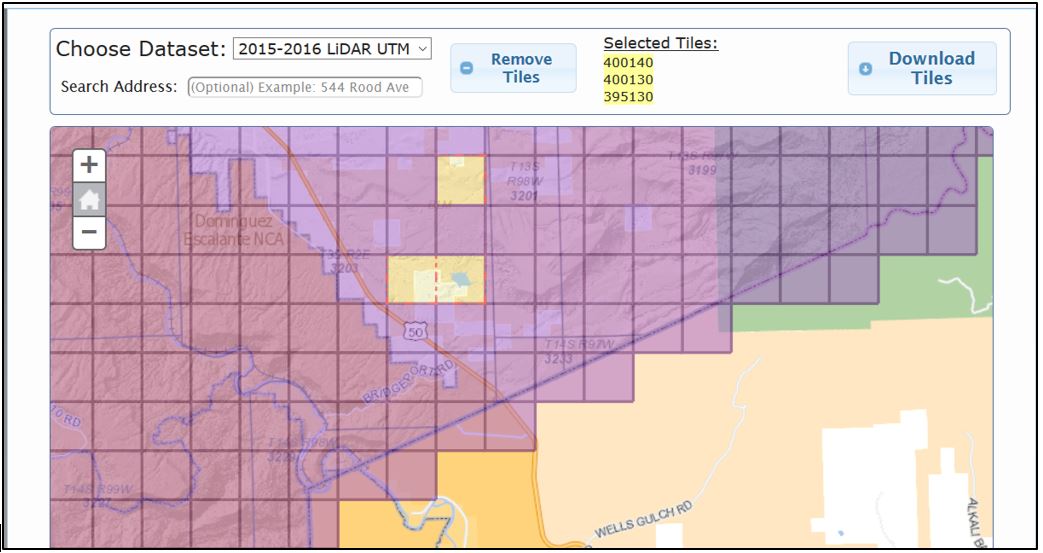
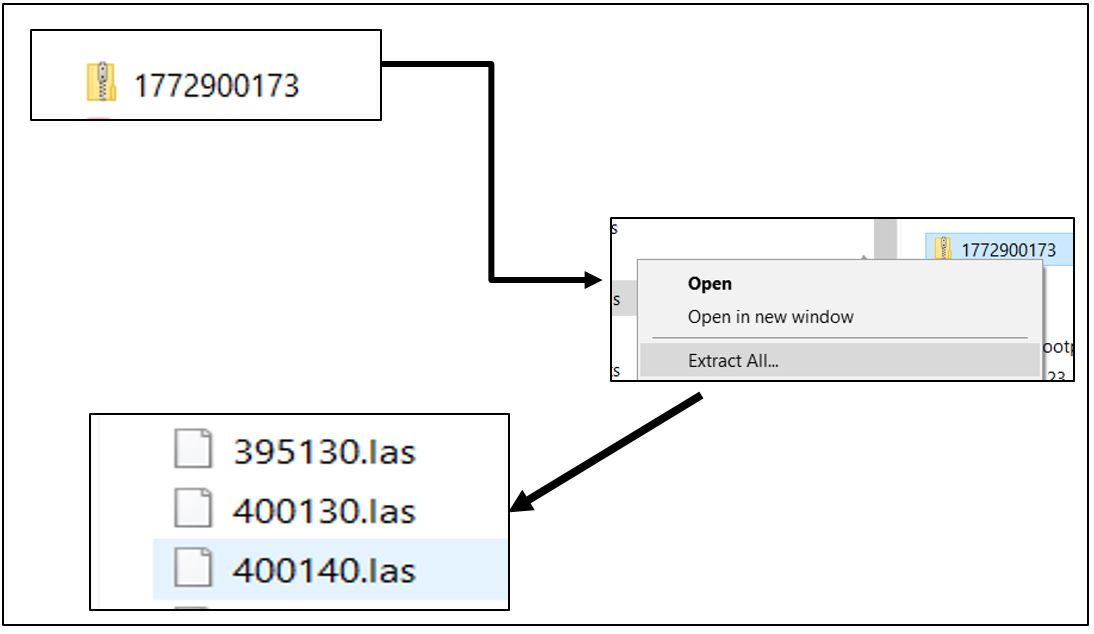
Download the three new tiles and unzip them into the same file folder as the original three tiles (Figure 14.5).
The new tiles can be added to the LAS dataset in two ways—using Catalog View or using a geoprocessing tool. We will demonstrate both.
Adding a new tile using Catalog
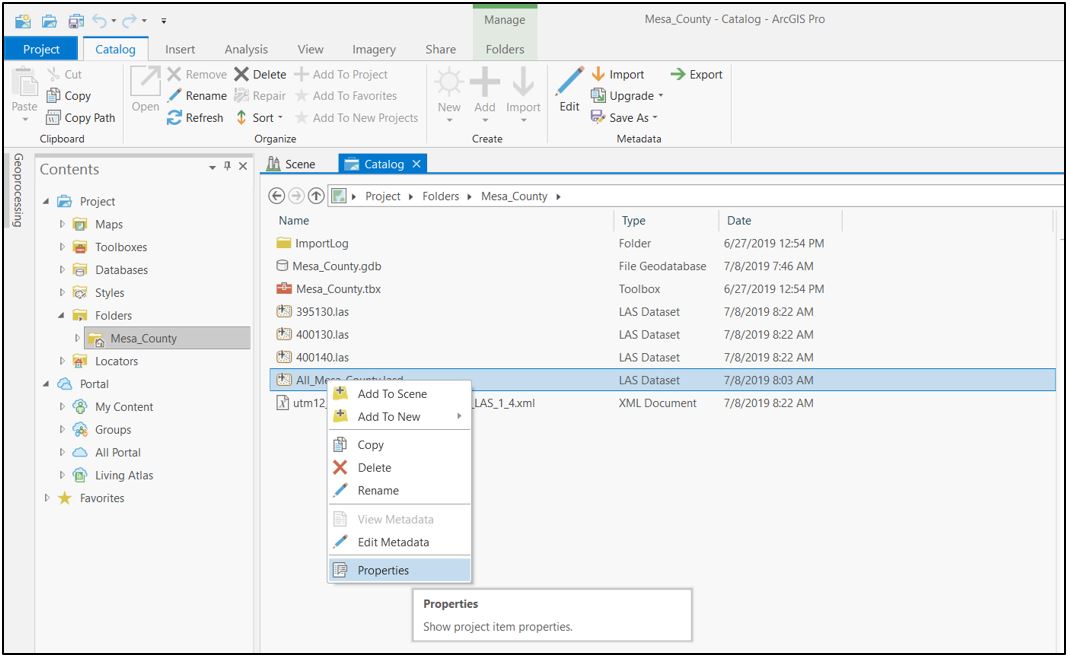
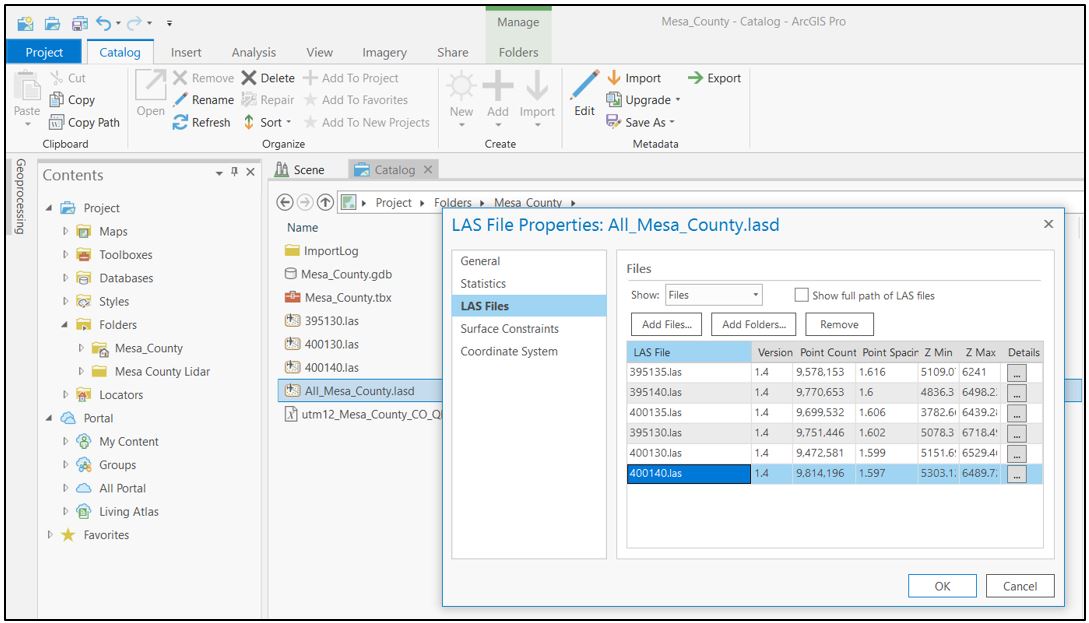
Open Catalog View, locate the combined .lasd dataset created above, right-click on the dataset name and select Properties (Figure 14.6).
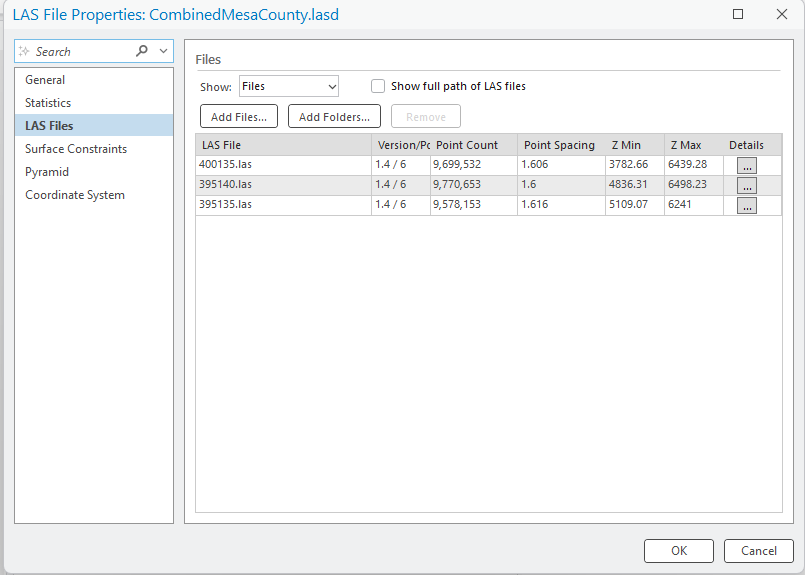
Select LAS Files and click Add Files (Figure 14.7).
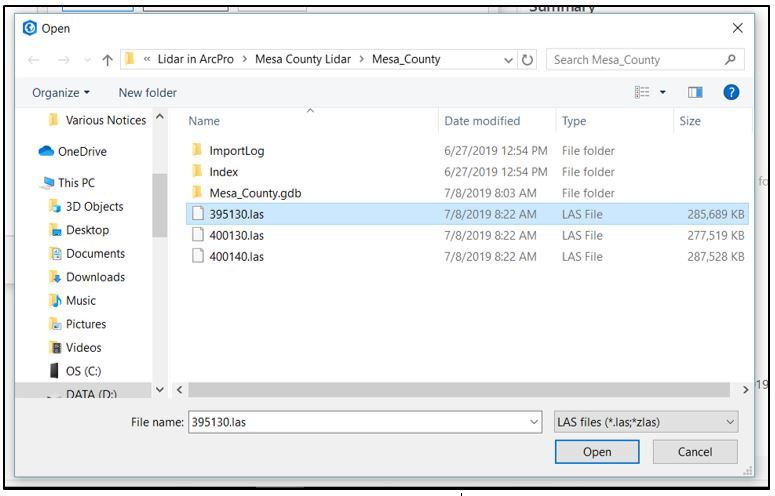
Navigate to the folder where the newly downloaded tiles are saved (Figure 14.8).
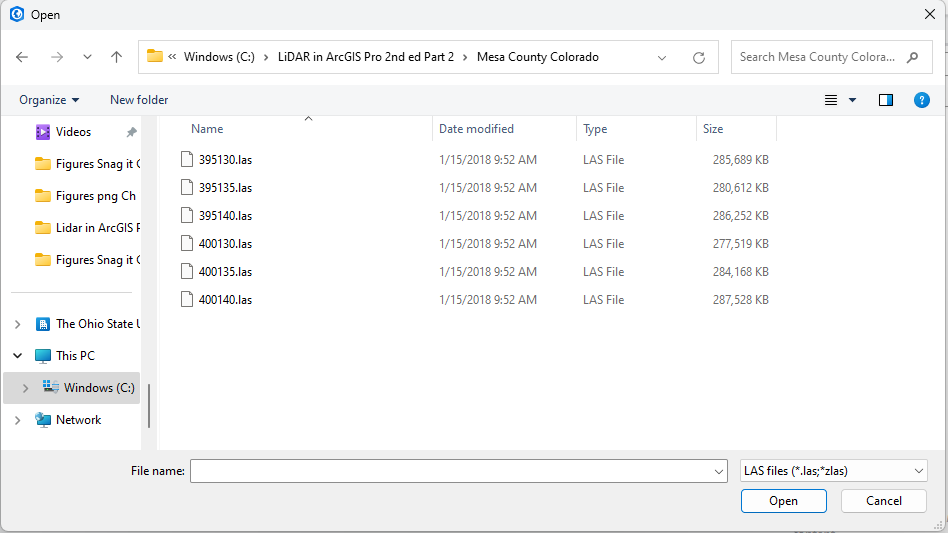
For this example, choose only the file 395130.las; the other two tiles will be added using a geoprocessing tool later in this chapter. Once the selected tile is populated in File name, click Open (Figure 14.9).
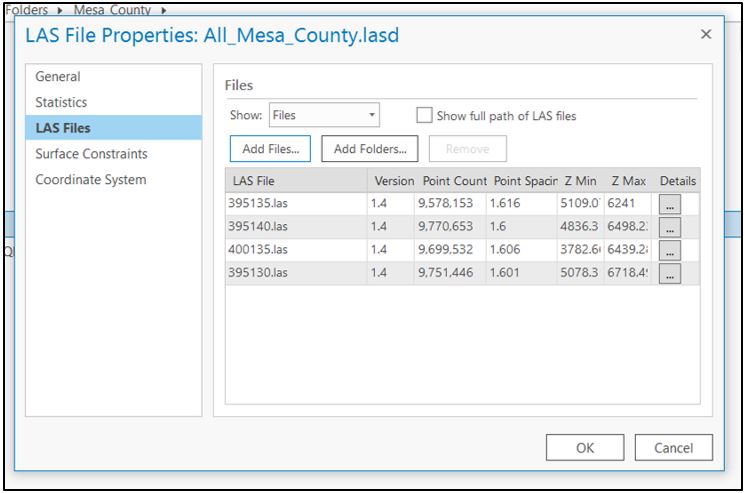
The .lasd dataset now shows four tiles (Figure 14.10).
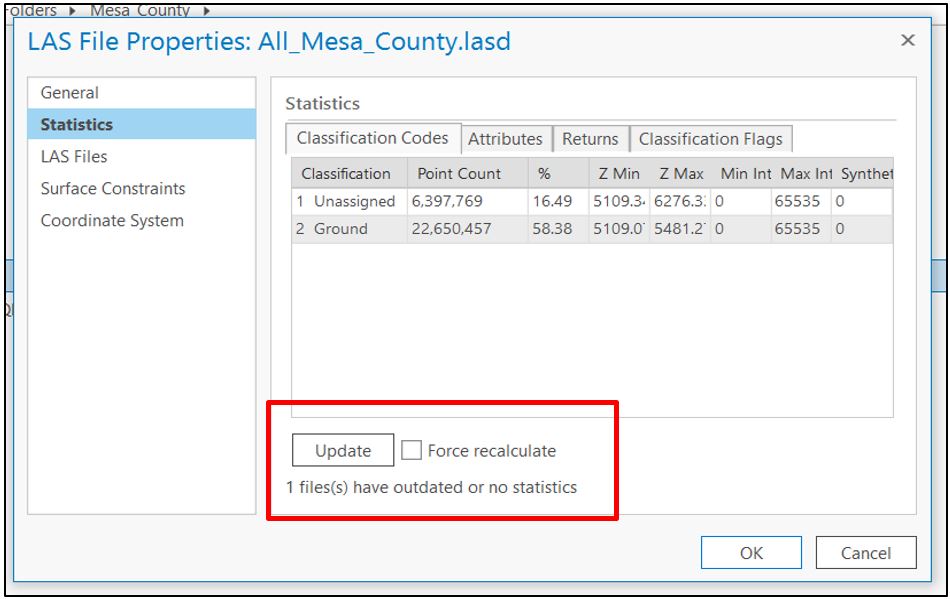
Now choose the Statistics option (Figure 14.11). Note the message at the bottom of the window: 1 file (s) have outdated or no statistics. Click Update. If Update is not enabled, check the box for Force recalculate and the Update button will activate.
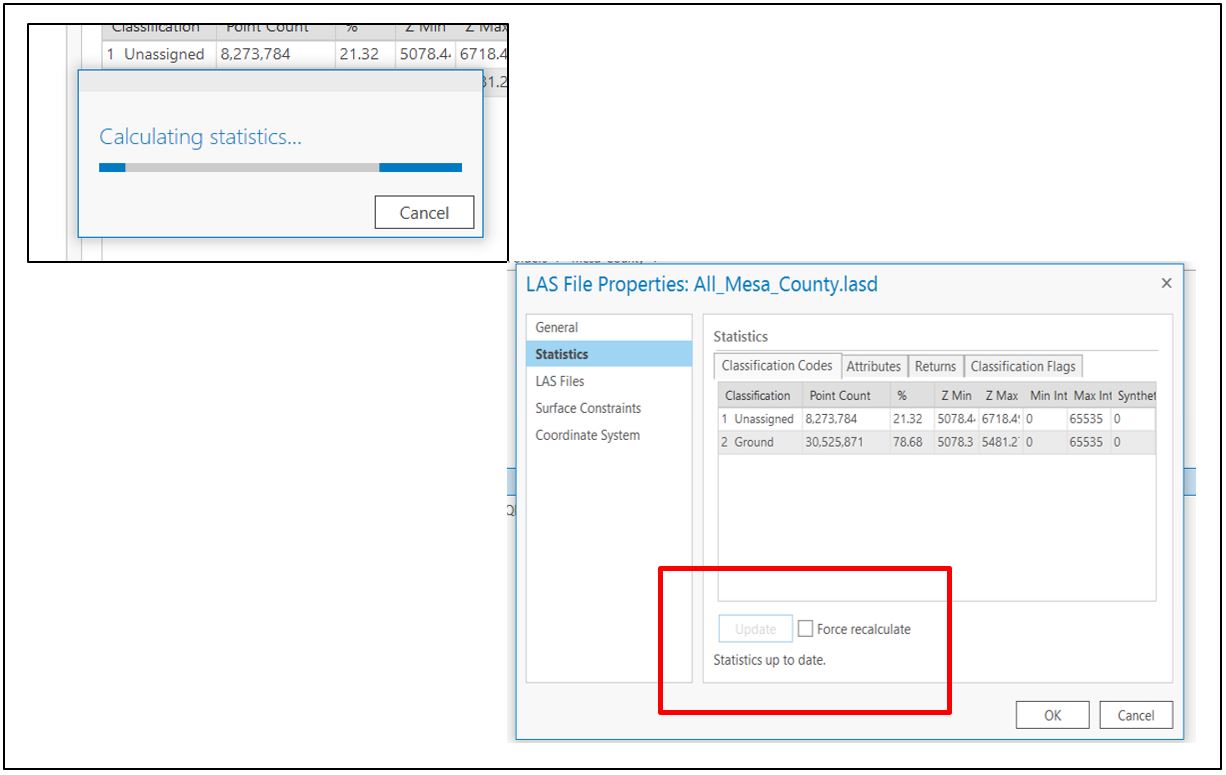
A Calculating Statistics progress bar opens. Once the update finishes, note the message at the bottom of the Statistics pane: Statistics up to date. (Figure 14.12).
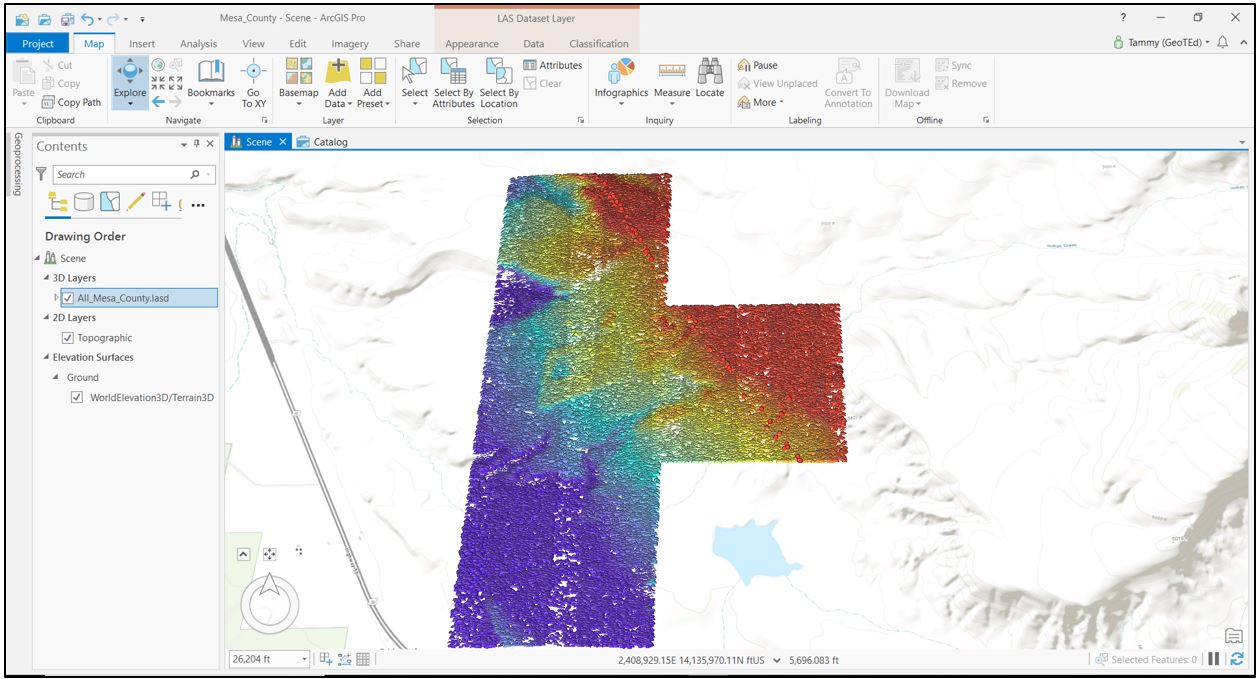
Now, go to the Scene tab (Figure 14.13).
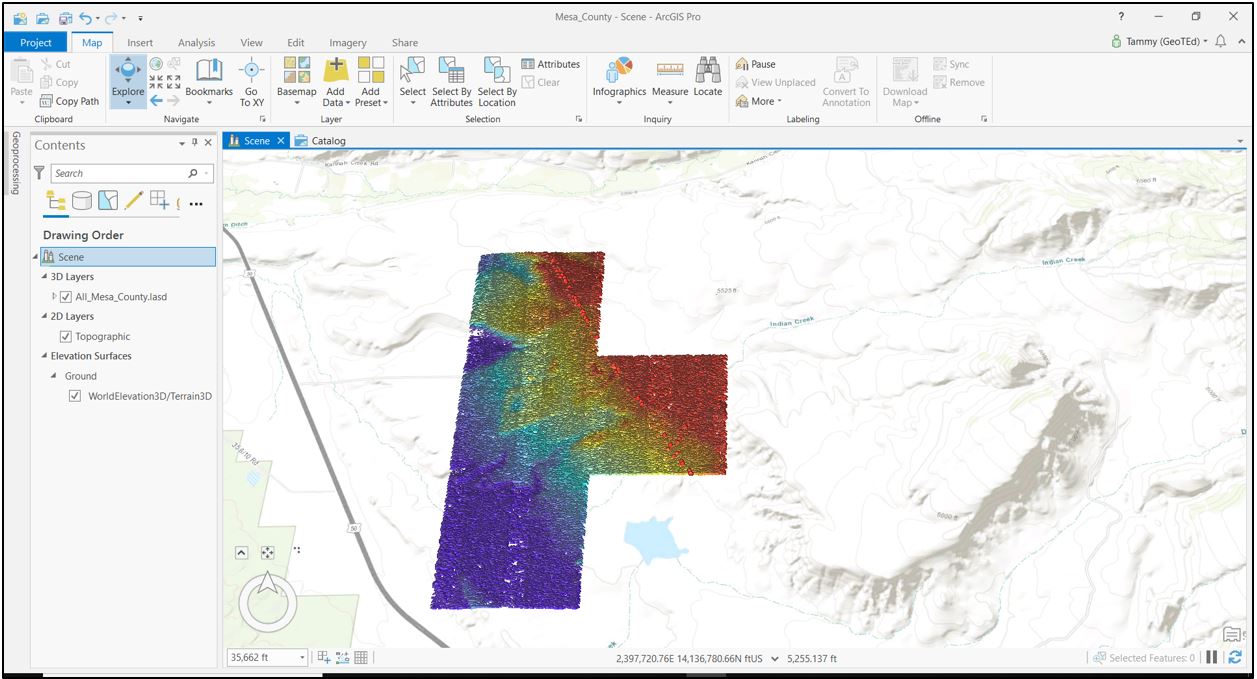
The .lasd dataset should have the additional .las tile (Figures 14.14 and 14.15).
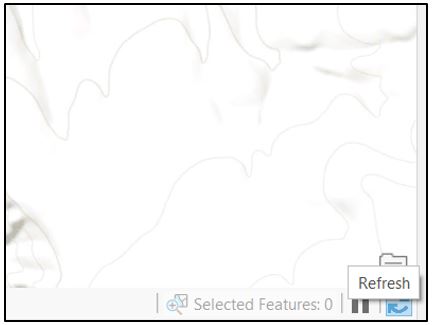
If the data does not display the update, click Refresh on the status bar in the bottom right corner of ArcGIS Pro® (Figure 14.16).
If it still does not update the display, right-click the file name and remove it. (Figure 14.17).
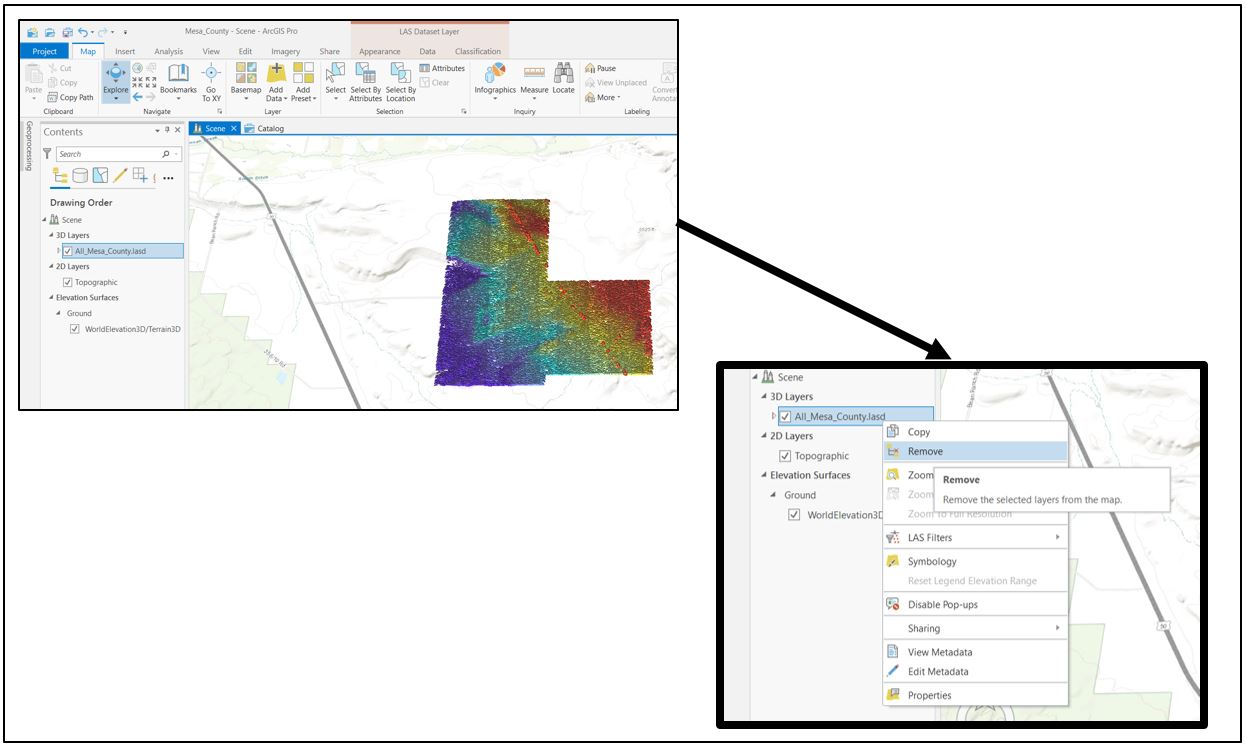
Then add it back (Figure 14.18). The data display should now be updated.
Using Geoprocessing Tools to add a new tile.
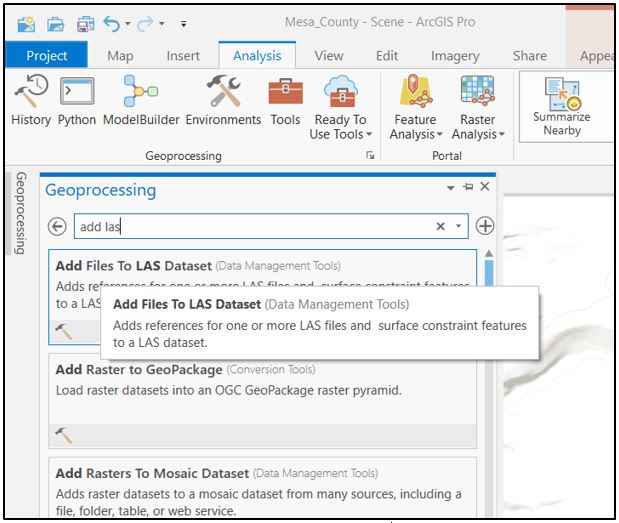
Select the Analysis tab, click on Tools and search for “Add Files to LAS Dataset“ (Figure 14.19).
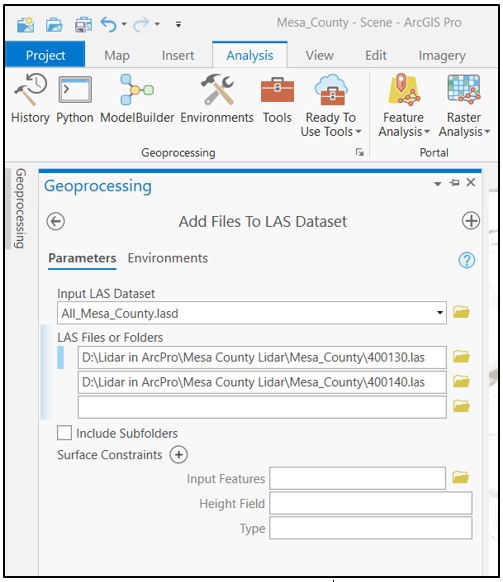
Open the tool Add Files to LAS Dataset (Figure 14.20).
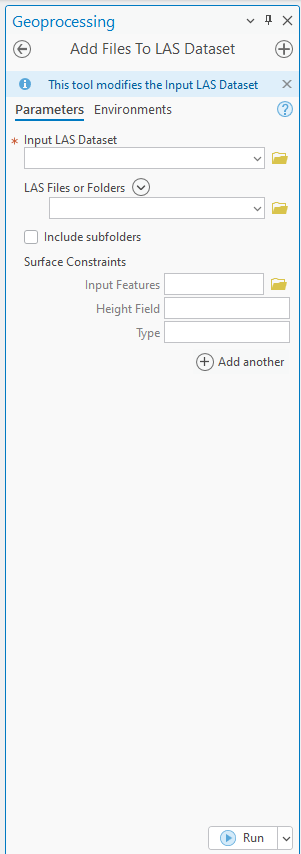
Complete the tool as shown in Figure 14.21. Using the down arrow at the end of the line, choose the Input LAS Dataset (the one with the 4 tiles, in this case All_Mesa_County.lasd), then under LAS Files or Folders, navigate to and select each of the additional tiles to add (400130 and 400140). Leave the other items blank—Surface Constraints are discussed in the final two chapters. Click Run.
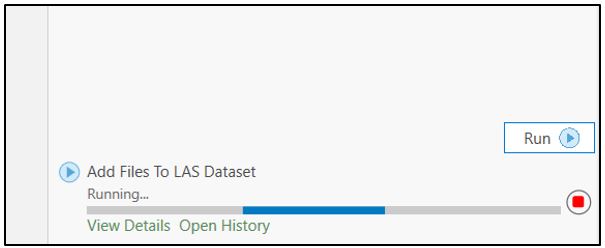
As with all geoprocessing tools, a status/progress bar runs at the bottom (Figure 14.22).
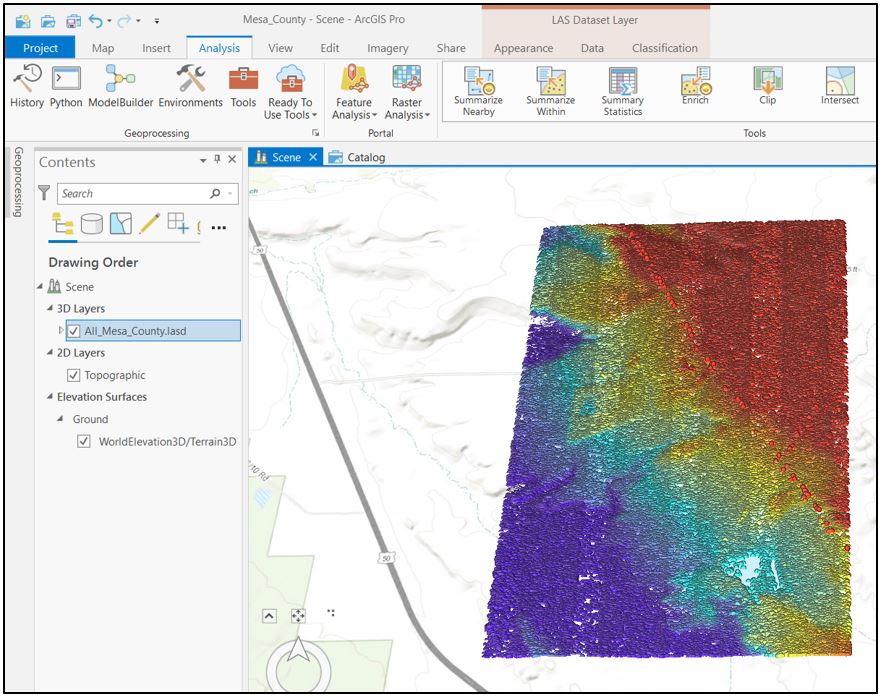
Once the tool finishes, the .lasd dataset is updated and displays all six tiles as one dataset (Figure 14.23).
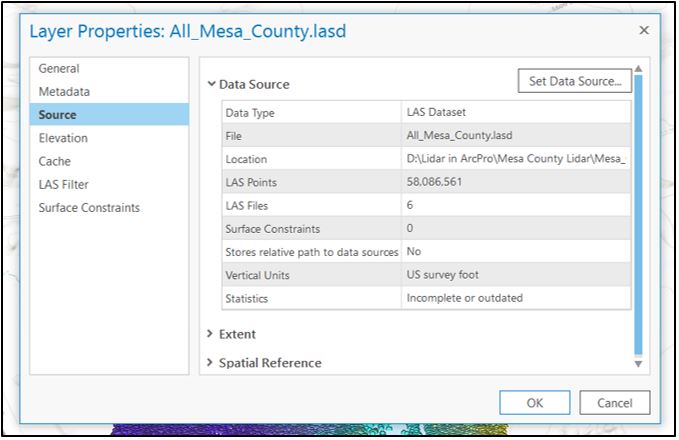
Right-click the .lasd dataset in Contents and go to Properties > Source. Note the message under Statistics—Incomplete or outdated (Figure 14.24). Every time the dataset is changed, either adding or removing tiles, Statistics must be updated.
Statistics can be updated in multiple ways.
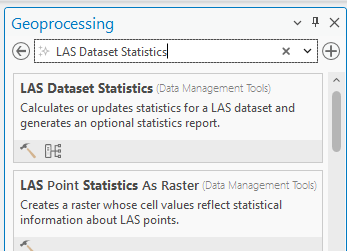
Go to the Analysis tab and click on Toolboxes. Under the Find Tools type LAS Dataset Statistics (Figure 14.25).
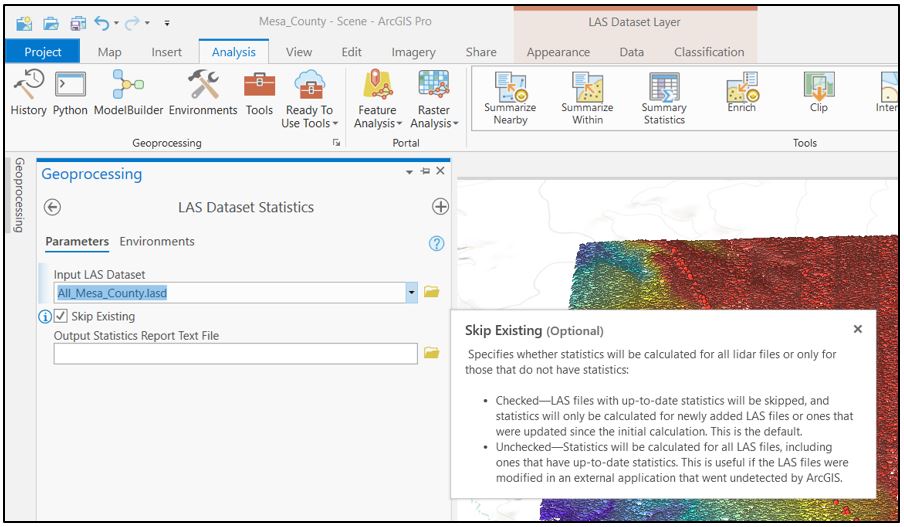
Open the tool and add the Mesa County dataset that has all six tiles. Leave all other settings default (Figure 14.26).
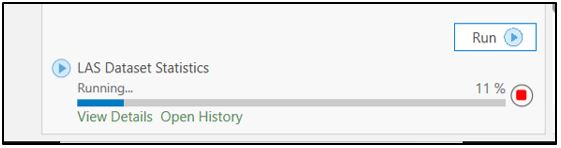
Choose Run (Figure 14.27).
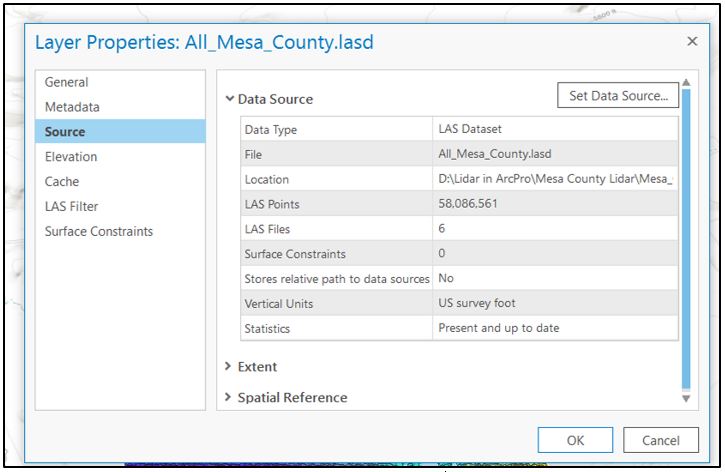
When the tool finishes, right-click on the file name and go to Properties > Source > Statistics. They are Present and up to date (Figure 14.28).
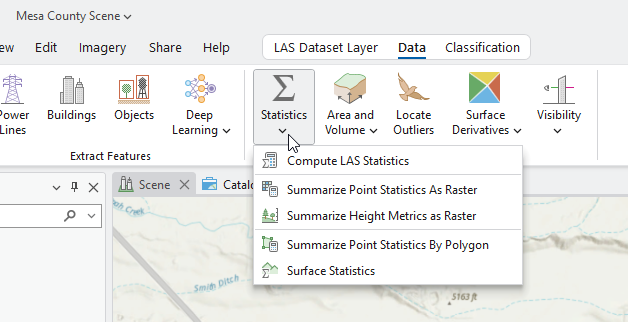
The other way to update Statistics is to click on the Data tab for the LAS Dataset Layer (Figure 14.29). Drop down the Statistics arrow and choose Compute LAS Statistics. The complete process is not demonstrated here since statistics is up to date.
Removing tiles from a LAS dataset can be accomplished in two ways. This chapter will not demonstrate the process but will identify the two methods. The process to remove tiles is the same as adding tiles.
First using Catalog View (Figure 14.31), right-click on the .lasd file name, go to Properties > LAS Files. Selecting the tile to be removed activates the Remove button.
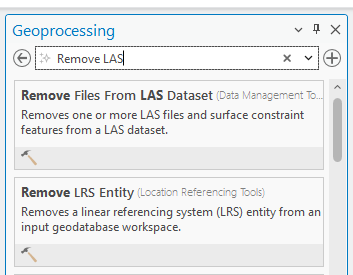
Tiles can also be removed using the Remove Files from LAS Dataset geoprocessing tool (Figure 14.32).
Feel free to remove and add tiles to the Mesa County LAS dataset to practice the processes. But don’t forget, Statistics must be recalculated every time a new tile is added or removed.
This concludes the chapter. Up to this point, this book has provided basic information on using ArcGIS Pro®, and detailed information on finding, downloading and adding individual lidar tiles to ArcGIS Pro®. Chapter 13. Combining Tiles into One .lasd Dataset demonstrated creating a single .lasd dataset from multiple tiles and this chapter demonstrated adding tiles to and removing tiles from an existing LAS dataset.
Subsequent chapters will review display settings, symbology, classifying points in a point cloud and surface constraints.
