Chapter 11. Exploring LAS Dataset Properties
The prior chapter demonstrated how to create and navigate a 2D Map Project and a 3D Local Scene with lidar data. That chapter provided instructions on adding individual tiles to each type of project. This chapter will explore lidar dataset properties. What are dataset properties? Dataset properties are details about the dataset, including the metadata, point count, coordinate system information, and other details.
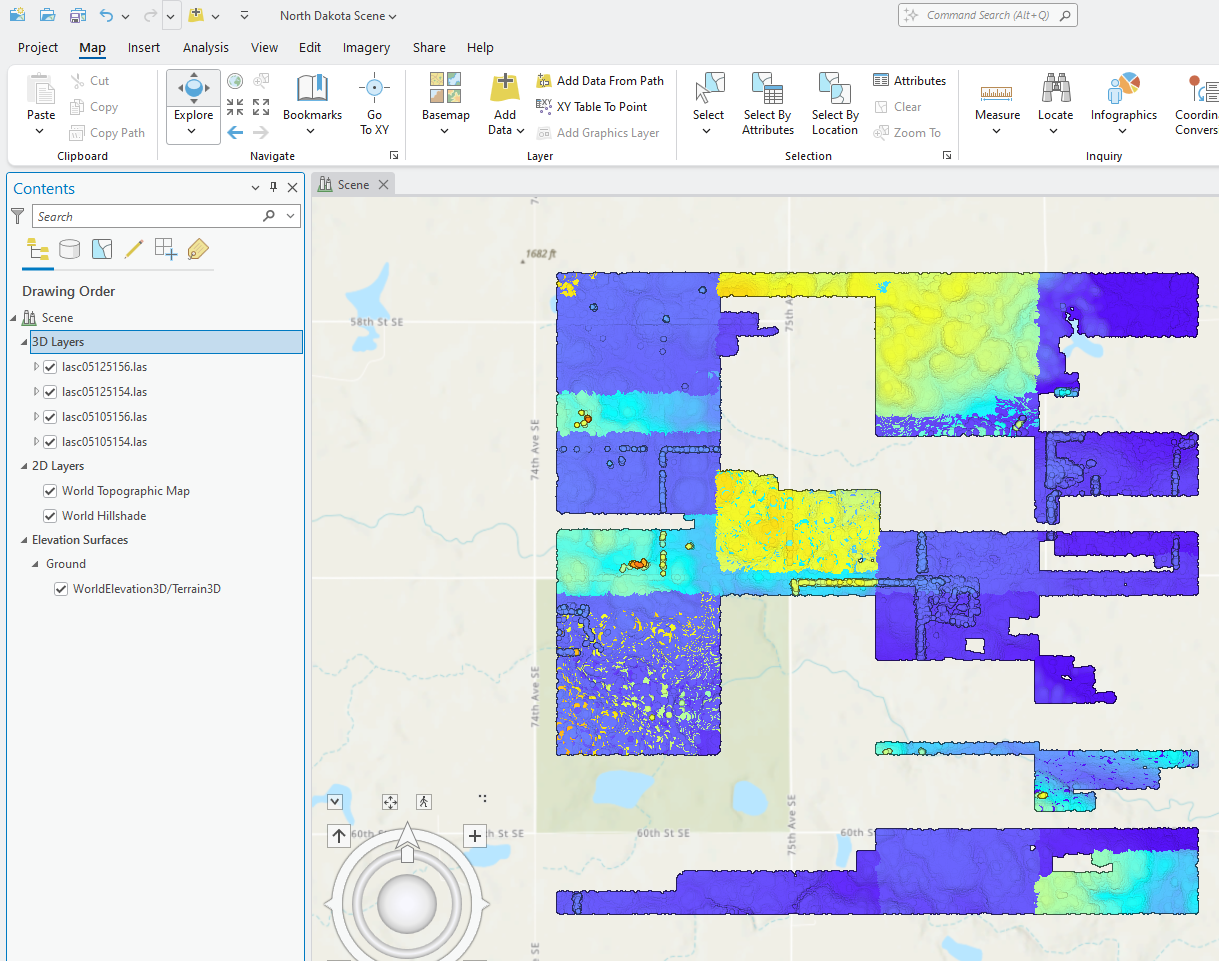
Create a new ArcGIS Pro® Local Scene and add the four lidar tiles from North Dakota[1]. These tiles are shown in Figure 11.1.
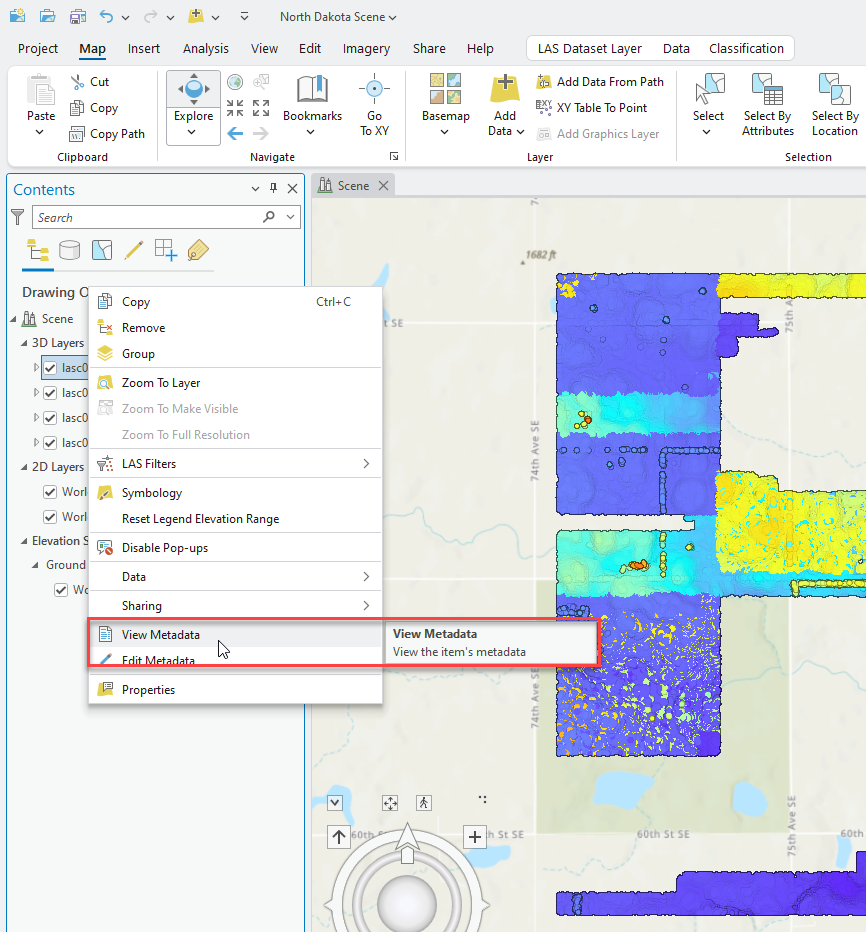
Right-click the name of the first tile in Contents and choose View Metadata (Figure 11.2).
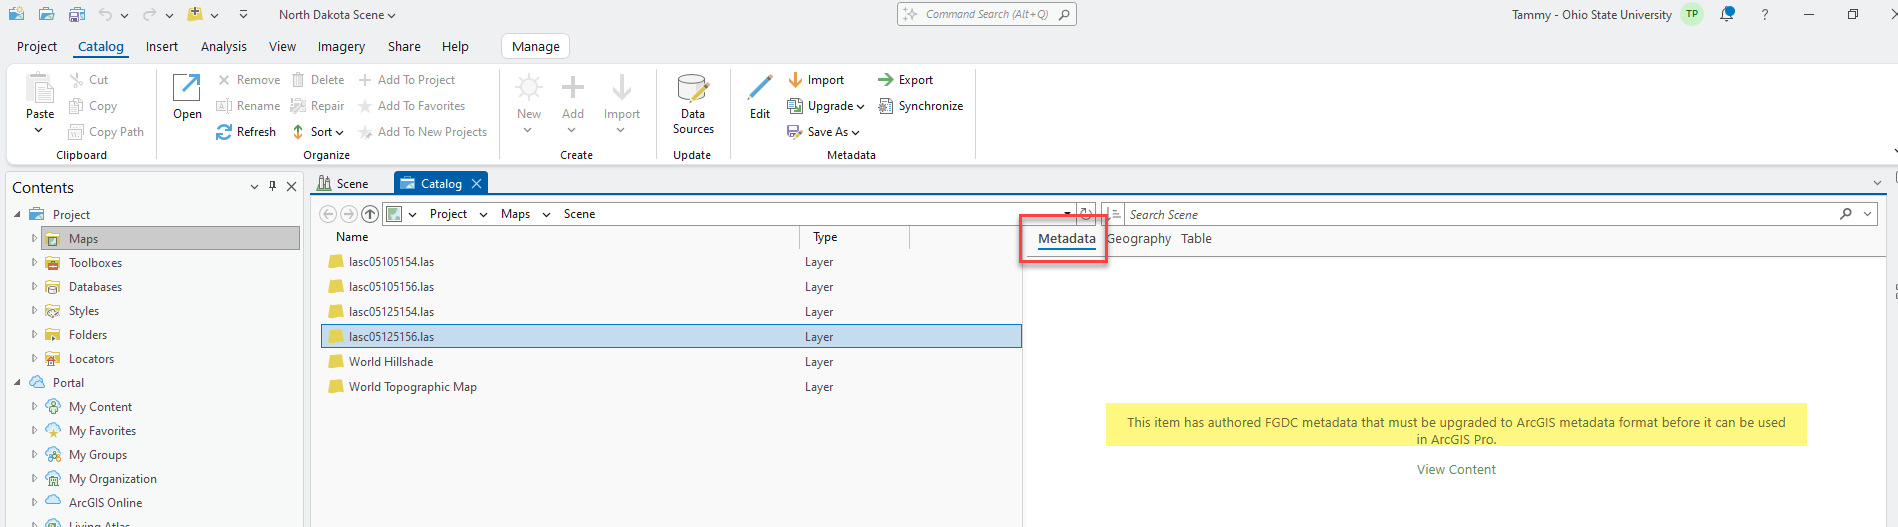
Catalog View opens (Figure 11.3) with the tile highlighted. The word Metadata is active (underlined, see red box), but a message displays that these metadata are FGDC metadata that must be upgraded to ArcGIS Metadata format before they can be used in ArcGIS Pro (yellow highlighting)[2]. Upgrading is not necessary to view the metadata. Select the green View Content text.
A browser window opens to display the metadata for the selected tile (Figure 11.4). This is the same metadata that Chapter 7. Locating Lidar Data and the section on state level data explored.
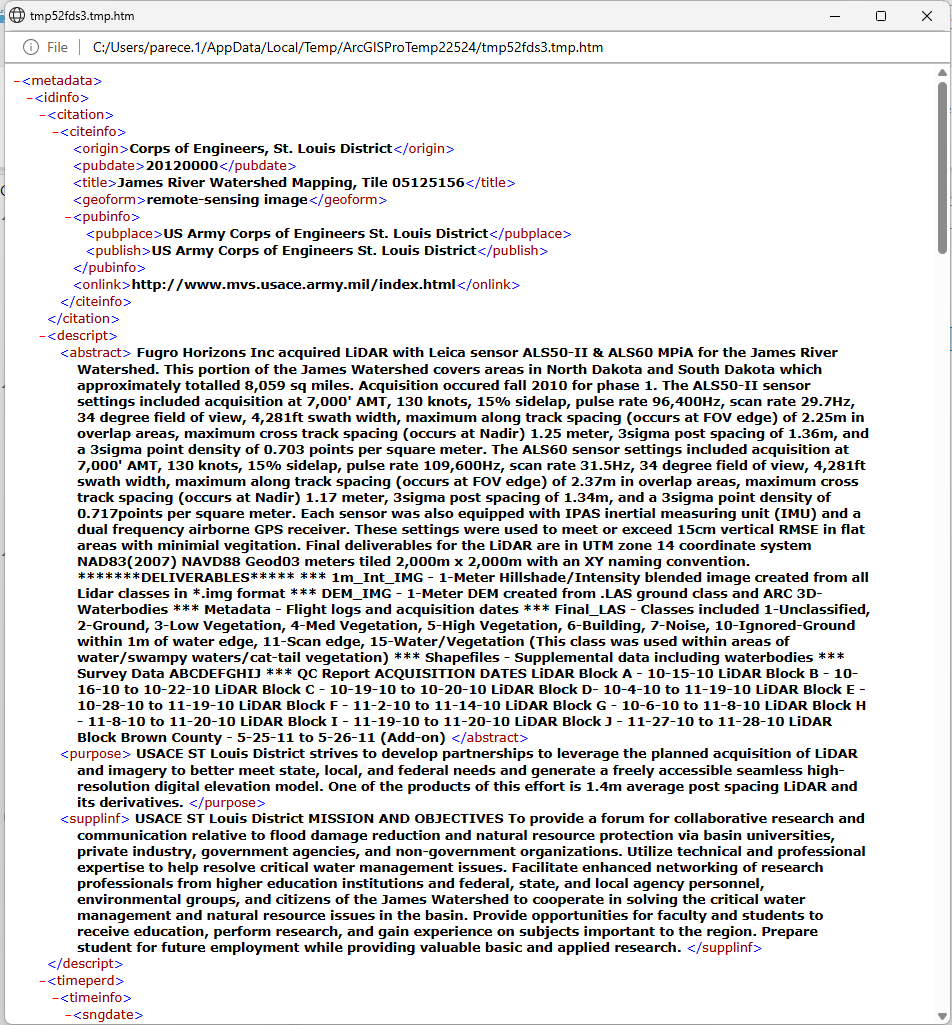
Review the metadata, then close the metadata browser window.
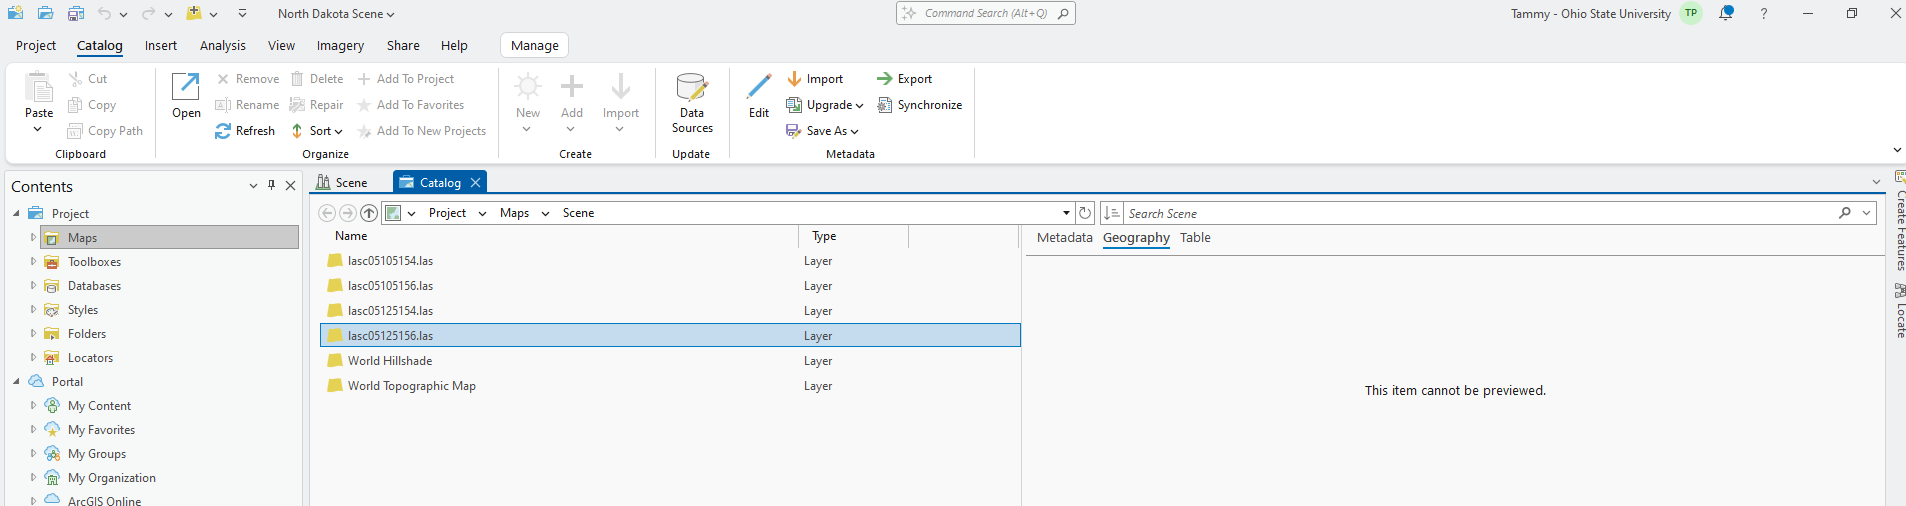
Now select Geography (underlined with blue on the right side of Figure 11.5). This item cannot be previewed displays in the Geography viewer. Lidar point clouds cannot be viewed within Catalog. However, when using geoprocessing tools to convert lidar point clouds to raster and layer files, Geography will be available.
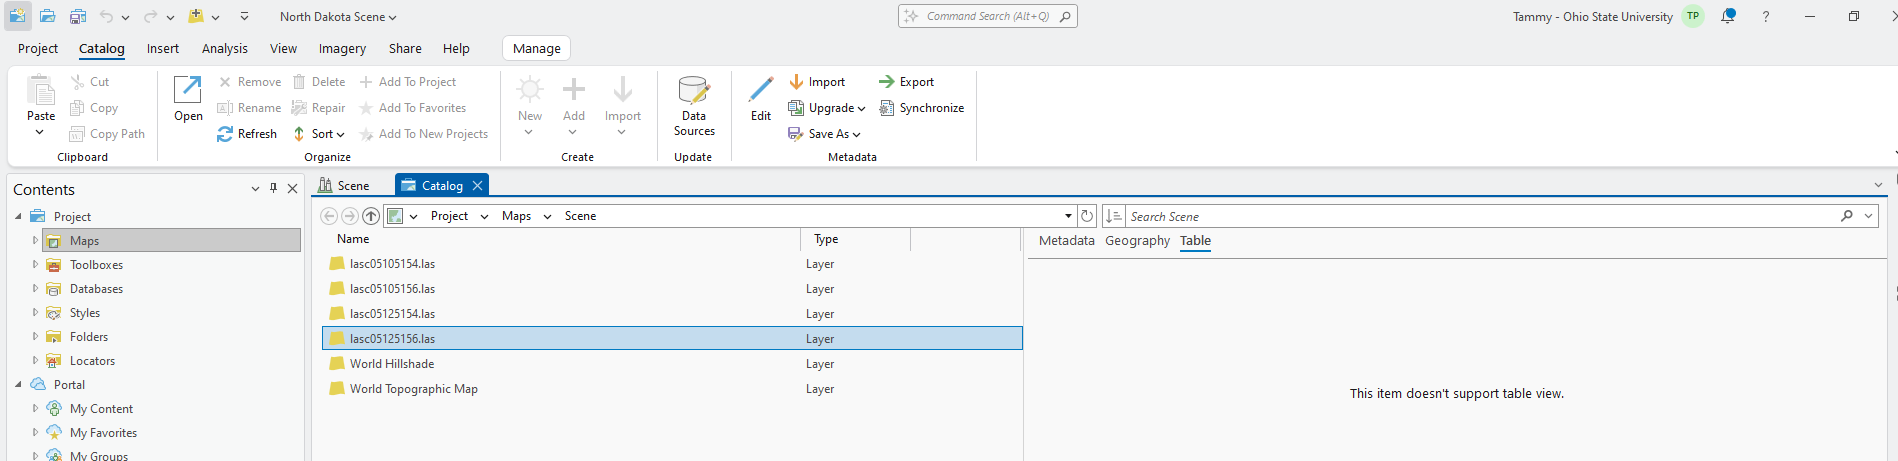
Select Table (underlined with blue in Figure 11.6). This item doesn’t support table view. This tab is for attribute tables. Lidar point clouds do not have attribute tables, but some rasters and all vectors do.
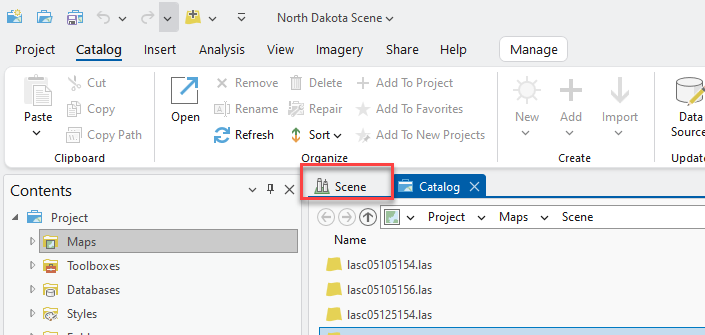
To return to the Scene, click on the Scene tab (red box in Figure 11.7).
If the metadata needs editing, right-click the layer’s name and choose Edit Metadata (Figure 11.8).

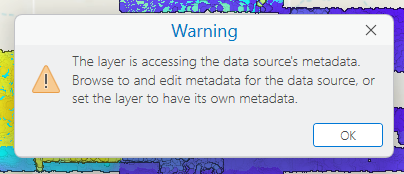
In this case, a Warning message is displayed (Figure 11.9). The metadata must be converted to ArcGIS format (as noted above) to edit it. Close the warning.
While this chapter does not demonstrate editing or adding metadata, completing metadata is extremely important when processing or creating new files.
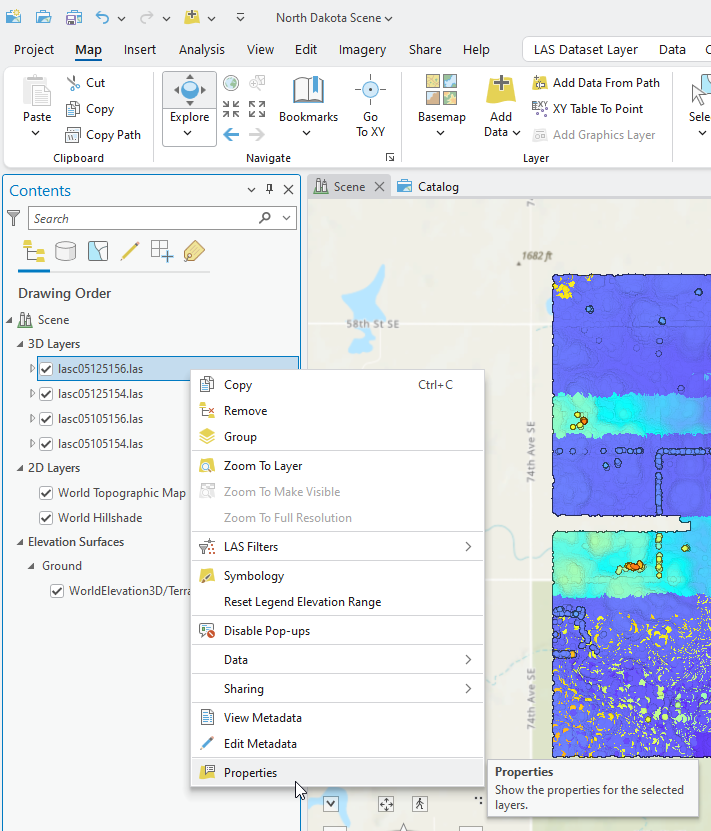
Next, right-click on the first layer again and choose Properties (Figure 11.10).
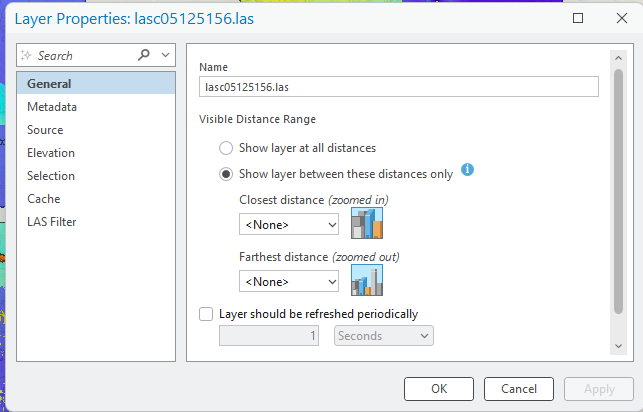
The first link in the Layer Properties list is General. This link provides the layer name and information about the visibility of the point cloud. (Figure 11.11) These settings will be discussed in more detail in Chapter 15 – Lidar Display Settings.
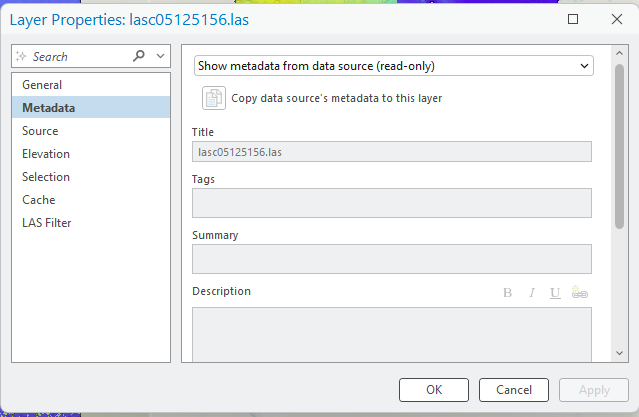
Select Metadata. Information is limited because it was not completed by the producer of the dataset (Figure 11.12).
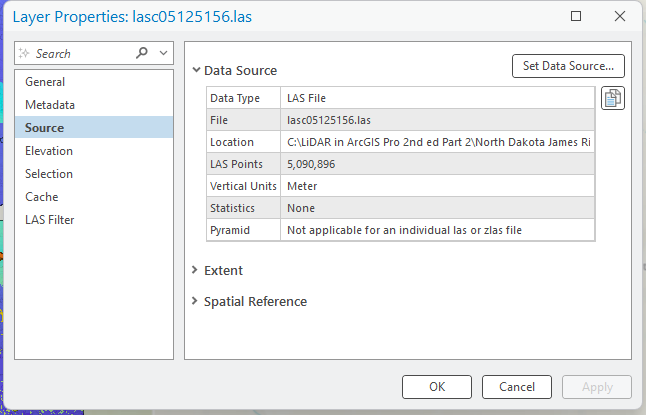
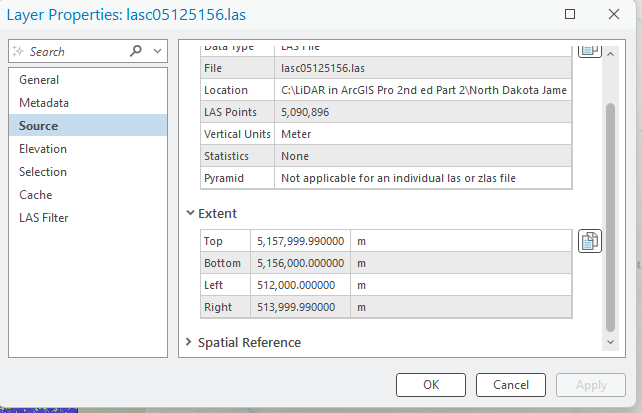
Select Source. As seen in Figure 11.13, most of the information is being populated from the file’s metadata. Under Data Source, Location is the location on the computer where the file is stored. LAS Points is the total number of points in the point cloud for the selected tile. Vertical Units, the height of each point above mean sea level, is in meters, and Statistics are None. Statistics will be introduced, calculated, and discussed in more detail in subsequent chapters. Pyramid is not applicable. Pyramids are useful for uploading and displaying raster data.
Within Source, select Extent to expand the information. Extent provides the coordinates for the Top (northern most location of the point cloud), Bottom (southern), Left (west), and Right (east). In this example, coordinate units are meters (m). (Figure 11.14)
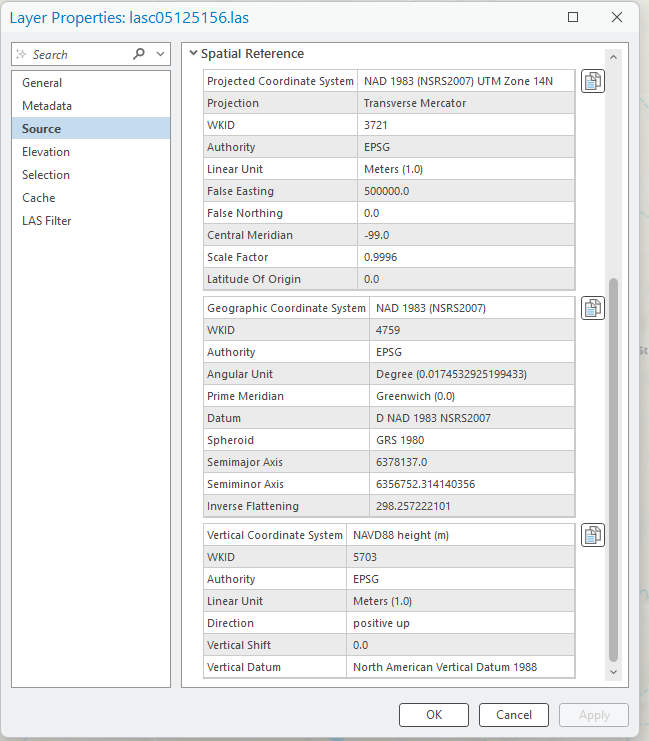
Scrolling down, expand Spatial Reference to reveal its information (Figure 11.15).
Spatial Reference provides the most detailed information, including, for example, the Projected Coordinate System, the linear, angular and vertical units. All this information is extremely important to know when completing geoprocessing operations on this dataset or in conjunction with other datasets.
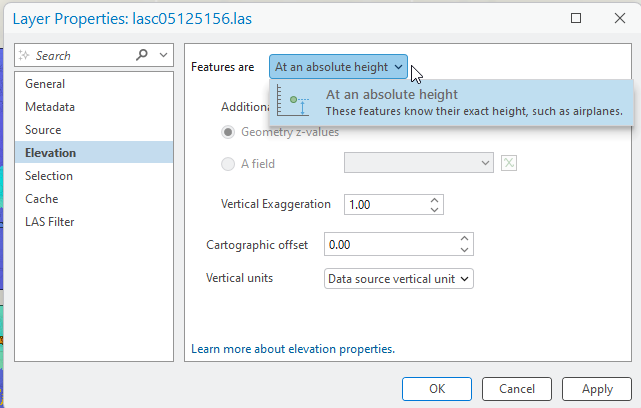
Next select Elevation (Figure 11.16). The information displayed here is gleaned from the metadata. Features are “At an absolute height – these features know their exact height.” The height is the elevation from mean sea level. If a dataset has information in this box other than that which is displayed here, the reliability of the height of each point could be in question.
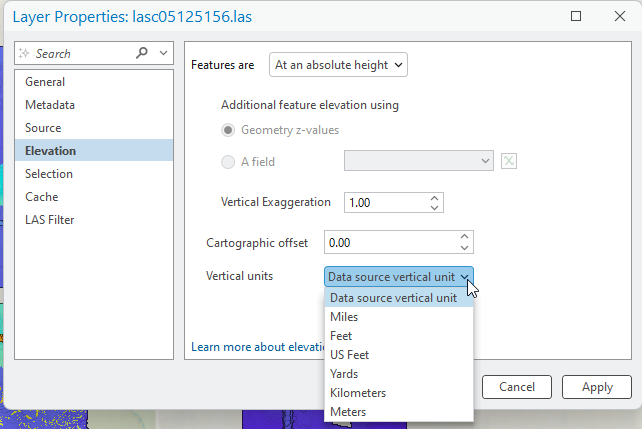
Next, Vertical units—the height data are in meters because that is its source, but the display can be changed on the fly by choosing another unit here (Figure 11.17).
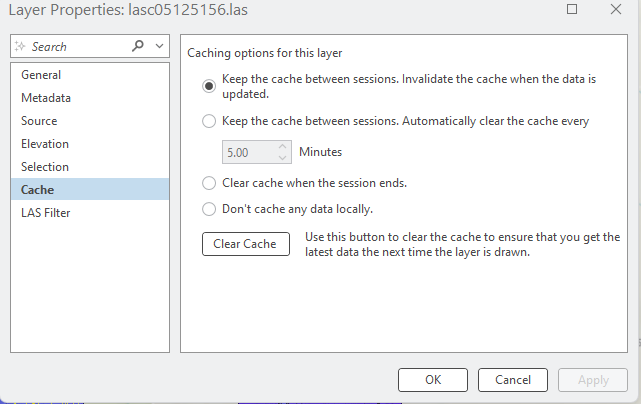
Now choose Cache (Figure 11.18). Caching helps improve the performance of ArcGIS Pro® with large datasets. The default setting usually works quite well. However, for more information about changing the cache settings, please see: https://pro.arcgis.com/en/pro-app/latest/help/mapping/layer-properties/how-caching-works.htm.
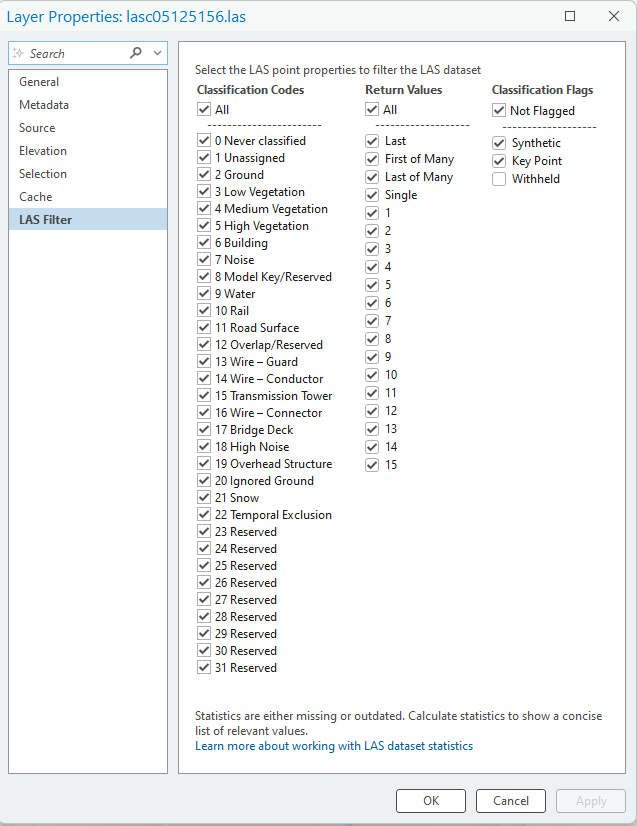
Now, look at the final menu item, LAS Filter (Figure 11.18). This area provides information about what type of classifications have already been accomplished for a point cloud, and what points have been chosen to be displayed in the project/scene. For this dataset, All points are displayed.
For these North Dakota lidar tiles, a considerable amount of classification has already been accomplished. The first column lists more than 20 different Classification Codes (unassigned, ground, low vegetation, etc.).
The second column is Return Values. This shows that the maximum number of returns per pulse was 15 (because there are 15 different return values). Checked boxes indicate the points that are being displayed in the map viewer. In addition to a numbered return, a return can also be Last, First of Many, Last of Many and Single. A point can be a First of Many return and return number 1, or a Single return and return number 1.
The final column is Classification Flags. These are unique pieces of information to a lidar dataset and to understand the meanings of the flags the comprehensive metadata must be reviewed.
The importance of changing the points that are displayed will be covered in Chapter 16 – Lidar Symbology.
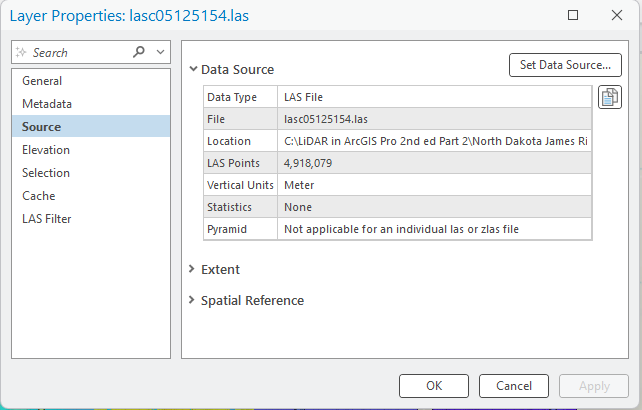
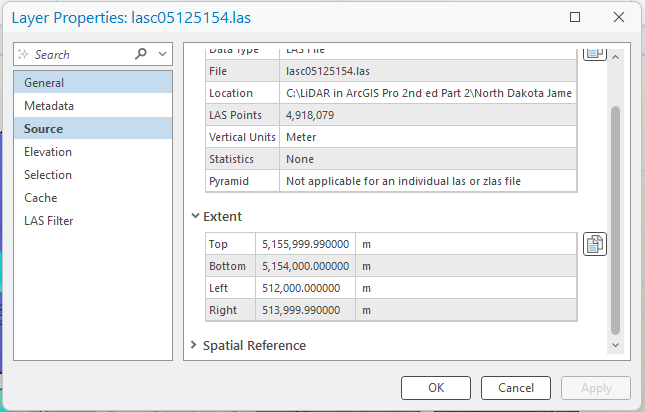
Close the Layer Properties for this tile and open it for another one. Figures 11.20 and 11.21 display two screenshots of the Source menu item for the file 05125154. Specifically, please note the total number of LAS Points is less than the last tile (4,918,079 for file no. 05125154 in Figure 11.20 and 5,090,896 for file no. 05125156 in Figure 11.13).
Compare the Extent in Figures 11.14 and 11.21. The Left and Right values are the same but the Top and Bottom values are different. Why are the Left and Right values the same? Remember the tiles are adjacent so if they share a north or south border, their east and west extents are the same.
This ends the review of LAS Dataset Properties.
The next few chapters review the new toolbars and associated tabs that display when las datasets are added to ArcGIS Pro® (Figure 11.21).
- Downloaded in Chapter 7. Locating Lidar Data ↵
- Note: Federal Geographic Data Committee has metadata standards for geospatial data. ↵
